
Abstract
In the recent past some studies have been reported on the compressive, tensile, and flexural properties of 3D-printed polyvinylidene fluoride (PVDF) composite-based intramedullary (IM) pins for canines. However, in actual working conditions (due to trauma or accident), the IM pin may also be under torsional loading conditions. But hitherto little has been testified on the torsional behavior of PVDF composite-based IM pins. This study highlights the torsional behavior at 1 rpm (from 0 to 800° of the angle of twist/rotation) of PVDF composite (PVDF-90%; hydroxyapatite (HAp8%); chitosan (CS2%)) based IM pin fabricated by fused filament fabrication (FFF) process. The study suggests that better torsional properties were obtained for 3D printed samples prepared at nozzle temperature (NT) of 235°C, raster angle (RA) of 45°, and printing speed (PS) of 60 mm/s respectively resulting in a maximum torque of 3.44 Nm at the angle of twist of 800° (as per ASTM A938). The morphological analysis based on scanning electron microscopy (SEM) supports the results of the fractured surface (at cross section) and along the lateral axis.
Keywords
Introduction
In the healthcare sector, 3D printing processes have been established as flexible and essential technologies. 1 These processes are considered significant tools for patients, researchers, and healthcare professionals due to their capacity to enable customization, enhance patient outcomes, and promote medical innovation. 2 As technology develops, 3D printing is anticipated to become more and more important in determining the advancement in orthopedic applications. 3 The technological complexity of 3D printing in medicine spans material science, precise engineering, software development, quality assurance, and legal compliance. 4 These factors combine to make it possible to create cutting-edge, highly tailored medical solutions that improve patient care, boost research, and expand the potential of contemporary healthcare. 5
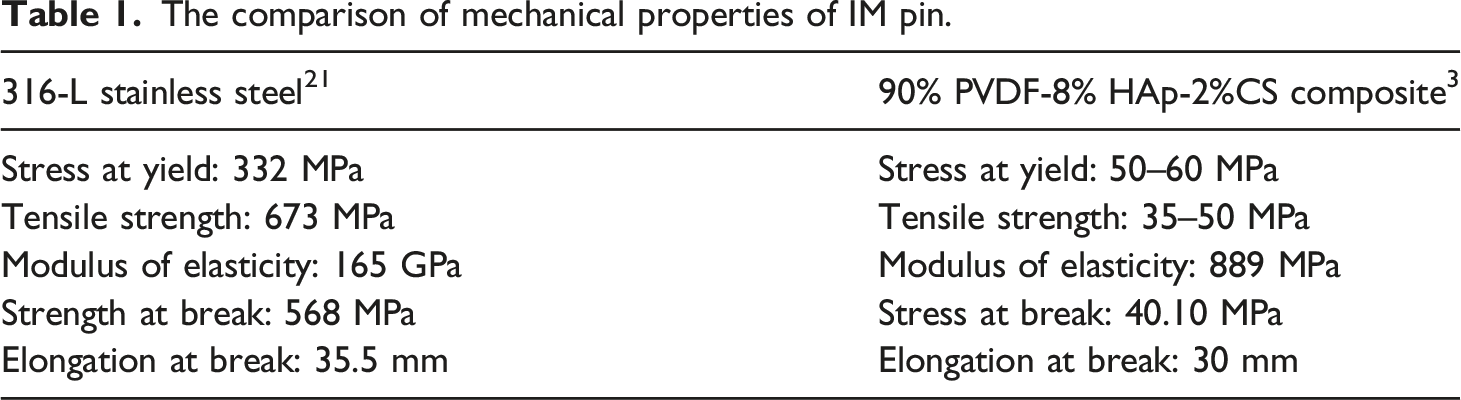
PVDF composites are considered a wonderful material option for orthopedic implant applications. 6 PVDF-HAp-CS is renowned for its superior biocompatibility and for producing durable composites. 7 These PVDF composites have a good mechanical strength-to-flexibility ratio that makes them perfect for orthopedic implants such as IM pins, plates, and screws. They may be precisely customized to meet the demands of each patient, made possible by the composite composition and 3D printing technology. 8 Additionally, because of their biocompatibility, PVDF composites can enhance bone integration while lowering the likelihood of rejection or unfavorable responses. Excellent mechanical qualities, such as high tensile strength, flexural modulus, and fatigue resistance, are present in these composites and are essential for load-bearing implants.9,10 By carefully regulating the composite formulation, it is possible to further improve the structural integrity of these materials and incorporate reinforcements like carbon fibers or hydroxyapatite nanoparticles. The rigidity and toughness of the composite are optimized by this specifically designed composition, enabling it to endure the rigorous mechanical conditions found inside the human body. PVDF-HAp-CS composites can be printed using 3D technology, and more complex, patient-specific implant designs may be created, improving the functioning and fit of the implant relative to the bone. 11 Beyond form, customization options include carefully planning internal structures and porosity (meta-structure) to encourage bone ingrowth and, eventually, implant osseointegration. Additionally, PVDF is a good option for implants intended for long-term implantation due to its intrinsic biocompatibility, low immunogenicity, and low inflammatory reaction. 12 PVDF composites are gaining popularity in orthopedics since they not only provide superior mechanical performance but also a physiologically favorable environment for bone repair and integration, making them a top material for orthopedic implants. 13 For 4D printing applications such as smart grippers and smart actuators, the flexural, morphological, and shape-recalled characteristics of polylactic acid (PLA) matrix bridged with PVDF nanofibers combined composite structures have been reported. 14 In one of the recent studies, a peak load of 394.87 N, peak stress of 33.92 MPa, Young’s modulus of 2.606 MPa, and modulus of toughness (MOT) of 0.484 MPa for PVDF composite while tensile loading has been reported. 15 In another study on the PVDF composite the compressive strength was observed as 1.76 MPa.16,17 Some researchers have reported the feasibility of 3D printing a smart energy storage device of PVDF composites with a melt flow index (MFI) of 30 g/(10 min) by following ASTM D 1238 to serve as a feedstock filament for FFF. 18 PVDF-silica composites were prepared via the sol-gel technique by some researchers and mechanical, thermal, morphological and piezoelectric properties have been ascertained for sensor applications in biomedical field. 19
The comparison of mechanical properties of IM pin.
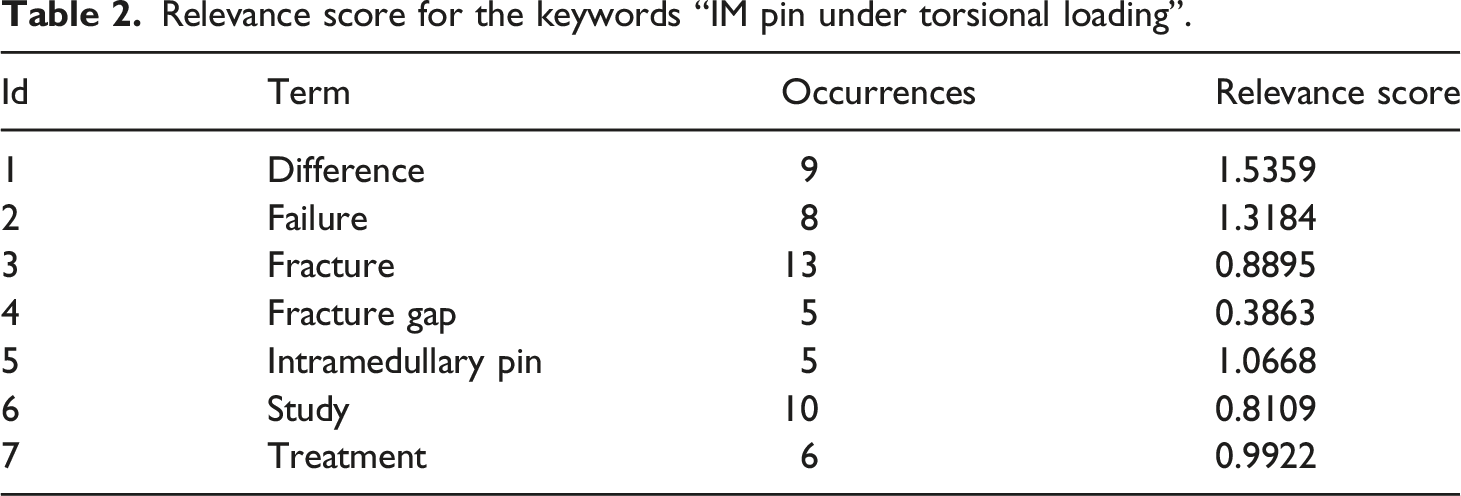
Relevance score for the keywords “IM pin under torsional loading”.
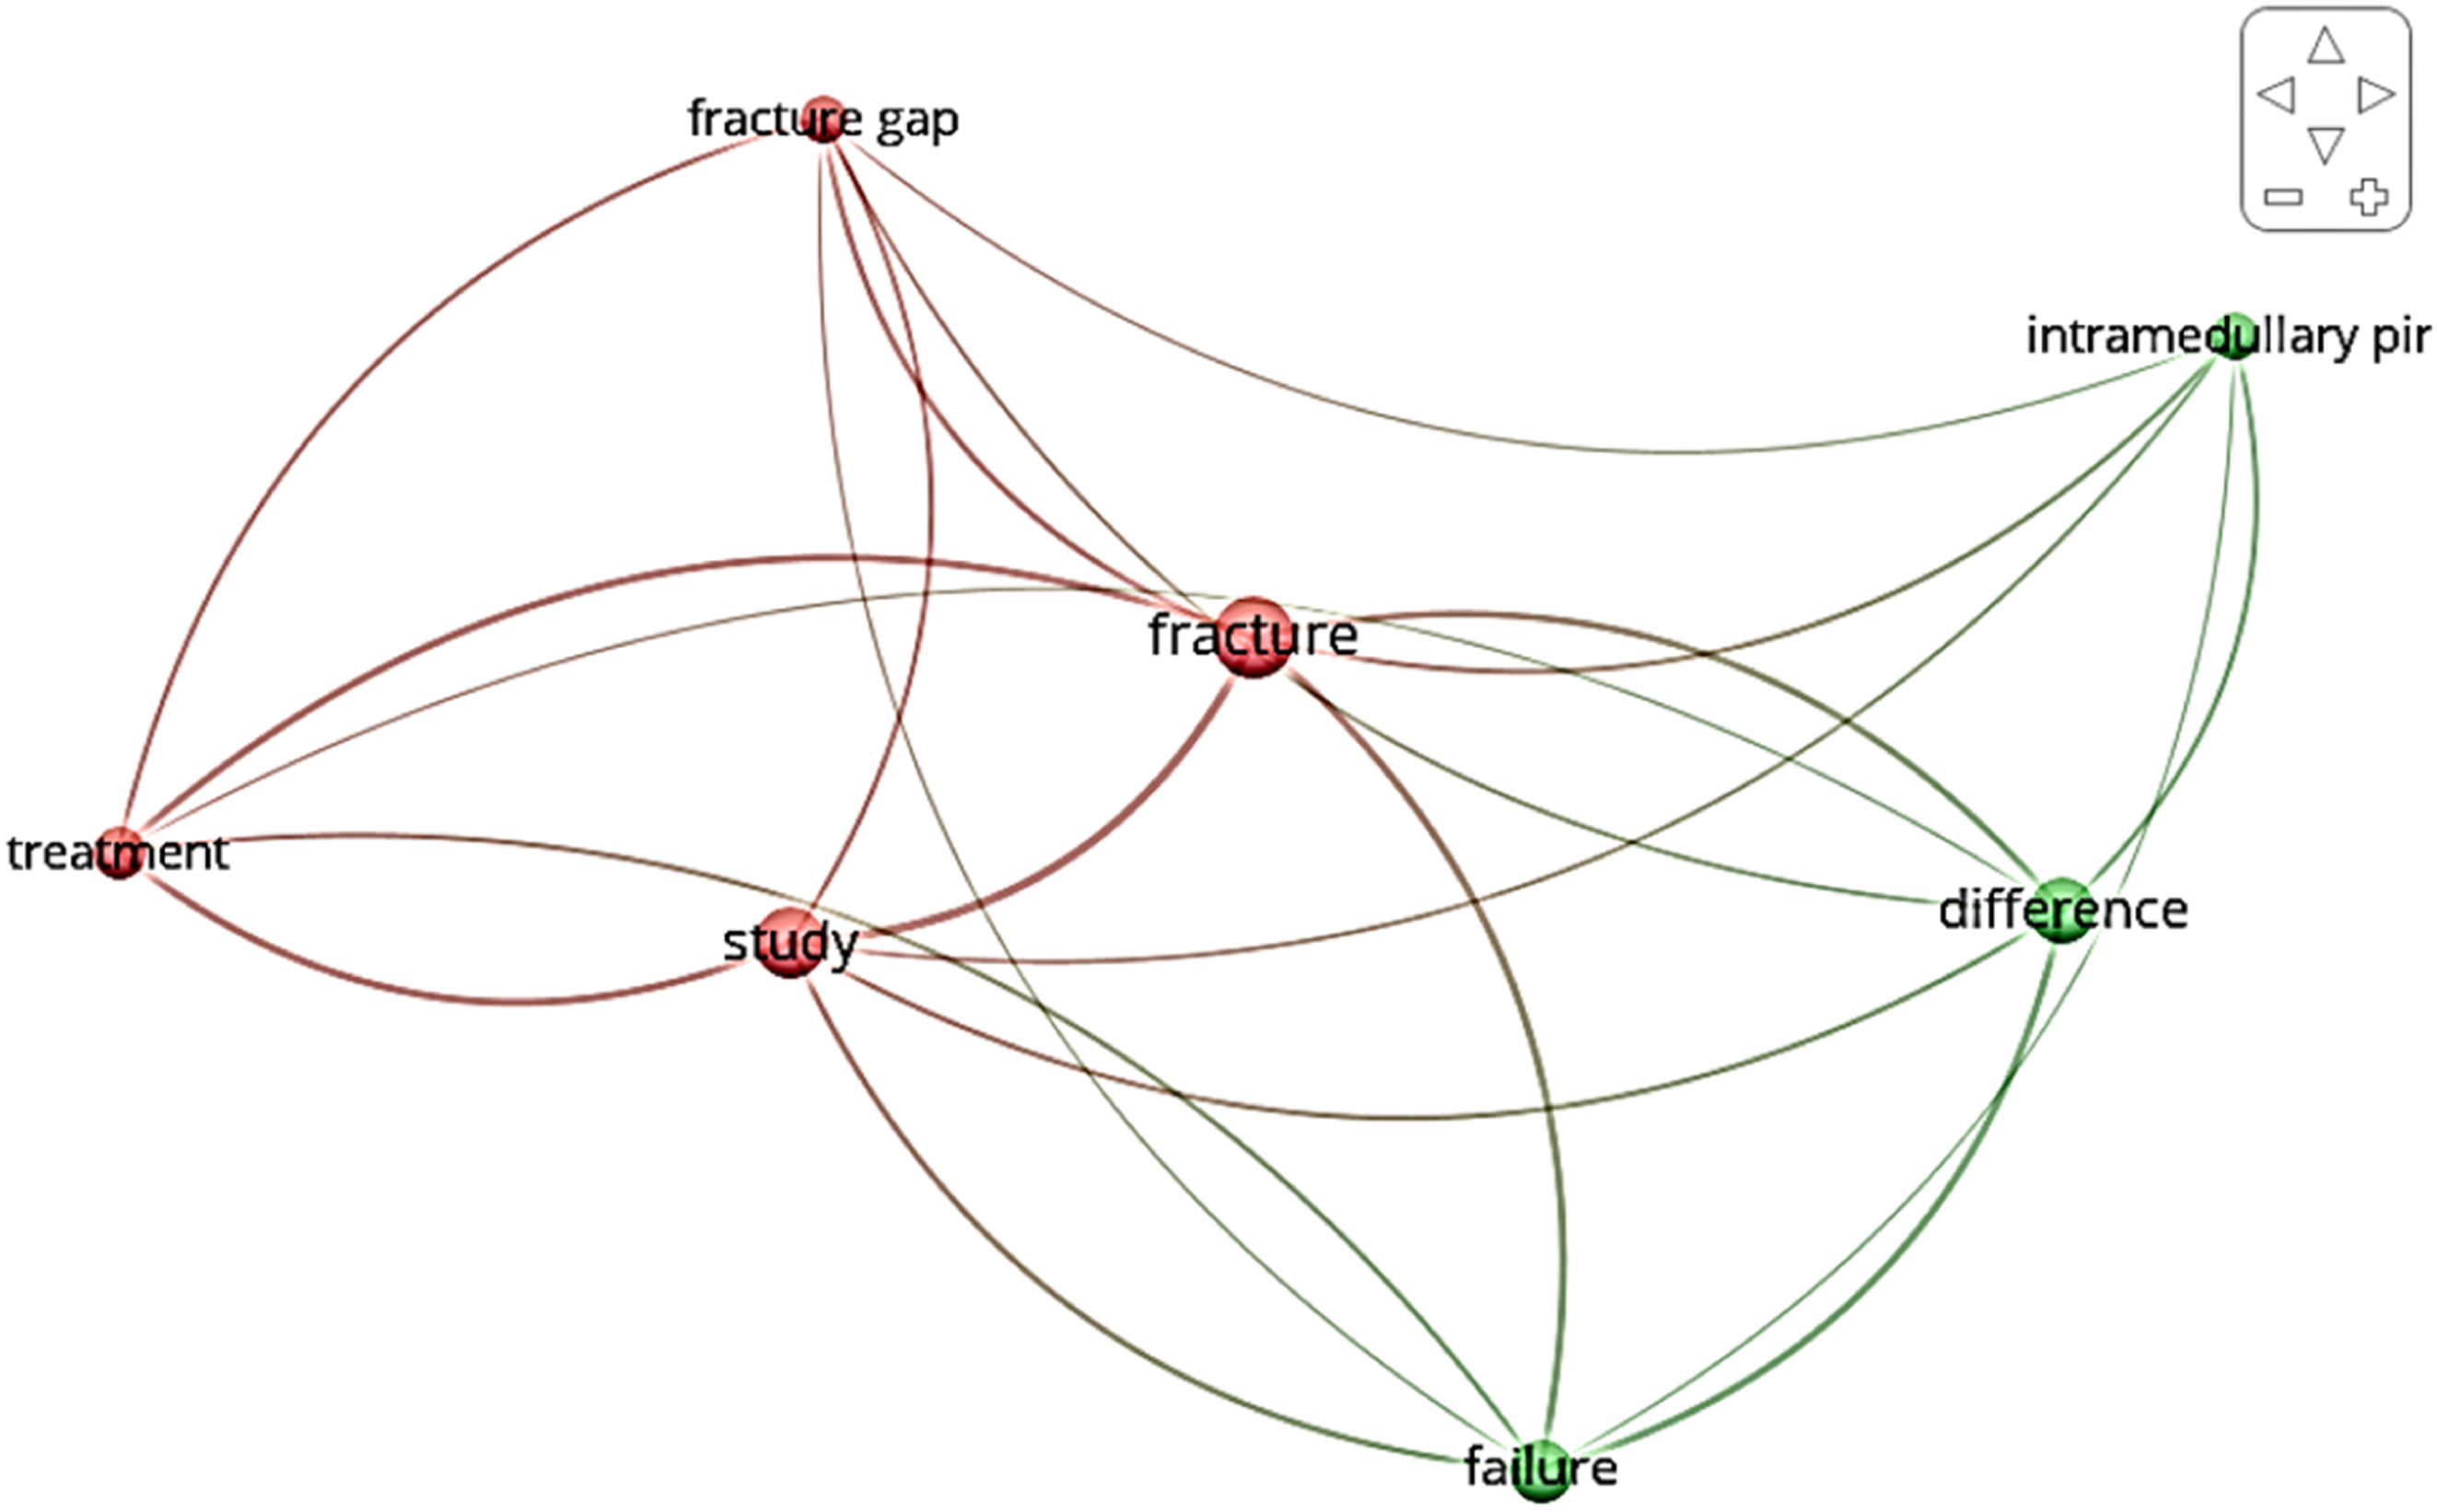
Bibliometric network diagram for the keyword “IM pin under torsional loading.”
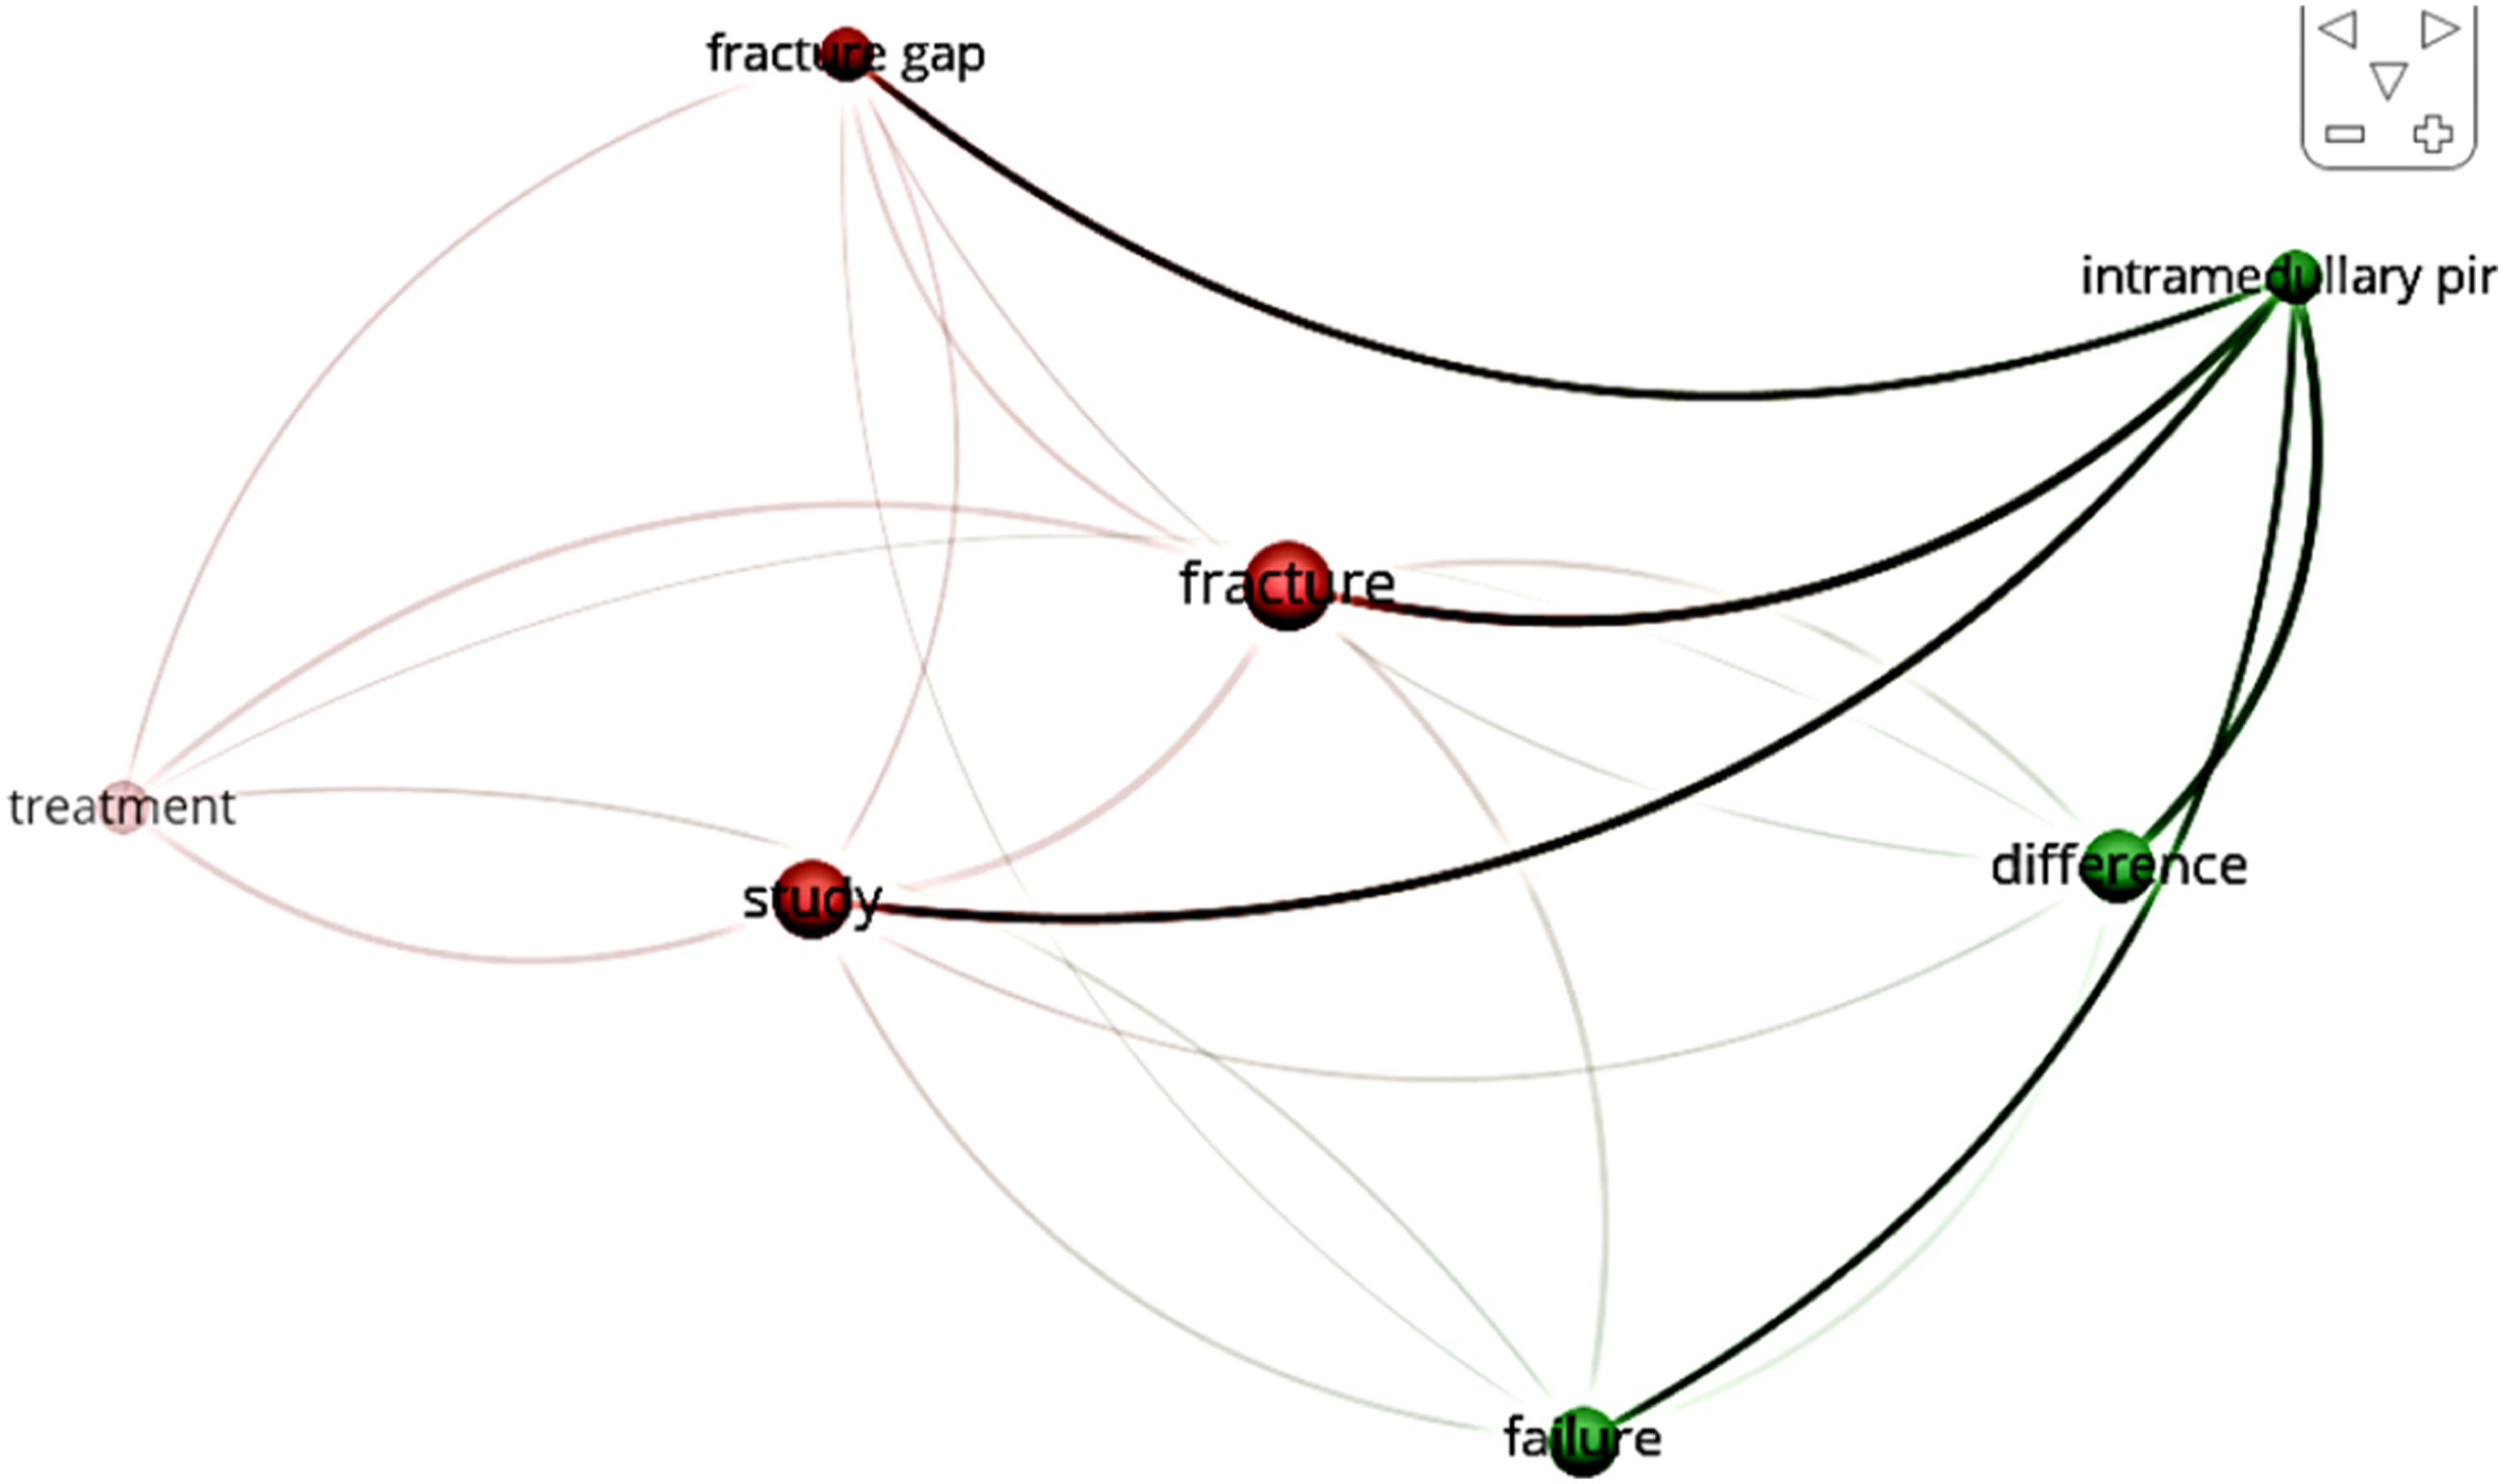
Research gap analysis for the node IM.
Experimentation
The process flow diagram for parametric optimization of FFF under torsional loading is shown in Figure 3. Process flow diagram for best settings of FFF parameters under torsional loading.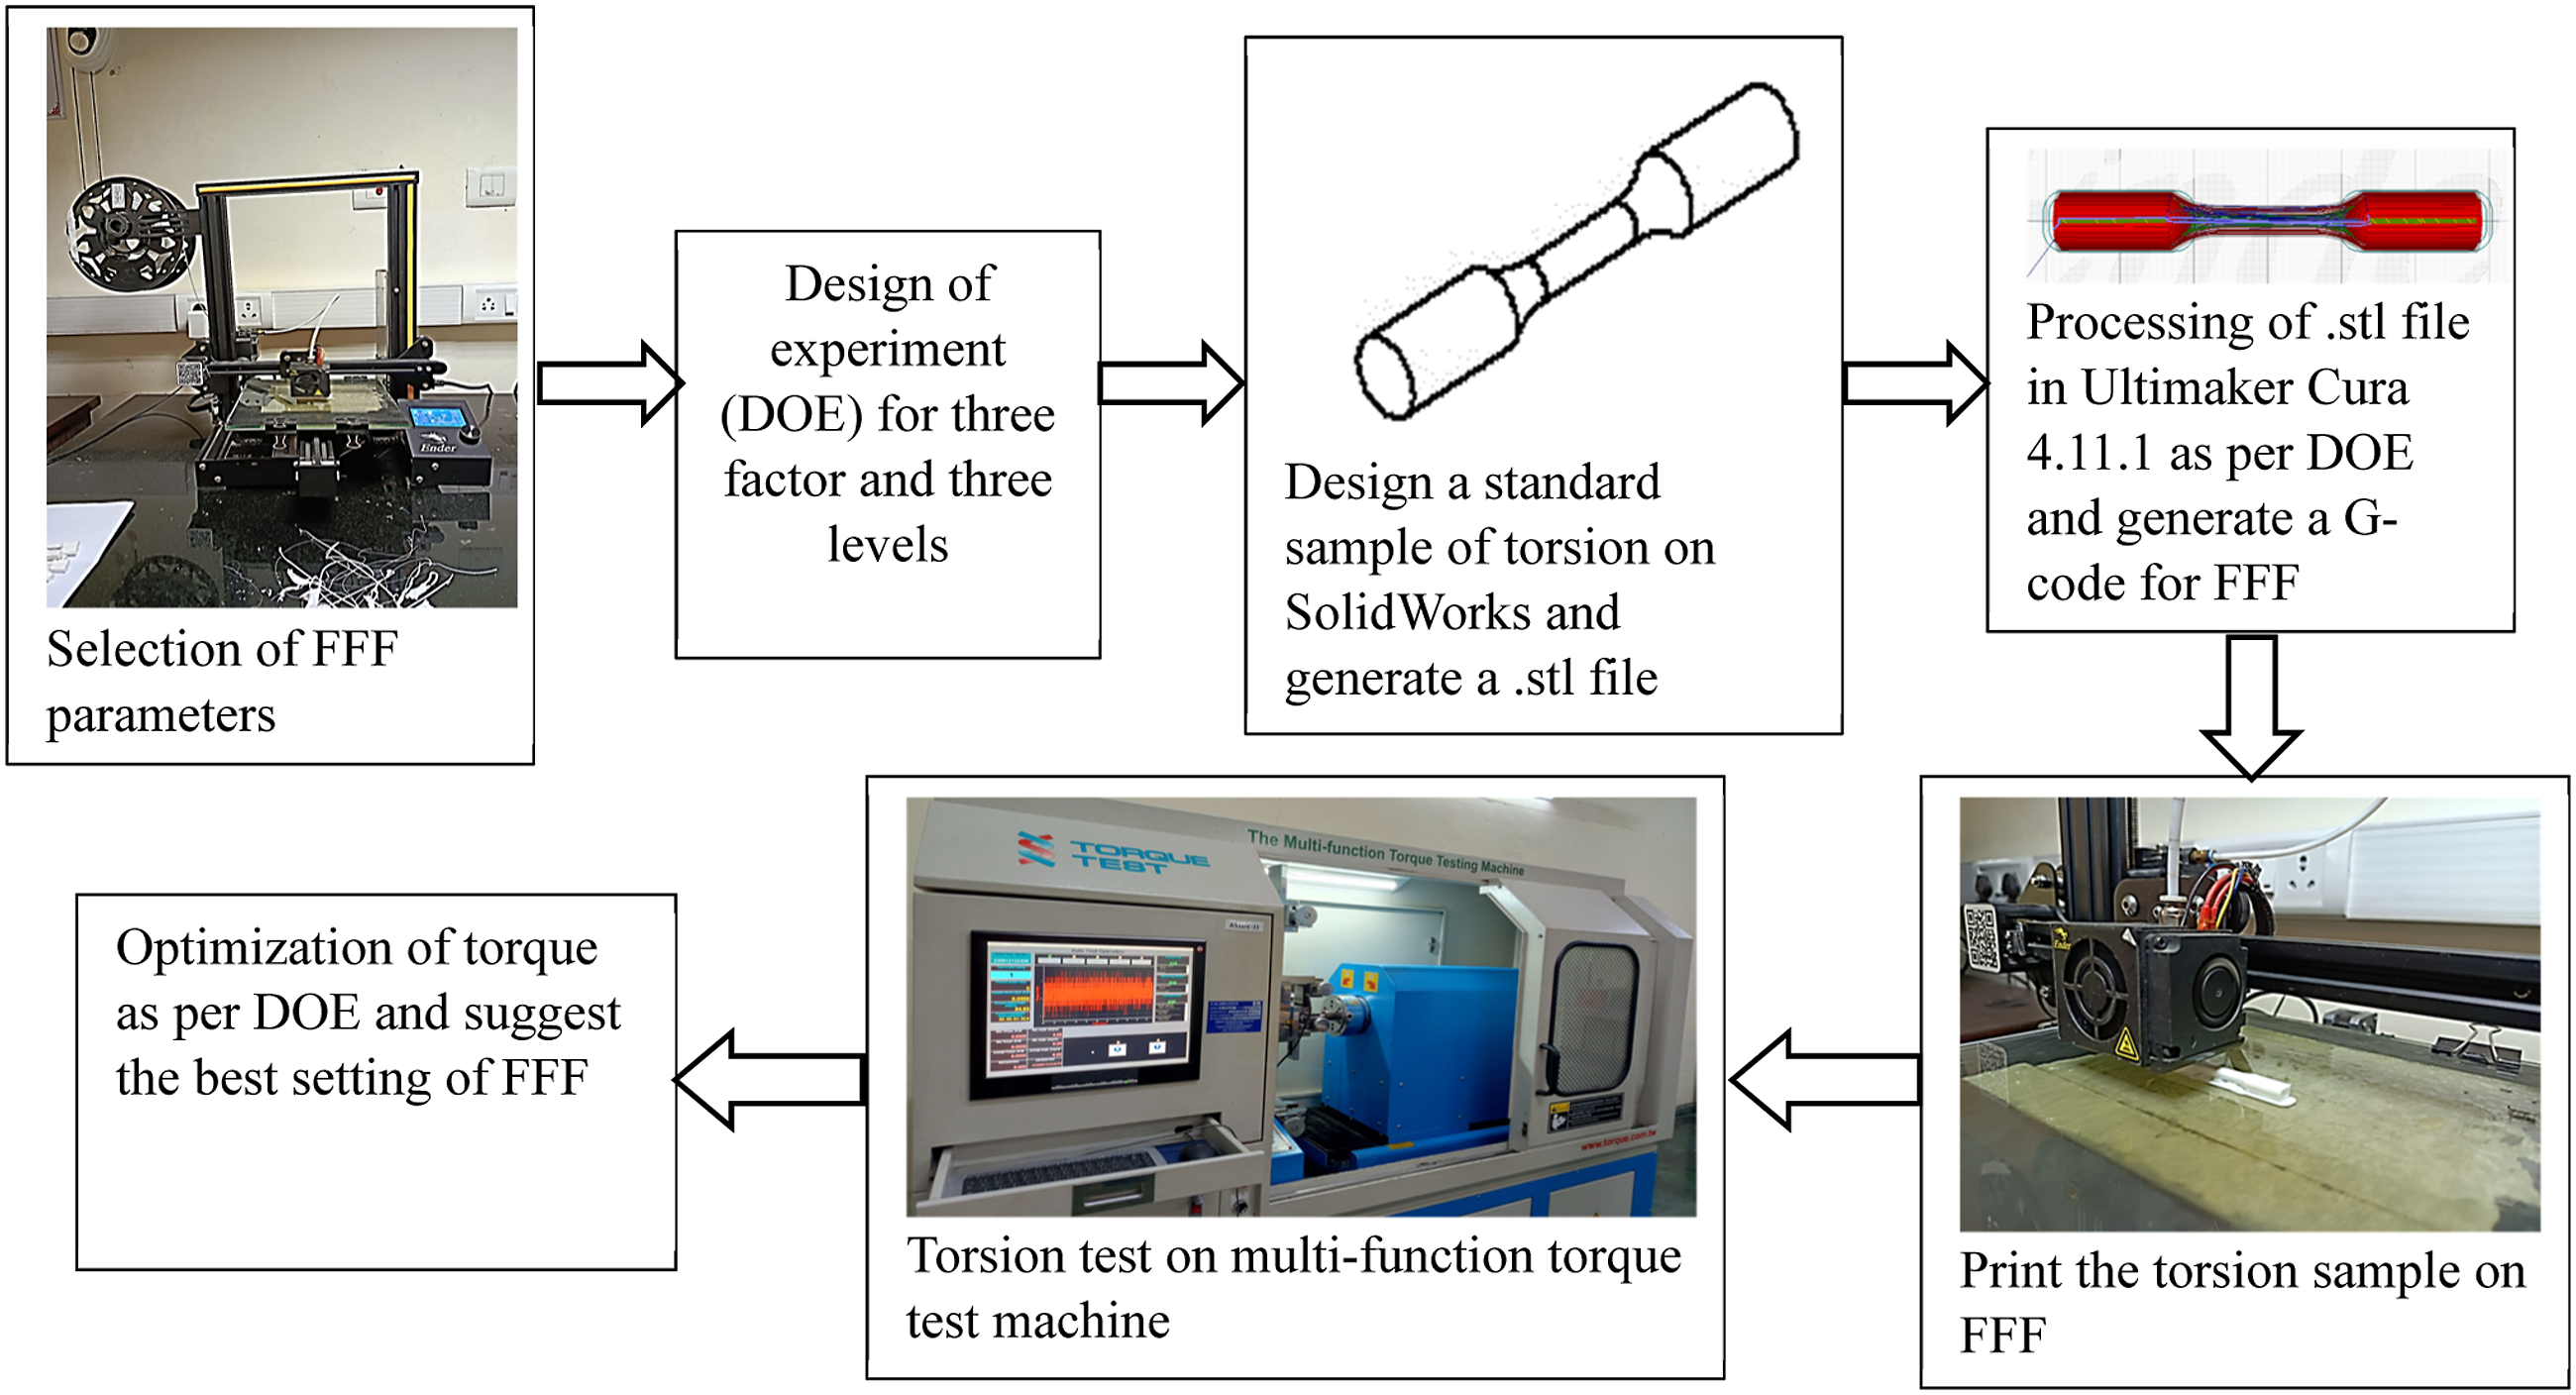
The first step involved in 3D printing was to design a computer-aided design (CAD) model. The CAD model of the torsion sample was designed using SolidWorks software as per ASTM-A-938
18
and ISO-7800 shown in Figure 4 (all dimensions are in mm). A slicing software was used to generate the G-code, which slices the 3D model into a series of thin horizontal layers. To print the torsional sample layer by layer on a 3D printer as shown in Figure 3, PVDF composite filament was loaded into the 3D printer. After printing the torsional samples, the support was removed from functional prototypes and prepared to test on the multi-function torque testing machine. Torsion sample for the enhancement of the FFF setting.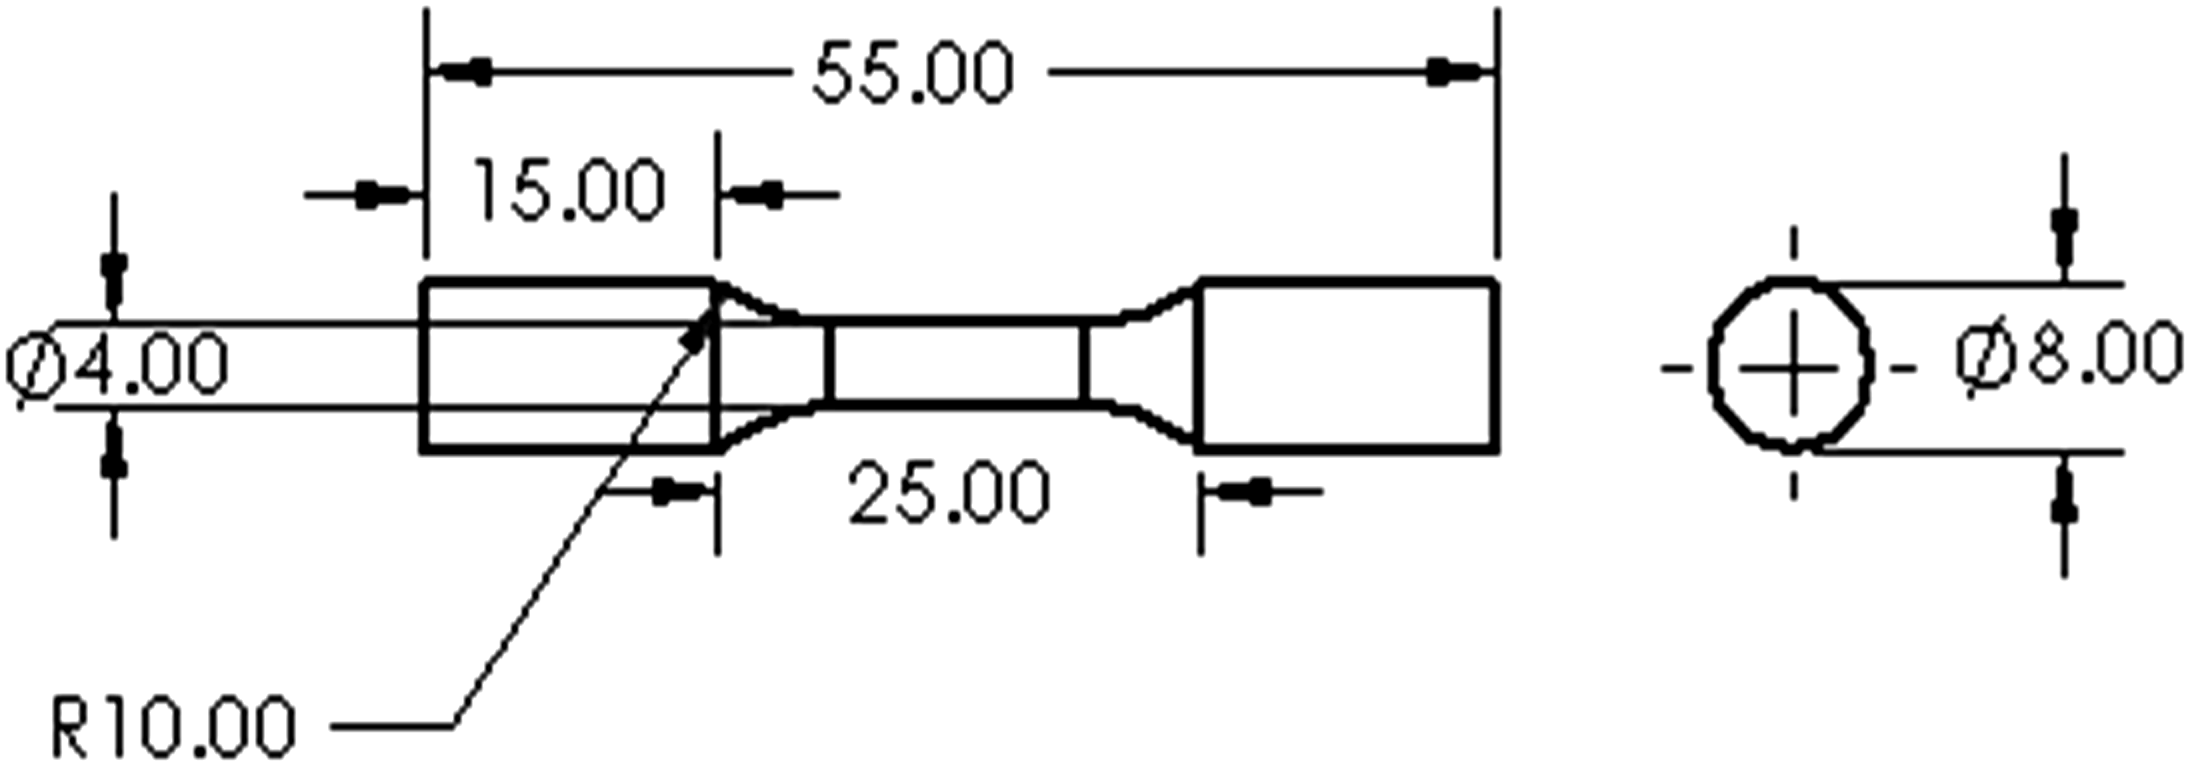
Selected parameters for the FFF process.
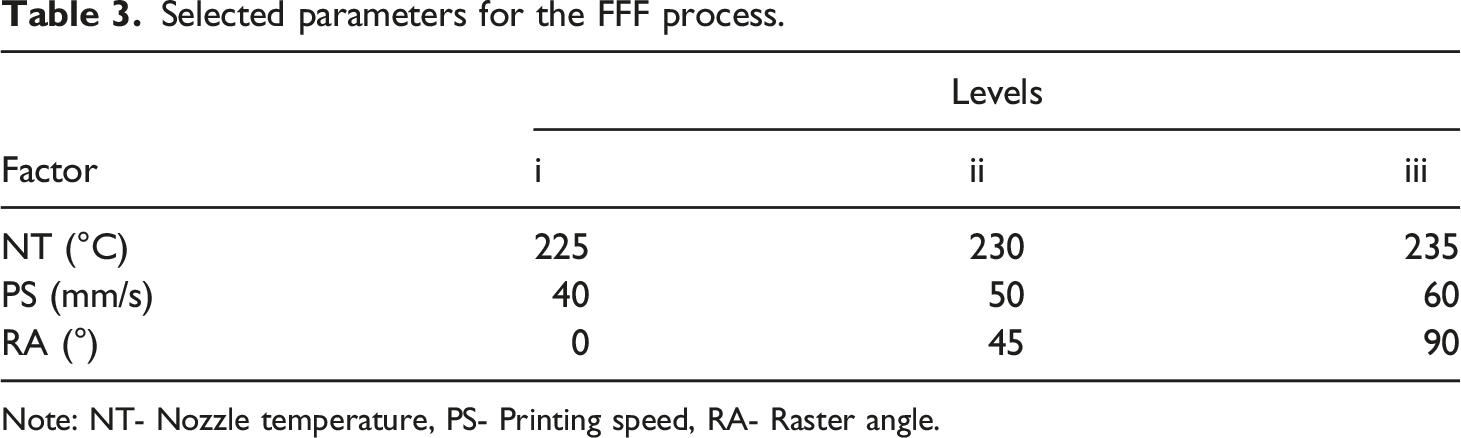
Note: NT- Nozzle temperature, PS- Printing speed, RA- Raster angle.
Observation of torque based on the processing parameters.
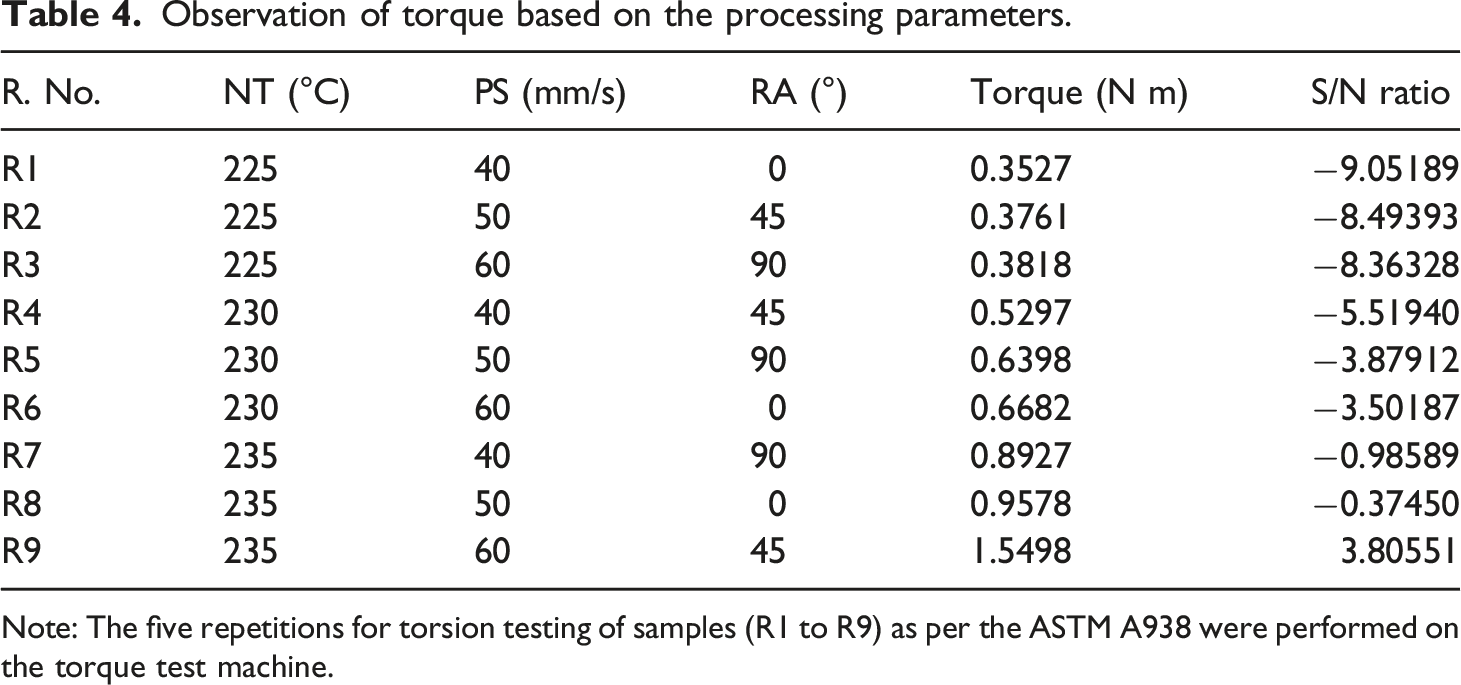
Note: The five repetitions for torsion testing of samples (R1 to R9) as per the ASTM A938 were performed on the torque test machine.
Based on Tables 3 and 4, Figure 5 shows nine sets of samples printed by open source FFF printer (Make: Ender Creality of Shenzhen Creality 3D technology, build size 220 × 220 × 250 mm). Printed samples as per DOE.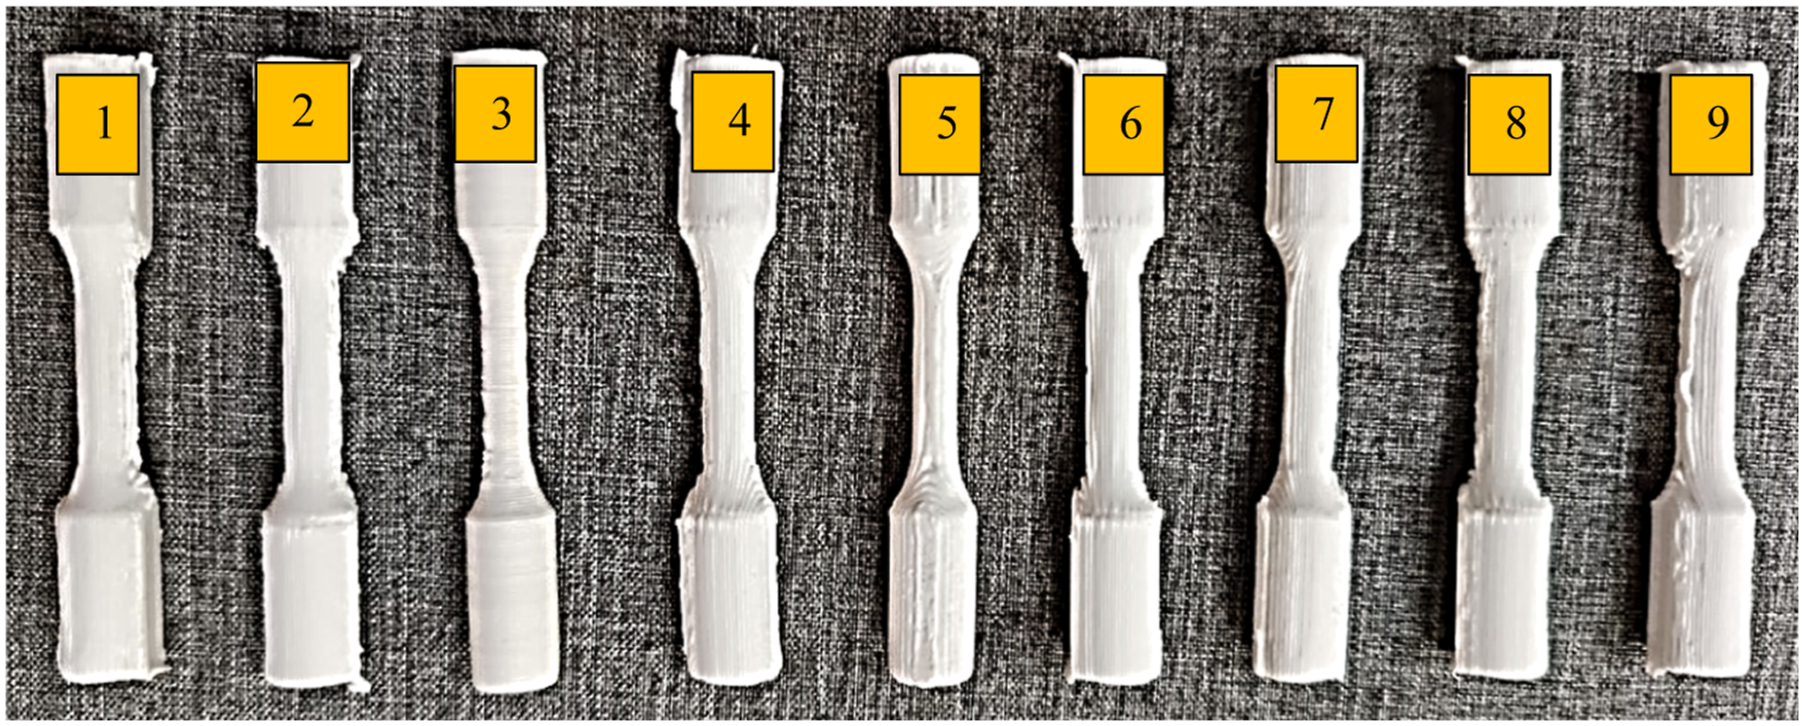
The 3D printed samples were put for torsional testing. The steps involved in the torsion test up to the failure of the torsion specimens are shown in Figure 6. Torsional loading (a) at 90°, (b) at 360°, (c) at 720°, (d) up to fracture (800°) as per ASTM-A-938 and ISO-7800.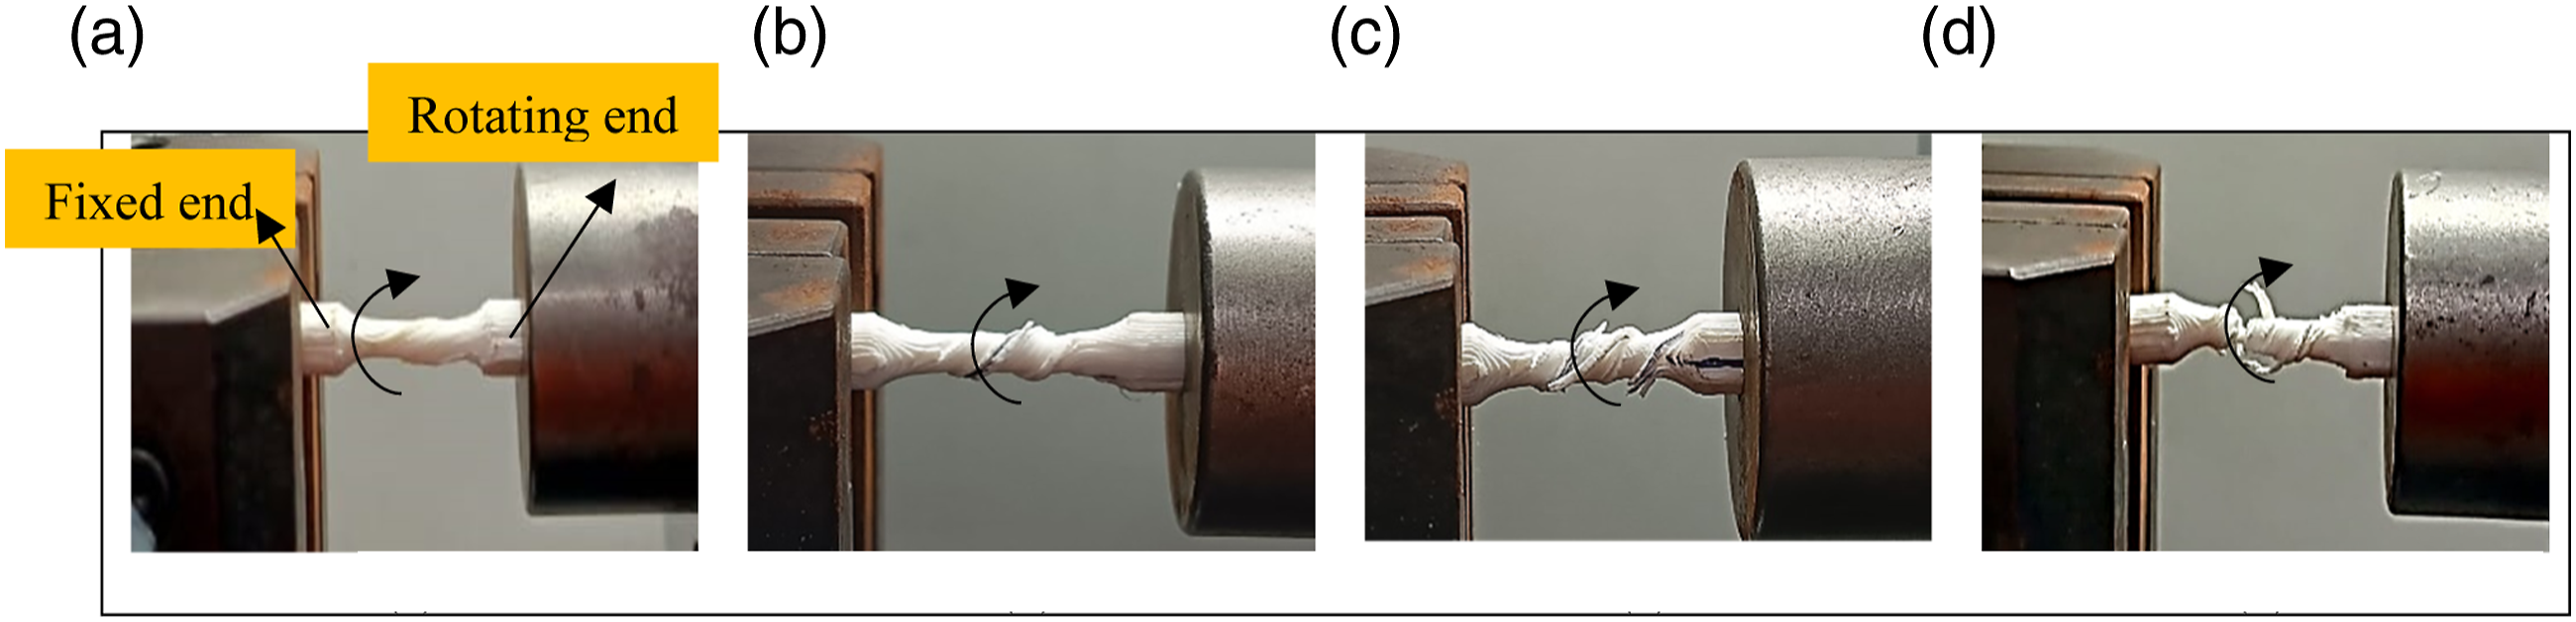
Results and discussion
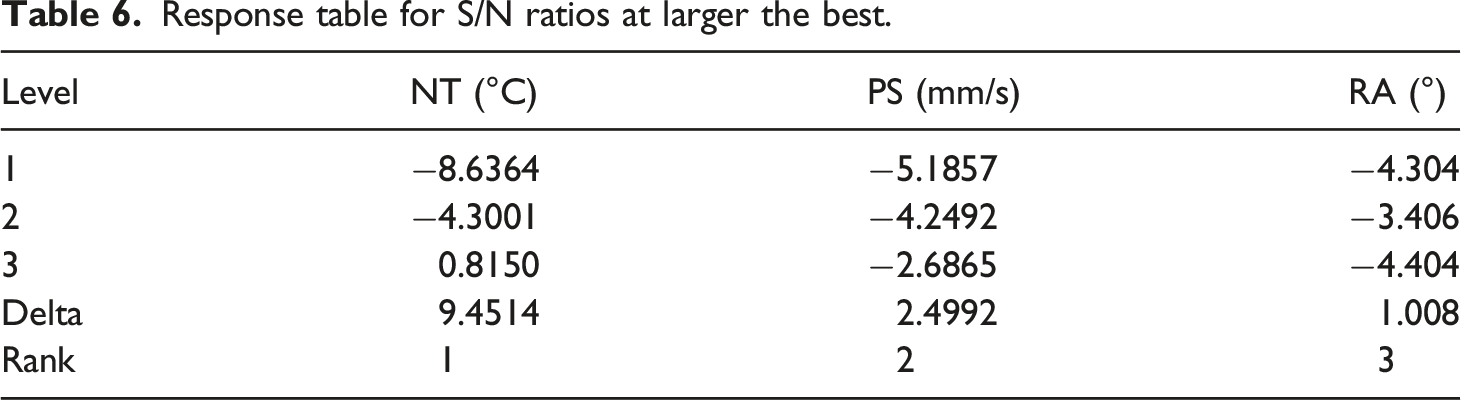
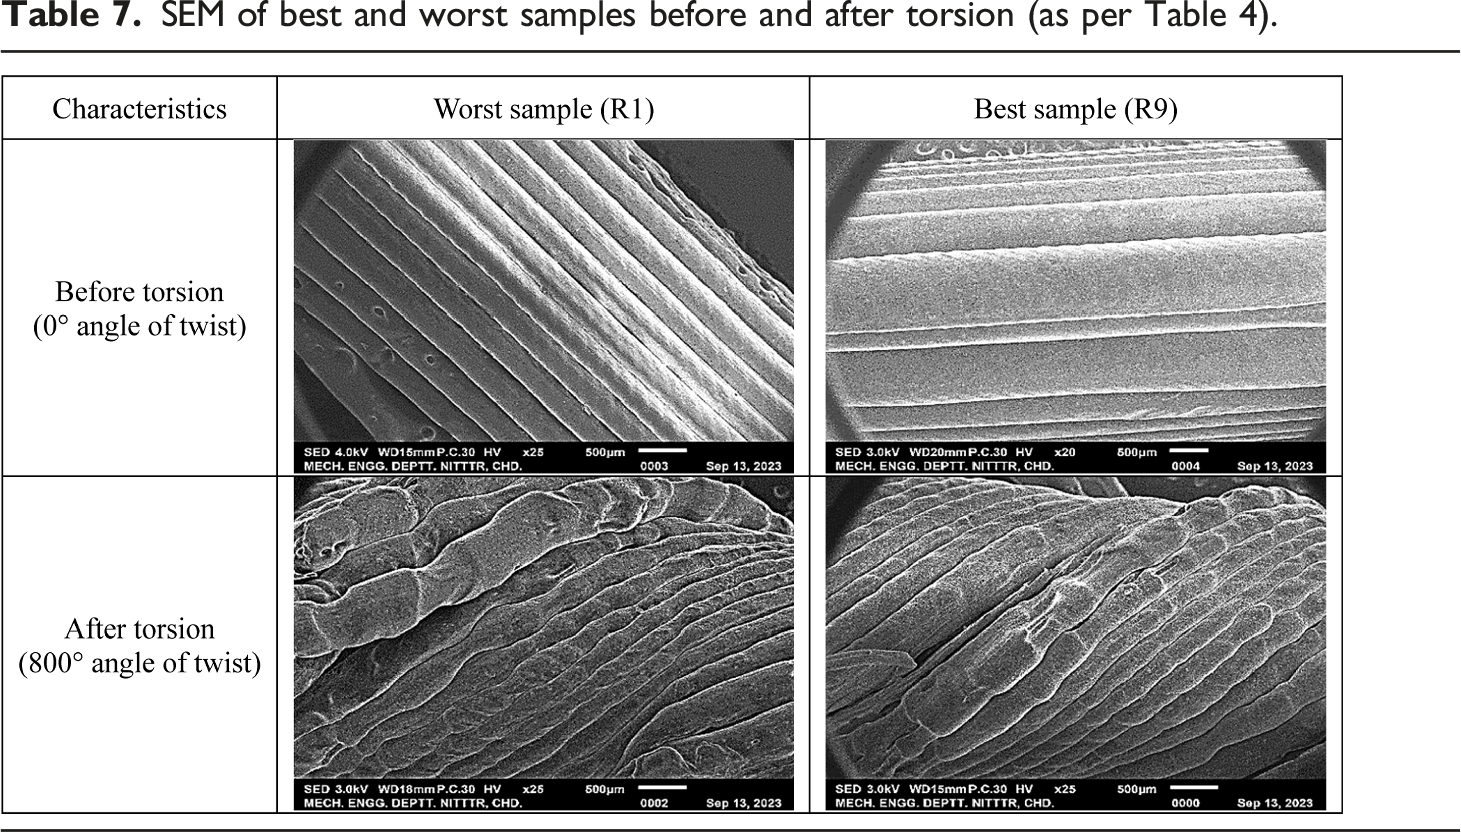
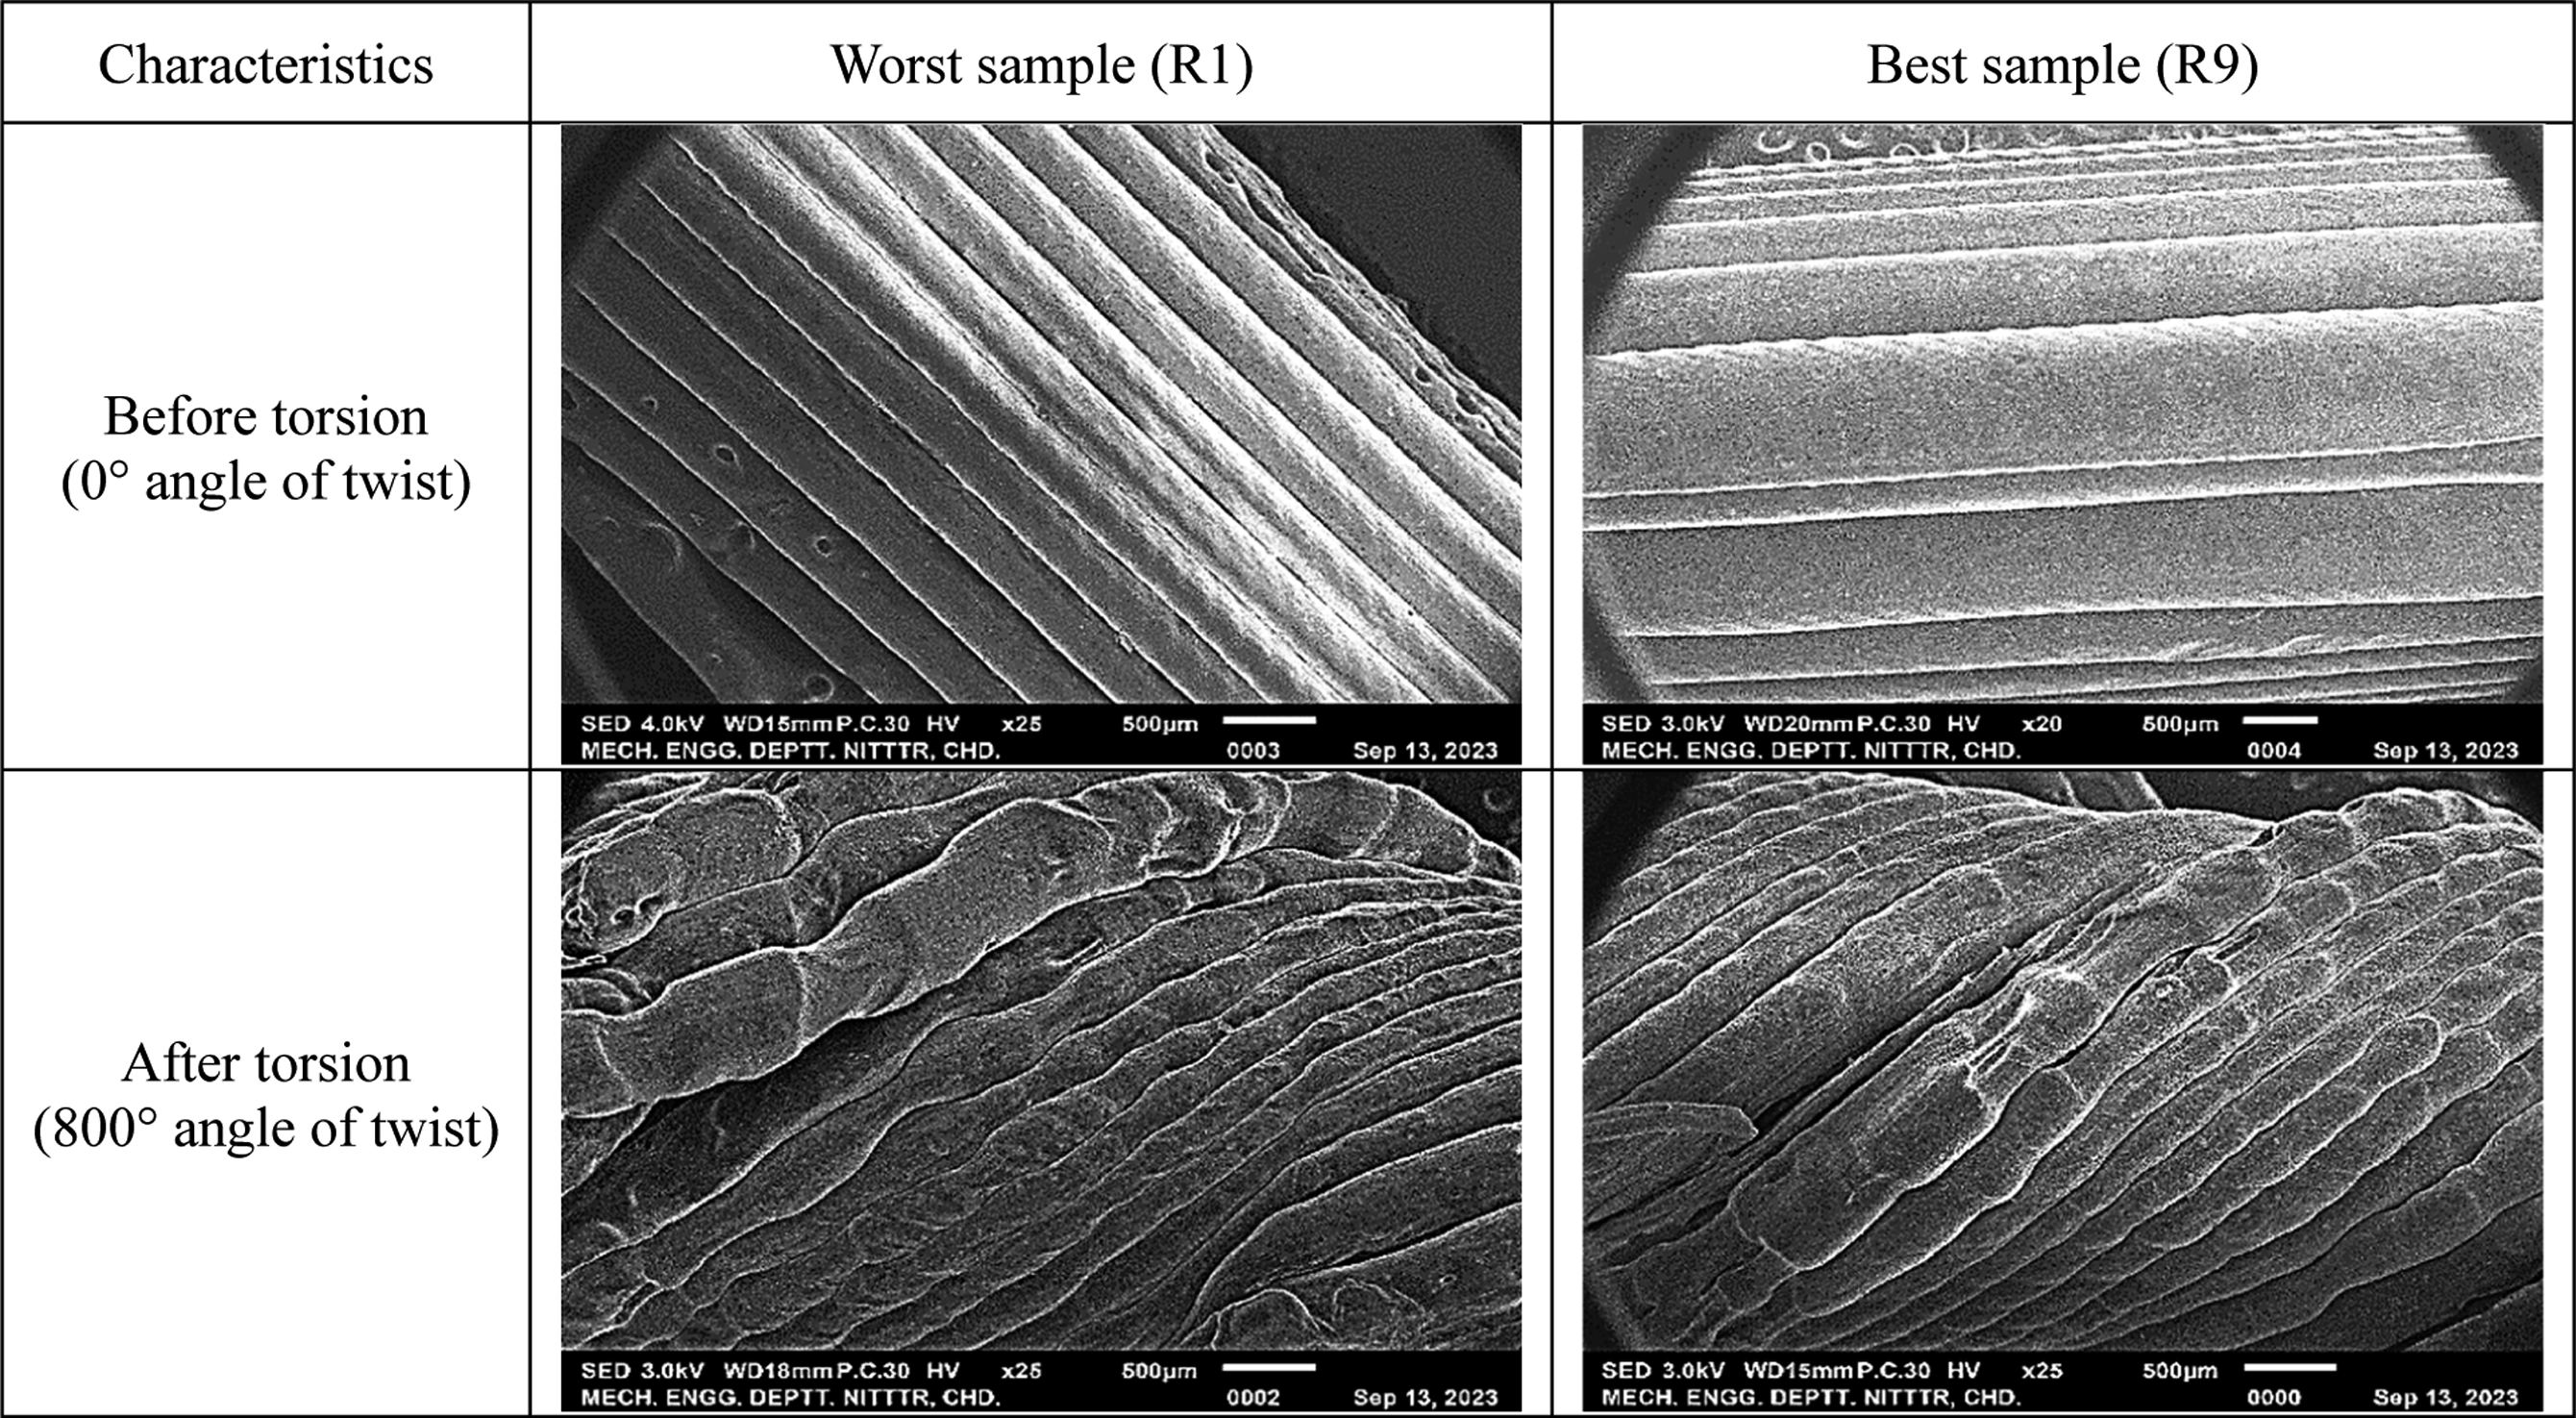
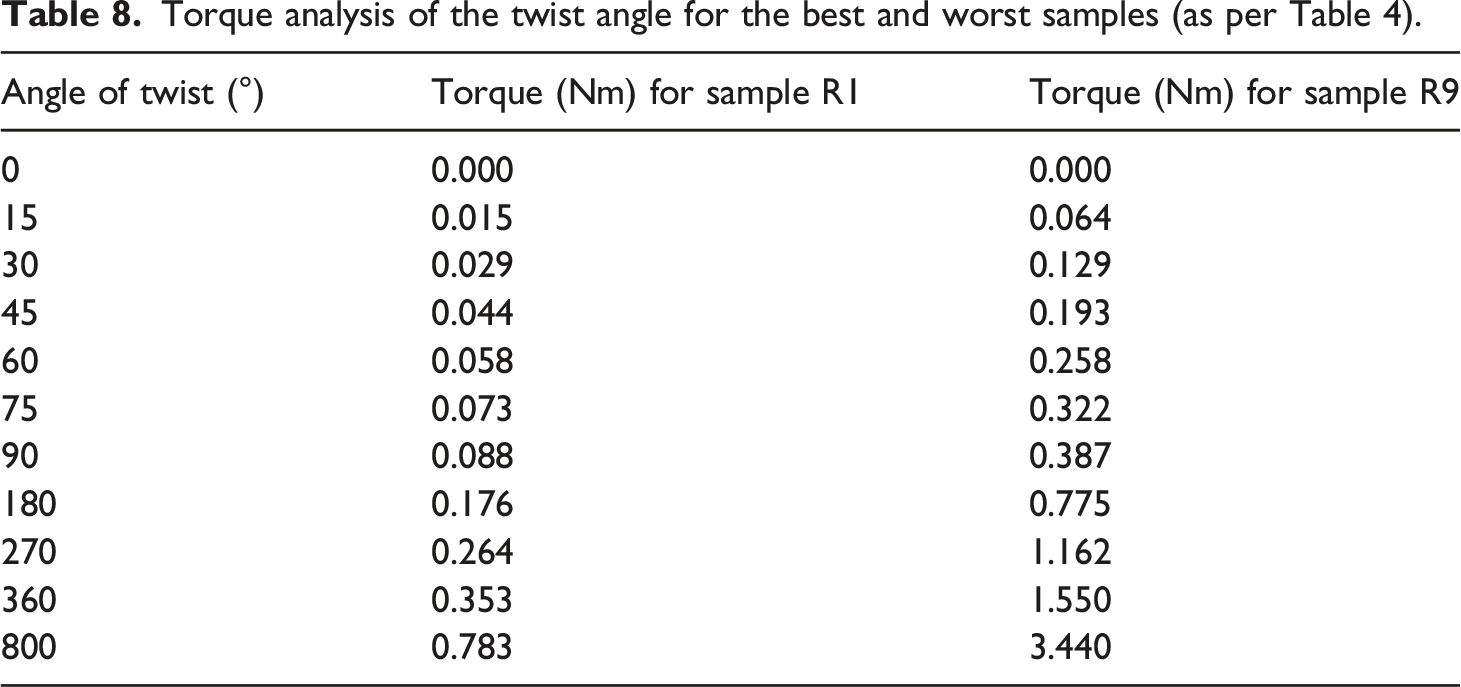
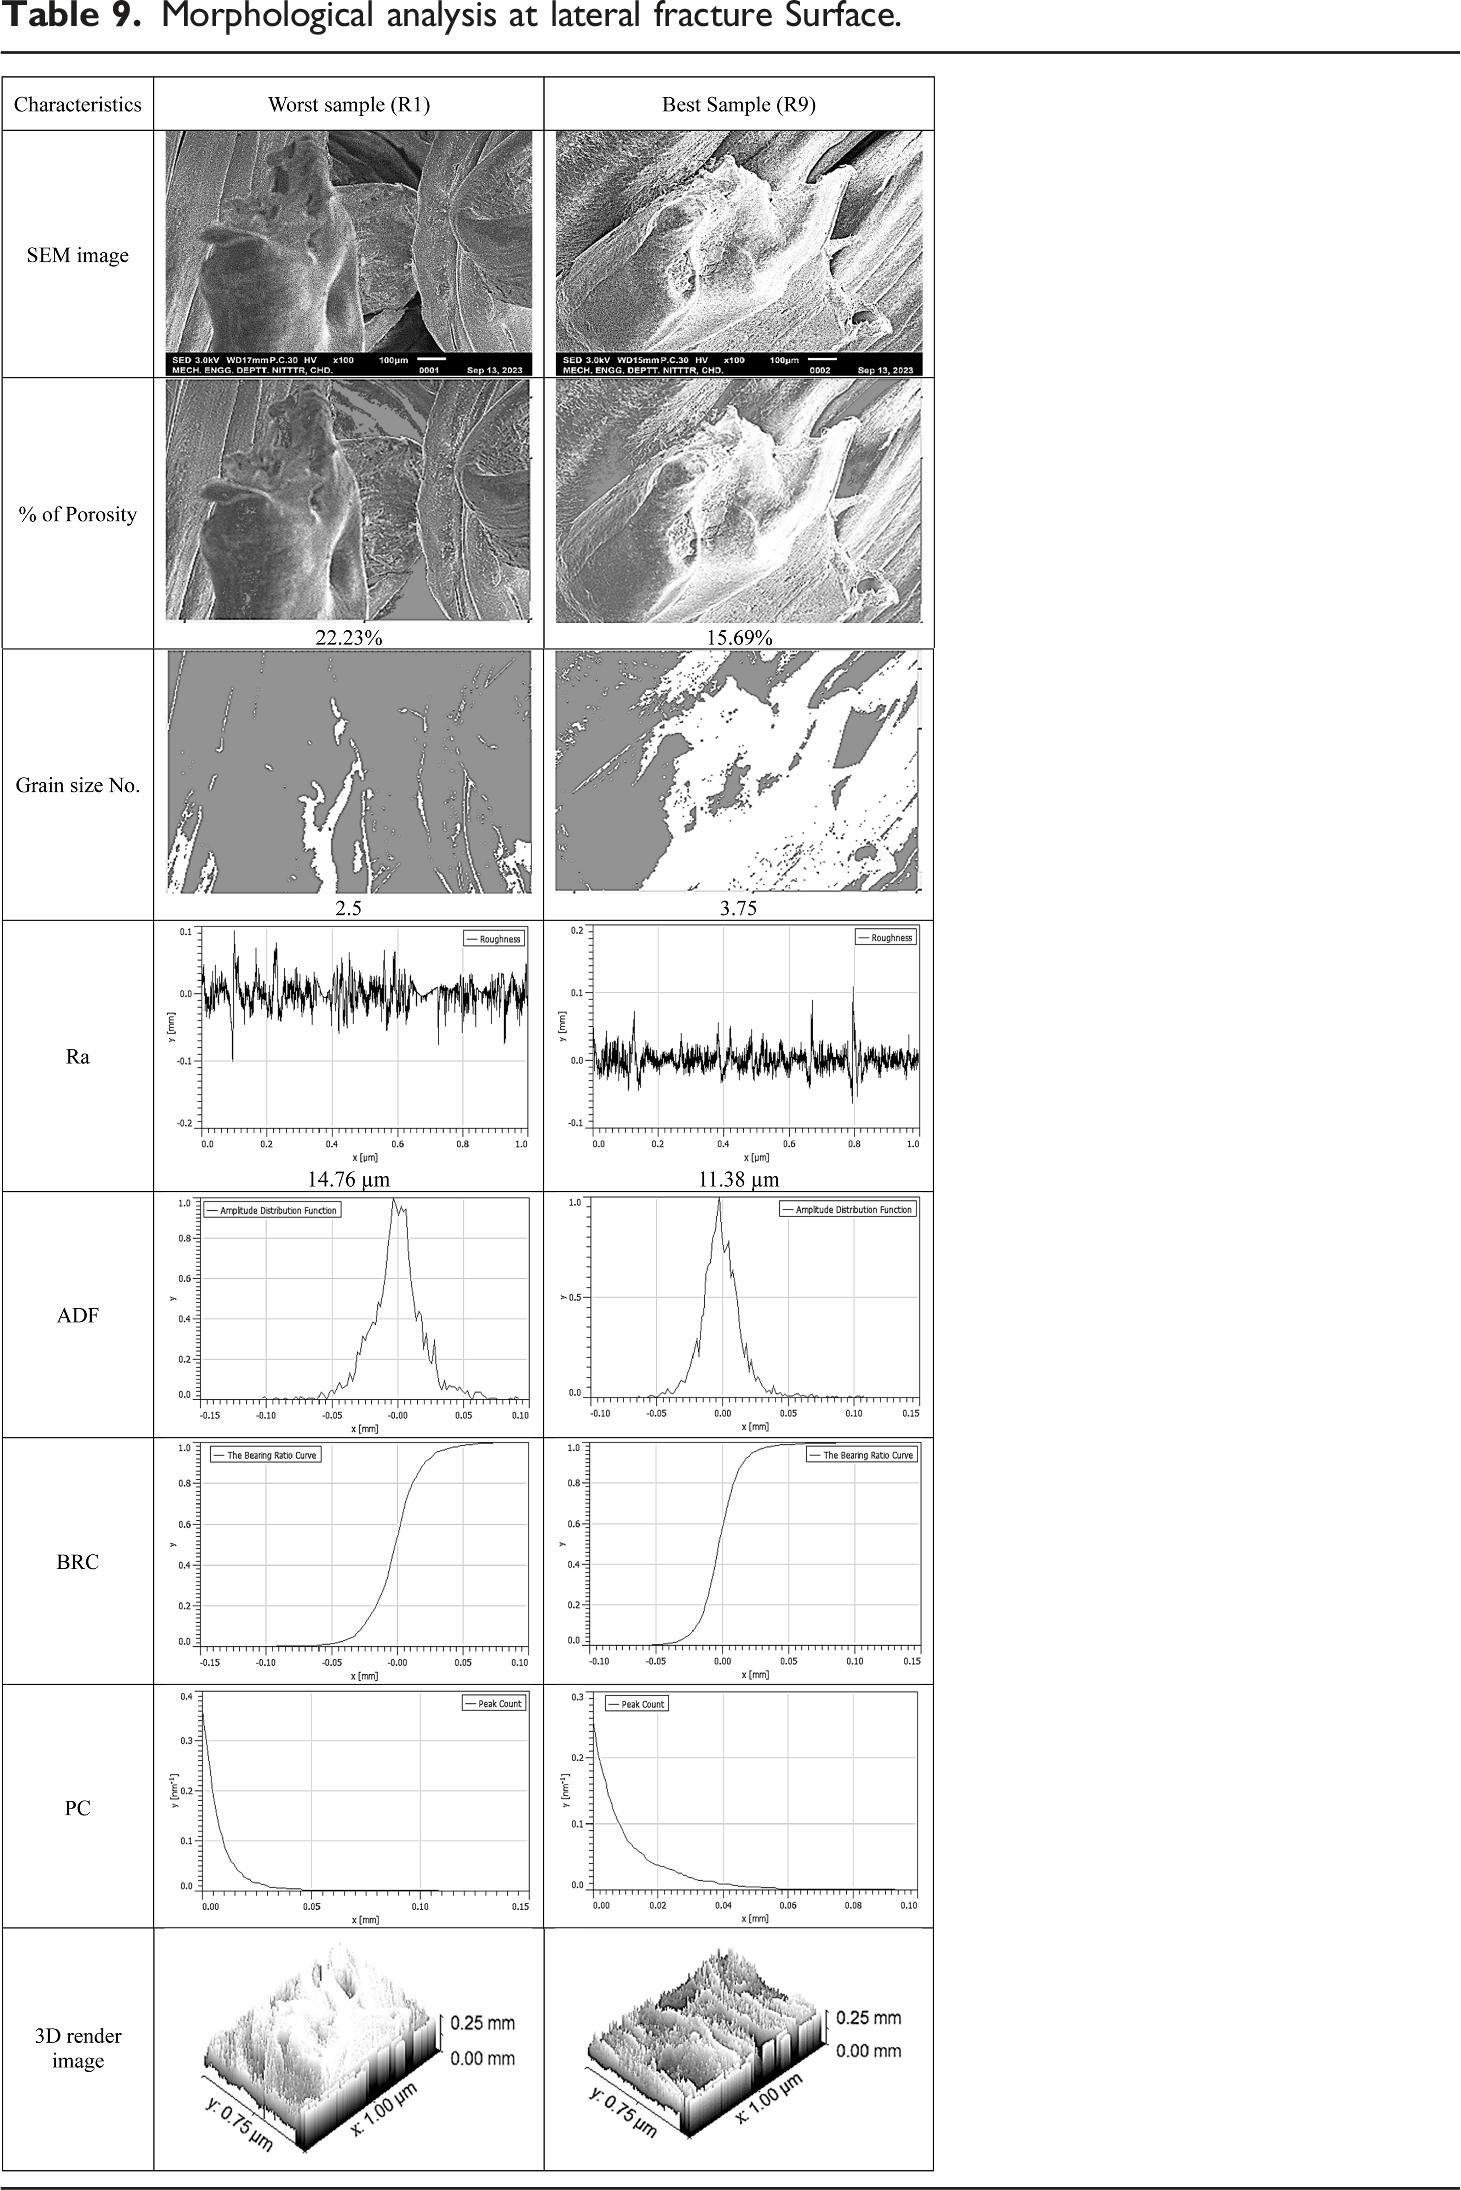
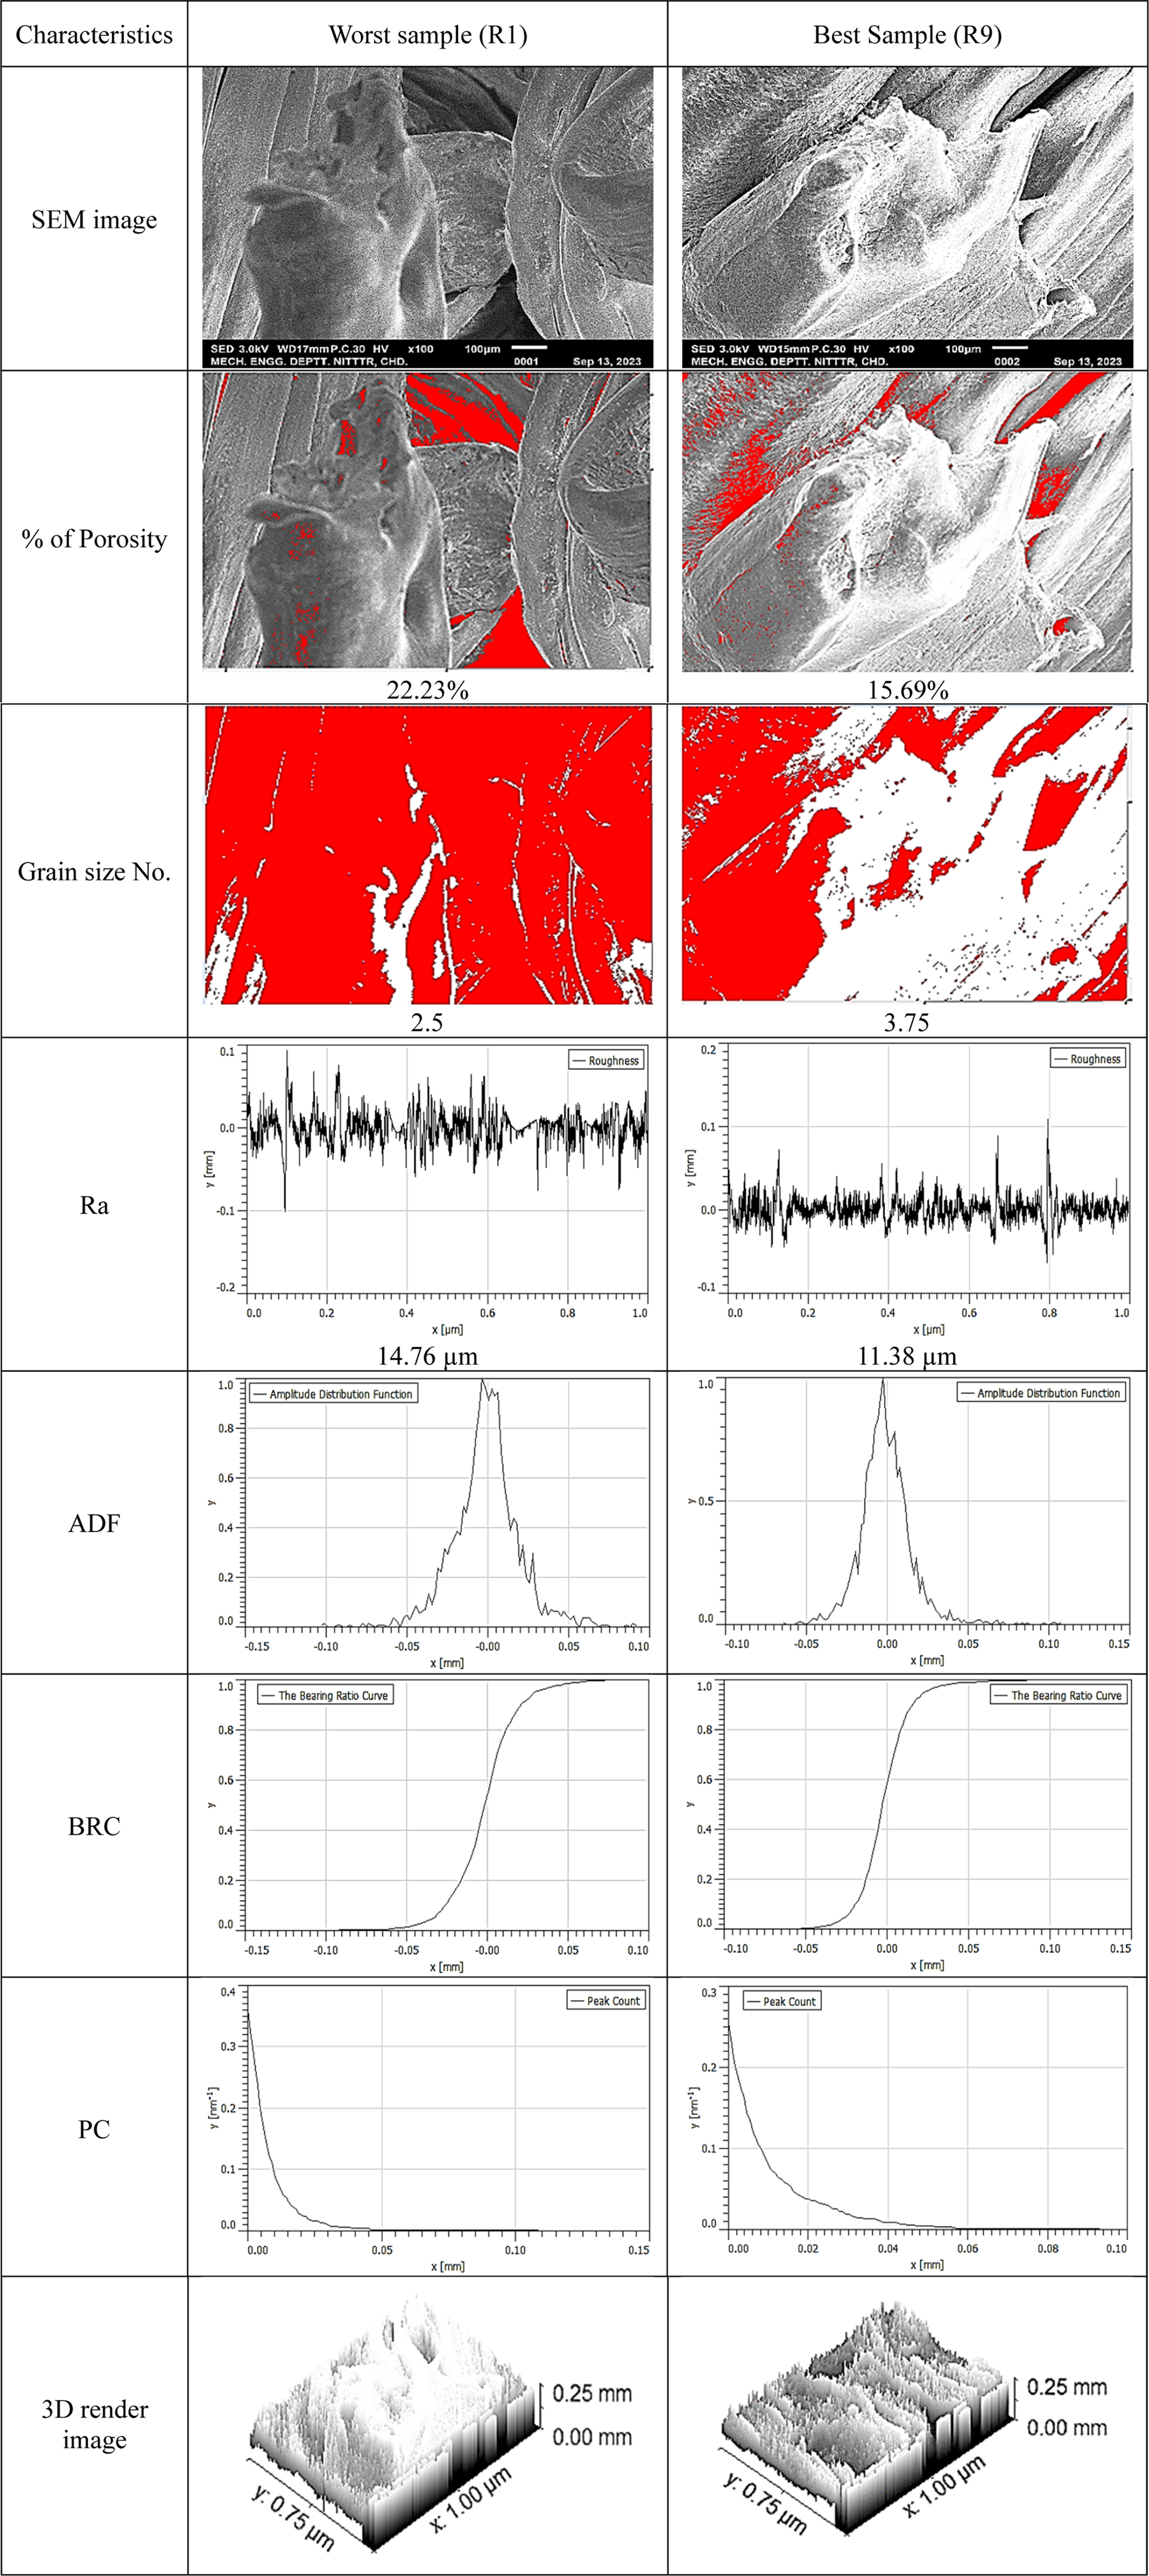
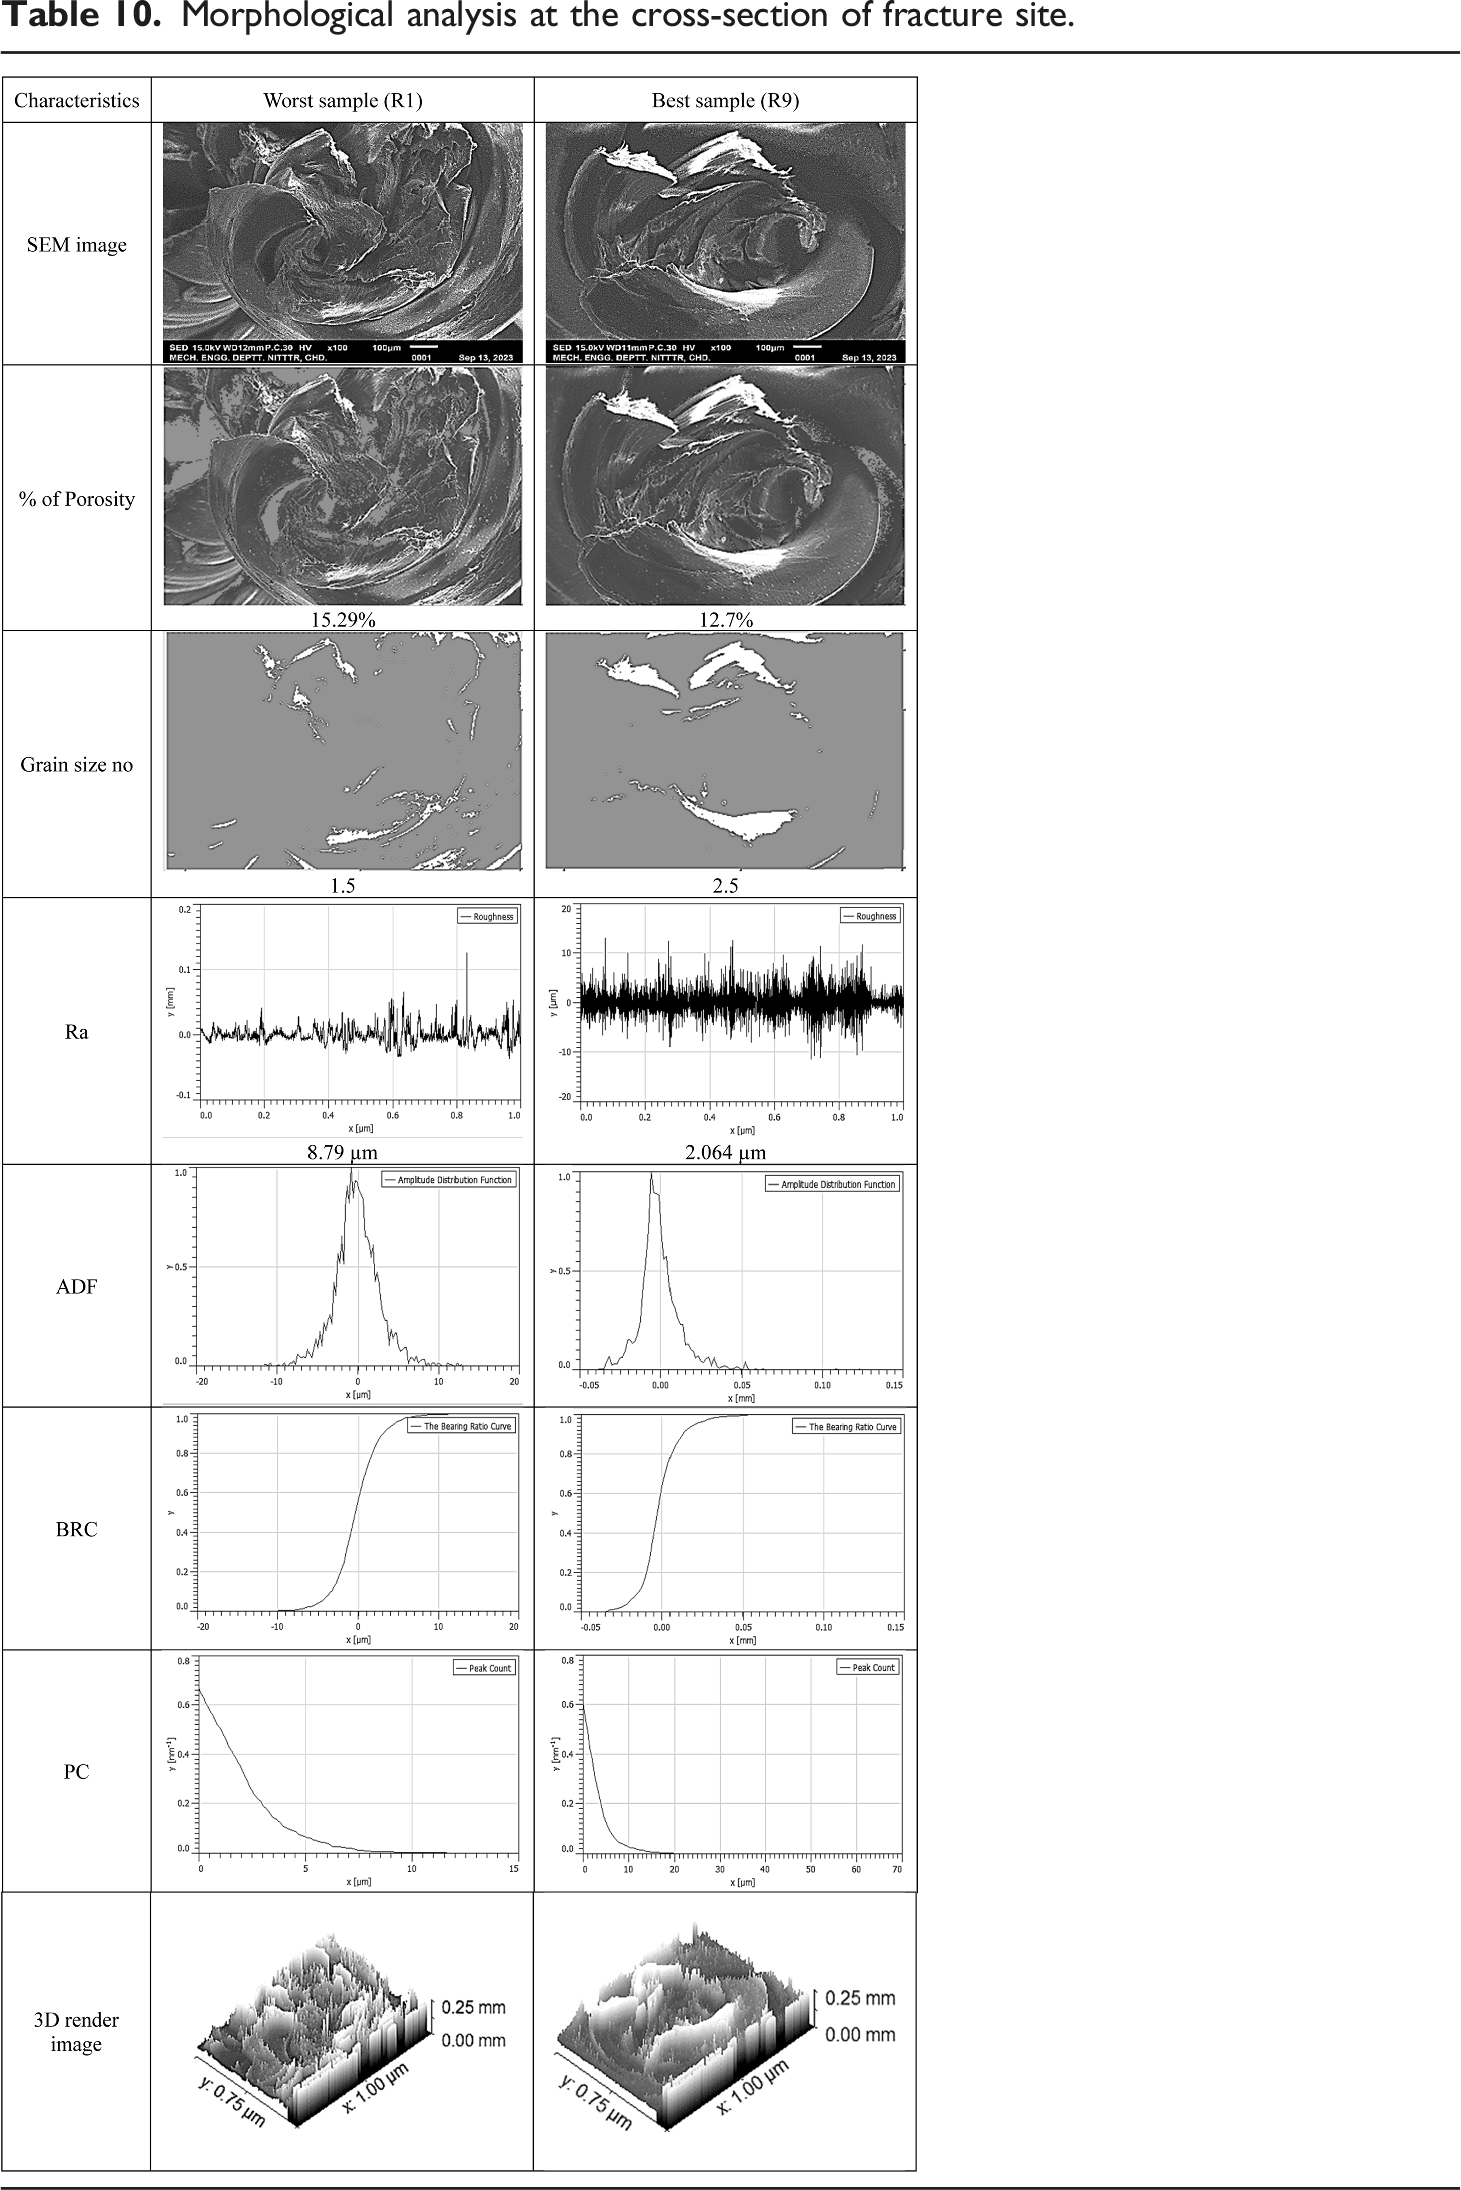
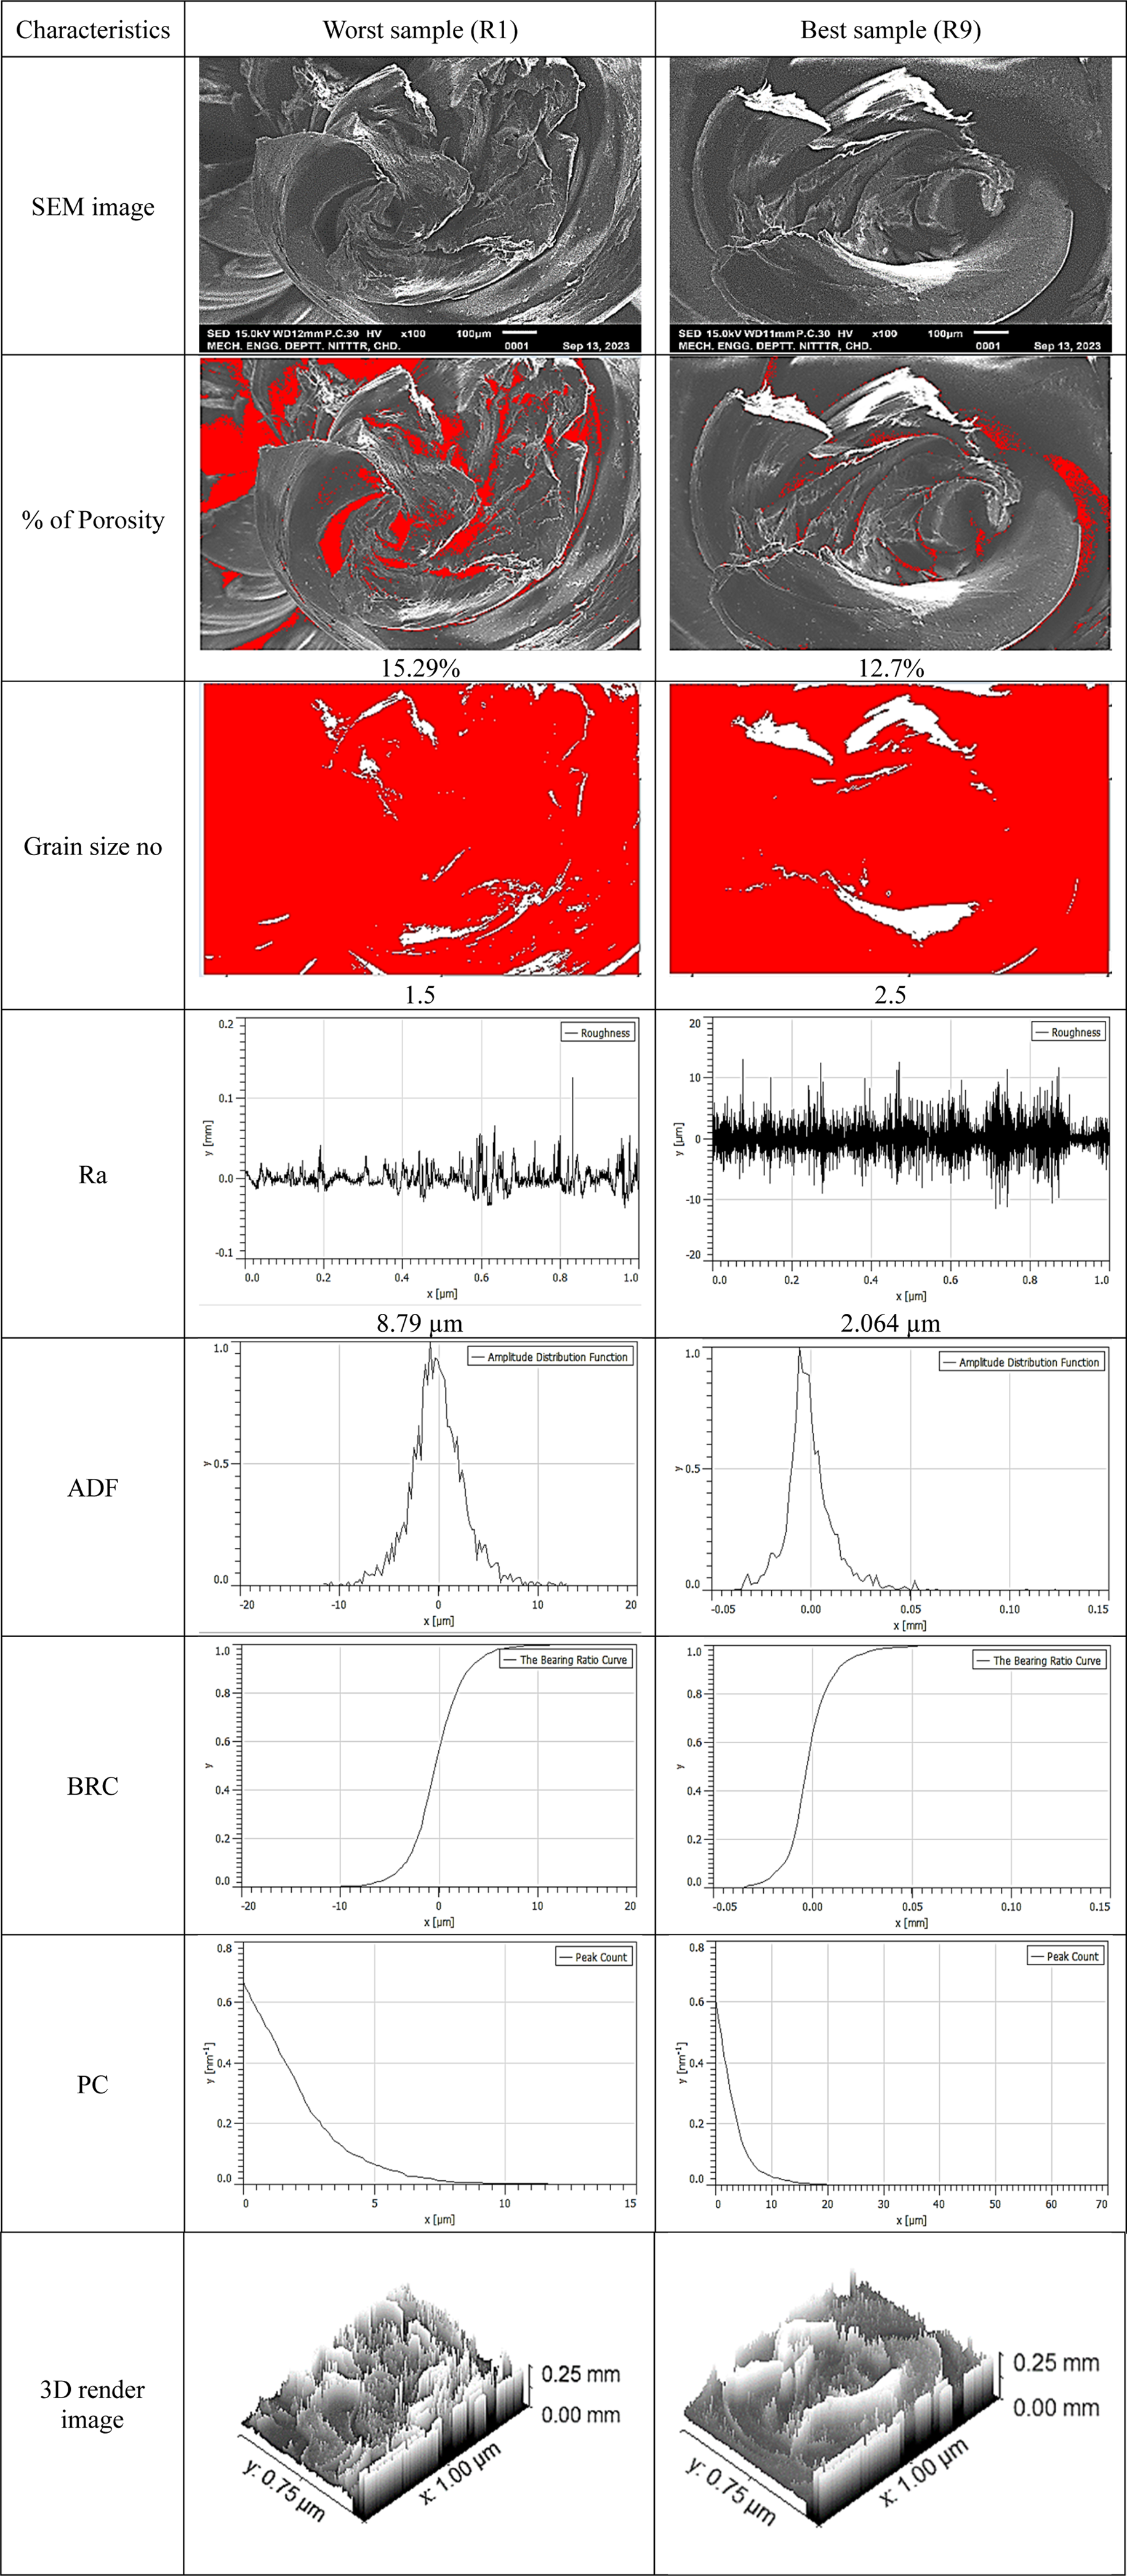
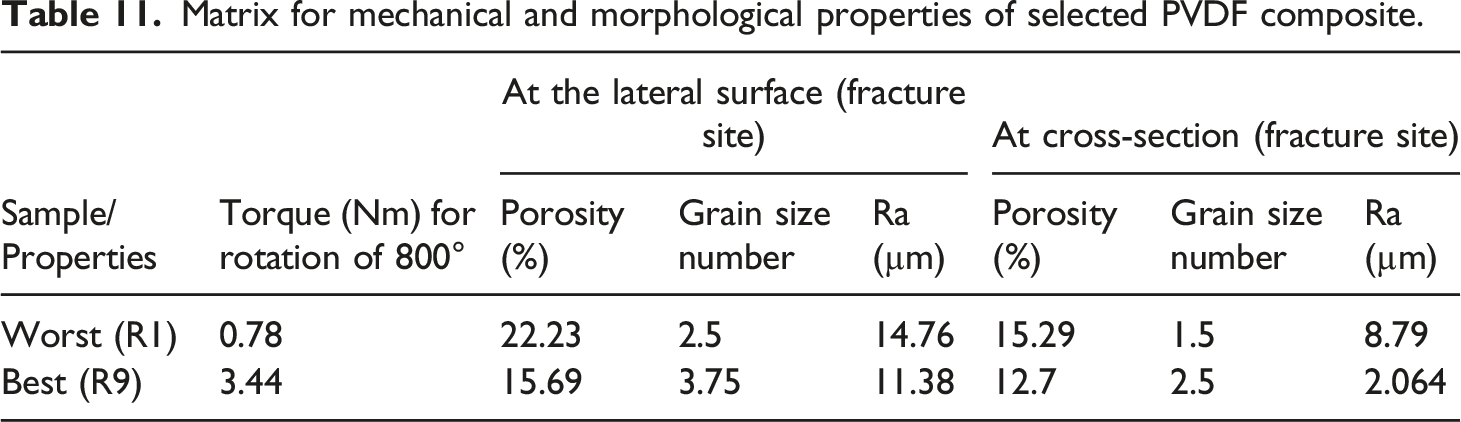
The torsional characteristics of the PVDF composite were ascertained as per ASTM-A-938 and ISO-7800. The torsion test was carried out using a multifunction torque testing machine (Torque test instrument, Model: TQ-T500H, Taichung County 414, Taiwan) utilizing a load cell (NTS technology) with a capacity of 5000 N m and precision of 0.005 N m. The torsion test was performed at 1 rpm, specimen having a 25 mm gauge length, angle of twist/rotation was 0–800°. Based on Table 3 the maximum value of torque was found in run number 9 (R9), while the minimum value was in run number 1 (R1). By analyzing the signal-to-noise (S/N) response for the “larger is better” type case, the effect of input processing parameters on the torsion properties has been investigated. The 95% confidence level was used in the study for maximizing the S/N ratios. Table 5, for analysis of variance (ANOVA) of the S/N ratios for the torque reveals that only one factor i.e., NT was found significant at a 95% confidence level, because in the case of NT, the P value is less than 0.05 i.e., 0.034. The maximum contribution of NT was observed at 89.25% for the torque. According to the S/N ratio for torque, Table 6 lists the rankings of the input process parameters. The observed outcomes demonstrate that PVDF composite torsional strength is predominantly influenced by nozzle temperature followed by printing speed. Figure 7 depicts the S/N response for torque using the values from Table 5. The main plots of the S/N ratio for torque demonstrate that changing the specified fraction of input processing parameters from level 1 to level 3 has a noticeable impact. Whenever the temperature rose from 225°C to 235°C, the torque values also increased. This might be because layer adhesion strength increases with NT temperature during the printing of PVDF composite. Similarly, the effect of PS increases the corresponding torque value also increase, this may be, due to the maintenance of the thermal gradient of a previously printed layer of PVDF composite. But in the case of RA, when RA increases from 0 to 90°, the torque first increases then decreases, the maximum value of torque observed at the angle of 45°, this might be because layers twisting strength is better if they print at 45°. Table 7 depicts the SEM image for the before and after torsion test (based on Table 4). The detailed torque analysis of the twist angle for the best and worst samples is shown in Table 8. The fracture surface SEM image was captured at the lateral surface (Table 9) and at cross-section (Table 10) for the worst (R1) and best (R9) samples (as per Table 4). For detailed morphological analysis, the SEM images were further examined in a metallurgical image analysis system (MIAS). It was observed that the best sample of torsion (R9) had fewer voids and uniformly joined succeeding layers. The %porosity (as per ASTM B 276) of the R9 sample was noted as 15.69% (at lateral) and 12.7% (at cross-section), while the worst sample (R1) had poor adhesiveness between different layers. The %porosity of the R1 sample was observed as 22.23% (at lateral) and 15.29% (at cross-section). This may be due to the temperature difference between R1 and R9. The grain size number of the R9 sample was observed at 3.75 (at lateral), 2.5 (at cross-section), while in the R1 sample 2.5 (at lateral), 1.5 (at cross-section) (as per ASTM E 112) as shown in Tables 9 and 10. The substantial number of voids found in R1 may be due to the minimum processing temperature of the PVDF composite matrix leading to poor mechanical characteristics. The adhesive strength between the various layers was weak as a result of the comparatively high number of voids that appeared, which negatively impacted the torsional characteristics. The SEM images were further processed with an image processing open-source software (Gwyddion) to further evaluate the surface characteristics. SEM images (of the lateral surface (Table 9) and at cross-section (Table 10)) taken at the site of fracture were used to develop profiles for peak count (PC), amplitude distribution function (ADF) (expressing the probability of getting highest peak), bearing ratio curve (BRC) (expressing the cumulative probability of getting highest peak), surface roughness (Ra), and a 3D-rendered image. It was noticed that the torsional properties have shown a close correlation with the morphological characteristics of the fracture surface. The R9 samples have lower Ra and superior torsion characteristics (as shown in Tables 9 and 10). In contrast, the R1 samples had a high Ra value, (which was caused by improper bonding of PVDF composite at successive layers) which ultimately harmed its torsional performance. The R9 sample had a low Ra value, which eventually contributed to better diffusion of the material in layer trends and better bonding strength. The R9 sample, which also had the highest torsional value, had a minimum Ra value of 11.38 µm (at the lateral surface), and 2.064 µm (at cross-section), while R1 had a maximum Ra value of 14.76 µm (at lateral), 8.79 µm (at cross section) and other surface characteristics (like ADF, BRC, PC) are in line with the Ra observation. Finally based on observed mechanical (torsional) behavior and morphological characteristics the final decision matrix is shown in Table 11.
ANOVA for S/N ratio (torsion properties).
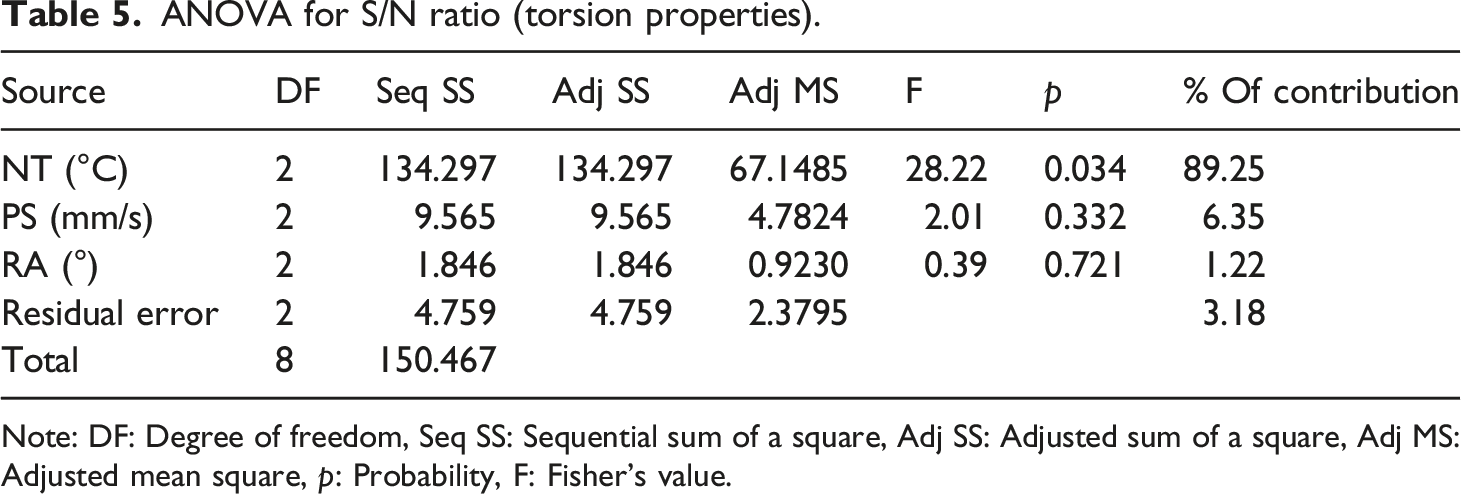
Note: DF: Degree of freedom, Seq SS: Sequential sum of a square, Adj SS: Adjusted sum of a square, Adj MS: Adjusted mean square, p: Probability, F: Fisher’s value.
Response table for S/N ratios at larger the best.
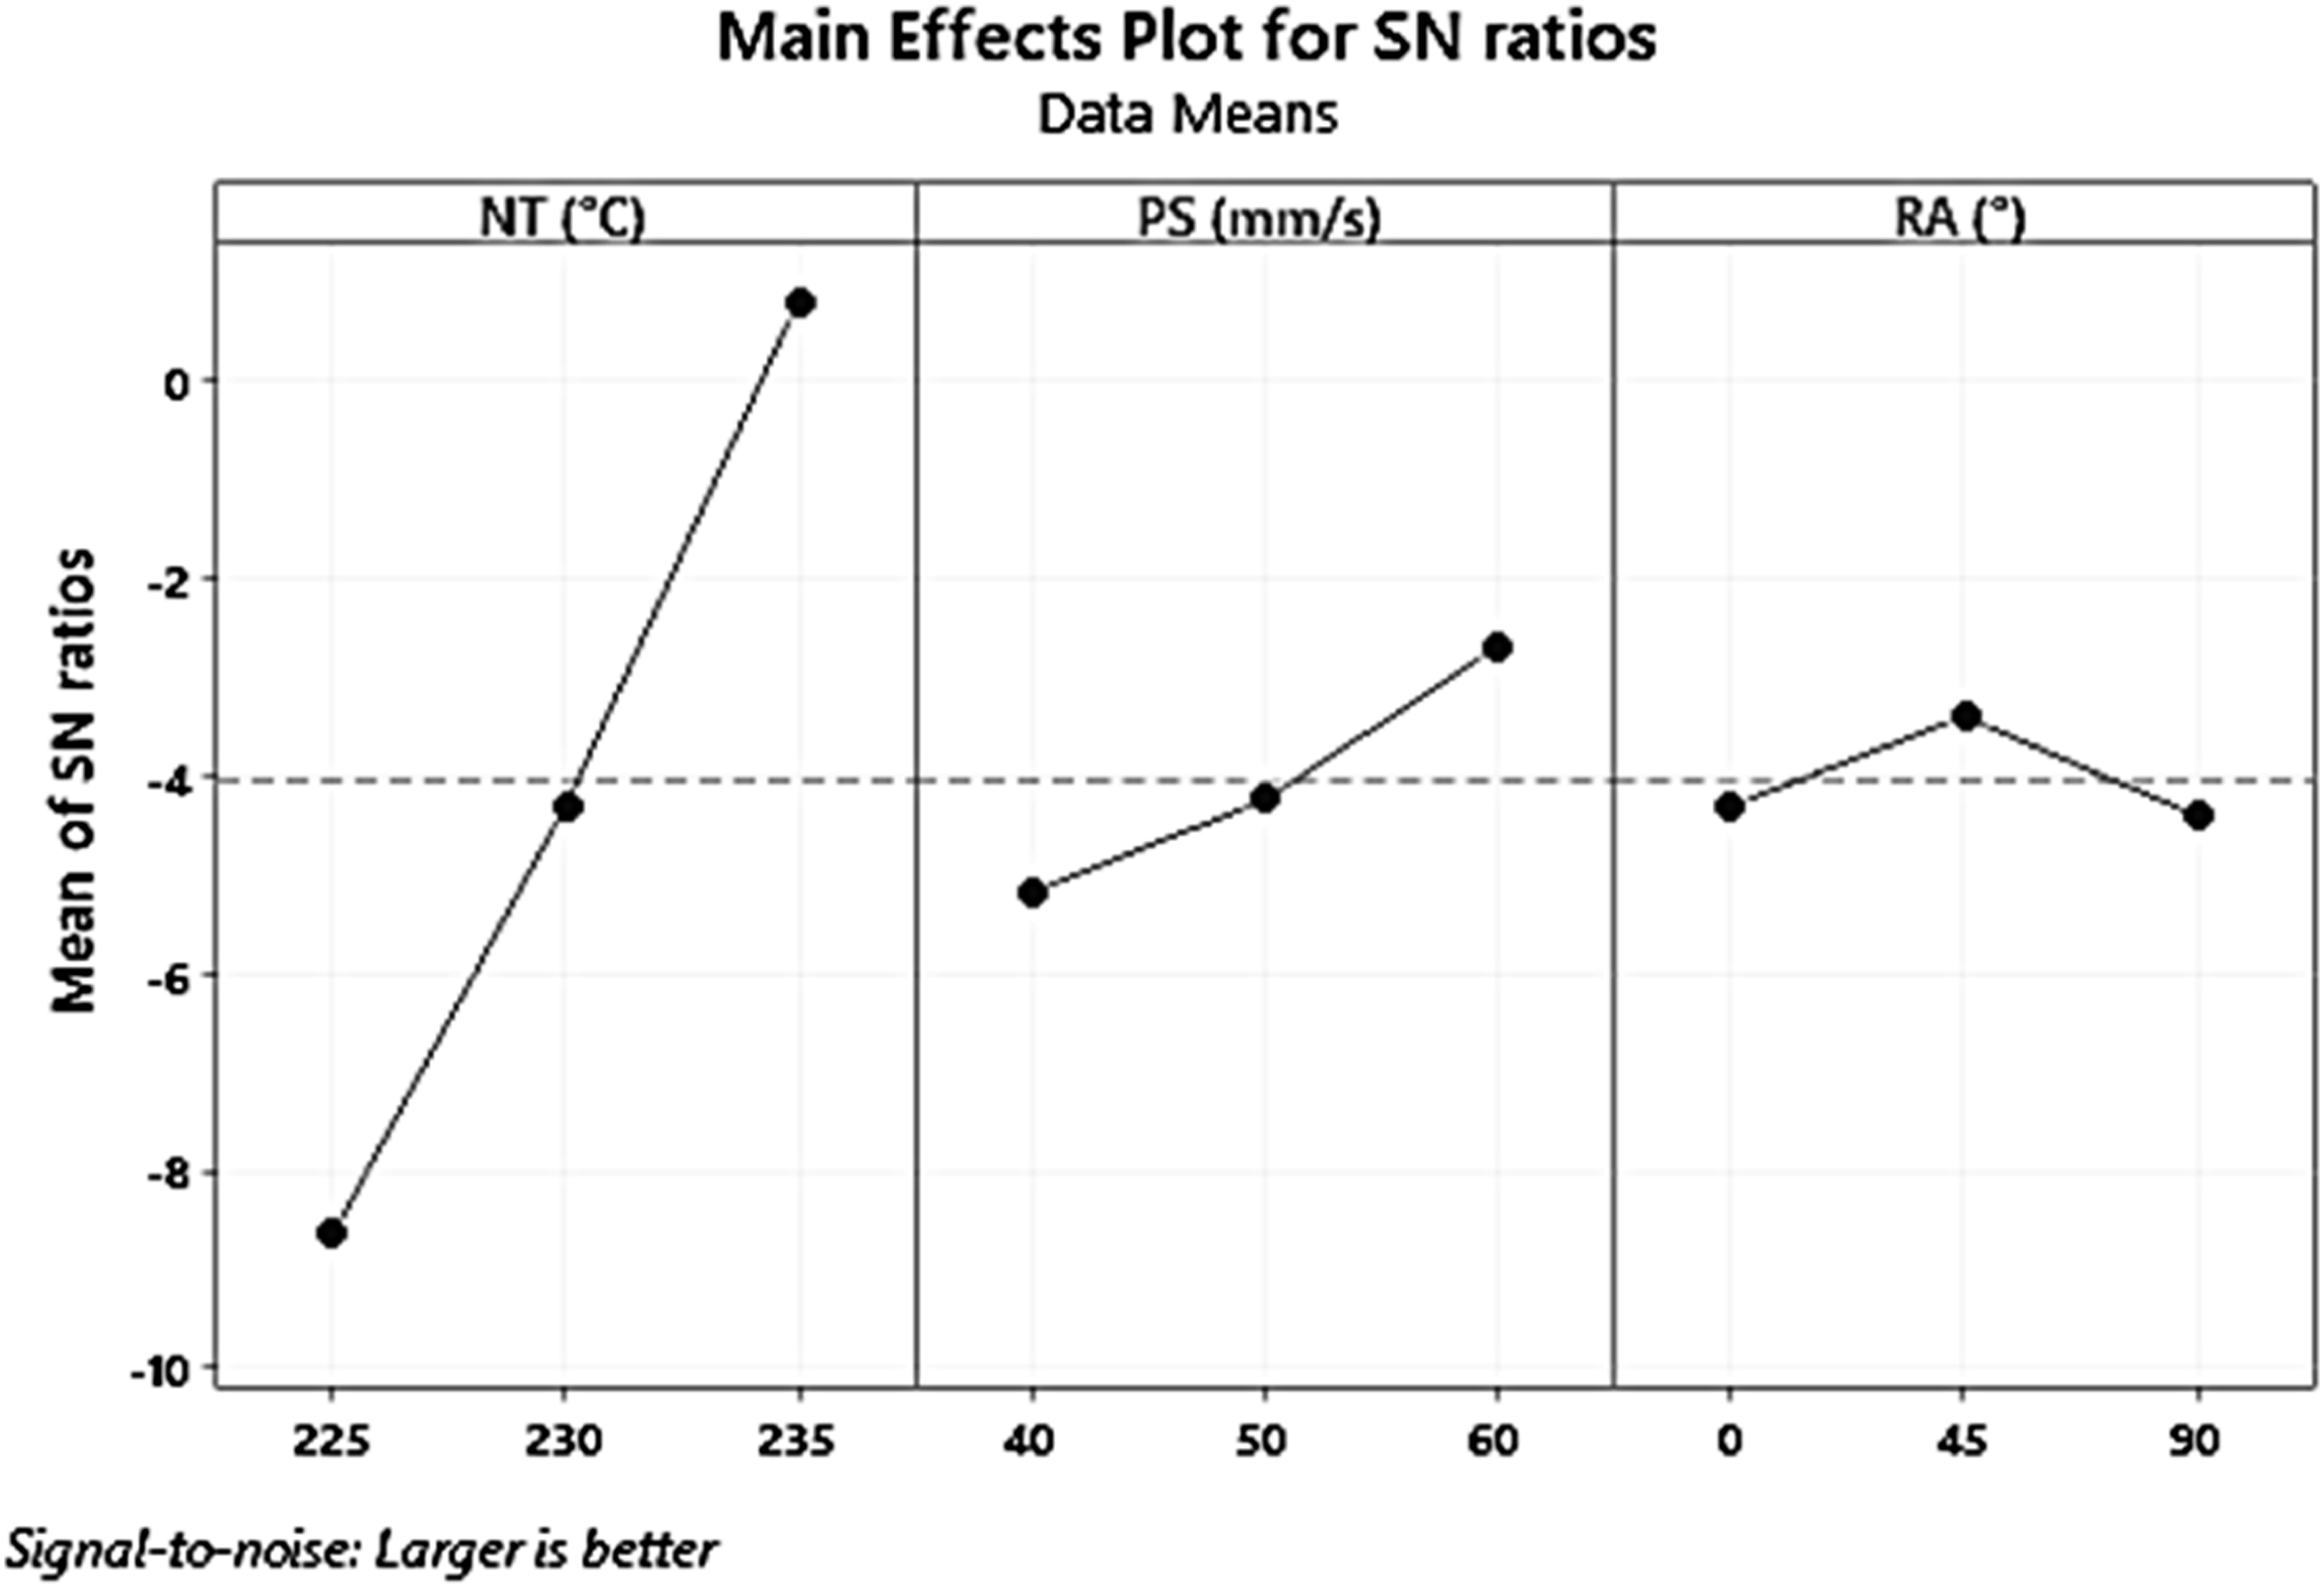
S/N ratios graphs for the main effects of torque.
SEM of best and worst samples before and after torsion (as per Table 4).
Torque analysis of the twist angle for the best and worst samples (as per Table 4).
Morphological analysis at lateral fracture Surface.
Morphological analysis at the cross-section of fracture site.
Matrix for mechanical and morphological properties of selected PVDF composite.
Conclusions
In this study, a PVDF-HAp-CS composite-based torsional specimen as per ASTM-A-938 and ISO-7800 has been successfully printed using an open-source 3D printer. These torsional specimens were tested on a multi-function torque testing machine for the possible application of an IM pin (orthopedic implant). The conclusions of the current study based on the findings of the experiments are as follows: • For IM pin applications in canine implants, excellent torsional properties were noticed in selected PVDF composite. The fracture while torsional loading was noticed at an angle of twist/rotation of 800°. In actual field applications, this angle of twist may be a maximum of 10–15° only. The selected PVDF composite has shown promising results for its use as an implant material under torsional loading. • The ANOVA results highlight that the maximum percentage of contributions of NT (89.25%) was observed followed by PS (6.35%) to maximize the torque value. The signal-to-noise (S/N) ratio (larger is better) of the 3D printing of PVDF composite for maximizing the torsion properties are the NT of 235°C, RA 45°, PS of 60 mm/s respectively resulting in torque 3.44 N-m at the angle of 0–800°. • The R9 sample, which also had the highest torsional value, had a minimum Ra value of 11.38 µm (at the lateral surface), and 2.064 µm (at cross-section), while R1 had a maximum Ra value of 14.76 µm (at lateral), 8.79 µm (at cross section) and other surface characteristics (like ADF, BRC, PC) are in line with the Ra observation. It was found that the R9 sample had fewer voids and uniformly joined succeeding layers, the %porosity of the R9 sample was 15.69% (at lateral) and 12.7% (at cross-section), while the R1 had poor adhesiveness between different layers, the %porosity of R1 sample was observed 22.23% (at lateral) and 15.29% (at cross section) it may be due to the temperature difference between R1 and R9. The grain size number of the R9 sample was observed at 3.75 (at lateral), 2.5 (at cross-section), while in the R1 sample 2.5 (at lateral), 1.5 (at cross-section).
The PVDF is one of the established piezoelectric materials, which has shown very good torsional properties in the present case study. Further studies may be conducted to ascertain the beta phase in PVDF composite while torsional loading, which may be used for making the digital twin of the implant material in field applications.
Footnotes
Acknowledgements
The authors acknowledge the research support provided by the National Institute of Technical Teachers Training and Research, Chandigarh (India).
Declaration of conflicting interests
The author(s) declared no potential conflicts of interest with respect to the research, authorship, and/or publication of this article.
Funding
The author(s) disclosed receipt of the following financial support for the research, authorship, and/or publication of this article: This work was supported by the Department of Science and Technology for funding under FIST Level-0, Project No. SR/FST/College-/2020/997.