
Abstract
Polyvinylidene fluoride (PVDF) is one of the established thermoplastics with inherent piezoelectric characteristics. In the past two decades, a lot of work has been reported on the use of virgin Polyvinylidene fluoride thermoplastics for sensing applications. But hitherto little has been reported on 3D printing of secondary (2°) recycled Polyvinylidene fluoride as a smart energy storage device (ESD). This work is focused on exploring the possibilities for 3D printing of smart energy storage device comprising of Polyvinylidene fluoride having (melt flow index (MFI) 30g/(10 min) as per ASTM D 1238) reinforced with MnO2, graphite, ZnCl2, and N
Keywords
Introduction
Additive manufacturing (AM)/3D printing is being widely used for creating a 3D object through a digital mode involving successive layers of material. 1 Various slicing methods have been adopted by researchers to overcome the issue of build time2,3 and surface quality 4 in 3D printing. 5 In today’s scenario, various smart materials such as shape memory and piezoelectric materials have gained the limelight due to their unique potential to retain their desired shape when activated by external stimuli.6–8 Piezoelectric materials also have the unique ability to produce voltage under some external load which increases their effectiveness in energy harvesting and structural health monitoring applications.9,10 Piezoelectric materials such as lead zirconate titanate and ZnO have been extensively utilized by researchers for transducer applications. 11 The accumulation of energy in any particular form is one of the better alternatives to cope with the demand and supply of energy. One such method of energy storage in the form of a dry cell has been in commercial practice for a long. 12
In the past two decades, extensive work has been reported on recycling thermoplastics by reinforcing them with metallic powders.
12
Further preparation of feedstock filament of different reinforced materials using a 3D printer based on FDM has been reported by several researchers.13,14 Two different 3D printing techniques namely inkjet and direct writing have been widely adopted by the researchers for the electro-chemical ESD.
15
The literature emphasizes reinforcement of different chemicals into thermoplastics made them conductive and hence possess better mechanical, thermal, and electrical properties.
16
Researchers have cited the applications of 3D printing for the fabrication of devices namely sensors, conductors,
17
feedstock filament based on FDM,
18
wear-resisting materials,
19
the stretchable electrode for flexible supercapacitors,
20
4D applications for PVDF reinforced with graphene and barium titanate,
21
pressure sensing using piezo-resistive materials reinforced with carbon nanotubes,
22
heritage structures.
23
A comparative analysis of both mechanically, as well as chemically blended composites of PVDF matrix reinforced with graphene and barium titanate for 3D printing applications, has been reported by the researchers.
24
The main characteristic of dry cells is the conversion of chemical energy into electrical energy and literature has been reported on the types and construction of the dry cell.
25
Usually, cells are categorized into primary (non-rechargeable) and secondary (rechargeable). The construction of a dry cell consists of a graphite rod in the center acting as a cathode. The graphite rod is surrounded by Mn
Experimentation
Observations for mechanical properties of PVDF (with three repetitions).
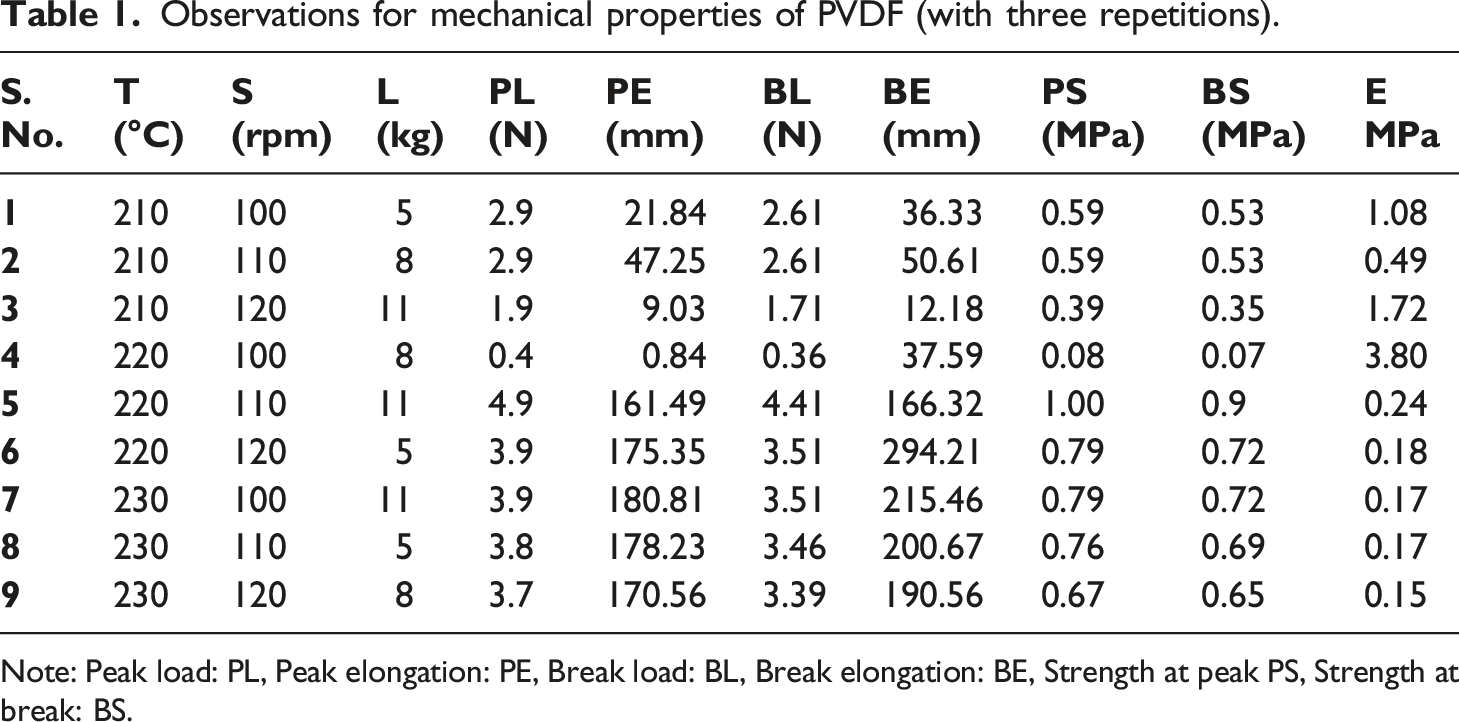
Note: Peak load: PL, Peak elongation: PE, Break load: BL, Break elongation: BE, Strength at peak PS, Strength at break: BS.
MFI values (average of three observations) for different compositions/proportions.
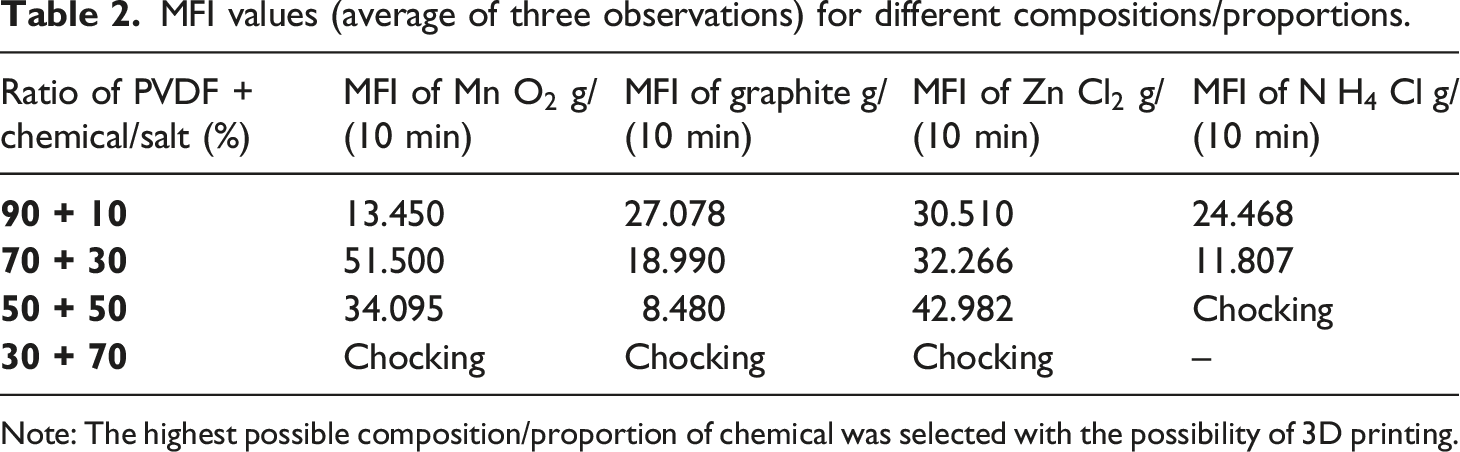
Note: The highest possible composition/proportion of chemical was selected with the possibility of 3D printing.
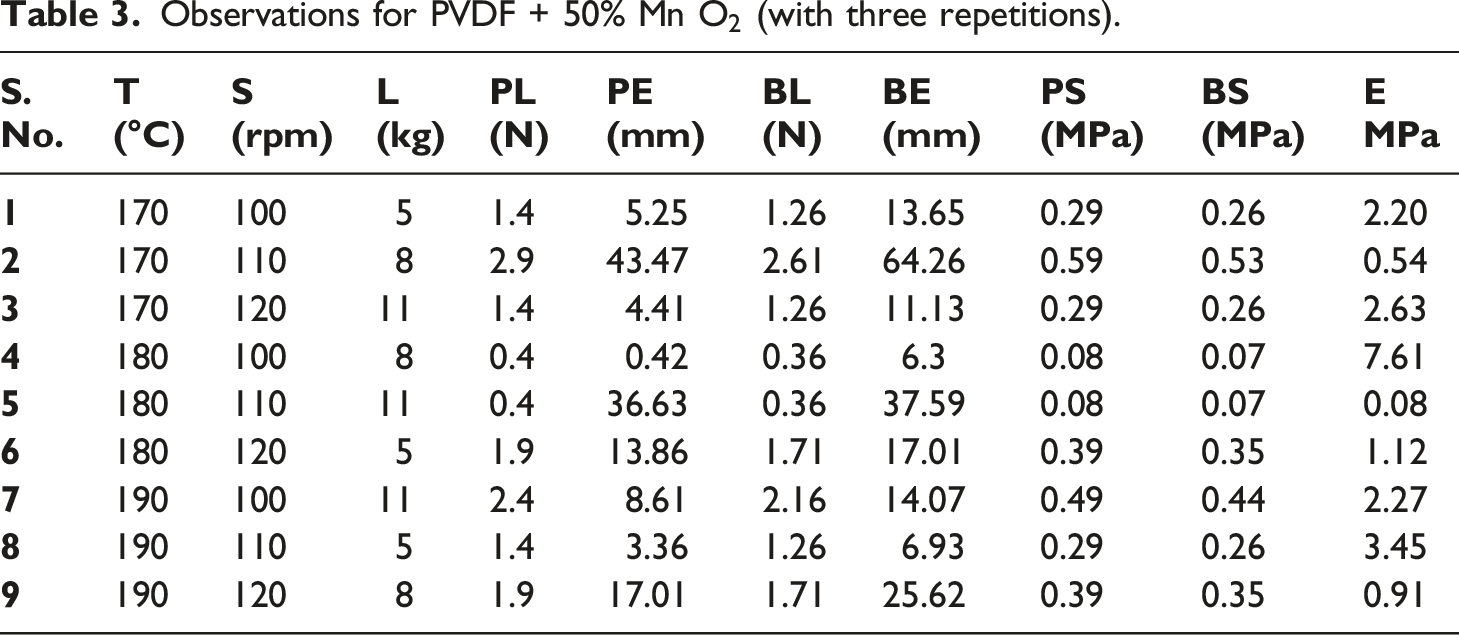
Observations for PVDF + 50% Mn
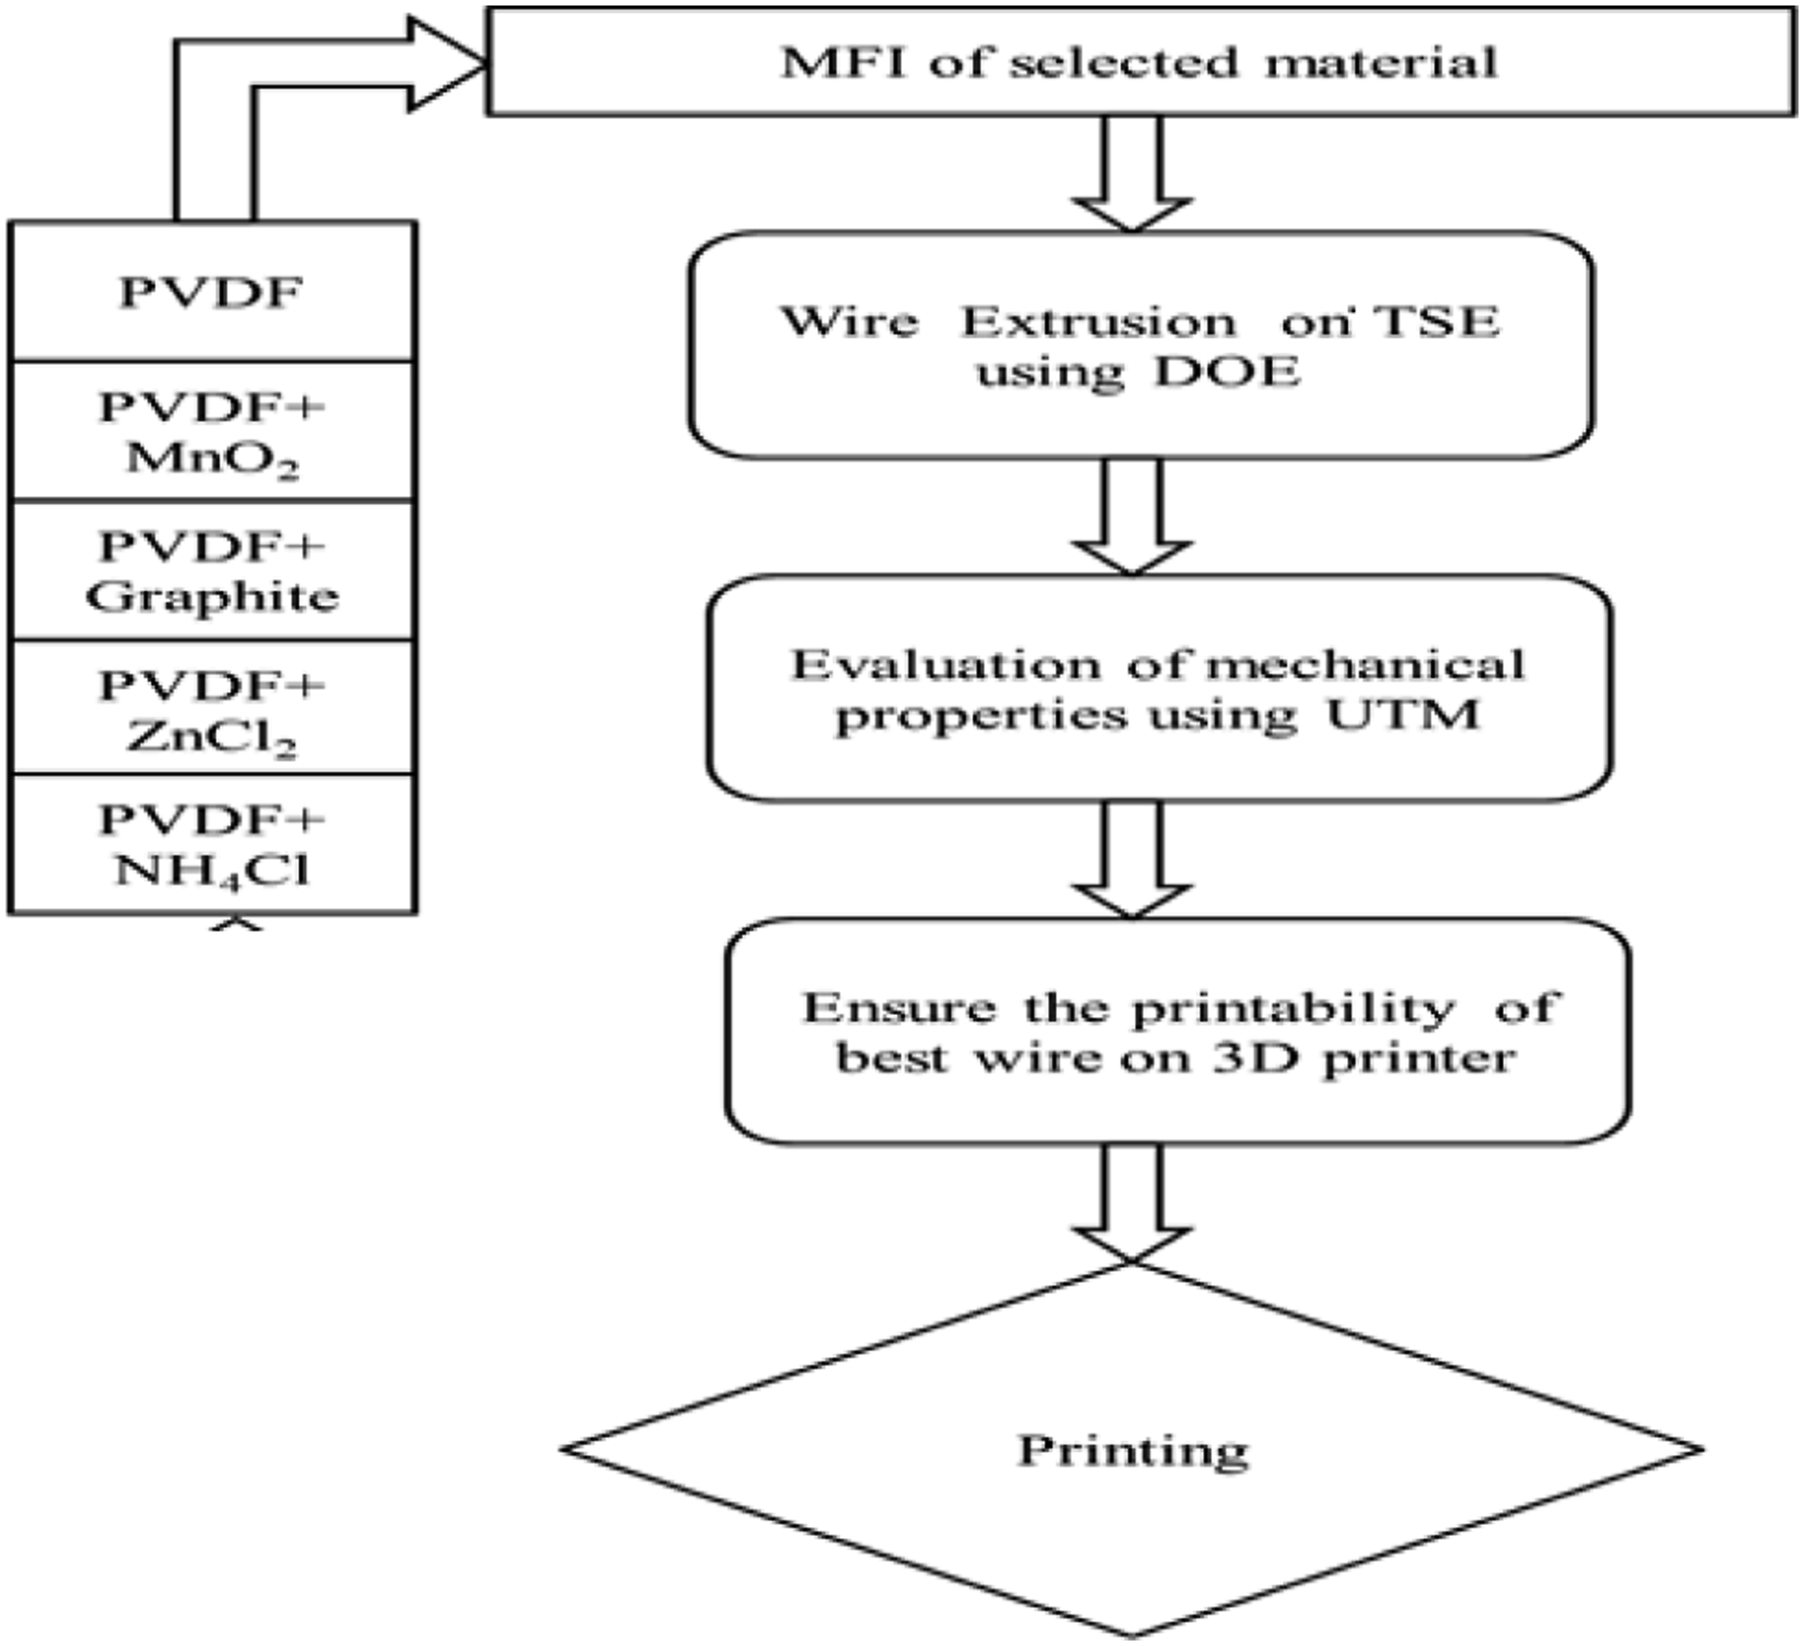
Flow diagram for experimental methodology (stage 1).
It may be noted that a significant dip in processing temperature conditions for PVDF (210°C–230°C, Table 1) and PVDF matrix (170°C–190°C Table 3) was selected. Since the melting range of PVDF lies at 210°C–230°C, the same was selected for processing PVDF (Table 1). The addition of MnO2 resulted in lowering the melting range of the composite matrix therefore the processing condition of 170°C–190°C was selected. This was based upon uniform diameter wire (φ 1.75 ± 0.10 mm) preparation on TSE, over burning of samples at a temperature higher than 190°C (visual observations).
Based upon Figure 1, Tables 1 and 3 samples at S.No. 4 (of PVDF, PVDF-MnO2) were explored for 3D printing on FDM at different process parameters (infill density, print bed/nozzle temperature, infill patterns, raster angle, infill speed, etc.). However unsuccessful printing was observed. A similar trend was noticed for the 3D printing of PVDF with graphite, ZnCl2, and NH4Cl.
MFI values for different salts reinforced into PVDF matrix (60%PVDF+40% LDPE).
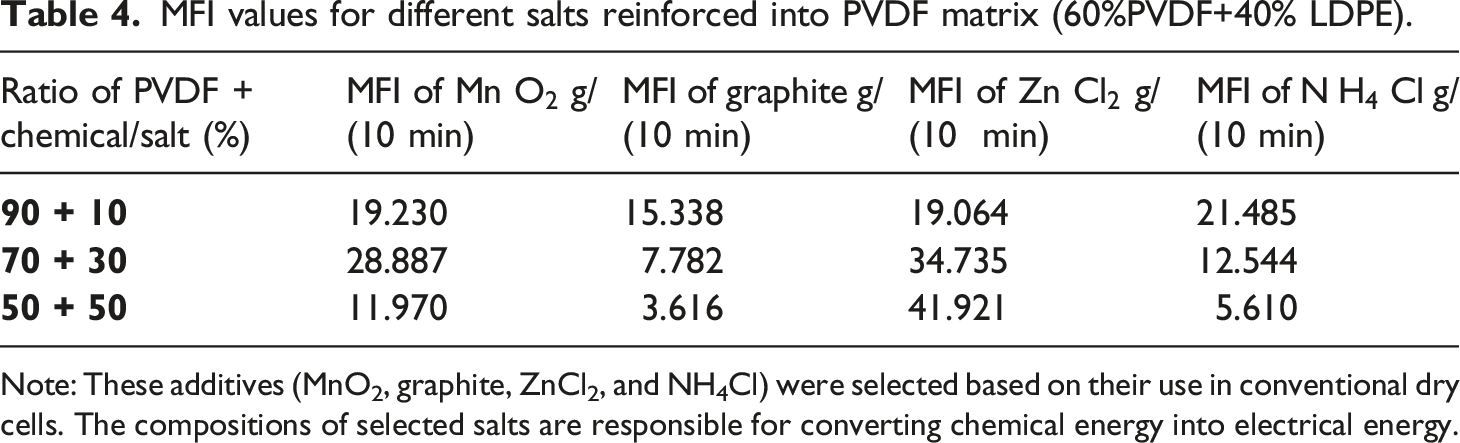
Note: These additives (MnO2, graphite, ZnCl2, and NH4Cl) were selected based on their use in conventional dry cells. The compositions of selected salts are responsible for converting chemical energy into electrical energy.
Observations for PVDF matrix (60% PVDF+40% LDPE) + 50% MnO2 (with three repetitions).
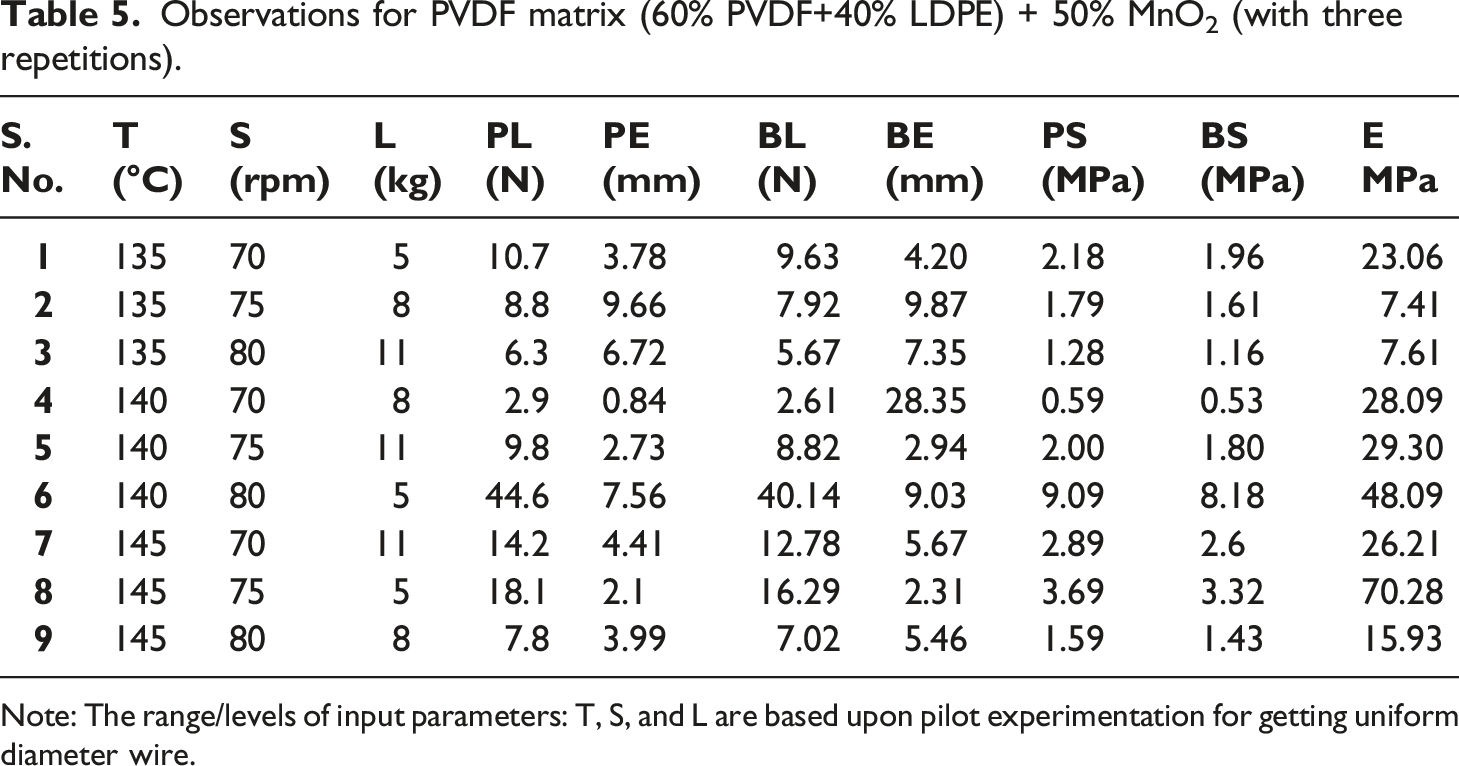
Note: The range/levels of input parameters: T, S, and L are based upon pilot experimentation for getting uniform diameter wire.
Based upon Table 5, S.No.8 with higher E was selected for 3D printing on FDM, and successful printing as substrate was achieved at 55°C bed temperature, 160°C nozzle temperature, raster angle 0°, with rectilinear infill pattern. Similarly, successful printing of PVDF matrix (60% PVDF+40% LDPE) + 50% Graphite/NH4Cl/ZnCl2 was achieved (Figure 2). 3D printing of PVDF matrix (60% PVDF+40% LDPE) + 50% Graphite/MnO2/NH4Cl/ZnCl2 with two nozzle 3D printer. Note: The dual-nozzle system (open-source commercial setup Prusa 3D printer, with build volume 360 × 360 × 360 mm) was used to feed different feedstock filaments.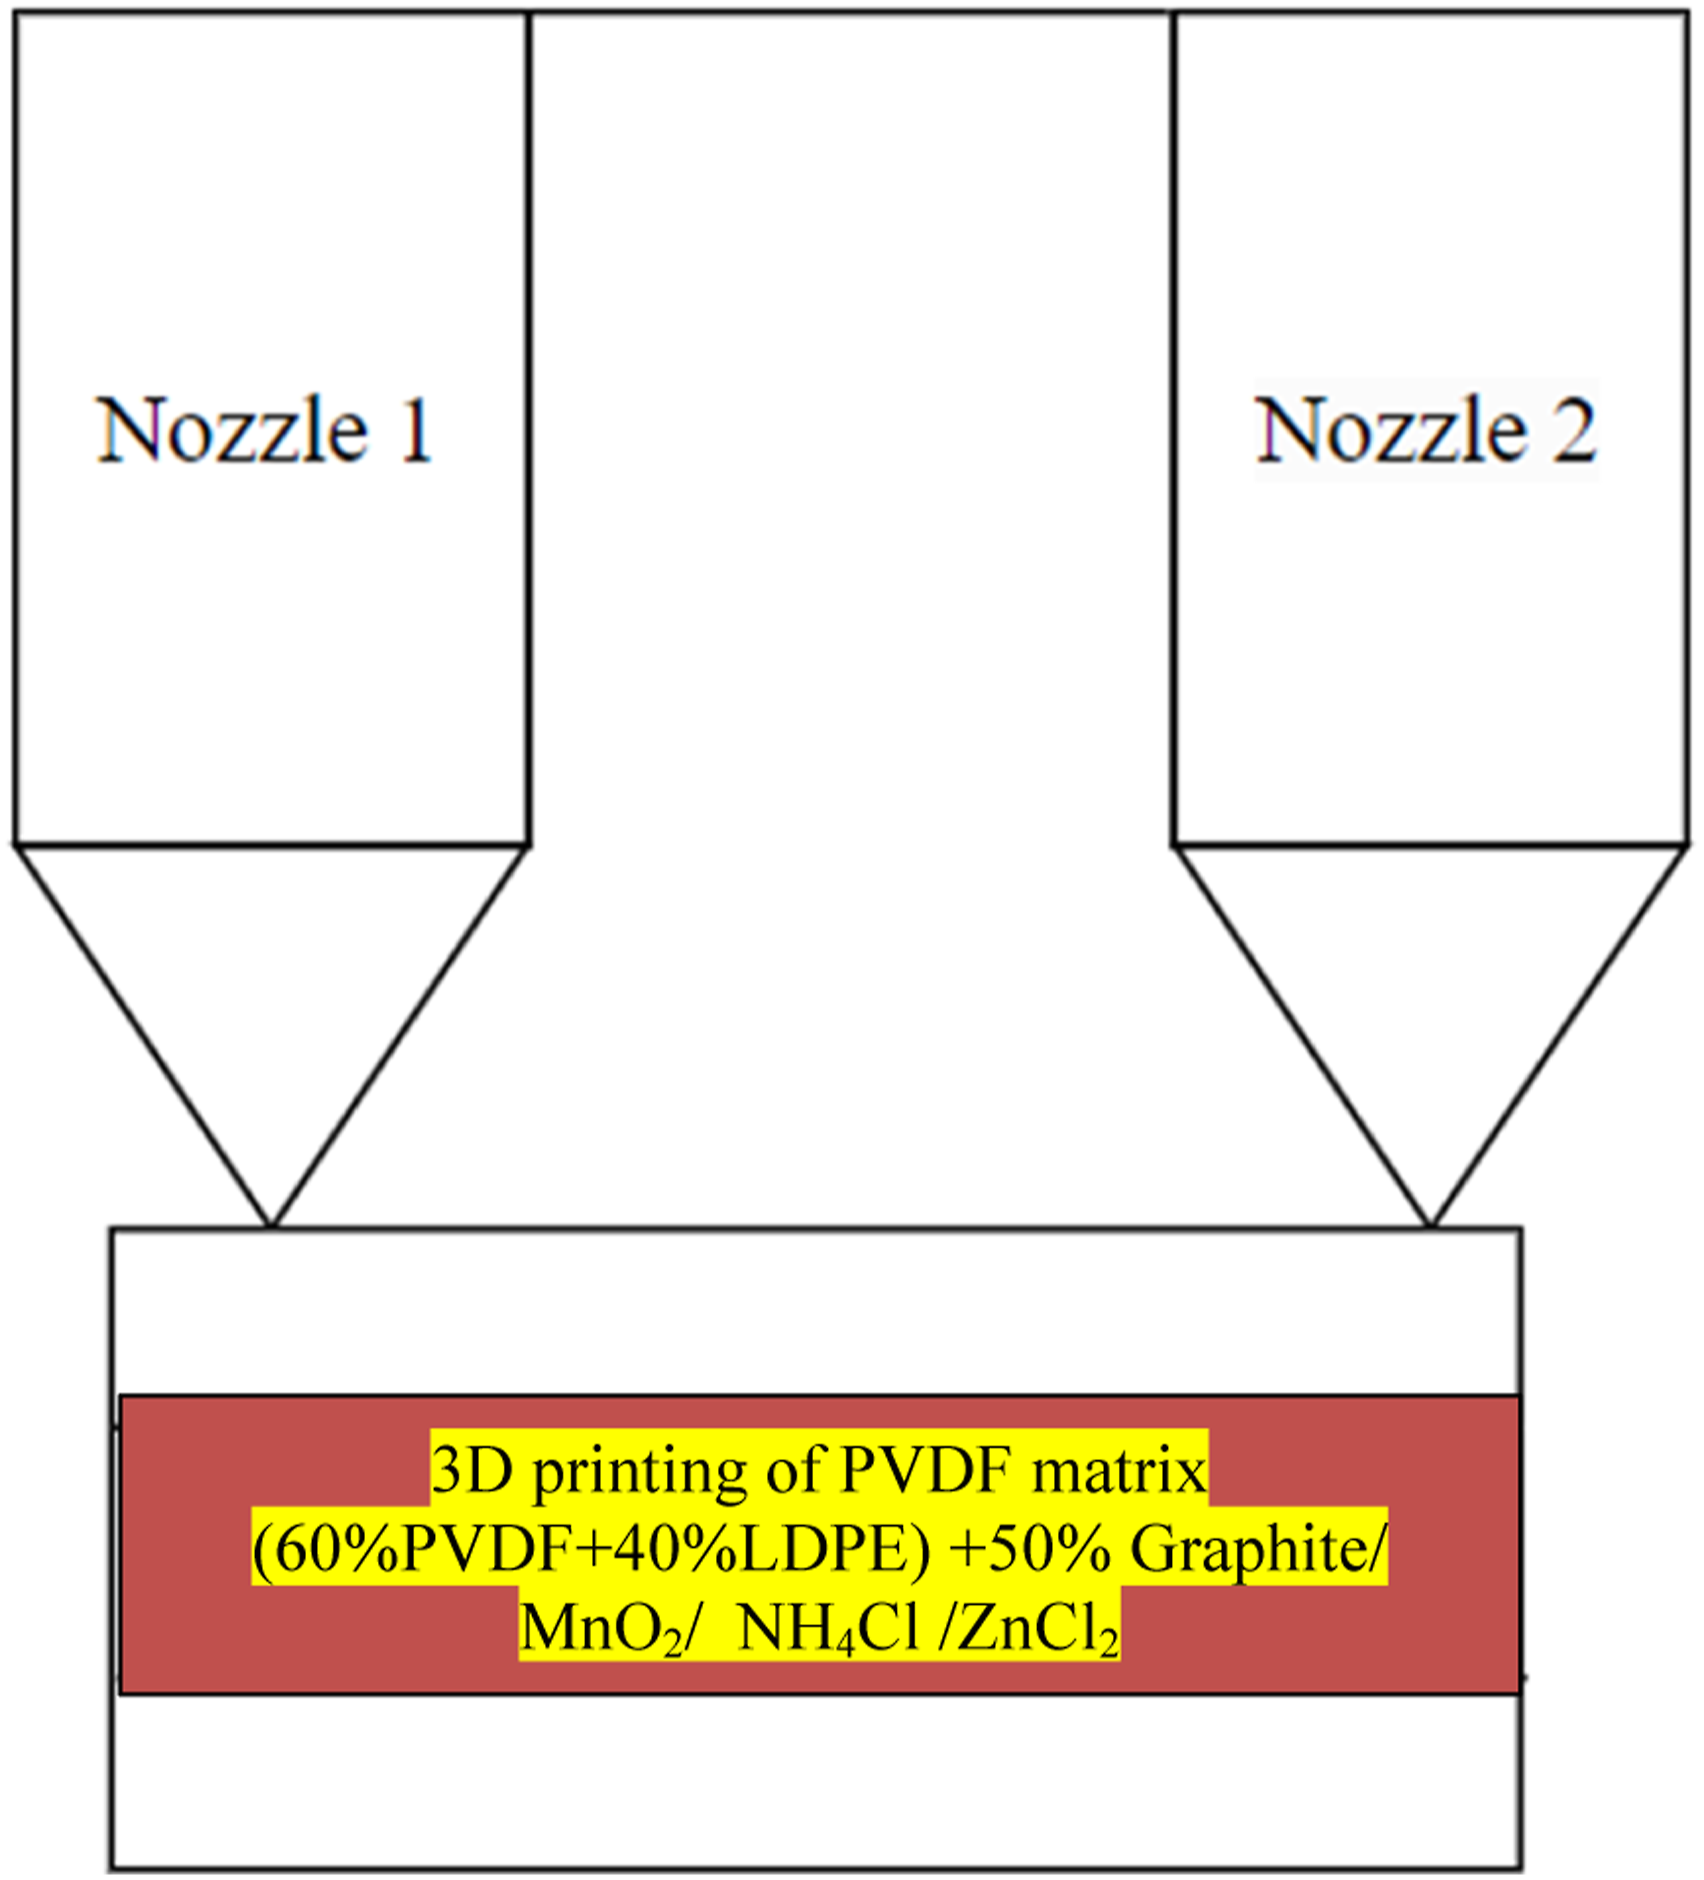
Results and discussion
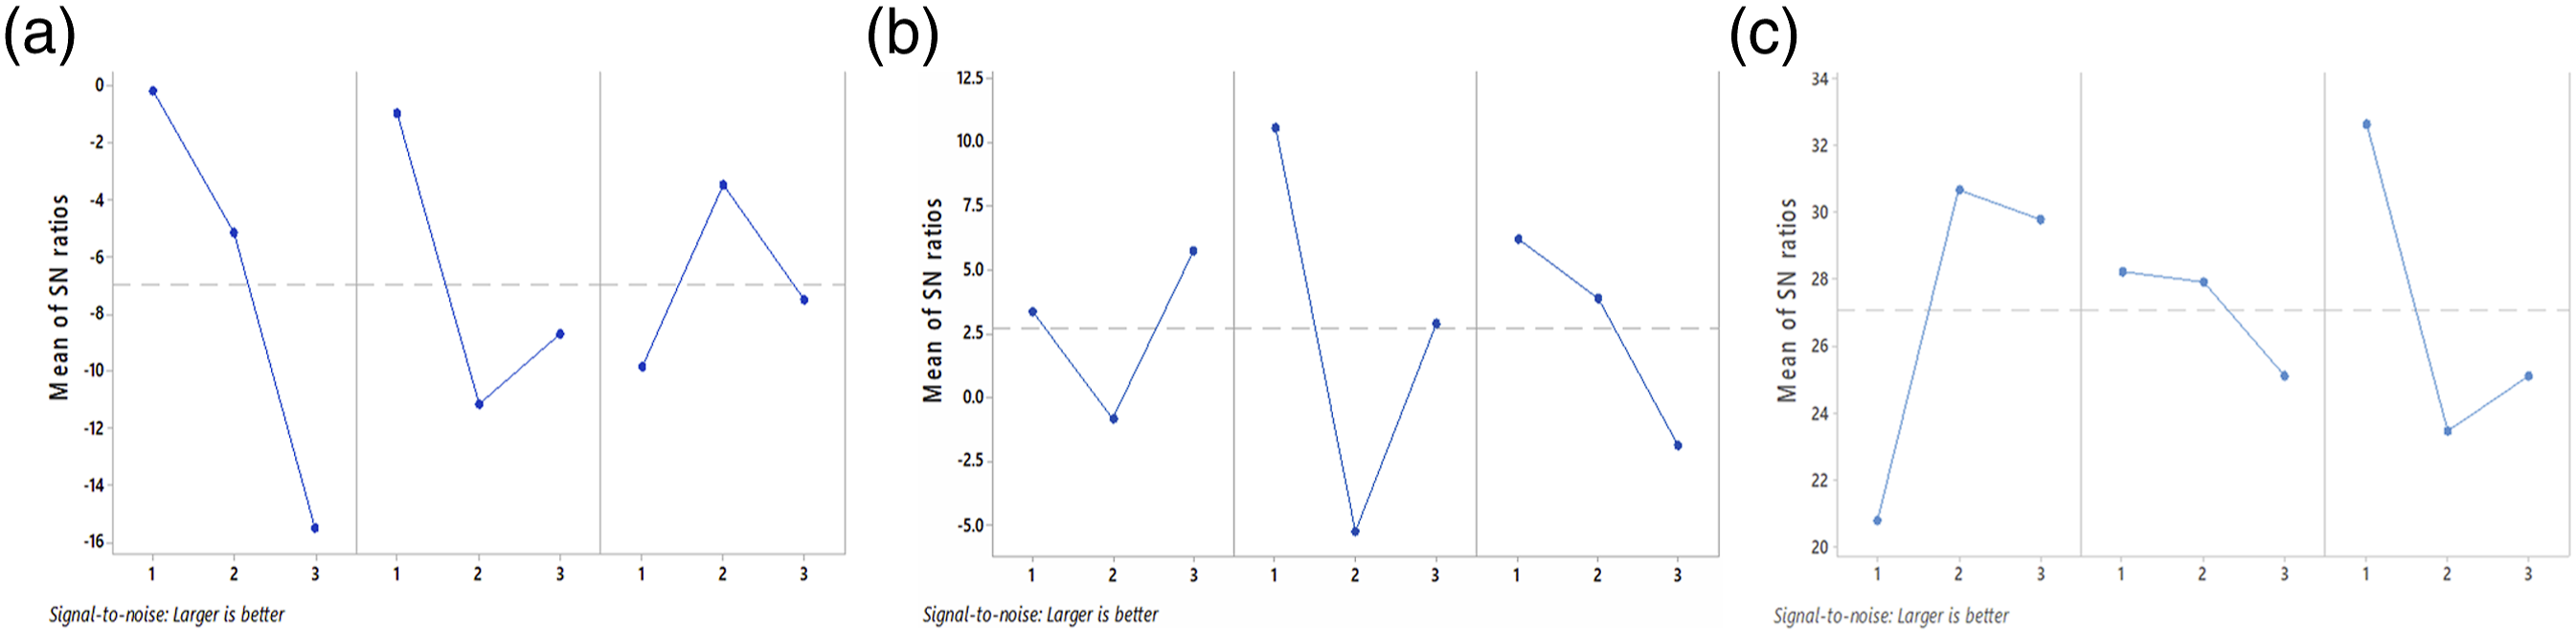
SN ratios for E.
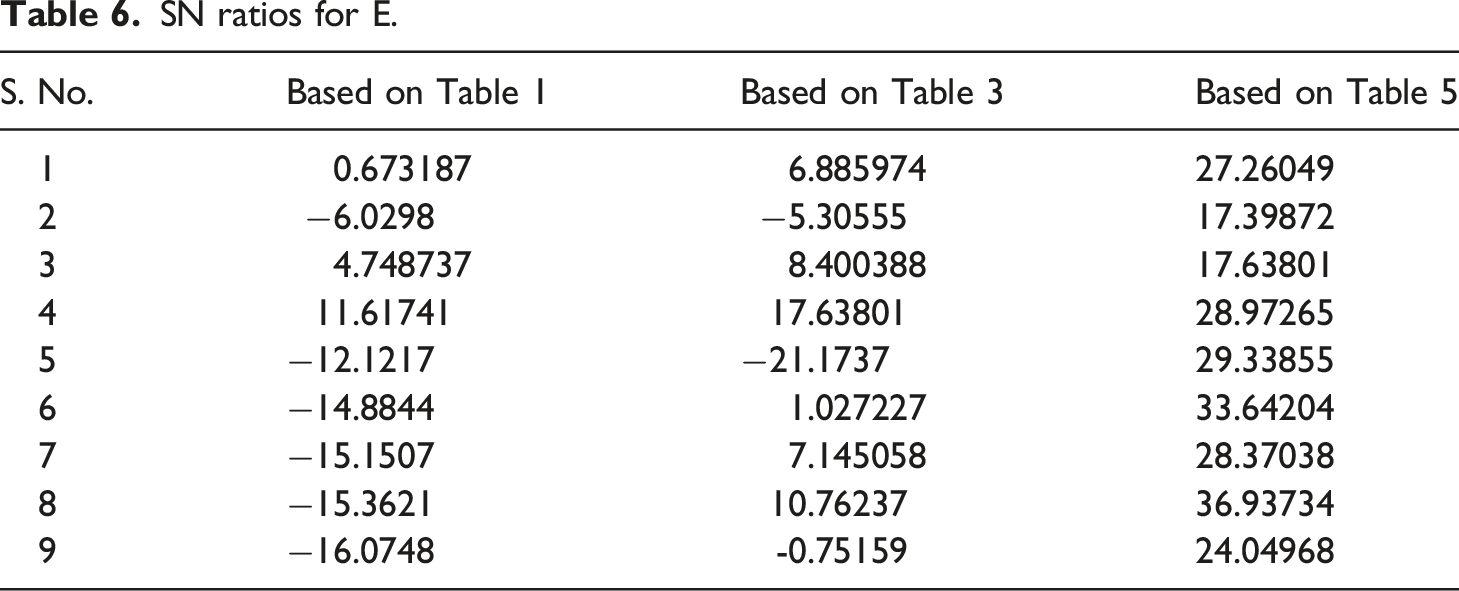
ANOVA for SN ratios (as per Table 6).
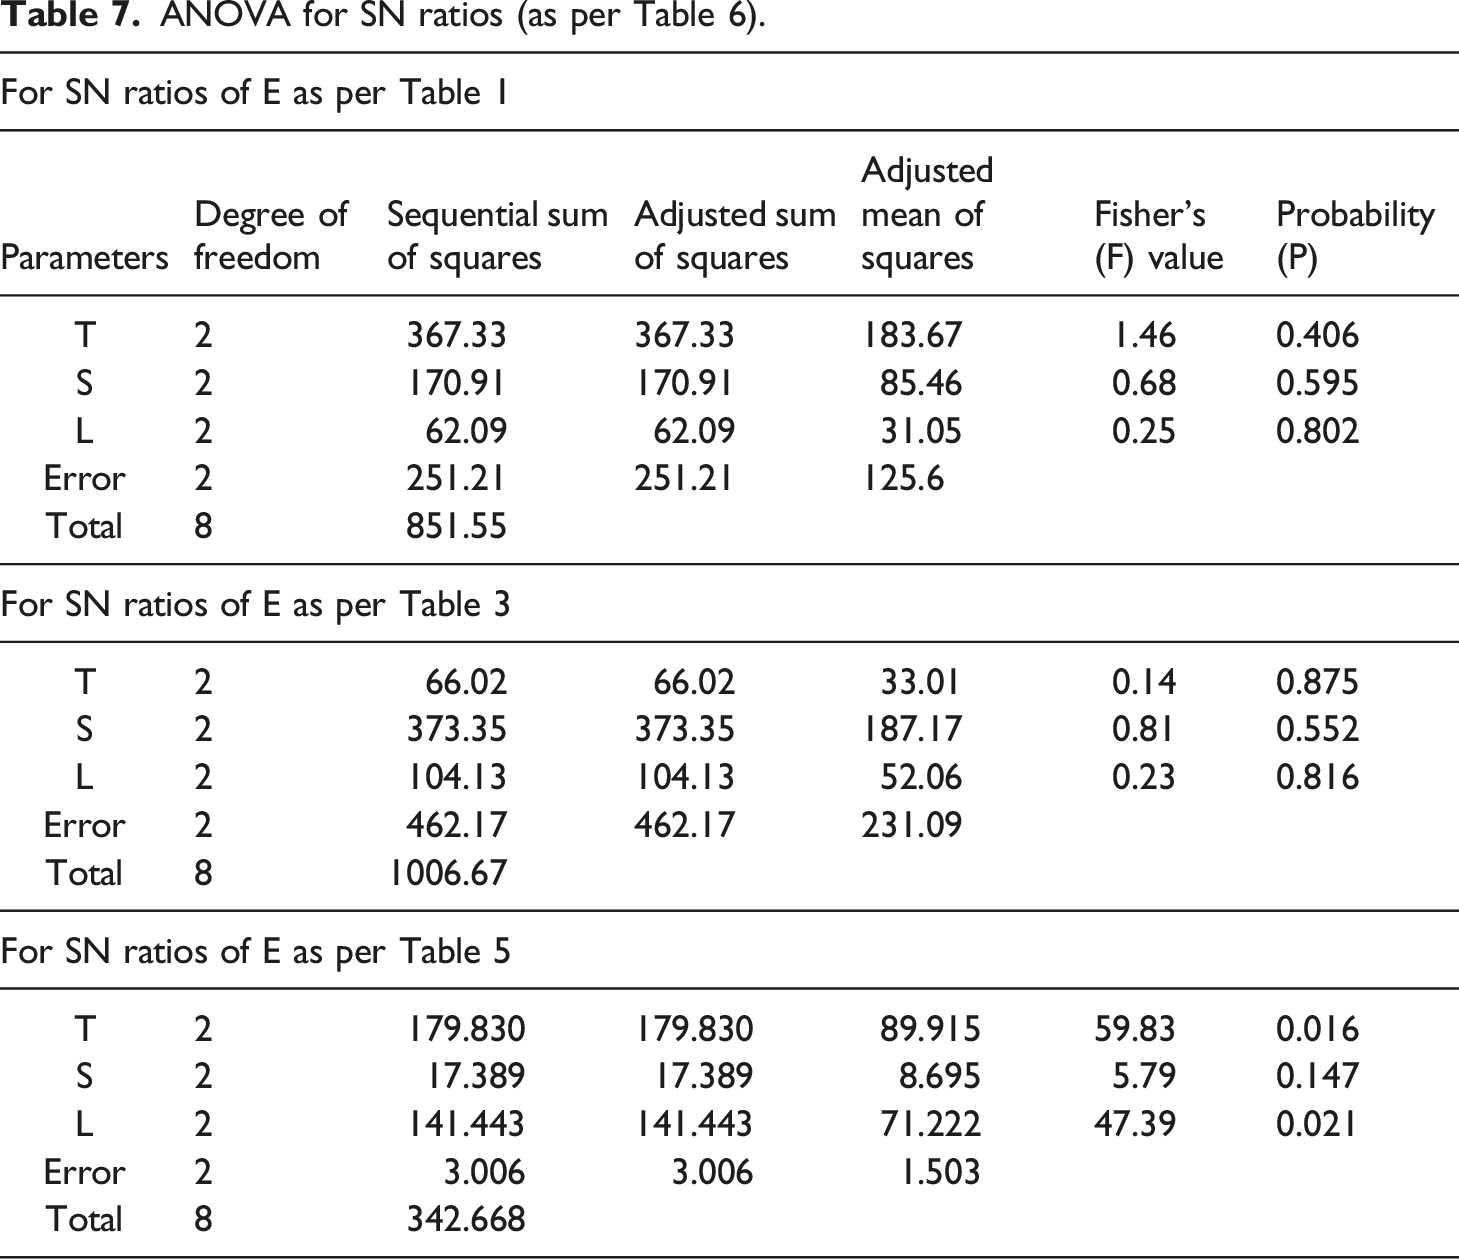
Based upon Table 7, it has been ascertained that no TSE parameter was found significant at a 95% confidence level for E in the case of PVDF and PVDF + 50% Mn
For further analysis, the extruded filaments of recycled PVDF and PVDF reinforced with Mn 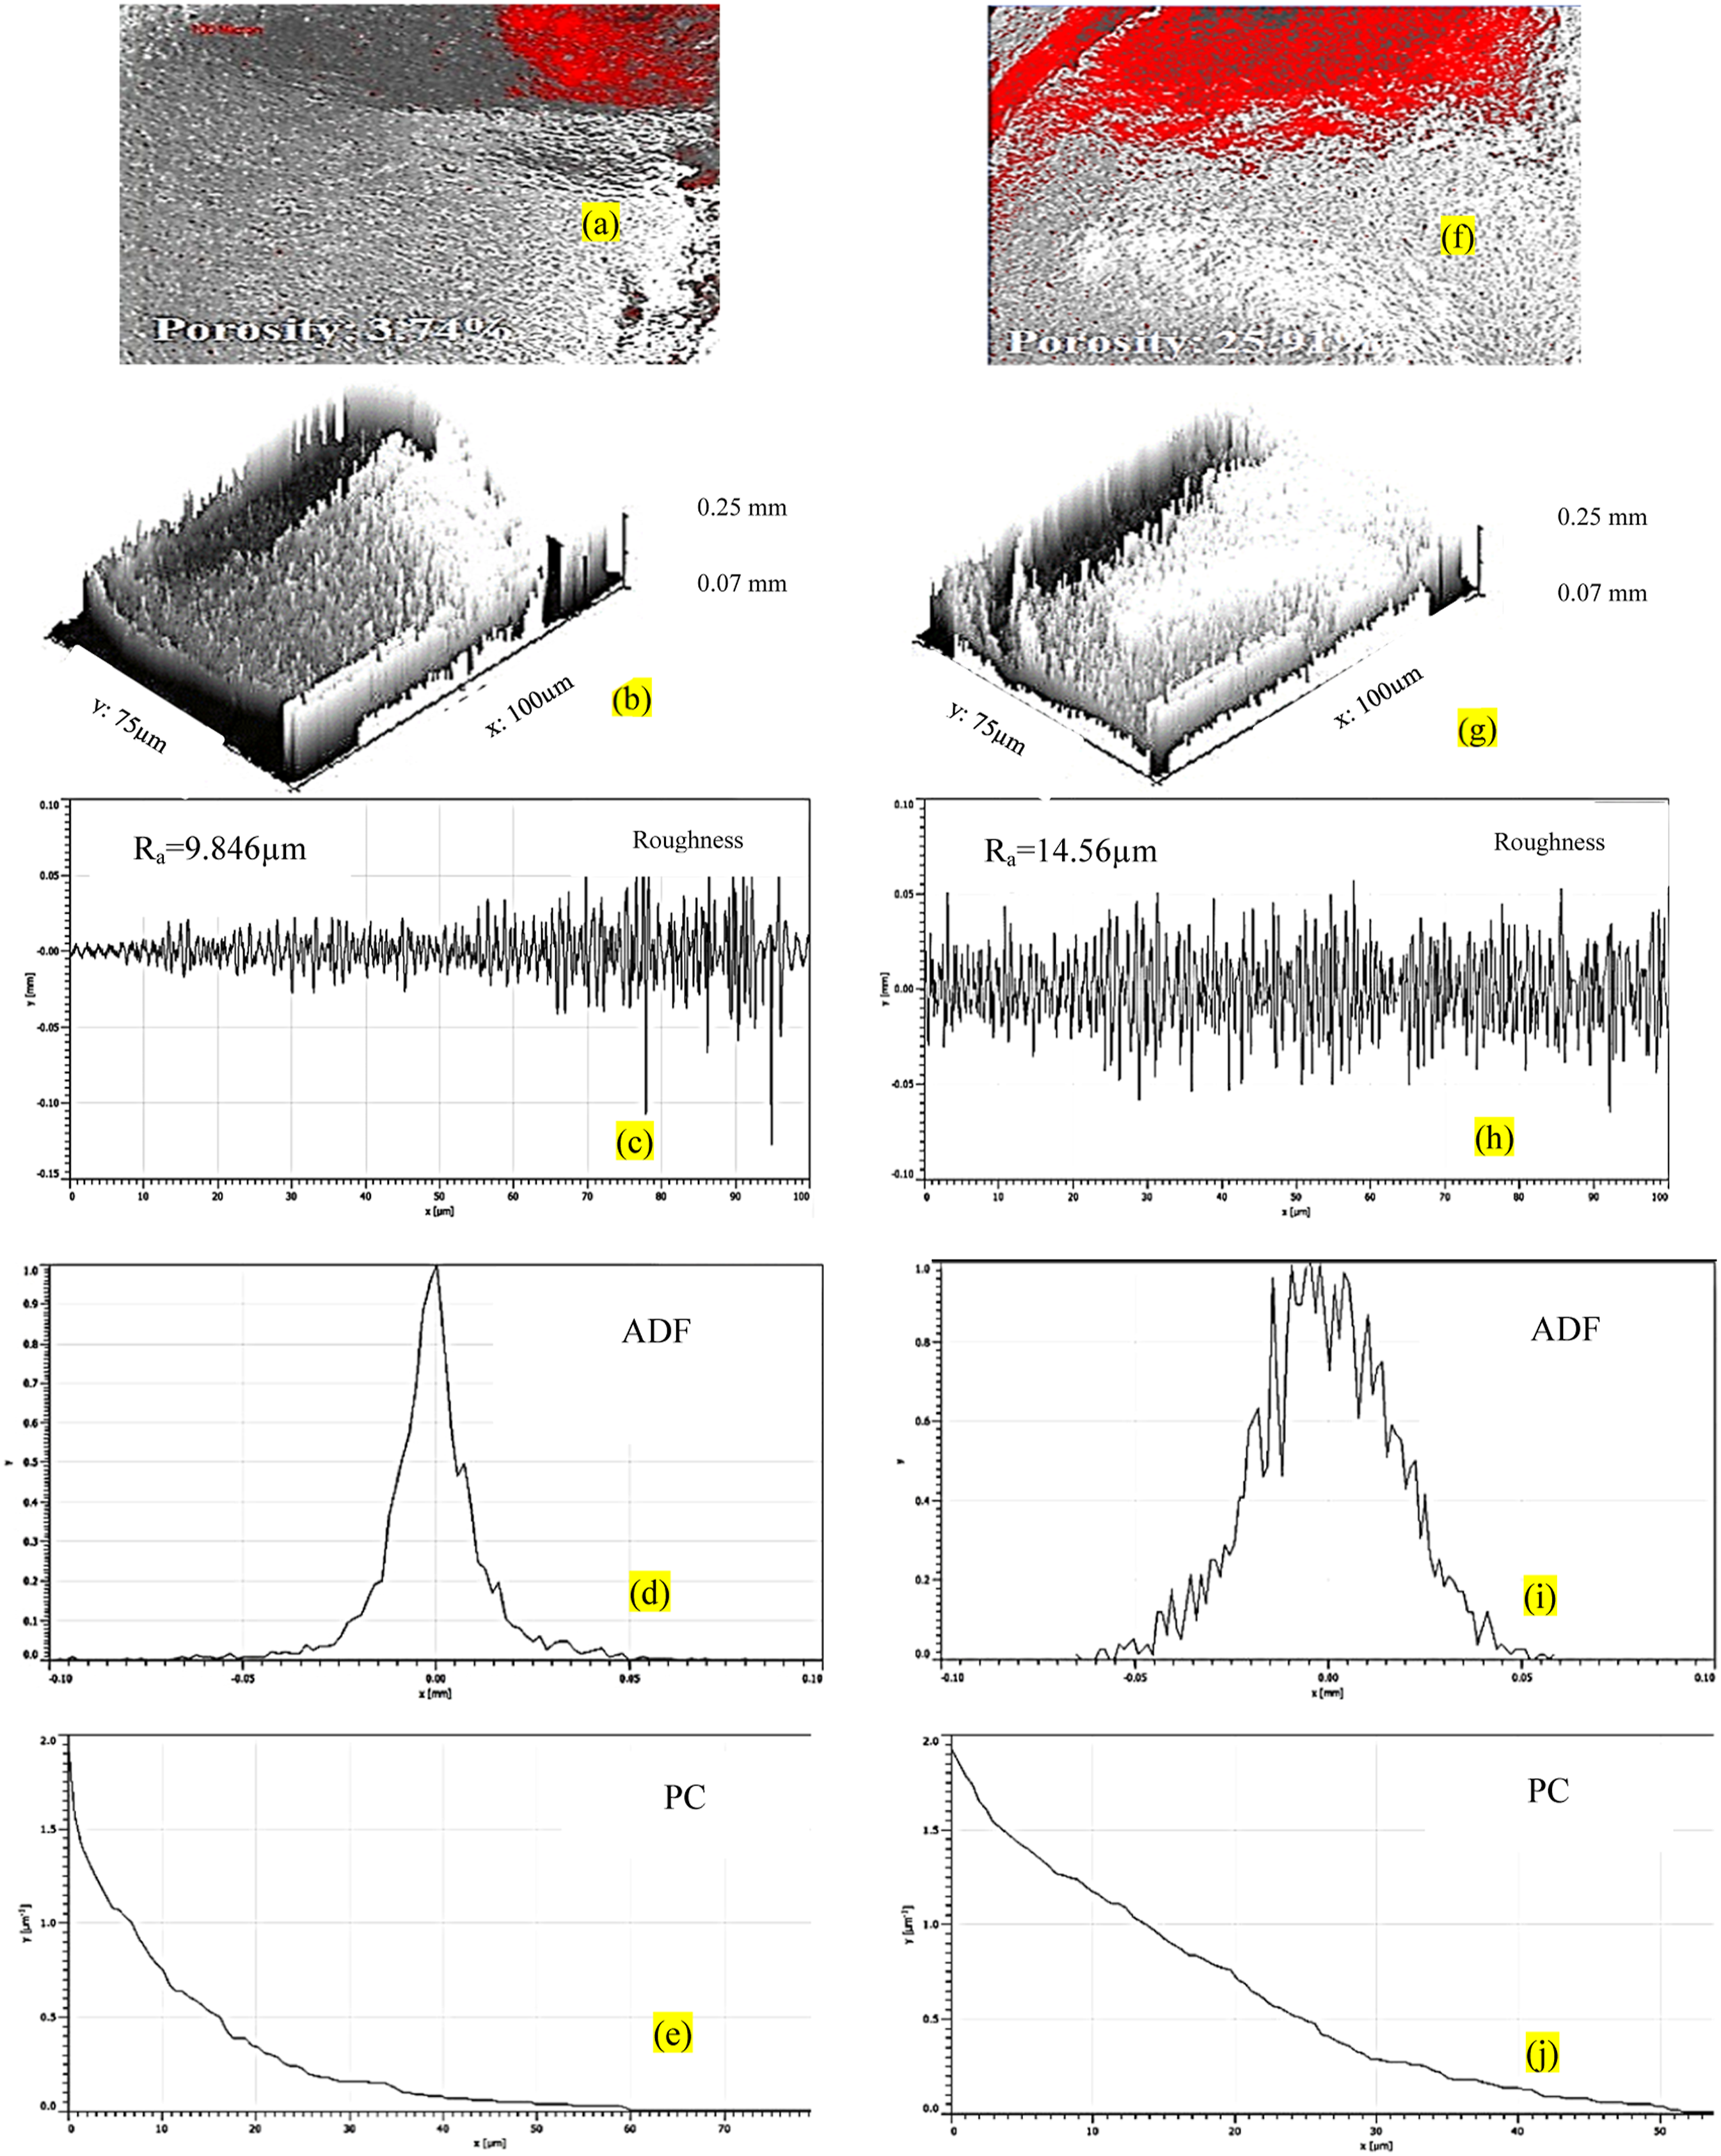
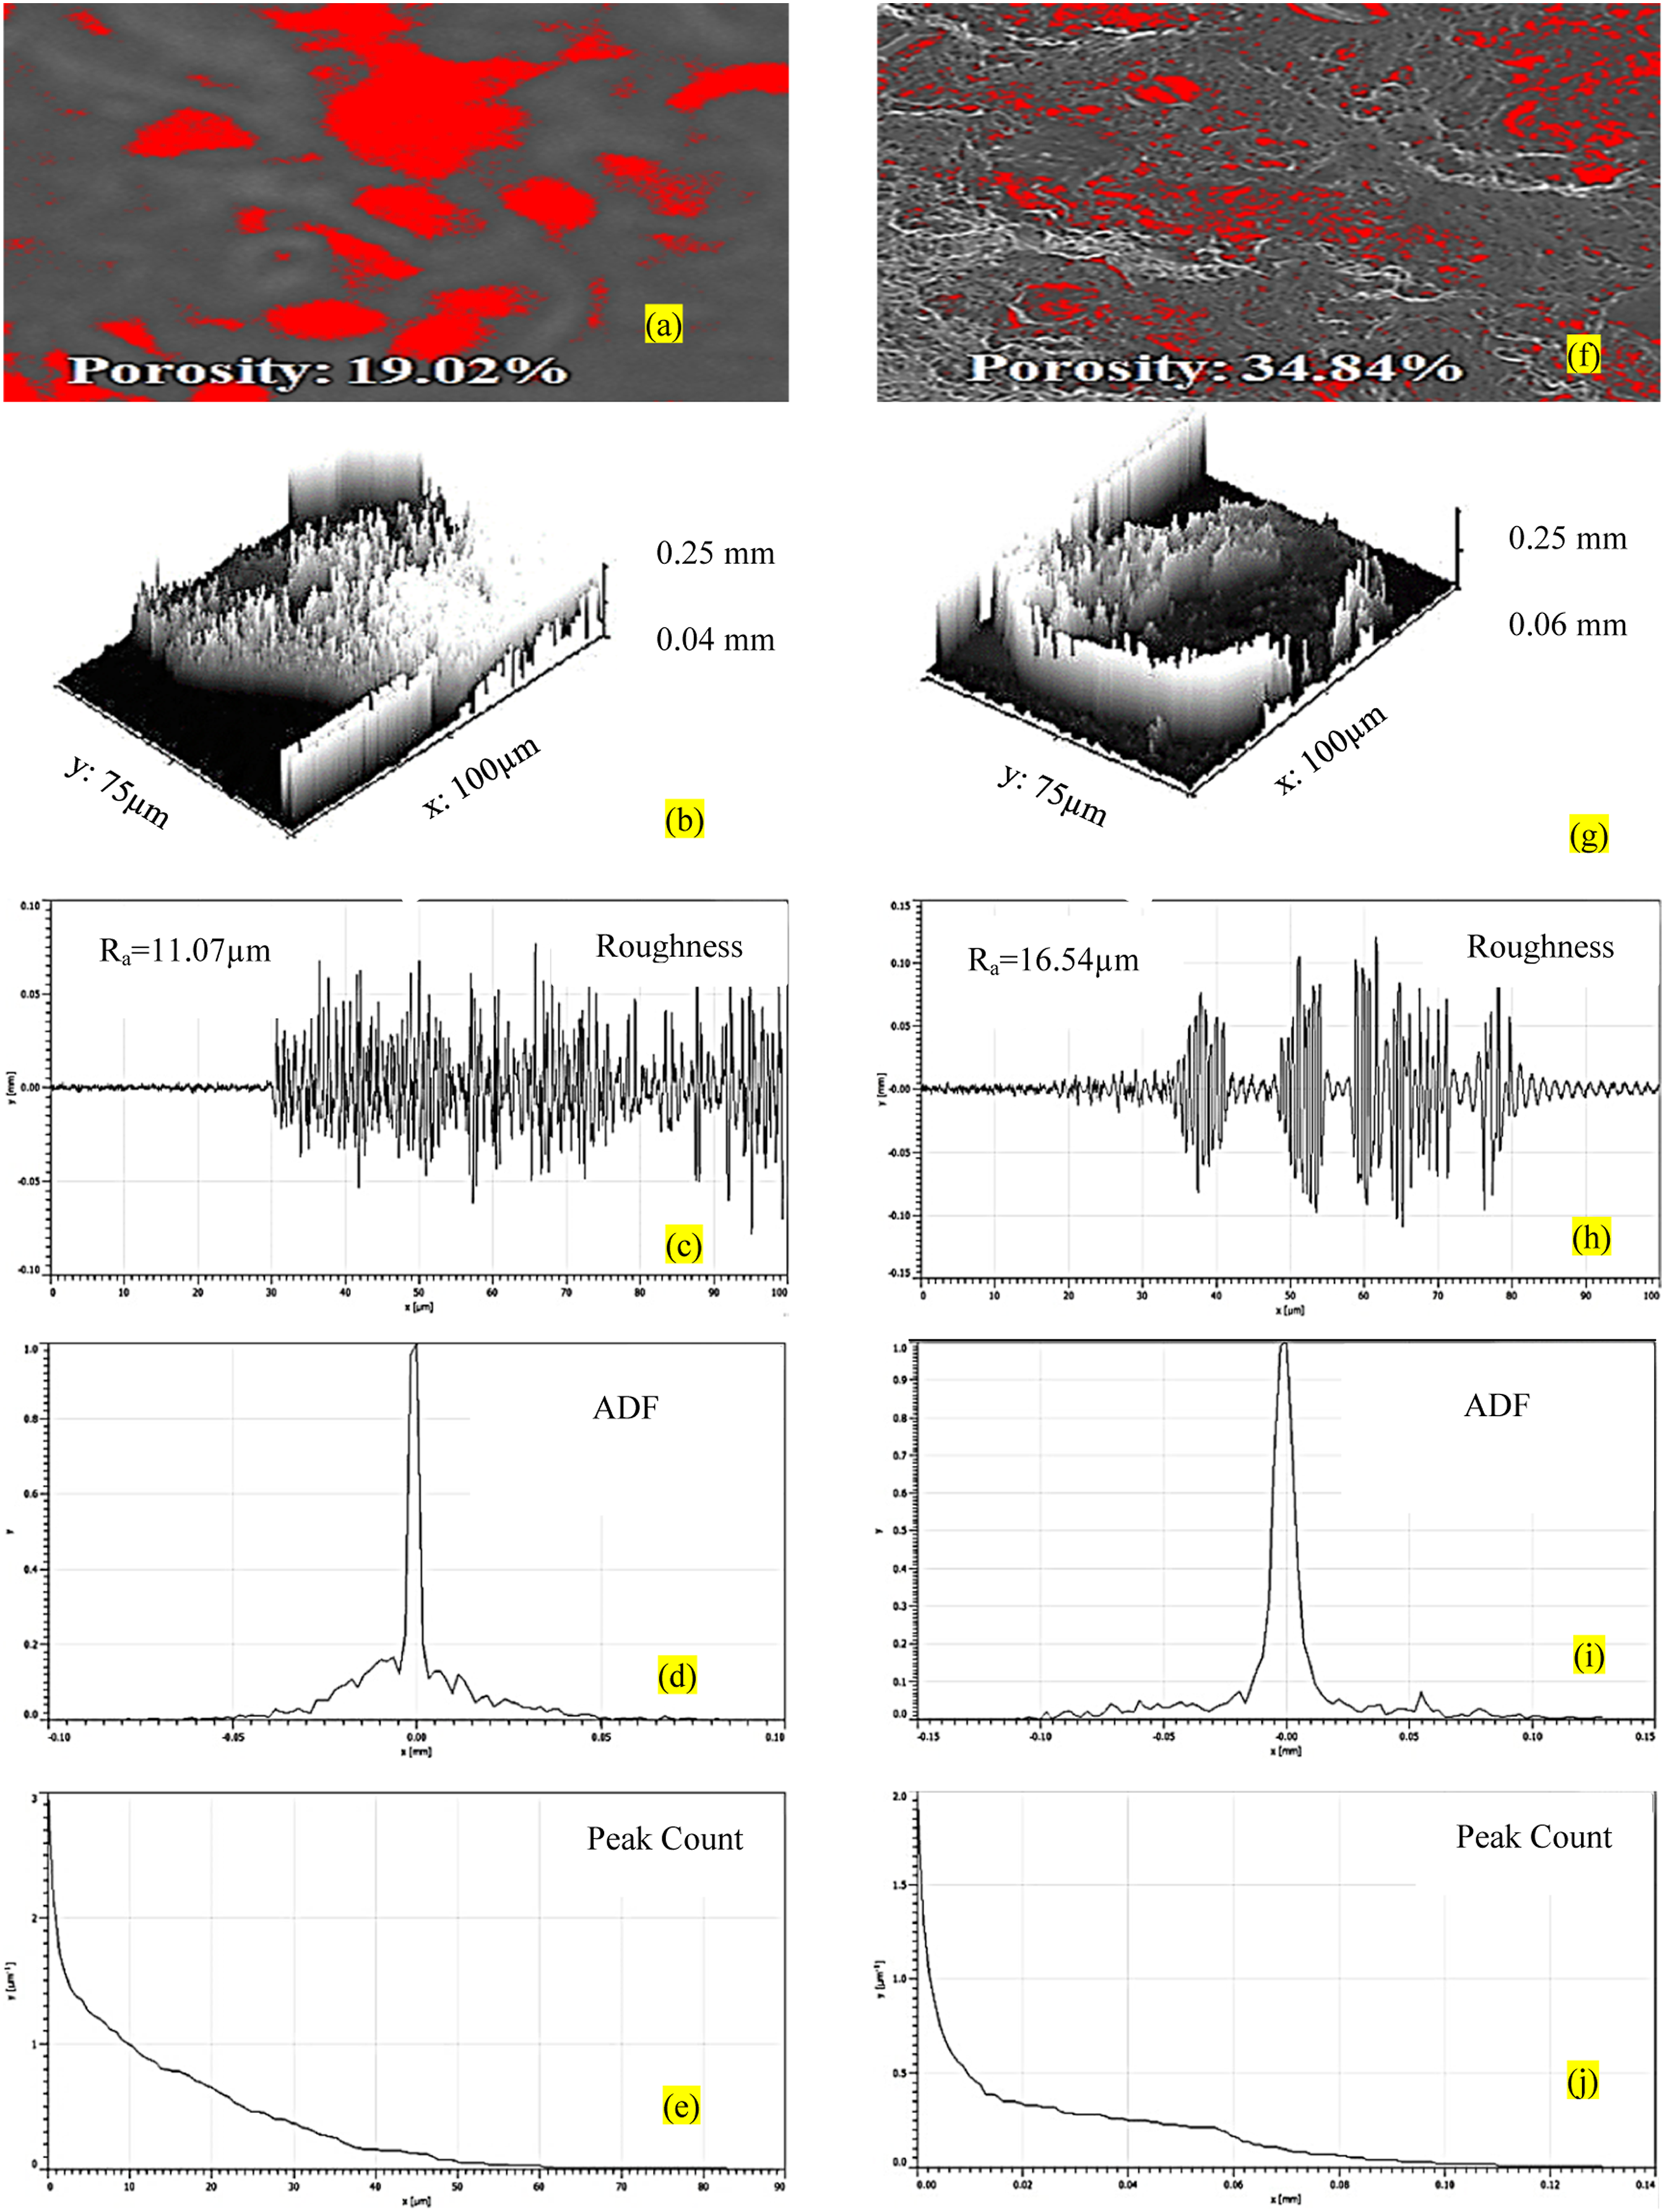
As observed from Figure 4 porosity% for a sample with the highest E is 3.74% in comparison to a sample with the lowest E (25.91%) for recycled PVDF. Also, the Ra for the best sample (9.846µm) is less in comparison to the worst sample (14.56 µm). Further ADF for a sample with the lowest E is distorted and the PC value is relatively higher than the sample with the highest E. The Ra value is in correlation with the ADF since the area under the curve for the worst sample is more in comparison to the area under the curve for the best sample which indicates their higher probability and high roughness value. Similarly, the porosity of PVDF-reinforced MnO2 for a sample with the highest E is 19.02%, lower than a sample with the lowest E (34.84%) (Figure 5). A similar trend was noticed for other surface properties (ADF and PC). Figure 6 shows EDS plots for samples of PVDF and PVDF+MnO2 with the highest E (for confirming the presence of Mn in a selected zone).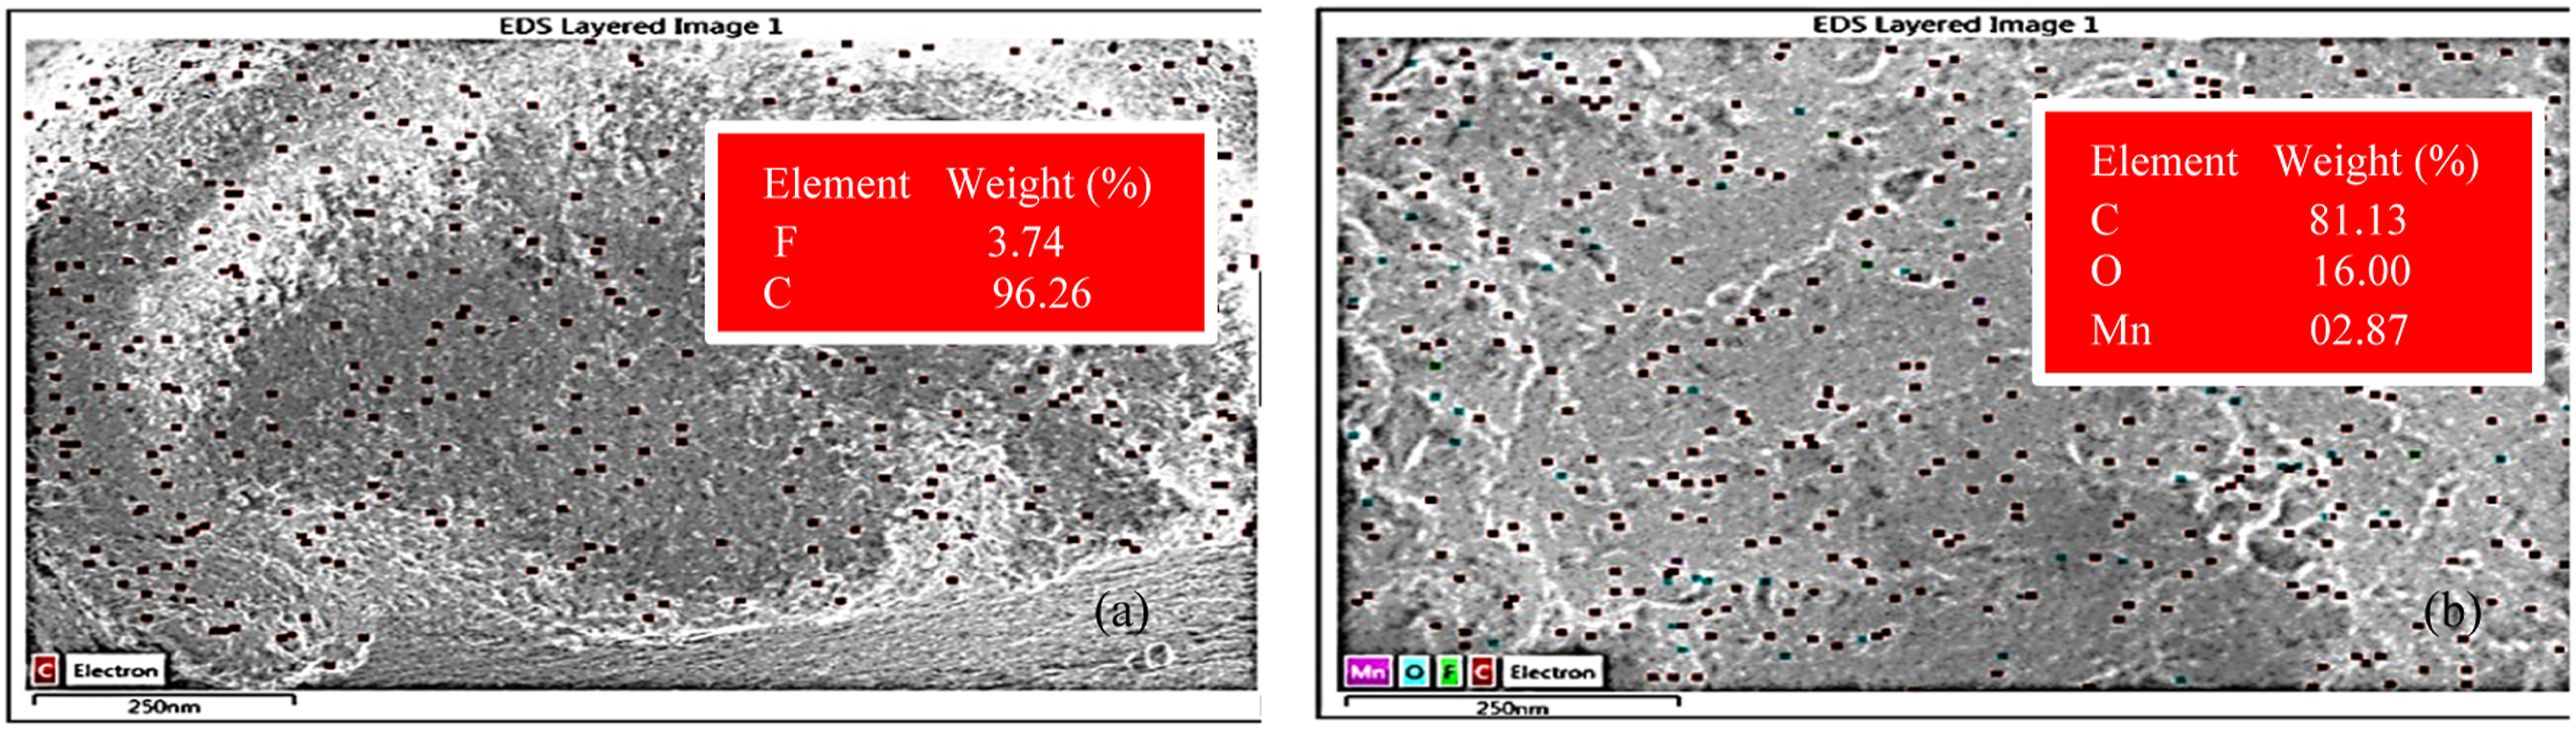
For further analysis, the absorbance spectrum (Figure 7) was obtained from FTIR of PVDF and PVDF-MnO2 composite having the highest and lowest E (as per Tables 1 and 3). Based upon Table 1, the recycled PVDF sample at S.No. 4, highlights the presence of -CH2- group at 2900cm−1 wavenumber (WN), and C-C bonds were observed at 2865 WN (Figure 7(a)). Similar observations were noticed for a sample at S.No. 9 (Figure 7(b)). The reduction in E for sample 9 may be because of an increase in porosity % (Figure 4). As observed from Figure 7(c) and (d) the peaks were obtained at 825-840 WN for C-F molecules and 750-1029 WN for C=O in PVDF-MnO2 composite samples. The formation of such bonding structures resulted in an improved modulus of toughness, E, that contributed to increased conductivity and piezoelectric properties of PVDF by inducing the β phase in the composite. Absorbance spectrum of PVDF and PVDF-MnO2 composite samples. (a) PVDF Sample 4. (b) PVDF Sample 9. (c) PVDF-MnO2 Sample 4. (d) PVDF-MnO2 Sample 5.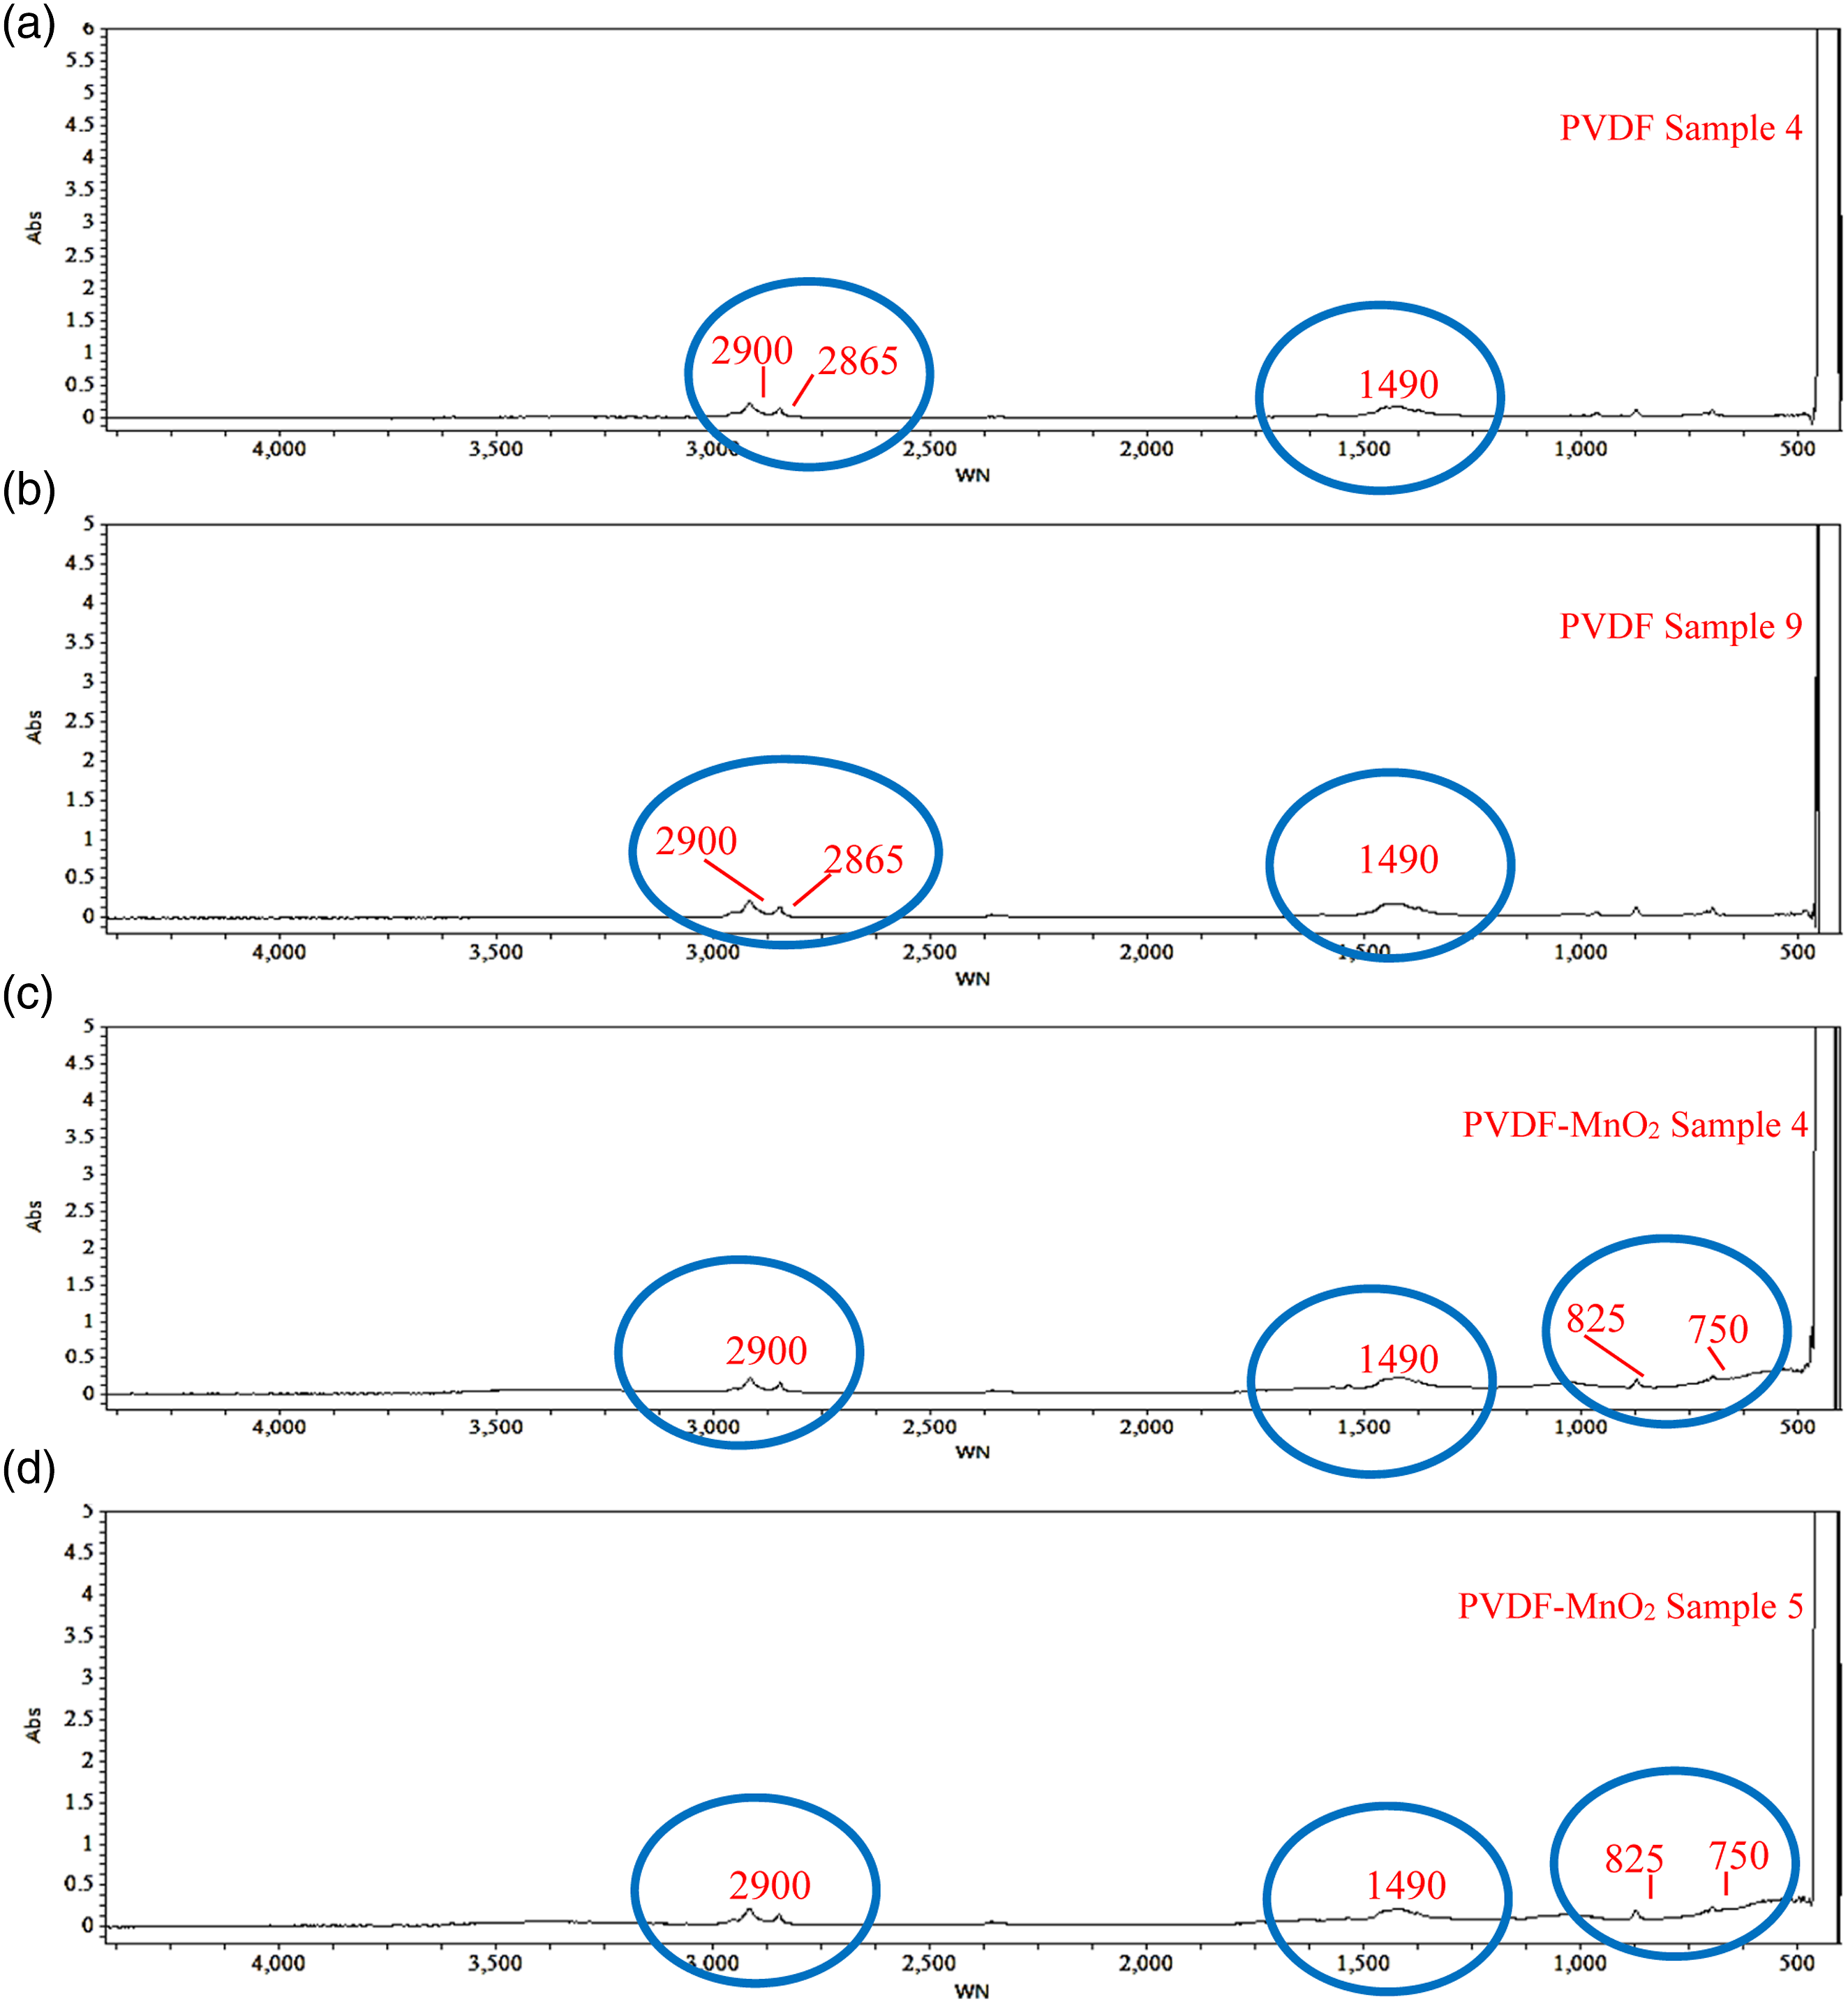
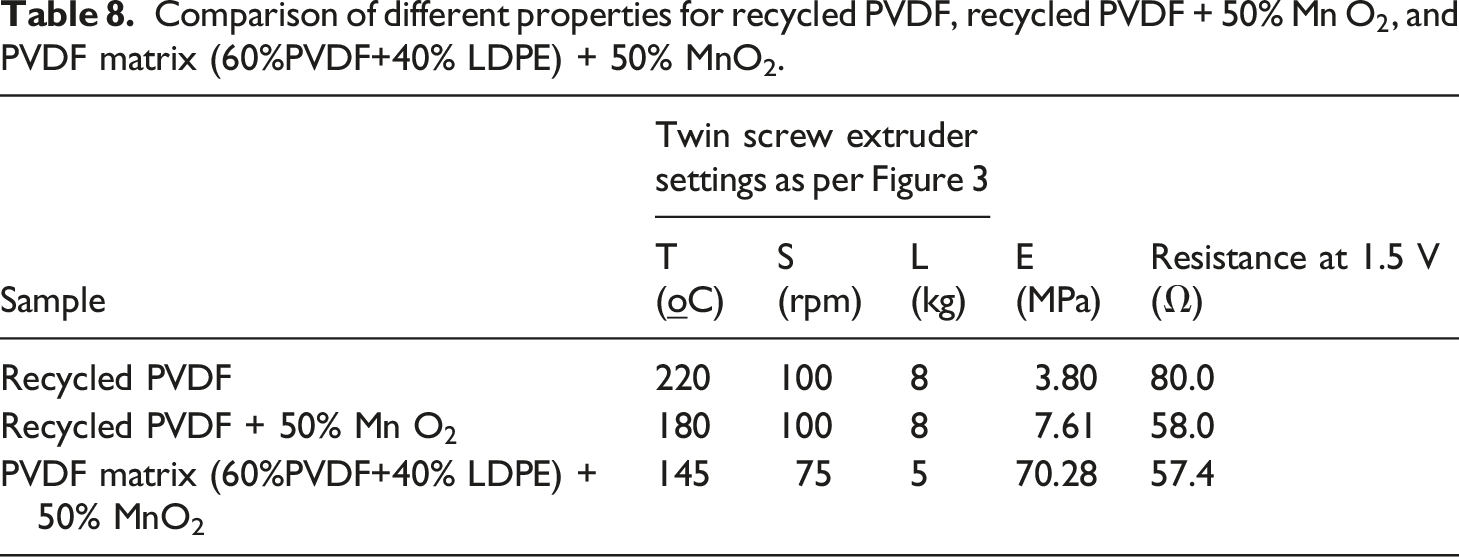
Comparison of different properties for recycled PVDF, recycled PVDF + 50% Mn
The XRD of PVDF (Figure 8(a)) and 60%PVDF+40%LDPE+50% MnO2 (Figure 8(b)) shows phases (α, β) and the peaks of crystallinity. It has been observed that due to the reinforcement of LDPE in the PVDF matrix, the mechanical properties and its printability were improved, but certainly, it has weakened the piezoelectric property. But even after reinforcement of LDPE in the PVDF matrix, the β phase still exists (observed at 2θ= 20.66282°) in line with the reported literature.
37
Further, the comparison of FTIR curves for PVDF (Figure 8(c)) and 60%PVDF+40%LDPE+50% MnO2 (Figure 8(d)) shows the presence of MnO2. It has been noted that the (C-F) stretch at wave number 550 indicates the presence of PVDF (in line with reported literature).
38
Since in the present study the recycled PVDF was used, the C-F bond was noted at 468.5878 wave number (Figure 8(c)). The presence of MnO2 as an O-Mn-O group is shown in Figure 8(d). XRD of PVDF (a) 60%PVDF+40%LDPE+50% MnO2 (b) FTIR of PVDF (c) 60%PVDF+40%LDPE+50% MnO2 (d).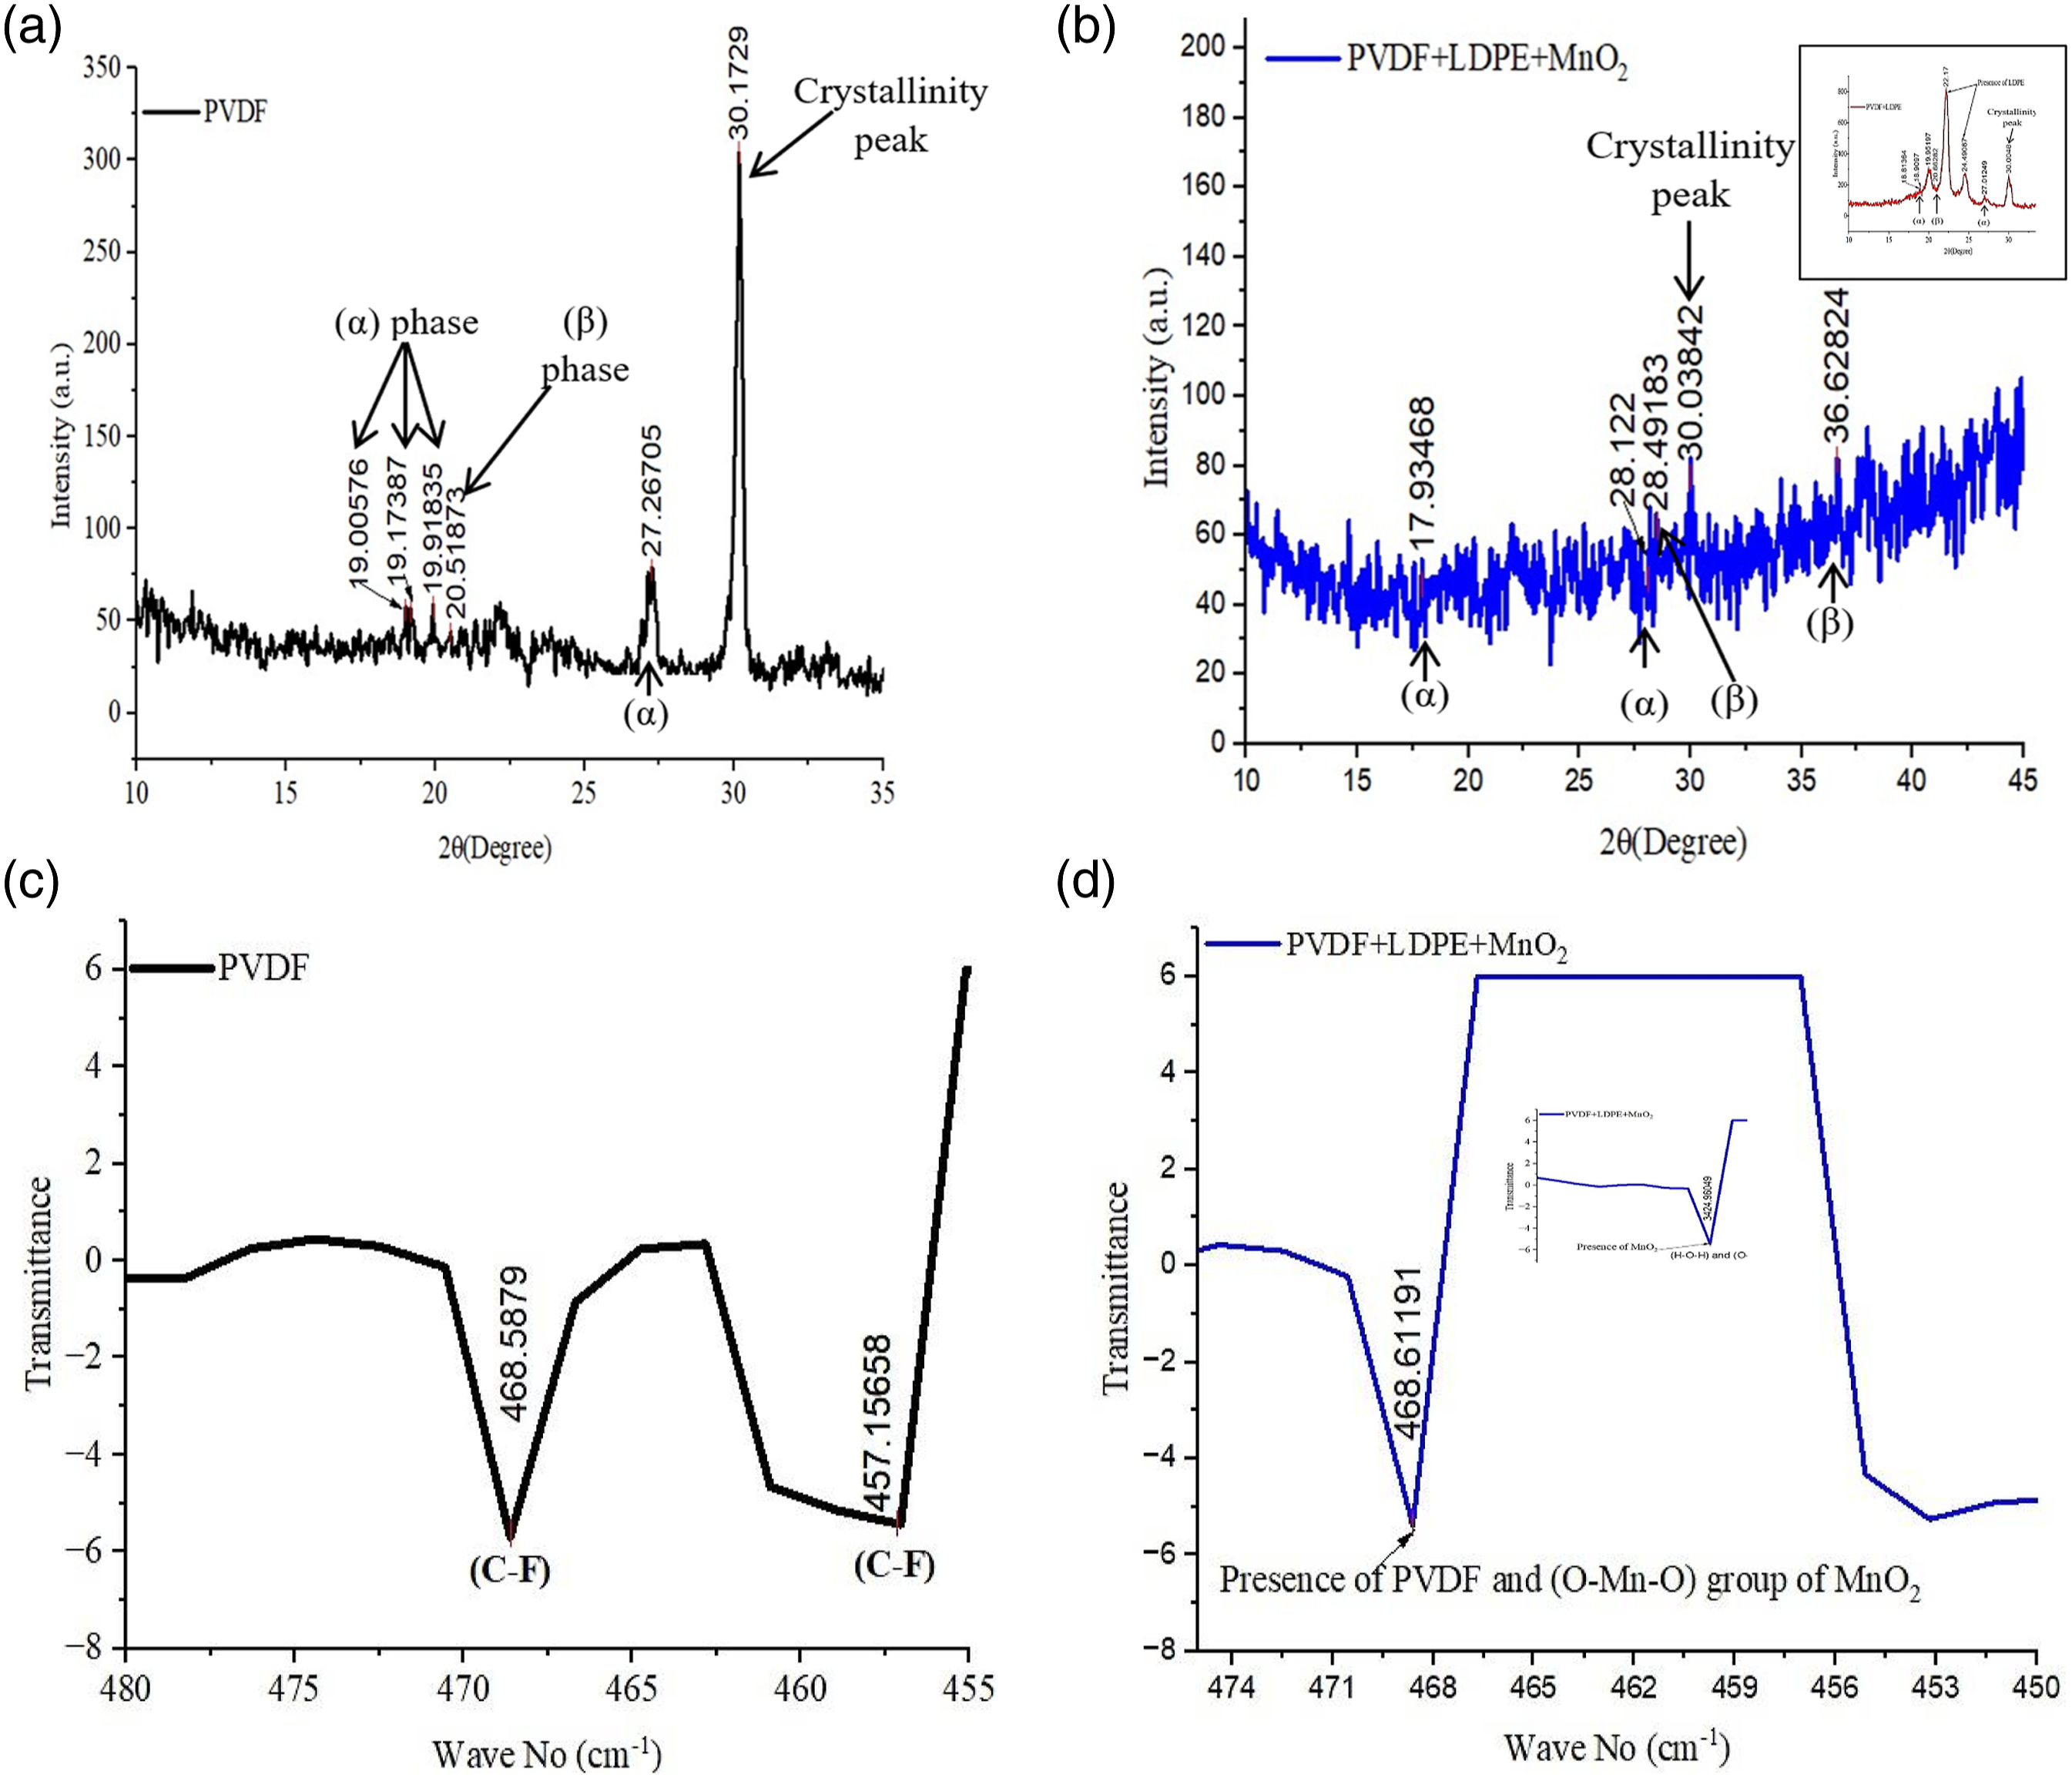
Figure 9 shows V-R and V-I curves for 50% (graphite/ZnCl2/N V-R and V-I curves for 50% (graphite/ZnCl2/N 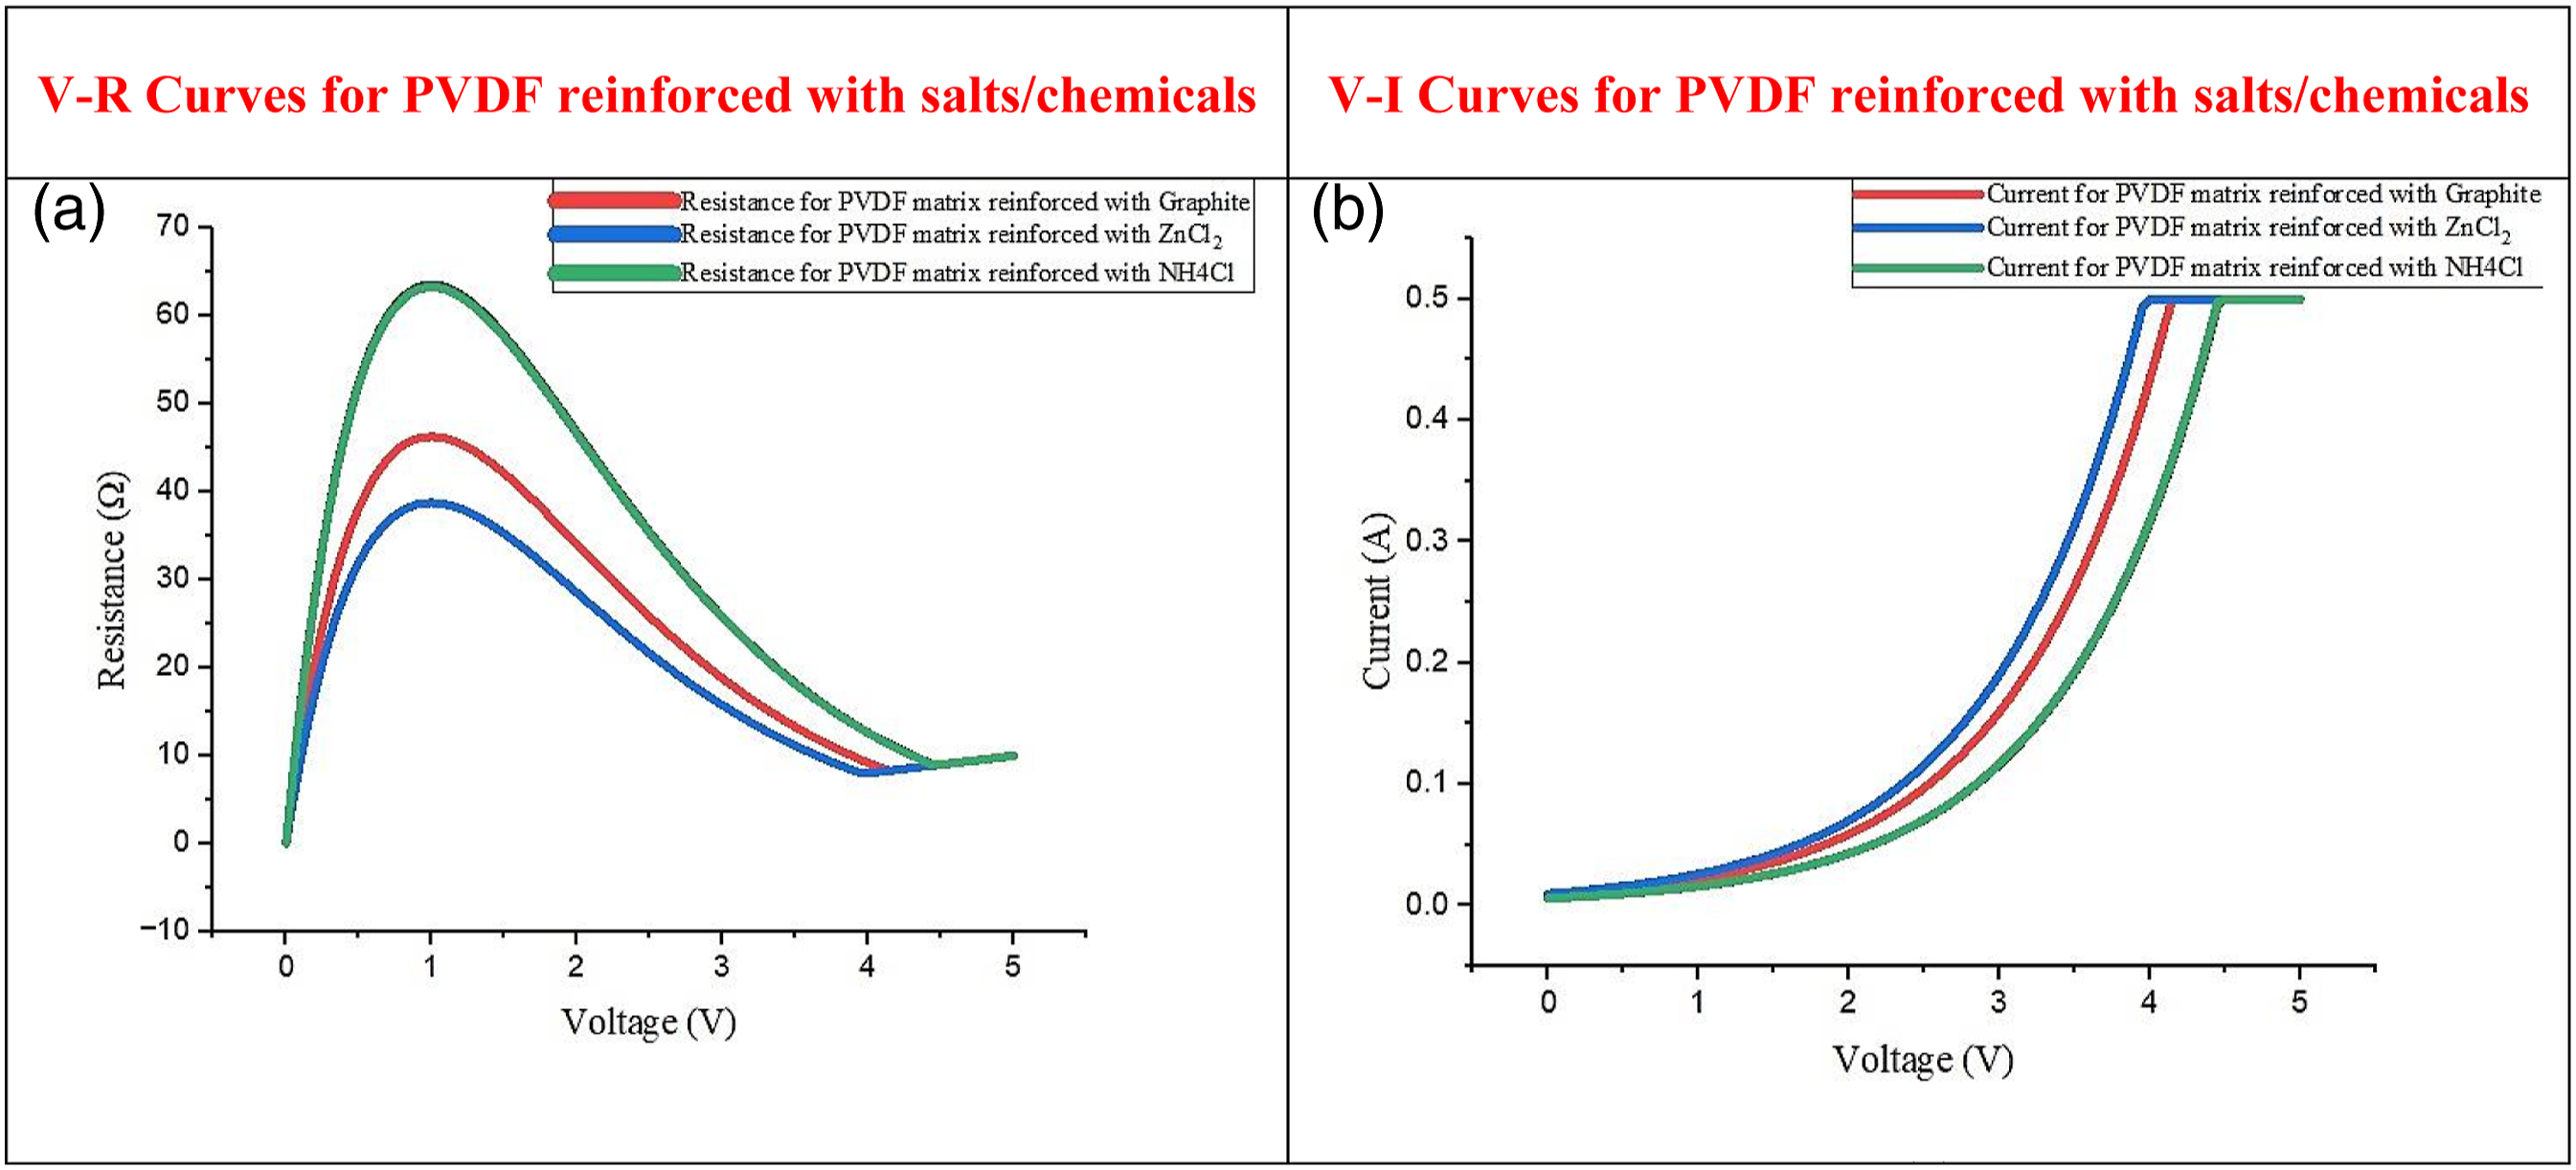
Conclusions
(1) This study shows that 50 wt%. of (Mn (2) The obtained mechanical properties in the case of PVDF+MnO2 (E = 7.61MPa) matrix are better than recycled PVDF (E=3.80MPa) (for the selected lot of material in the present study). The results suggest that concerning E, the best composite filament of PVDF matrix reinforced with 50 wt% of Mn (3) The V-I and V-R characteristics show that resistance gets reduced from 80Ω to 58Ω due to the reinforcement of Mn (4) The experimental results show that the composites prepared with PVDF matrix were not printable due to the elastic nature of PVDF (high strain for a selected lot of recycled PVDF), so to address the printability issue, an LDPE was reinforced into the PVDF matrix to improve its stiffness and hence printability. It was observed that on the addition of LDPE (40%) into the PVDF matrix its stiffness increased and a sample was easily printable. Based upon experimental observations it has been ascertained that chemicals/salts Mn (5) The finally prepared PVDF composite may be used in sensing the time left for unused chemicals in the dry cell and a signal in the form of an electromagnetic wave may be generated (like the patch antenna, with changing values of conductivity, dissipation/loss factor, permittivity, etc. by the consumption of chemical/salt). Hence this may be useful as an industrial IoT-based solution for estimating the life of ESD.
Further investigations may be conducted to establish the performance of ESD in totality that is, comprising all different zones of PVDF+LDPE+MnO2/NH4Cl/ZnCl2/graphite.
Footnotes
Acknowledgements
The authors are thankful to DST (Government of India) for financial support under the FIST project (File No. SR/FST/COLLEGE/2020/997).
Declaration of conflicting interests
The author(s) declared no potential conflicts of interest with respect to the research, authorship, and/or publication of this article.
Funding
The author(s) disclosed receipt of the following financial support for the research, authorship, and/or publication of this article: This work was supported by the Department of Science and Technology, Ministry of Science and Technology, India (SR/FST/COLLEGE/2020/997).