
Abstract
Fused filament fabrication (FFF) is an Additive manufacturing technique, widely used in engineering that involves adding material layer by layer to create solid objects with complex geometry. Due to the poor mechanical performance of pure thermoplastics materials, one alternative for enhancing the mechanical qualities of FFF created thermoplastic parts is to include reinforcing material, such as carbon fibre (CF). In this work, we perform an FFF analysis of the mechanical behaviour of gyroid infilled CF based poly-lactic-acid (PLA) composites. Tensile behaviour is measured for a variety of parameter combinations, including raster angle (RA) (0°, 45°, 90°), feed rate (FR) (20 mm/s, 40 mm/s, 60 mm/s) and layer height (LH) (0.1 mm, 0.15 mm, 0.2 mm). By adjusting the several process parameters, it is possible to increase tensile strength (TS) by 70.81%, from a minimum of 16.17 MPa to a maximum of 27.62 MPa. The failure mechanisms of the studied specimens are determined using a fractography study, which indicates pulling, necking, raster failure, and voids. Using ANOVA, Taguchi’s L27 array, and regression analysis, the impact of LH, RA, and FR on TS is determined, in which, LH having the highest influence. The results of this study will aid engineers in creating useful components with improved mechanical behaviour.
Keywords
Introduction
AM is the process of depositing layer-by-layer to create solid geometries with complexity. It is the phase of accelerated adoption and can completely replace traditional production methods and provide innovative skill development. 1 Due to its ease of use and ability to create thermoplastic material components of considerable geometric complexity and shapes with excellent characteristics and adaptability, as well as little waste of materials, fused filament fabrication (FFF) is quickly becoming one of the widely used AM technologies. Fused filament fabrication methods are used to make the parts, which involve layering an extruded thermoplastic filament in separate layers until the final solid shape is achieved.2–6 Despite its many advantages over traditional manufacturing techniques, FFF usually suffers from quality concerns, resulting in fabricated products with poor mechanical and geometric quality.3,7–9 For high quality criteria requirement, traditional manufacturing procedures are frequently favoured over AM to obtain finished products. Polymer matrix composites, which give filaments with superior mechanical properties, were created to overcome these drawbacks. Because the strength and functionality of pure polymer components created using FFF remain insufficient for usage as functional and load-bearing parts, most FFF-printed parts are currently prototypes based on different concepts rather than operational parts. Fused filament fabrication-printed polymers are not commonly employed in industry due to these drawbacks. These challenges can be overcame by combining polymer with some reinforcements and then extruding these polymer composites through FFF to create components with better structural properties than other components could achieve on their own.4,10,11 To improve mechanical performance of manufactured parts, many measures have been taken. Incorporating particle, fibre, or nanoparticle reinforcements into the polymer matrices can result in polymer matrix composites with better mechanical performance and utility.2,12–17 By incorporating reinforcements to polymer and then through AM these polymer composites can exhibit better mechanical characteristics has overcome these restrictions.12,18 Researchers have developed already blended materials comprising reinforcement such as graphene, carbon nanotubes and biofibres to accomplish exclusive features and capabilities, despite advancements in composite fused filament fabricator technology.19–21 Fibre reinforcement looks to be a viable filler for increasing polymer properties. Pre-blended materials with integration of discontinuous fibres have been intensively researched for possible substitute to multi-head fabricators with intricate and expensive design model.
The performance, quality, and characteristics of items produced using the FFF process are greatly influenced by a variety of process parameters.22–24 The set of different parameters can be utilised to generate high-strength, low-cost parts for FFF-printed items, which can save time in determining the proper parameters of a design that requires strength in a specific mechanical feature.8,10 Following the addition of fibre reinforcements, correct FFF process parameters must be investigated to assure the quality of the reinforced plastic parts produced using this technology.17,25,26 Carbon-fibre (CF) based composites have good mechanical properties because they combine the strengths and stiffness of CF with the properties of polymer resins or metals.27–29
The preference in AM is given to the fibres which are short and discontinuous because of the intricacy associated through the employment of continuous and lengthy fibres. AM can also be used to produce low-cost fibre composites. AM of composite materials is in its early stages, with several significant obstacles to overcome. The effects of layer holding, fibre lattice qualities, fibre network connection point, and process parameters on the structural and warm execution of composites have been verified and studied to fulfil the requirements of high-strength fibre composites by FFF.10,28,30 Increased printing speed results in enhanced mechanical interlocking between the layers since the deposited layer has less time to solidify before the next top layer is printed.23,31 These materials have different properties and advantages depending on the reinforcement used. At a low cost, it is possible to attain adequate mechanical, electrical, or thermal characteristics. 19 Fibre reinforcement can significantly improve the characteristics of polymer matrix FFF-printed objects. The key concerns in FFF are the fibre orientation and vacancy fraction of the composites. Fibre reinforcing would help the majority of currently accessible AM procedures.19,32 From a flat to upright build orientation, the tensile strength (TS) of the FFF-printed specimens diminished.33–35 The fracture mechanism and loading direction resulted reduction in TS for upright build orientation compared to flat ones which demonstrates that the mechanical characteristics and build time of the FFF-printed specimens were significantly affected by the build orientation.2,33,36 When developing and applying FFF-printed PLA components, it is important to consider the build orientation and the direction of the loading to enhance mechanical characteristics and save fabrication costs.37,38
Singh et al. 39 experimented with PLA composites, which depicts highest mechanical properties for 100% infill and optimize parameters using Taguchi method. Atakok et al. 40 reported that the TS of FFF-fabricated parts is mainly influenced by the layer height (LH), followed by occupancy rate and filament material utilizing the response surface methodology. According to Ansari and Kamil, the grid pattern provides the best response in terms of enhanced mechanical behaviour at printing temperature of 240°C, feed rate (FR) of 120 mm/s, and infill density of 50%. 41 Jain et al. 17 determined that layer thickness has principal influence over the TS followed by printing speed and raster orientation for PLA composites while explaining the failure mechanism using fractography images. By Experiments, Kam et al. 42 found that 0.25 mm layer thickness, 50% occupancy rates, rectilinear fill structures, and 250°C in the extruder produced the highest TS. The output performance of a product is unquestionably affected by the input parameters that were selected. There are several ways, such as the Orthogonal Array of Taguchi, 43 that scientists employ to put up experiments. The finest parameters are determined by analysing the experimental results. Equally important are the study’s most influential determinants of outcome.
Gonabadi et al. 34 performed fractography analysis for the fabricated PLA specimens for better understanding of the failure mechanism as it depicts failure of specimens with 50% infill density have a mixed brittle-ductile behaviour. According to Chadha et al., 44 a brittle failure pattern in the grid structure was discovered after fractography of the samples. Conversely, the honeycomb structure broke in a ductile way. The SEM images demonstrated this, as the fracture zone did not exhibit significant deformation of the layers. 44 According to the Vidakis et al., 45 for each cycle of recycling, the interfusion of layers looks different for the specimens involved. Interlayer fusion was highest in samples that had been recycled three and four times. 45 Based on analysis performed by Garg and Bhattacharya, 46 the 0° raster layers fail in abrittle fracture, resulting in the tearing and bursting of individual layers. There was a failure in the specimen at the 90° raster layers due to the separation of layers from the adjacent bonds. 46
The study focuses on analysing the mechanical behaviour of gyroid infilled CF-PLA composites by varying their important parameters viz. Raster angle (RA), FR, and LH. In order to comprehend the many failure scenarios, high-end microscopy of the fracture surfaces was performed. Statistical analysis of data is performed via ANOVA and Taguchi’s approach. The association between the process constraints and the response factor is constructed using regression analysis.
Material and methods
In order to create three-dimensional objects, one method uses a material extrusion process called FFF, Figure 1(a). In this study, a 1.75 mm CF-PLA filament with a CF content of 20% by weight was used. For making the PLA composite filament, CF is used as a reinforcing material. CFs offer good tensile characteristics, low densities, great chemical steadiness without oxidising polymer, good electrical conductivity, and creep resistance. Carbon fibres used in the development of polymer composites typically measure 6 μm in diameter and 200 μm in length, with an average elastic modulus of about 232 GPa and an average TS of about 4.5 GPa. Extruding CF-PLA wire relies heavily on poly-lactic-acid (PLA) pallets and CF. The reinforcement of CF is mixed through screw extrusion process. The hopper takes a PLA and CF for processing and mixed through screw extrusion process. When extruding PLA composite wire spool, the heating band is kept at a maximum of 250°C and is found to have dissipated to a minimum of 30°C throughout the process. As the screw rotates, it forces the blended substance toward the extrusion nozzle. Moreover, fusion begins at a maximum temperature of 200°C, and the resulting wire may be extruded to a diameter of 1.75 mm as required for FFF setup. Carbon fibre reinforced composites have several advantages including an enhanced strength-to-weight ratio, mechanical and structural performance. Figure 1(b) illustrates the specimen after being shaped by a Hydra 300 FFF setup with a nozzle hole diameter of 0.4 mm. The model for this specimen was developed utilizing SOLIDWORKS 2019 and ULTIMAKER CURA 3D printing software. Tensile test specimens were made according to ASTM D638 type 1A, Figure 1(d), to investigate the effect of altering RA, FR, and LH. The build platform delivers the upright movement required material deposition, while the nozzle is responsible for the horizontal movement required to move on to the next layer once the current one is finished. The diameter and stand-off distance of the extrusion nozzle determines the thickness of the layer. (a) Fused filament fabrication (b) hydra 300 3D printer (c) instron 1195 tensile testing machine (d) ASTM D638 type 1A for tensile test specimens.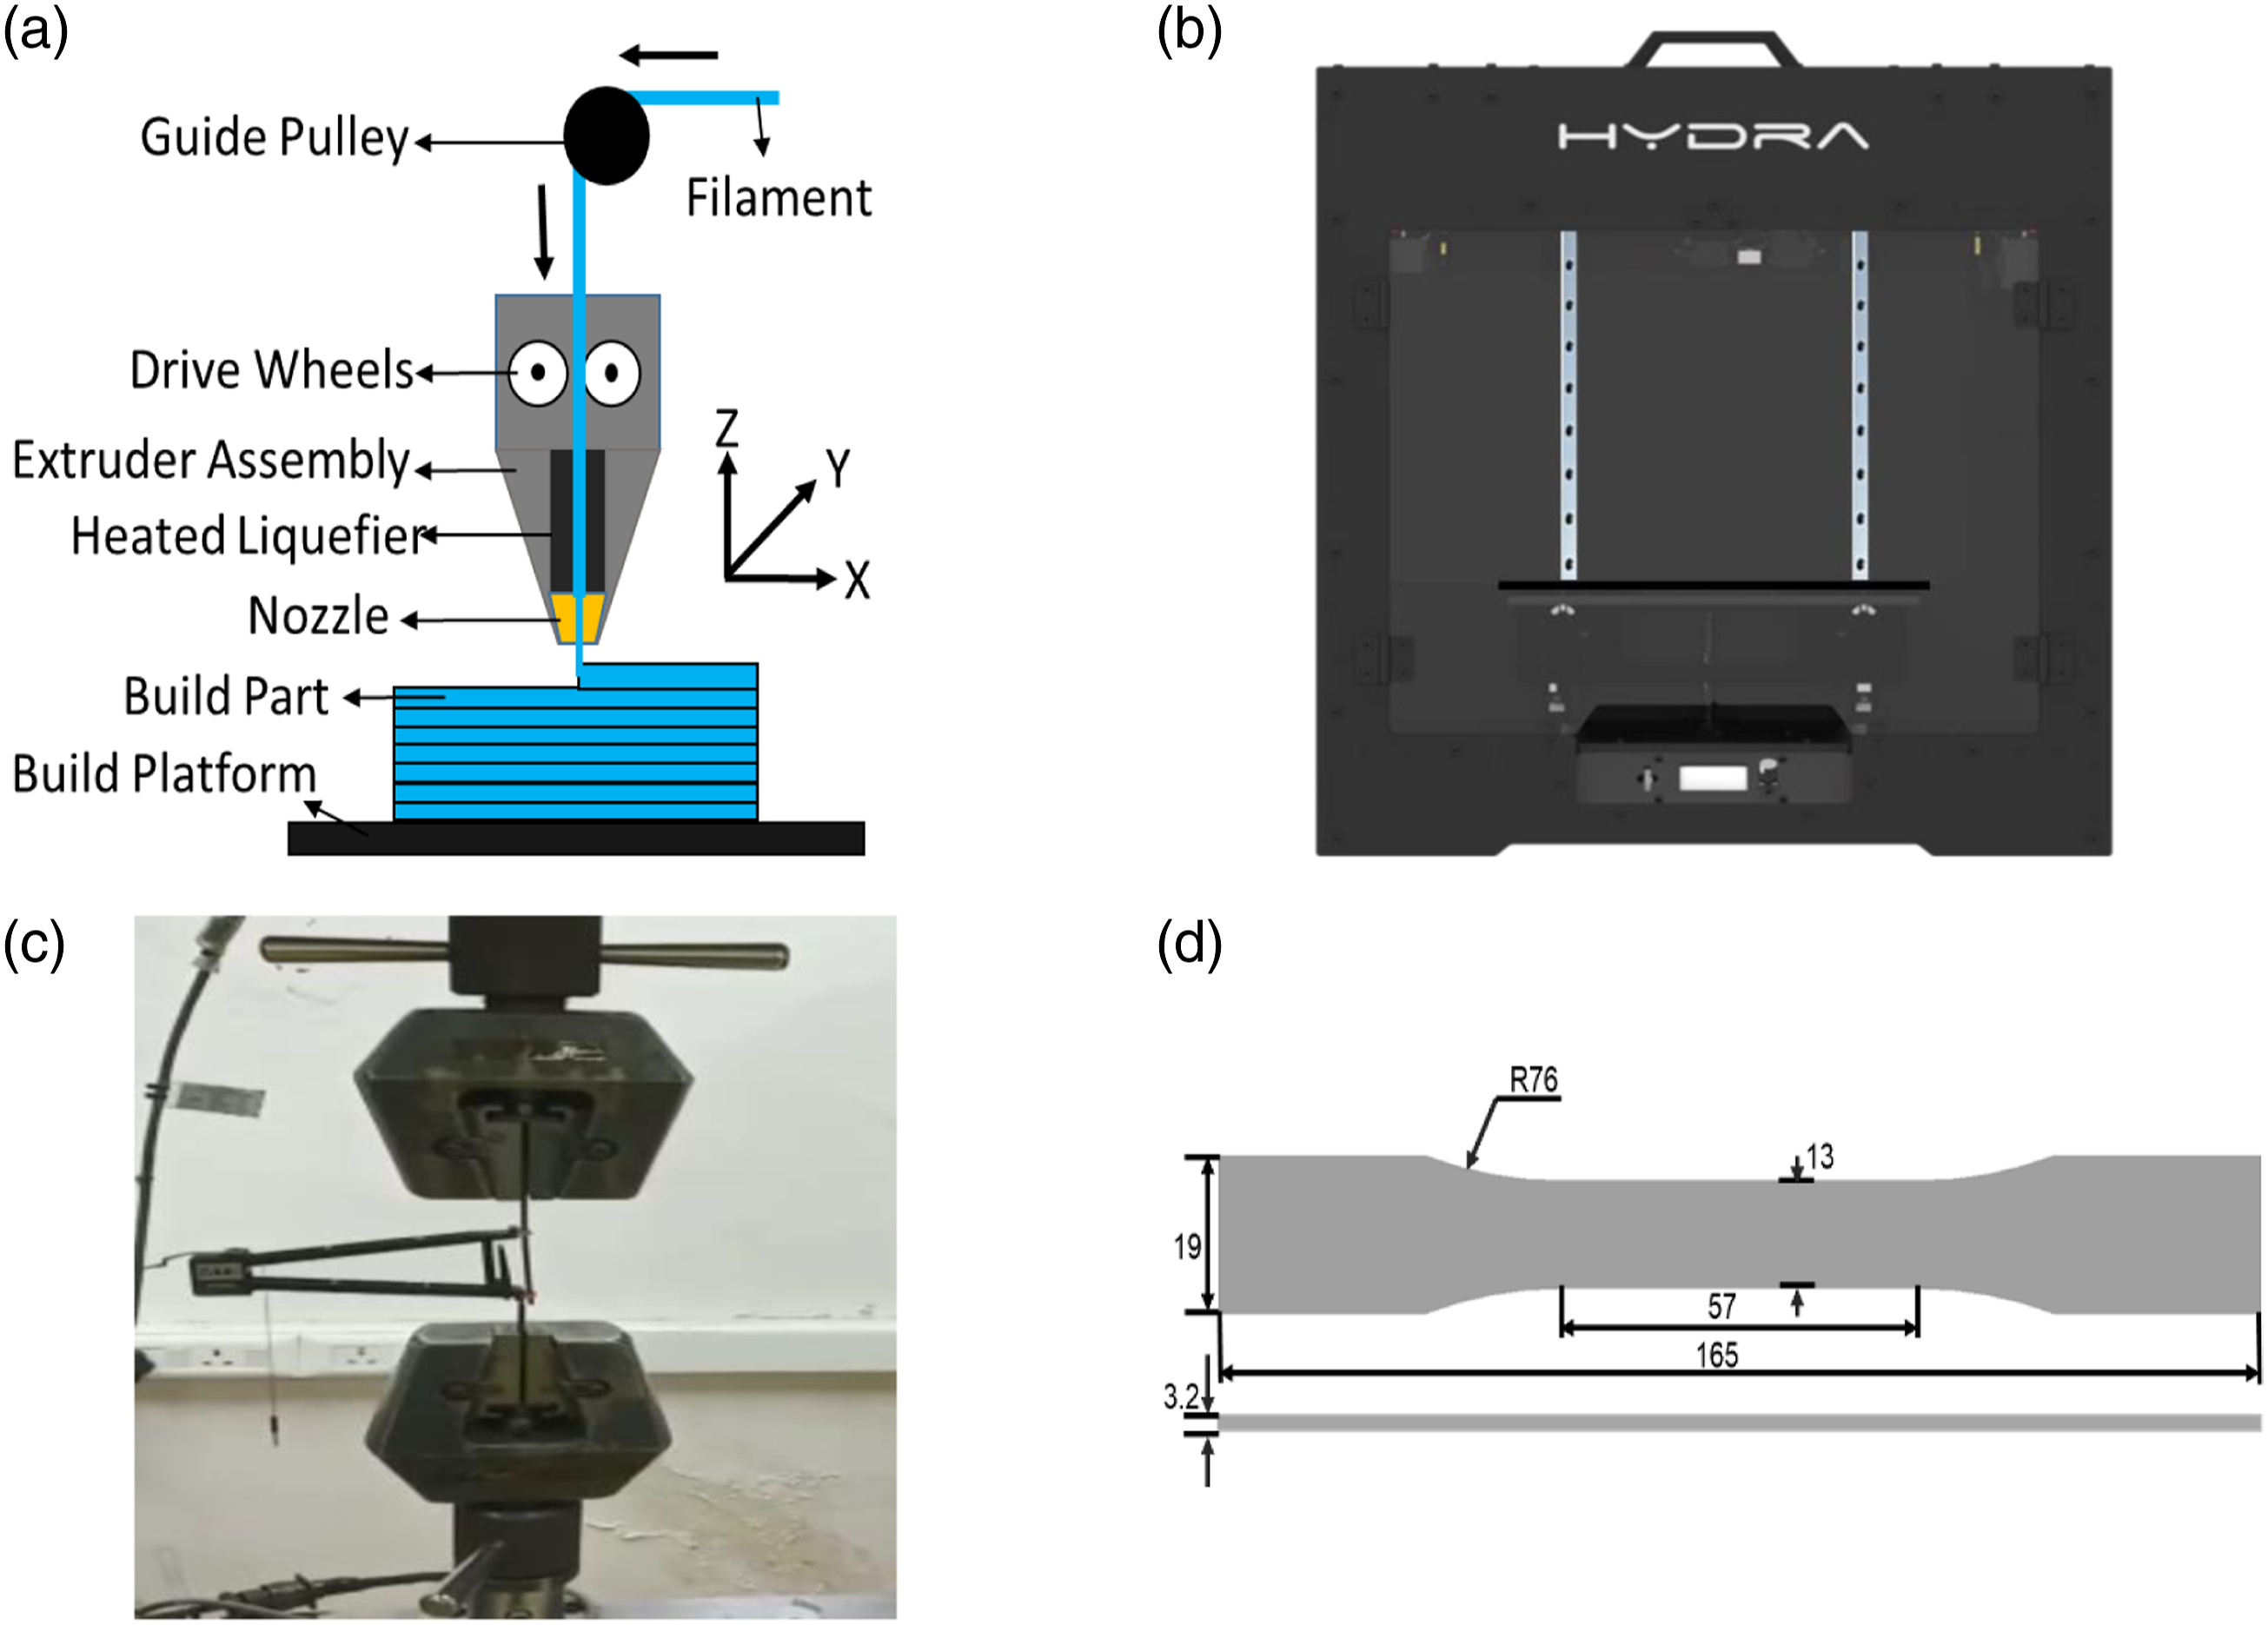
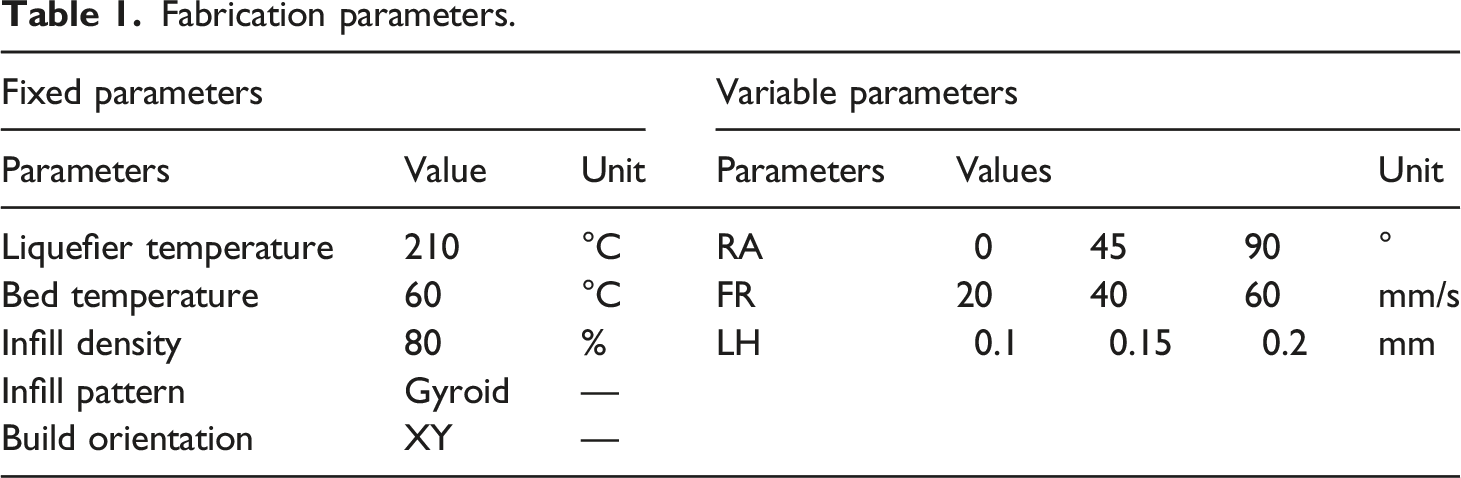
Fabrication parameters.
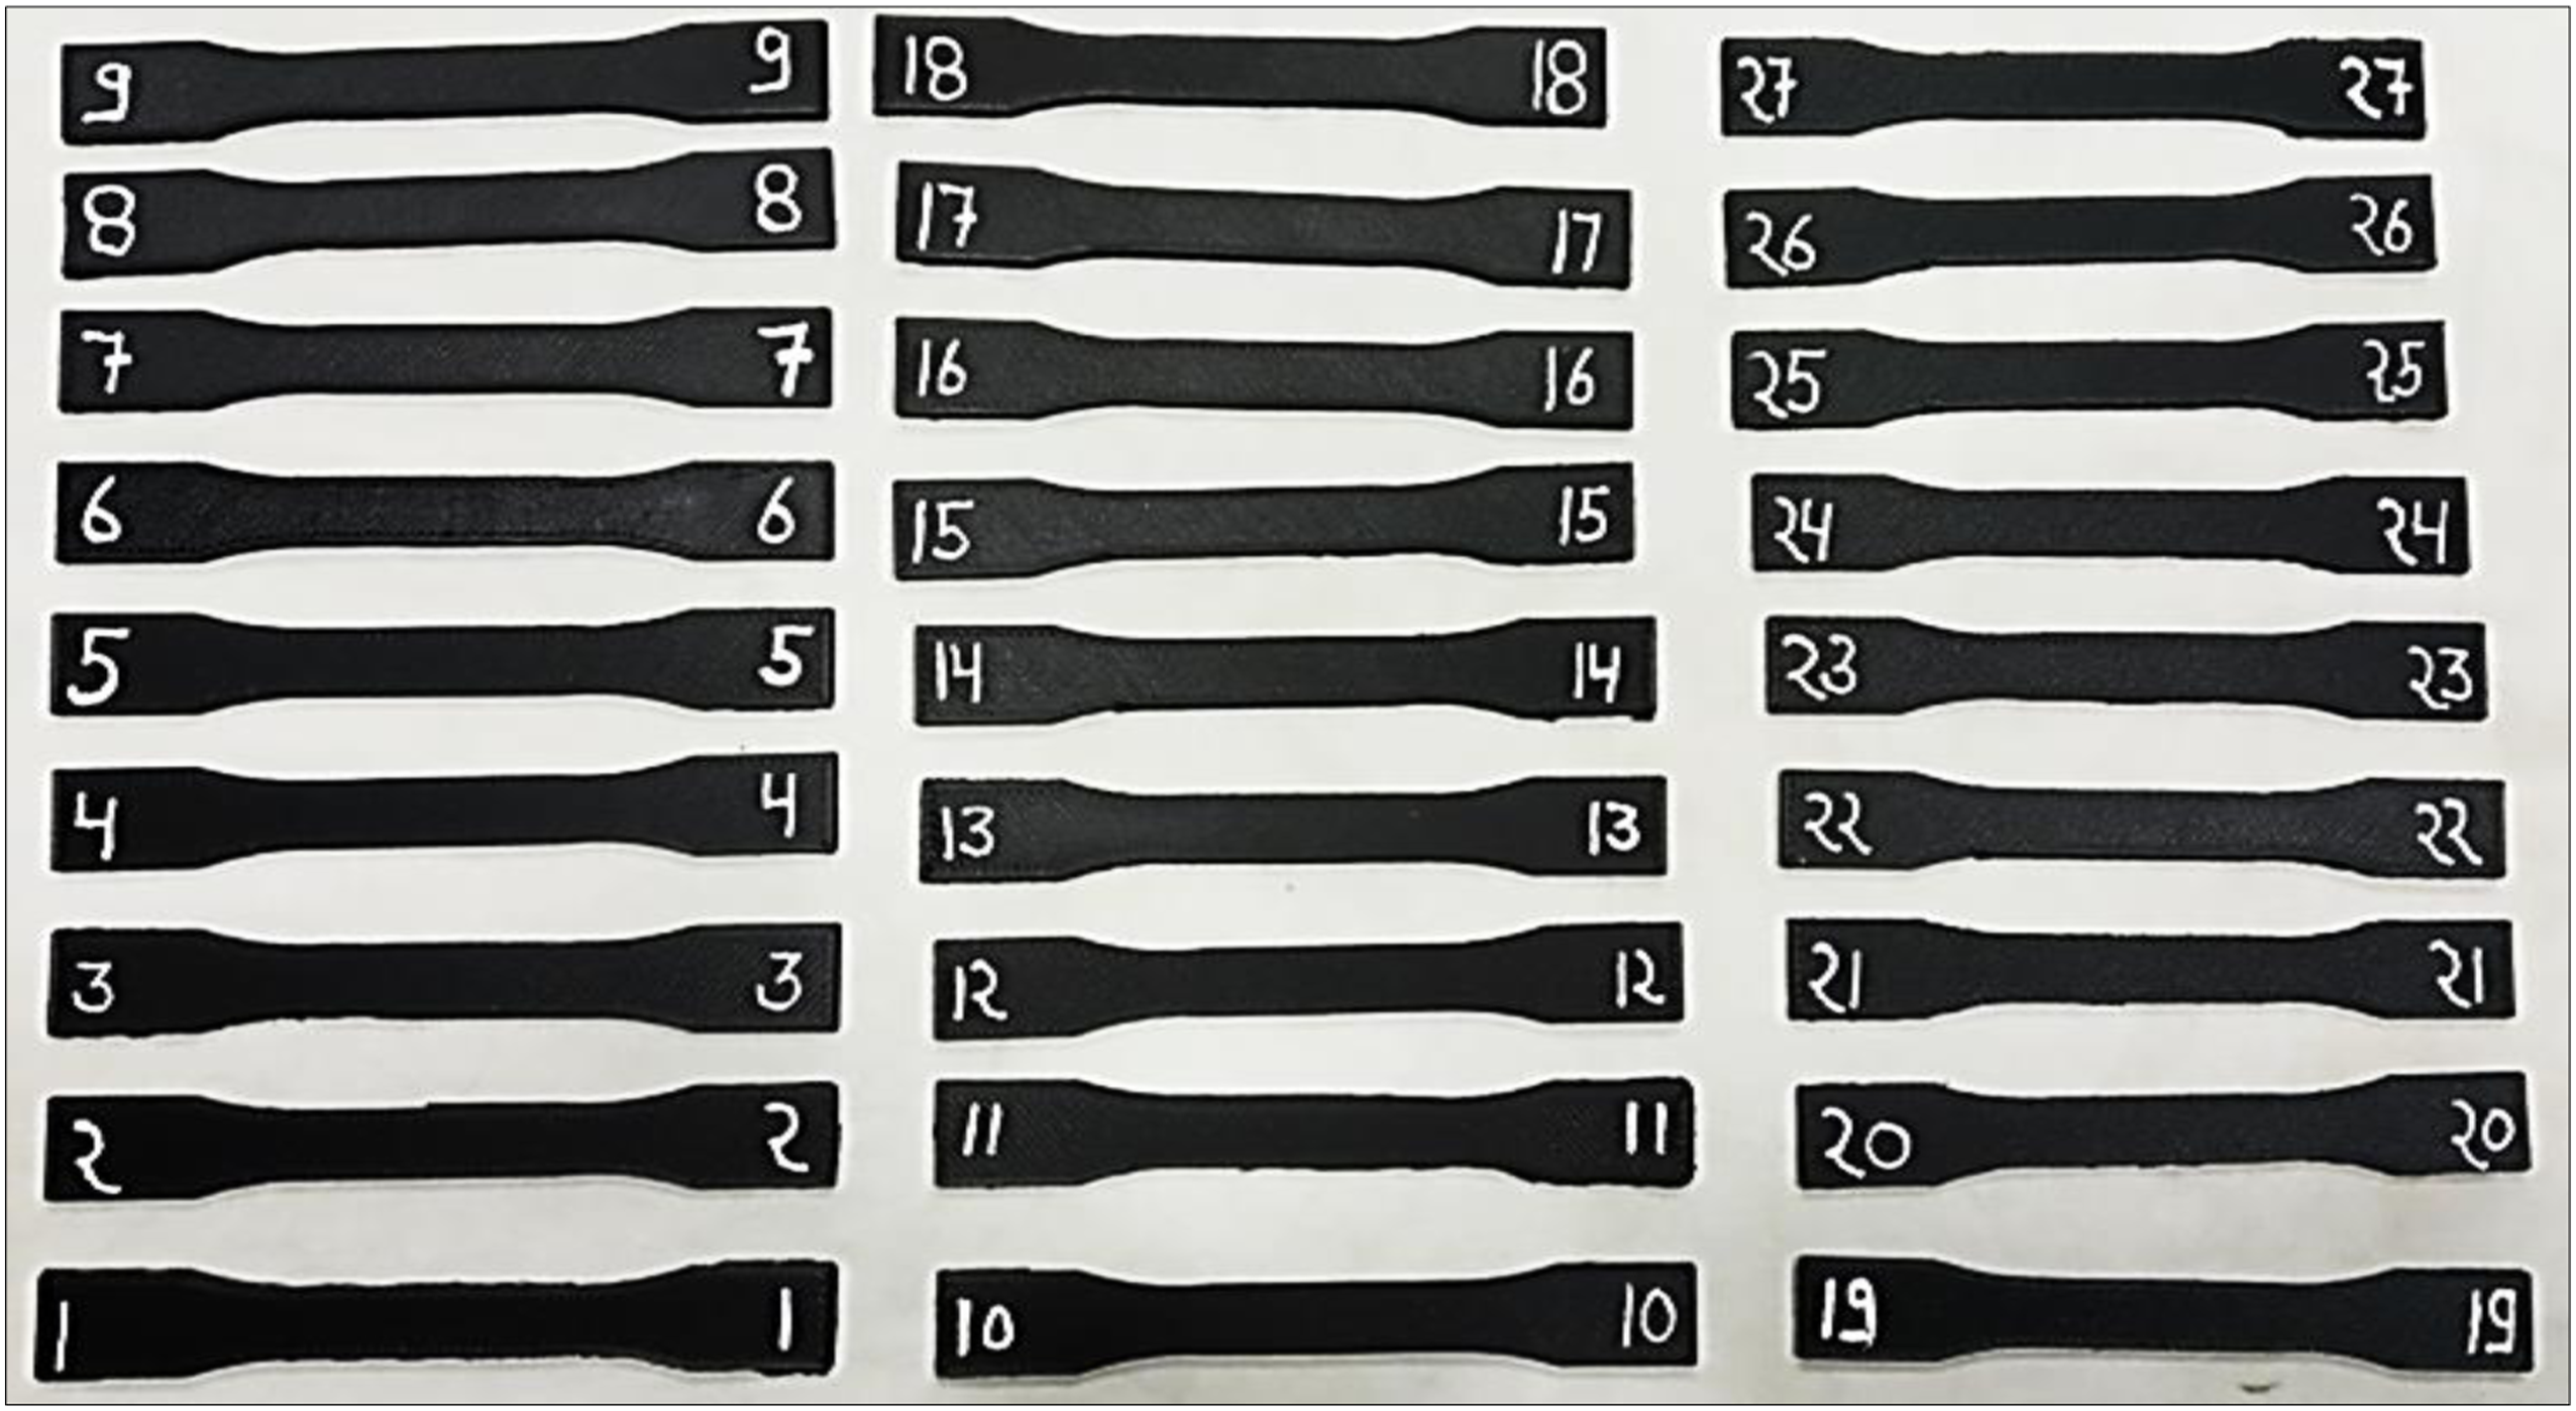
Fabricated tensile test specimens.
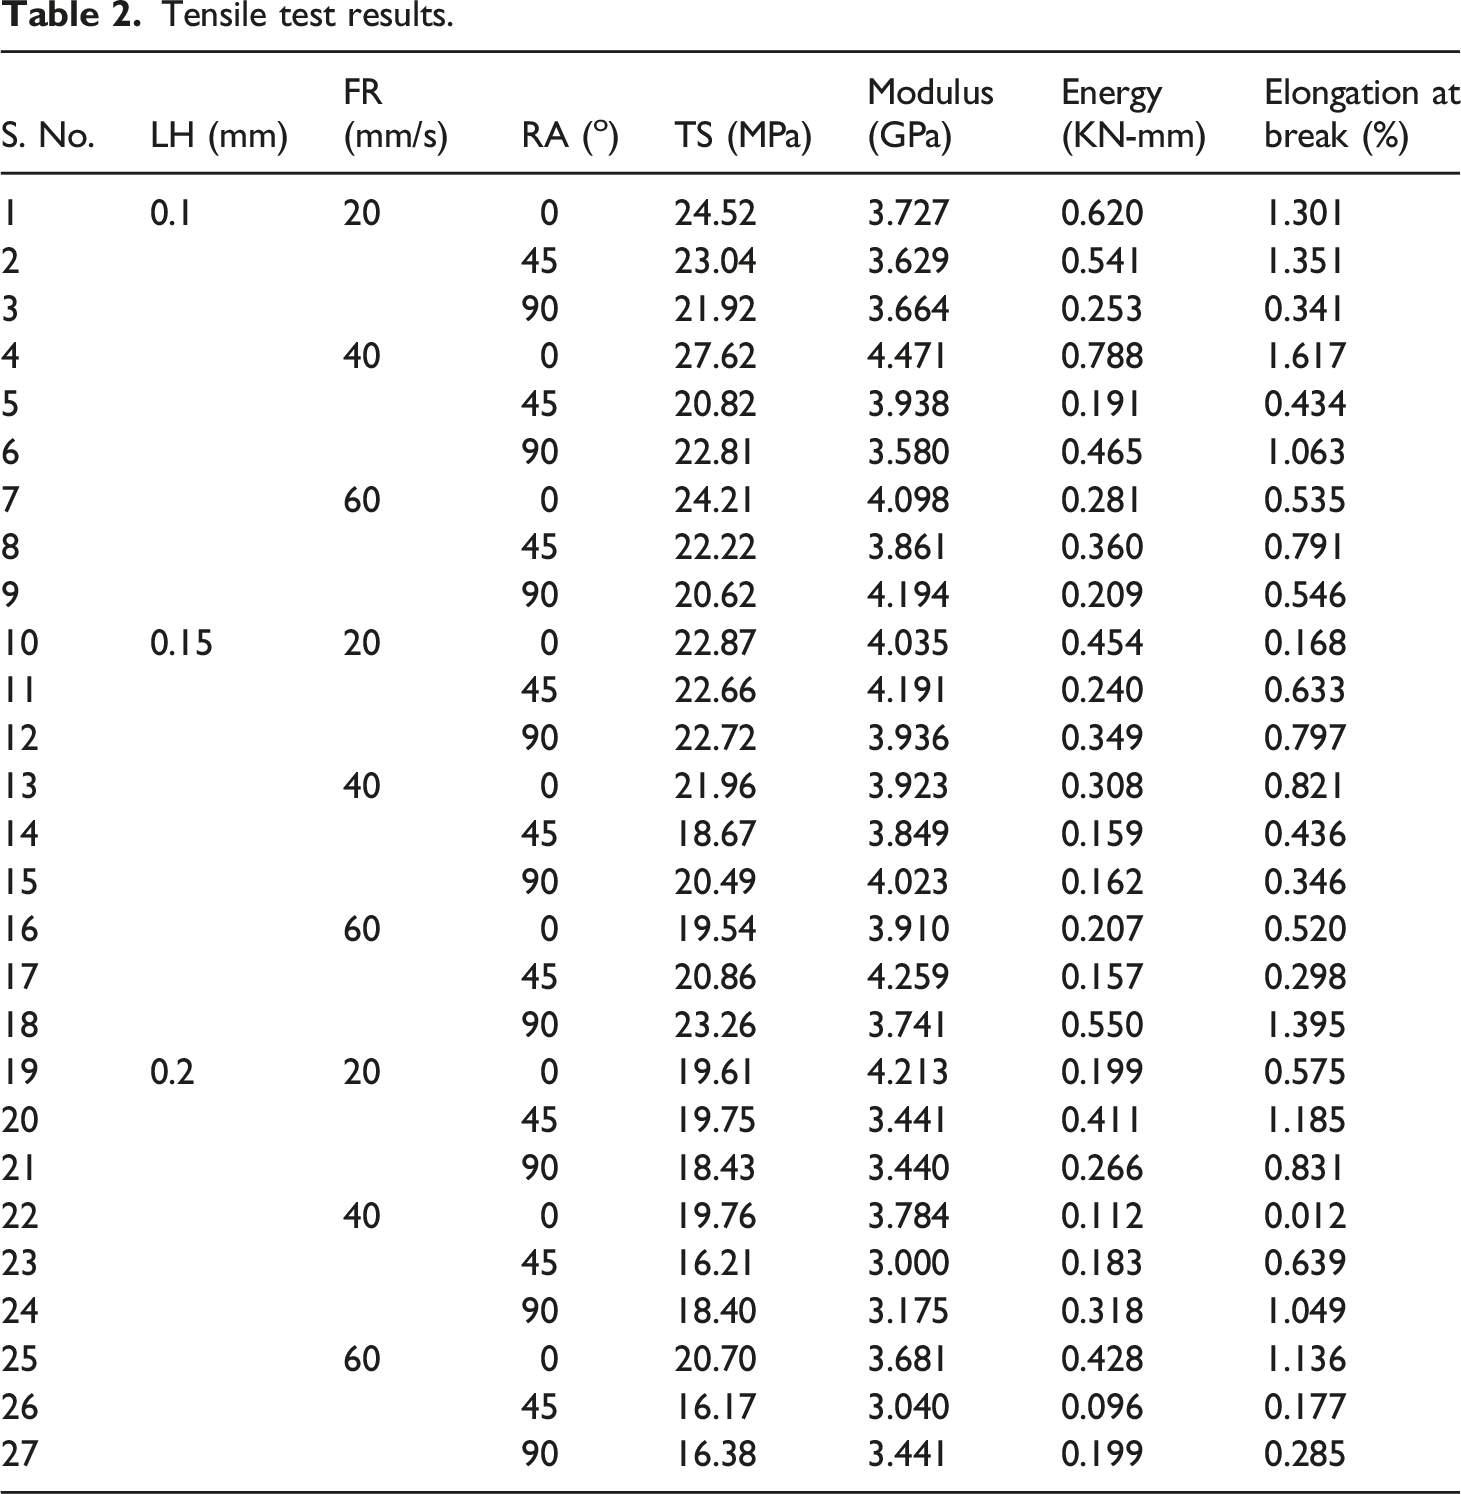
Tensile test results.
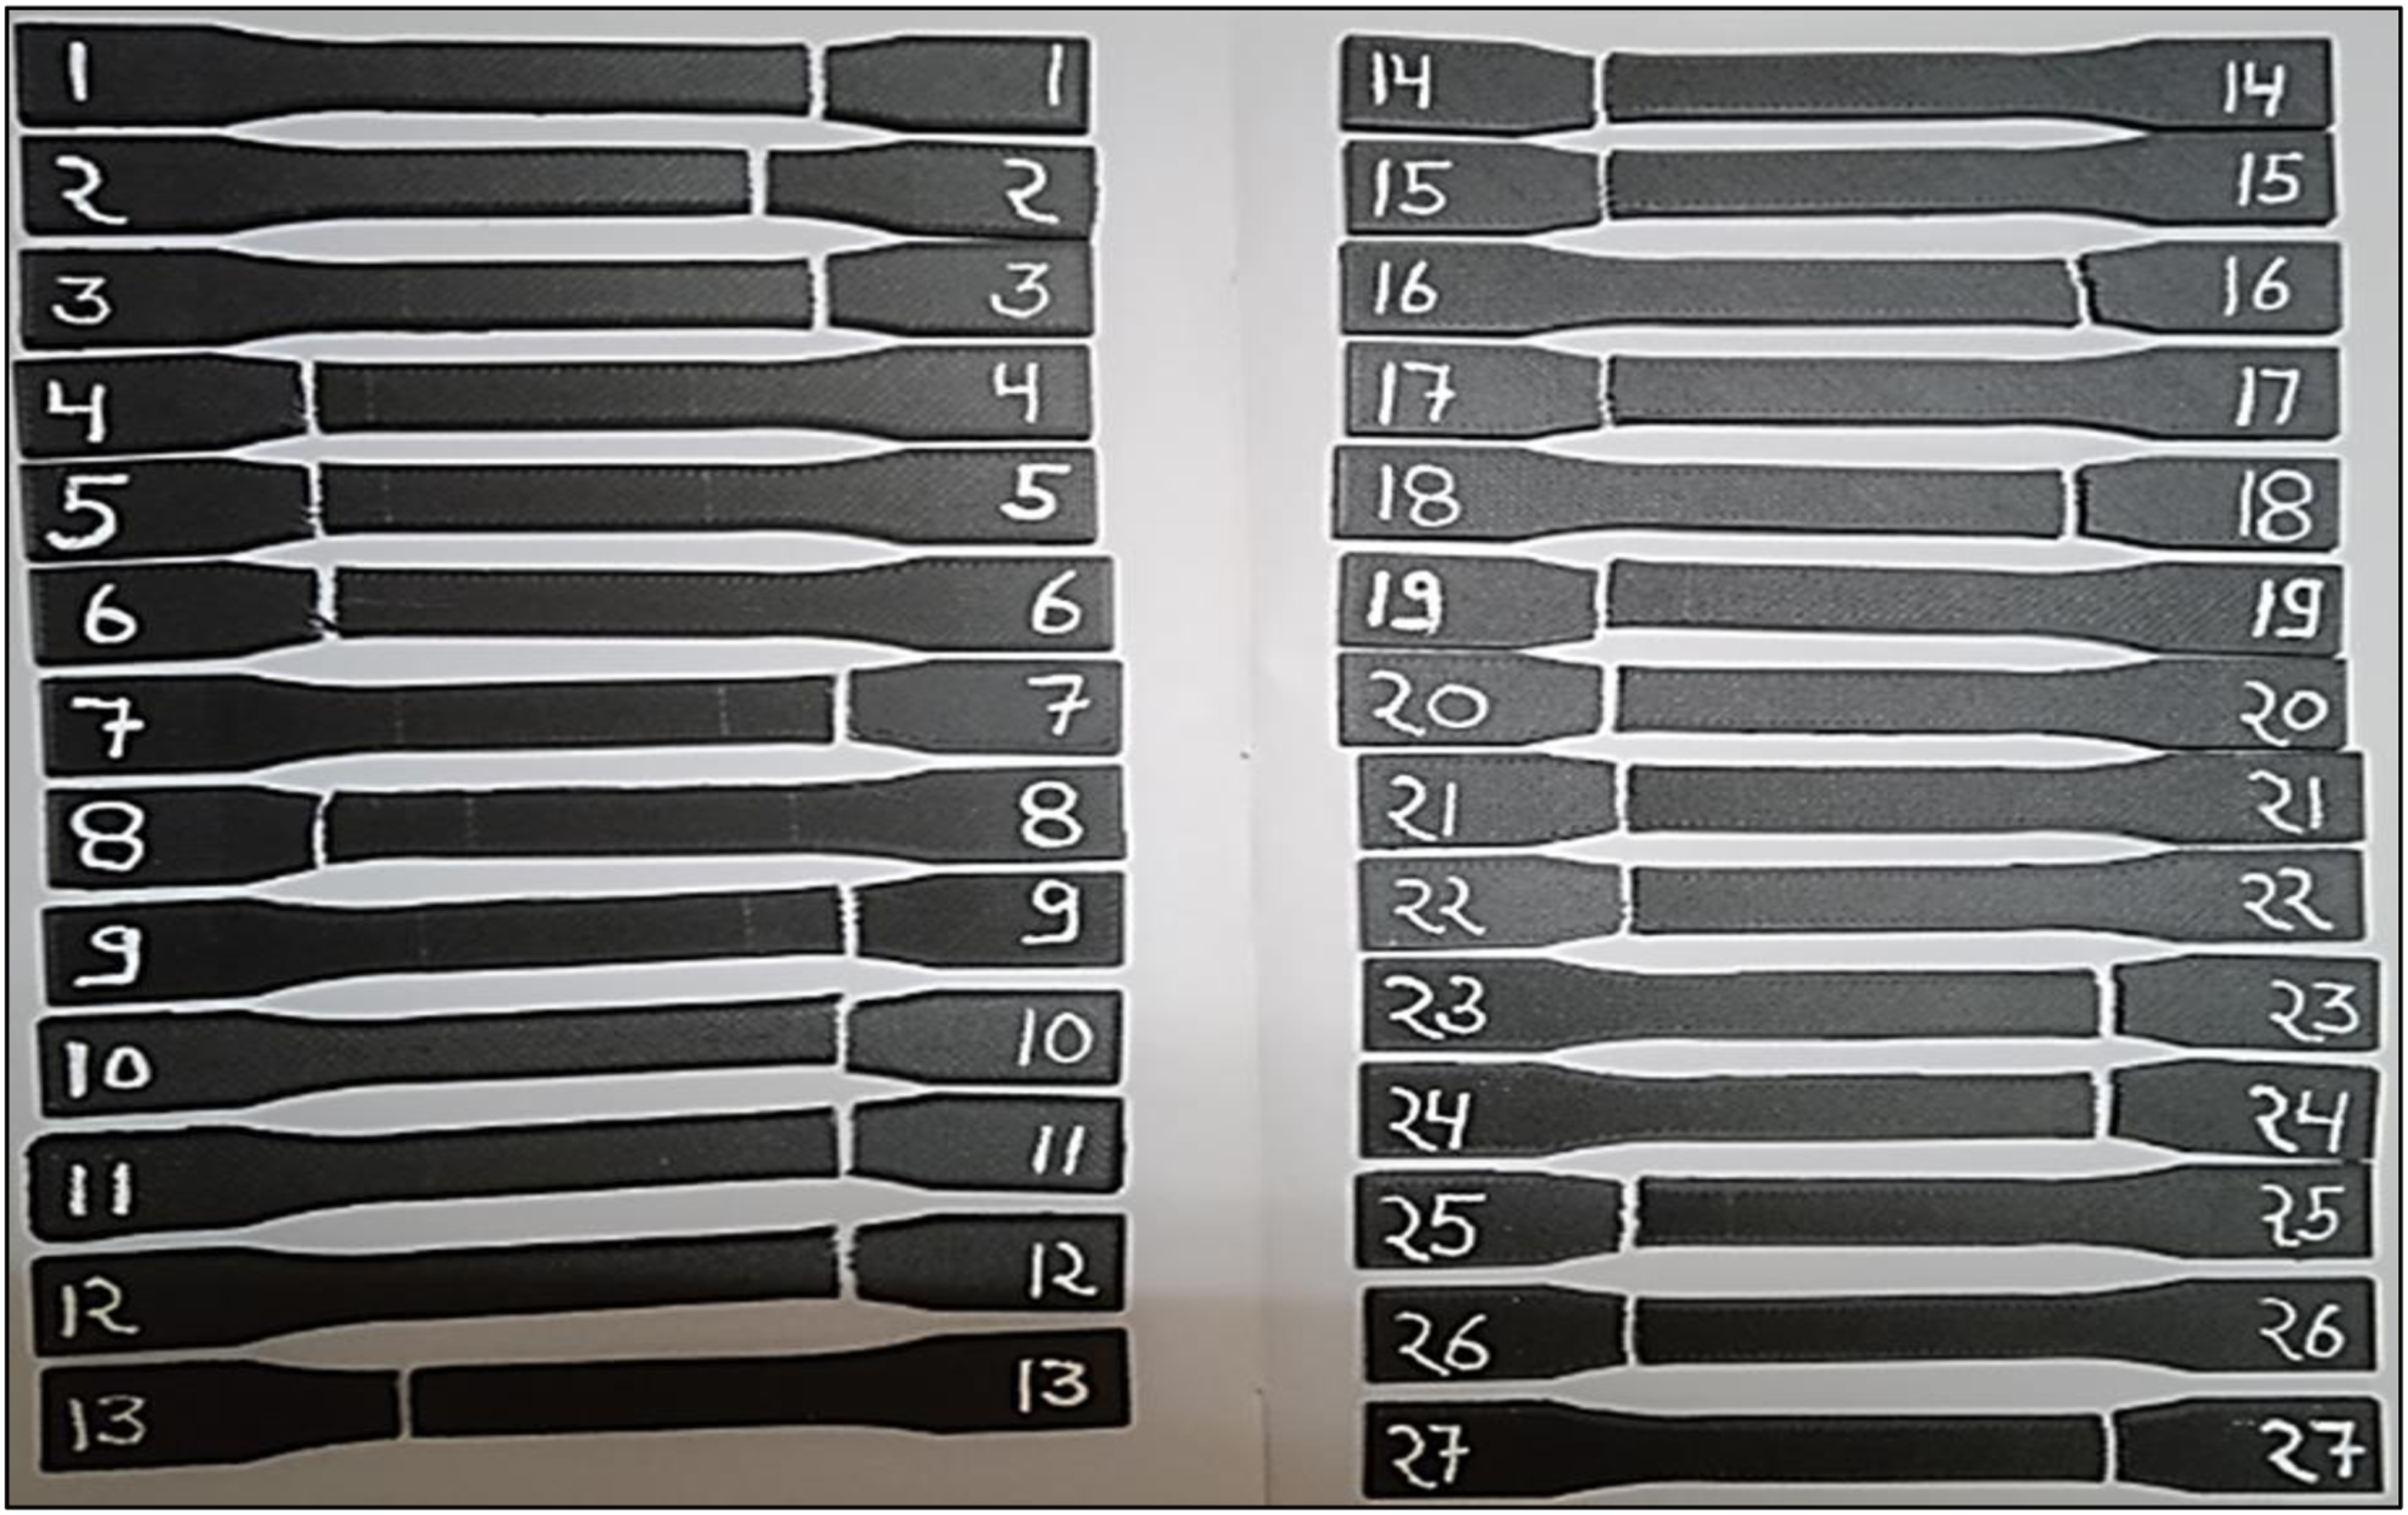
Specimens after tensile testing.
Results and discussion
Effect of RA
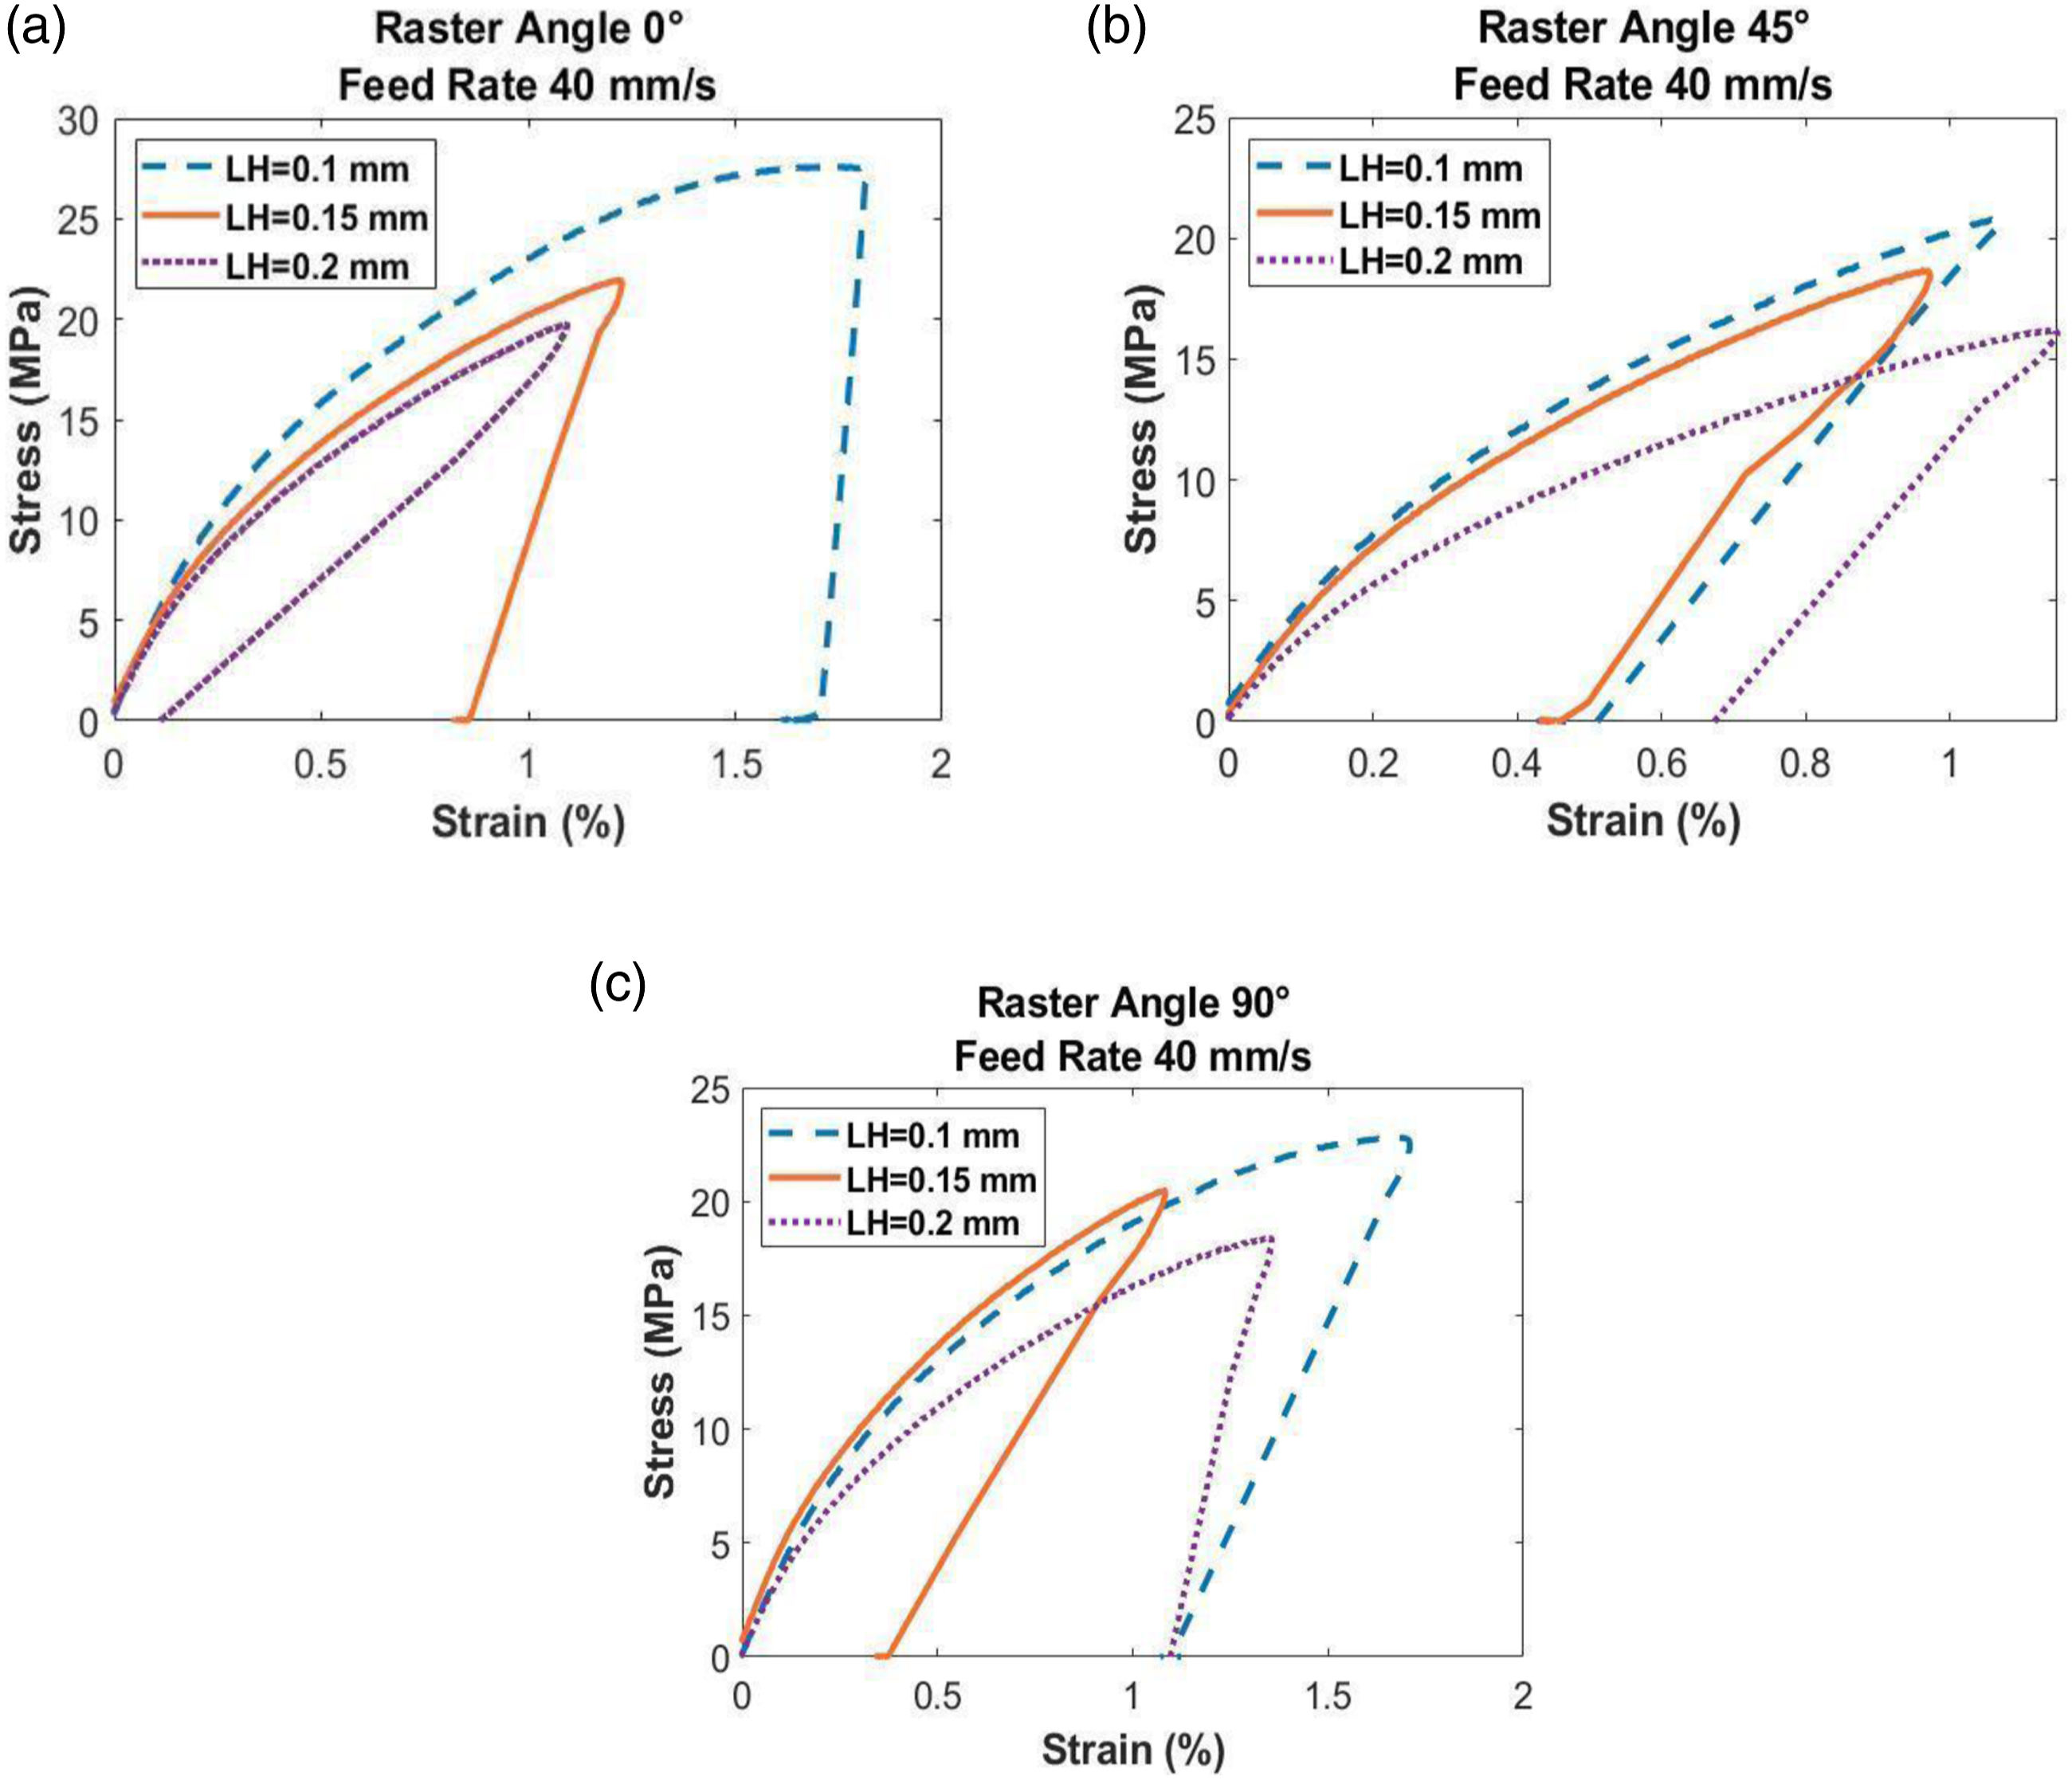
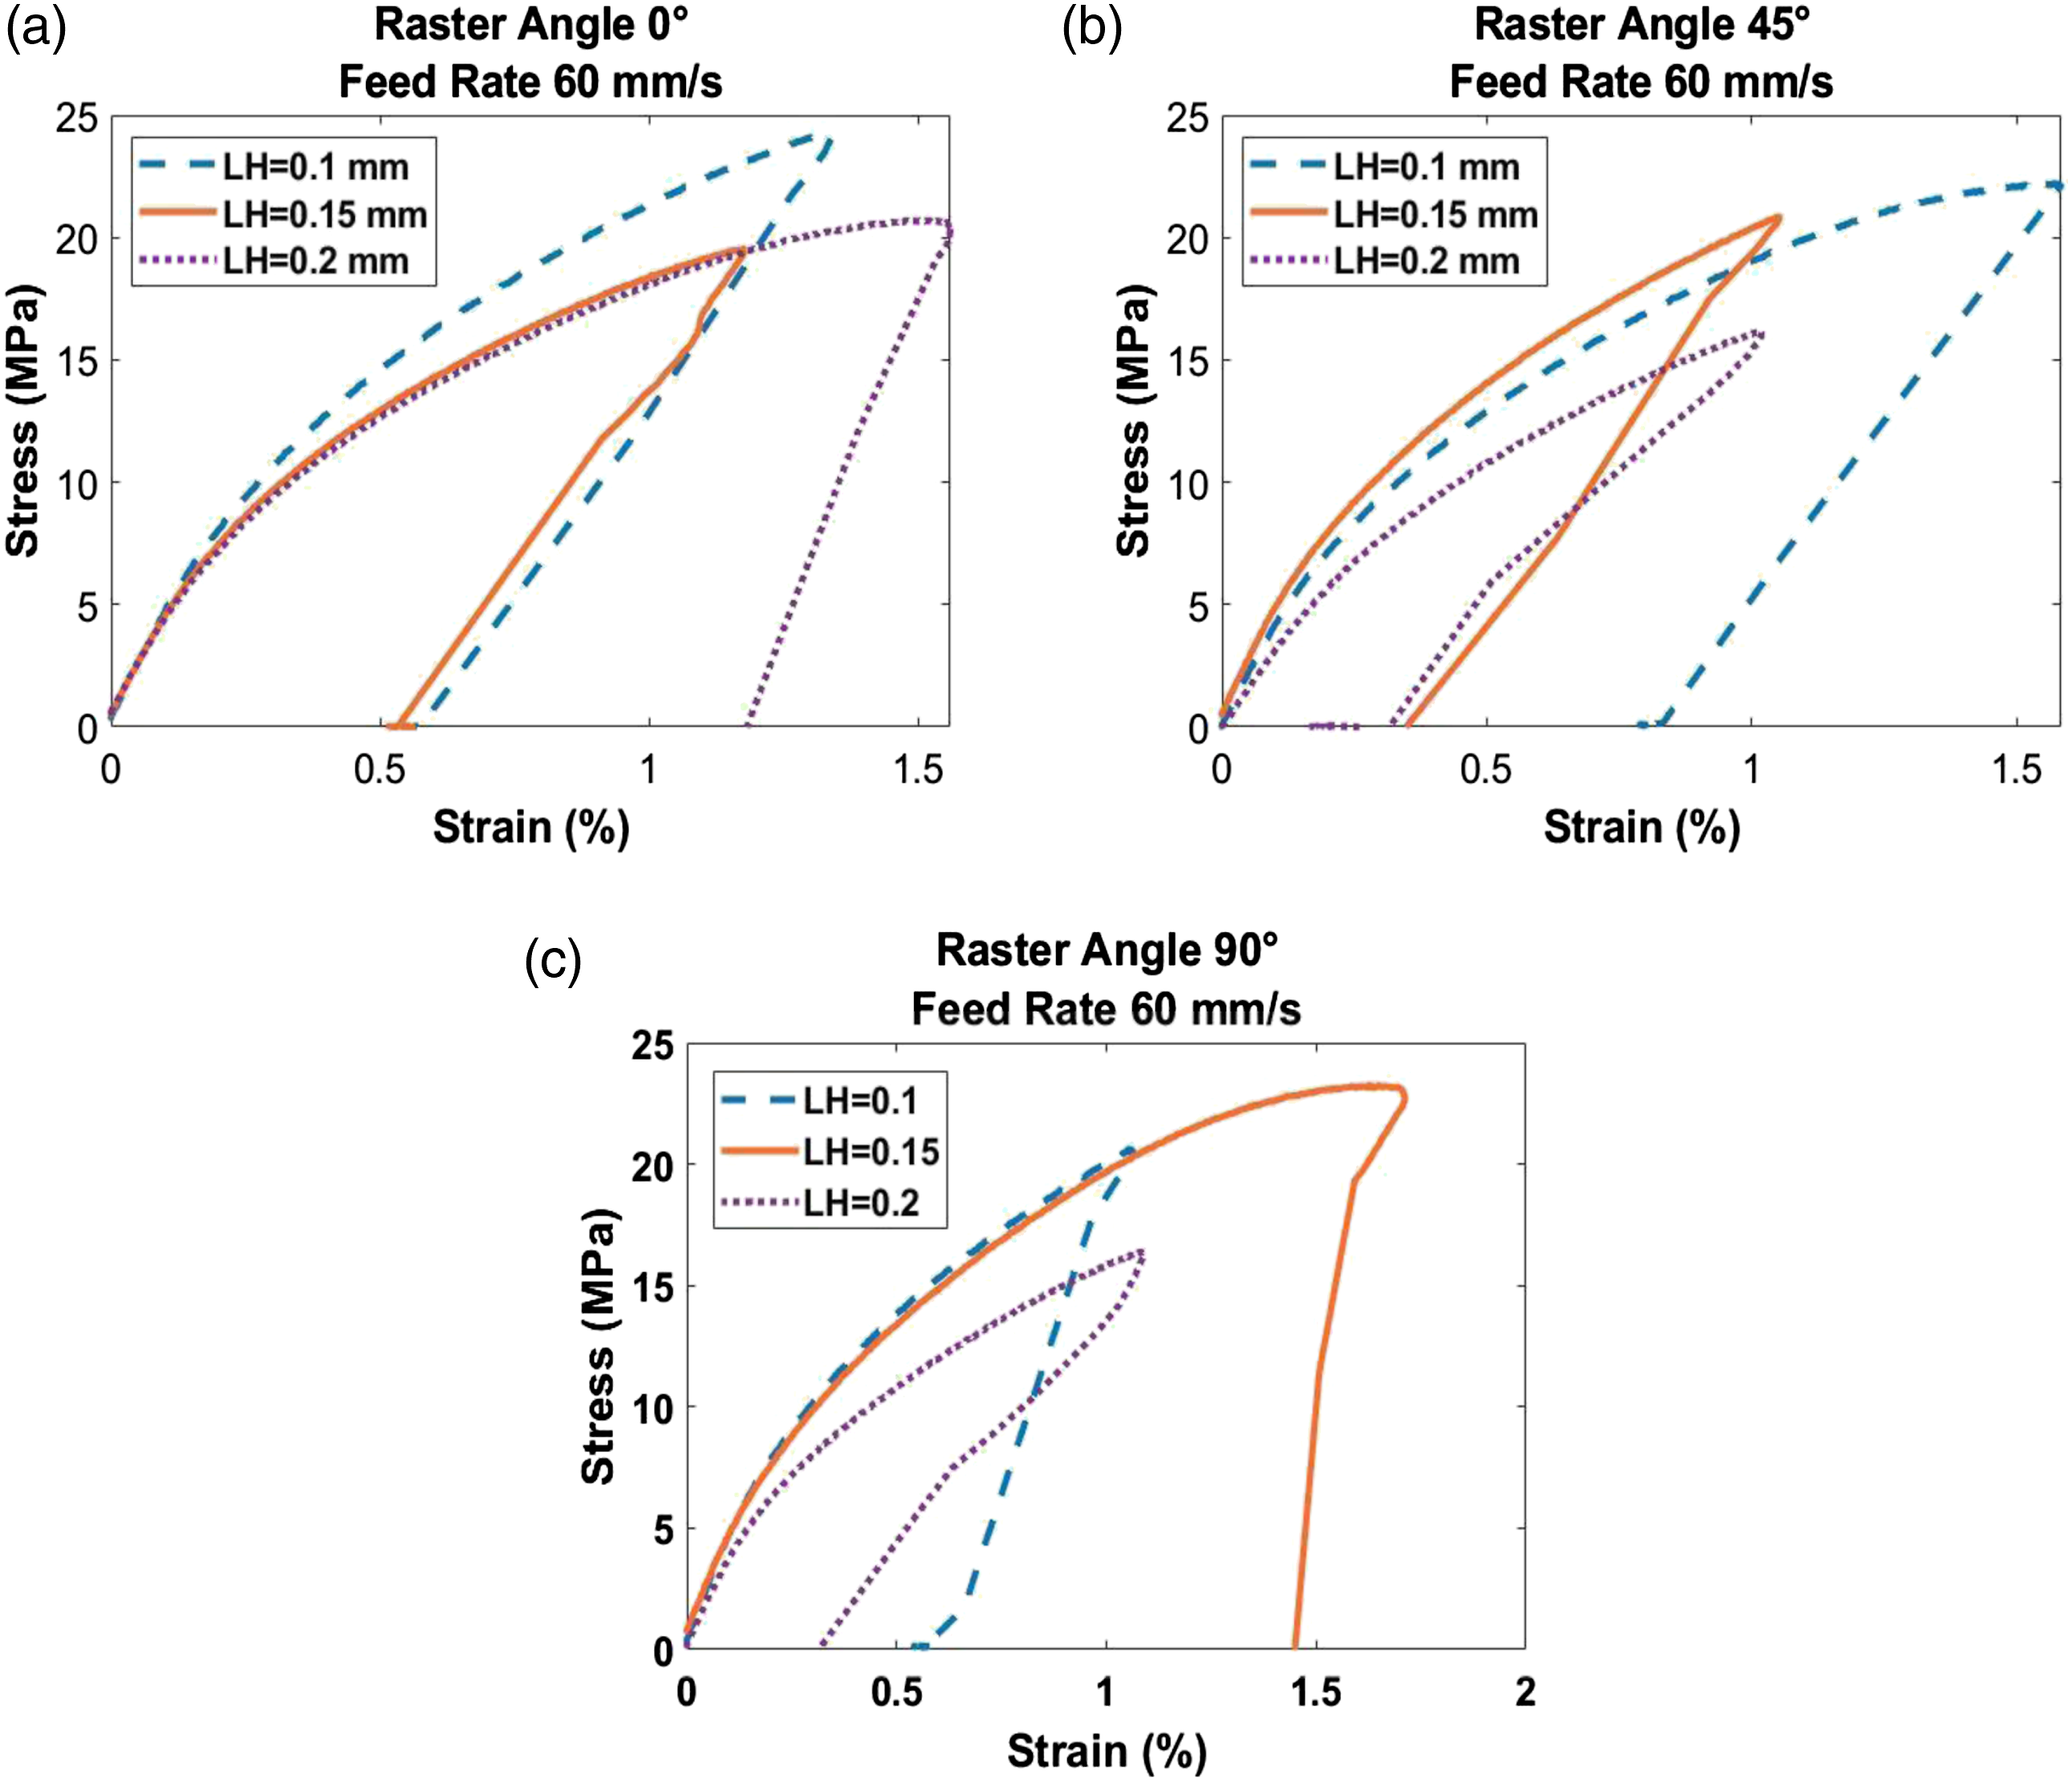
The RA is one of the process variables that has a noteworthy impact on the anisotropic characteristics of the fabricated parts. The mechanical behaviour can be tailored based on the alteration in different process parameters. These figures (Figures 4–6) exhibit that the tensile properties for the considered material, CF-PLA, increases with the decrease of the RA. The stress-strain variation is depicted in these graphs for particular at varying FR. Effect of the RA (at LH = 0.1 mm). Effect of RA (at LH = 0.15 mm). Effect of RA (at LH = 0.2 mm).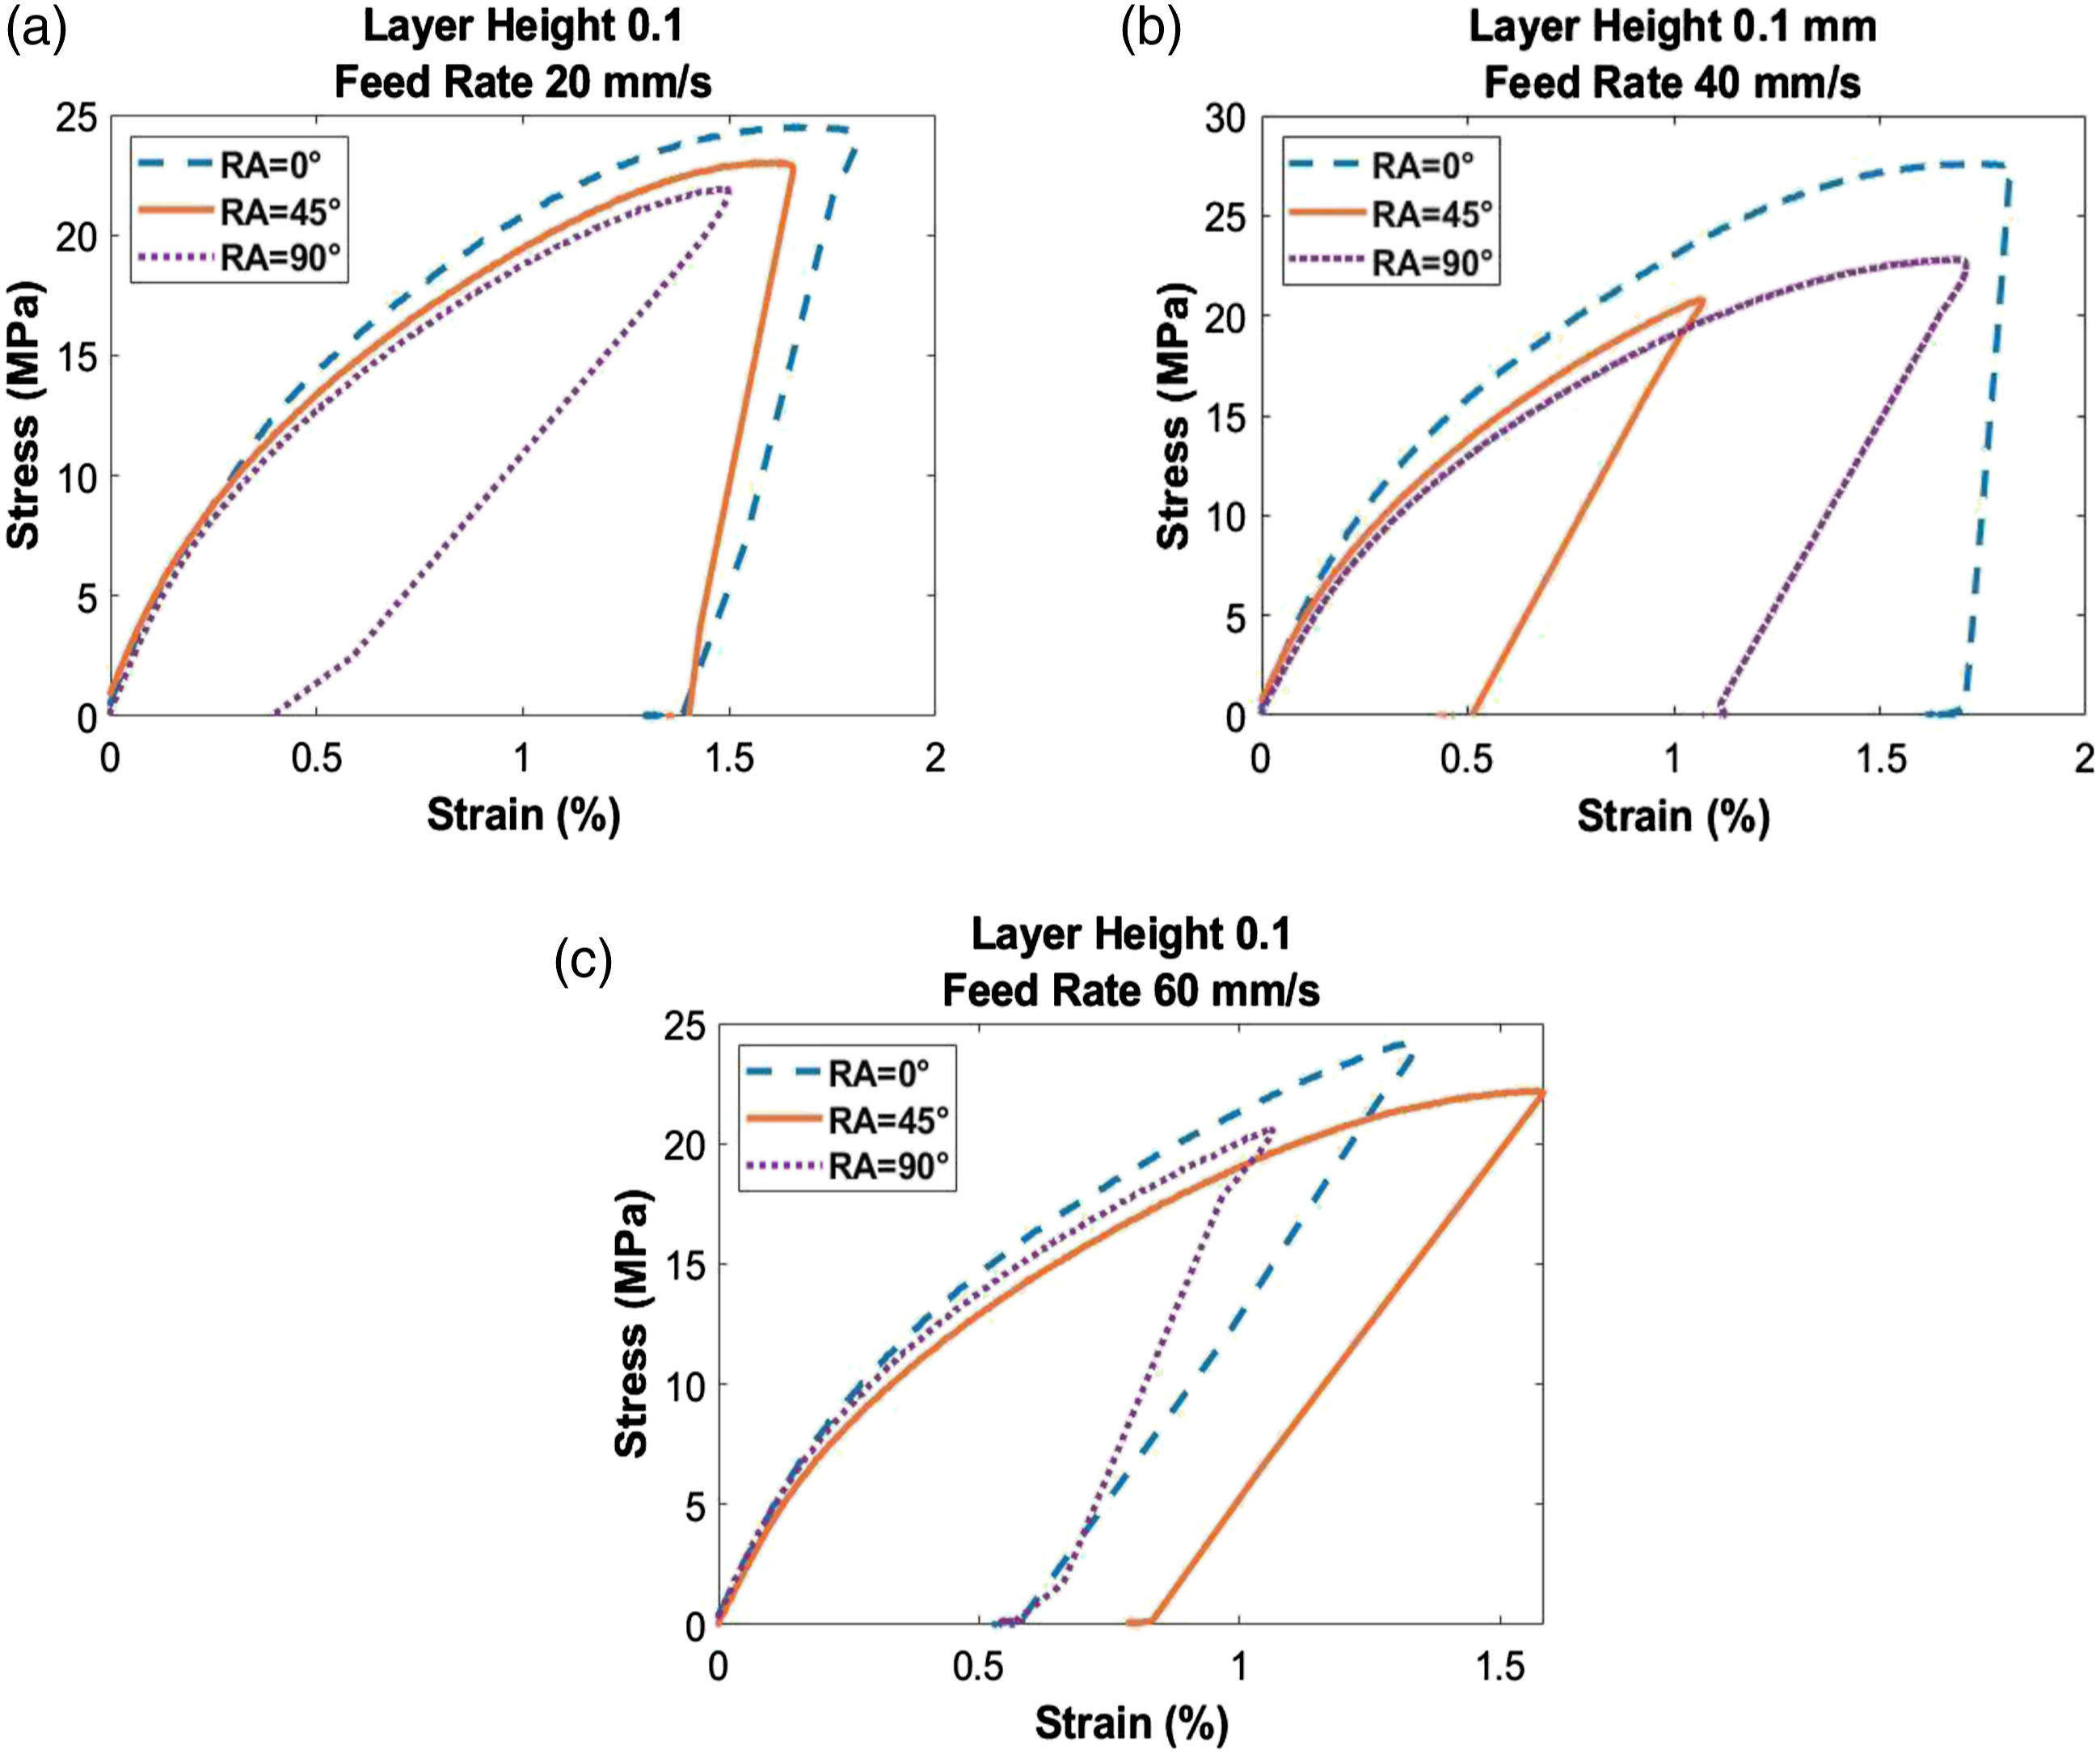
Maximum TS of 27.62 MPa was obtained at 0° RA and FR 40 mm/s, when all fibres were aligned in the direction of loading. Additionally, all raster’s deposition is parallel with the direction of the force at 0° RA, and due to the parallel arrangement of individual rasters in a layer can bear additional load application. This makes the specimen more robust since the tensile force is distributed evenly across the fibres and the bonding strength between the rasters is diminished. At LH 0.1 mm, RA 90°, and FR 60 mm/s, the minimum TS is 20.62 MPa, Figure 4(c). This is because the strength of the manufactured part is dictated by the strength of the neighbouring rasters bond, which is always lower than continuous deposition, and the layers are arranged at 90° to the direction of the tensile force. This results in a 33.95% improvement in TS at LH 0.1 mm.
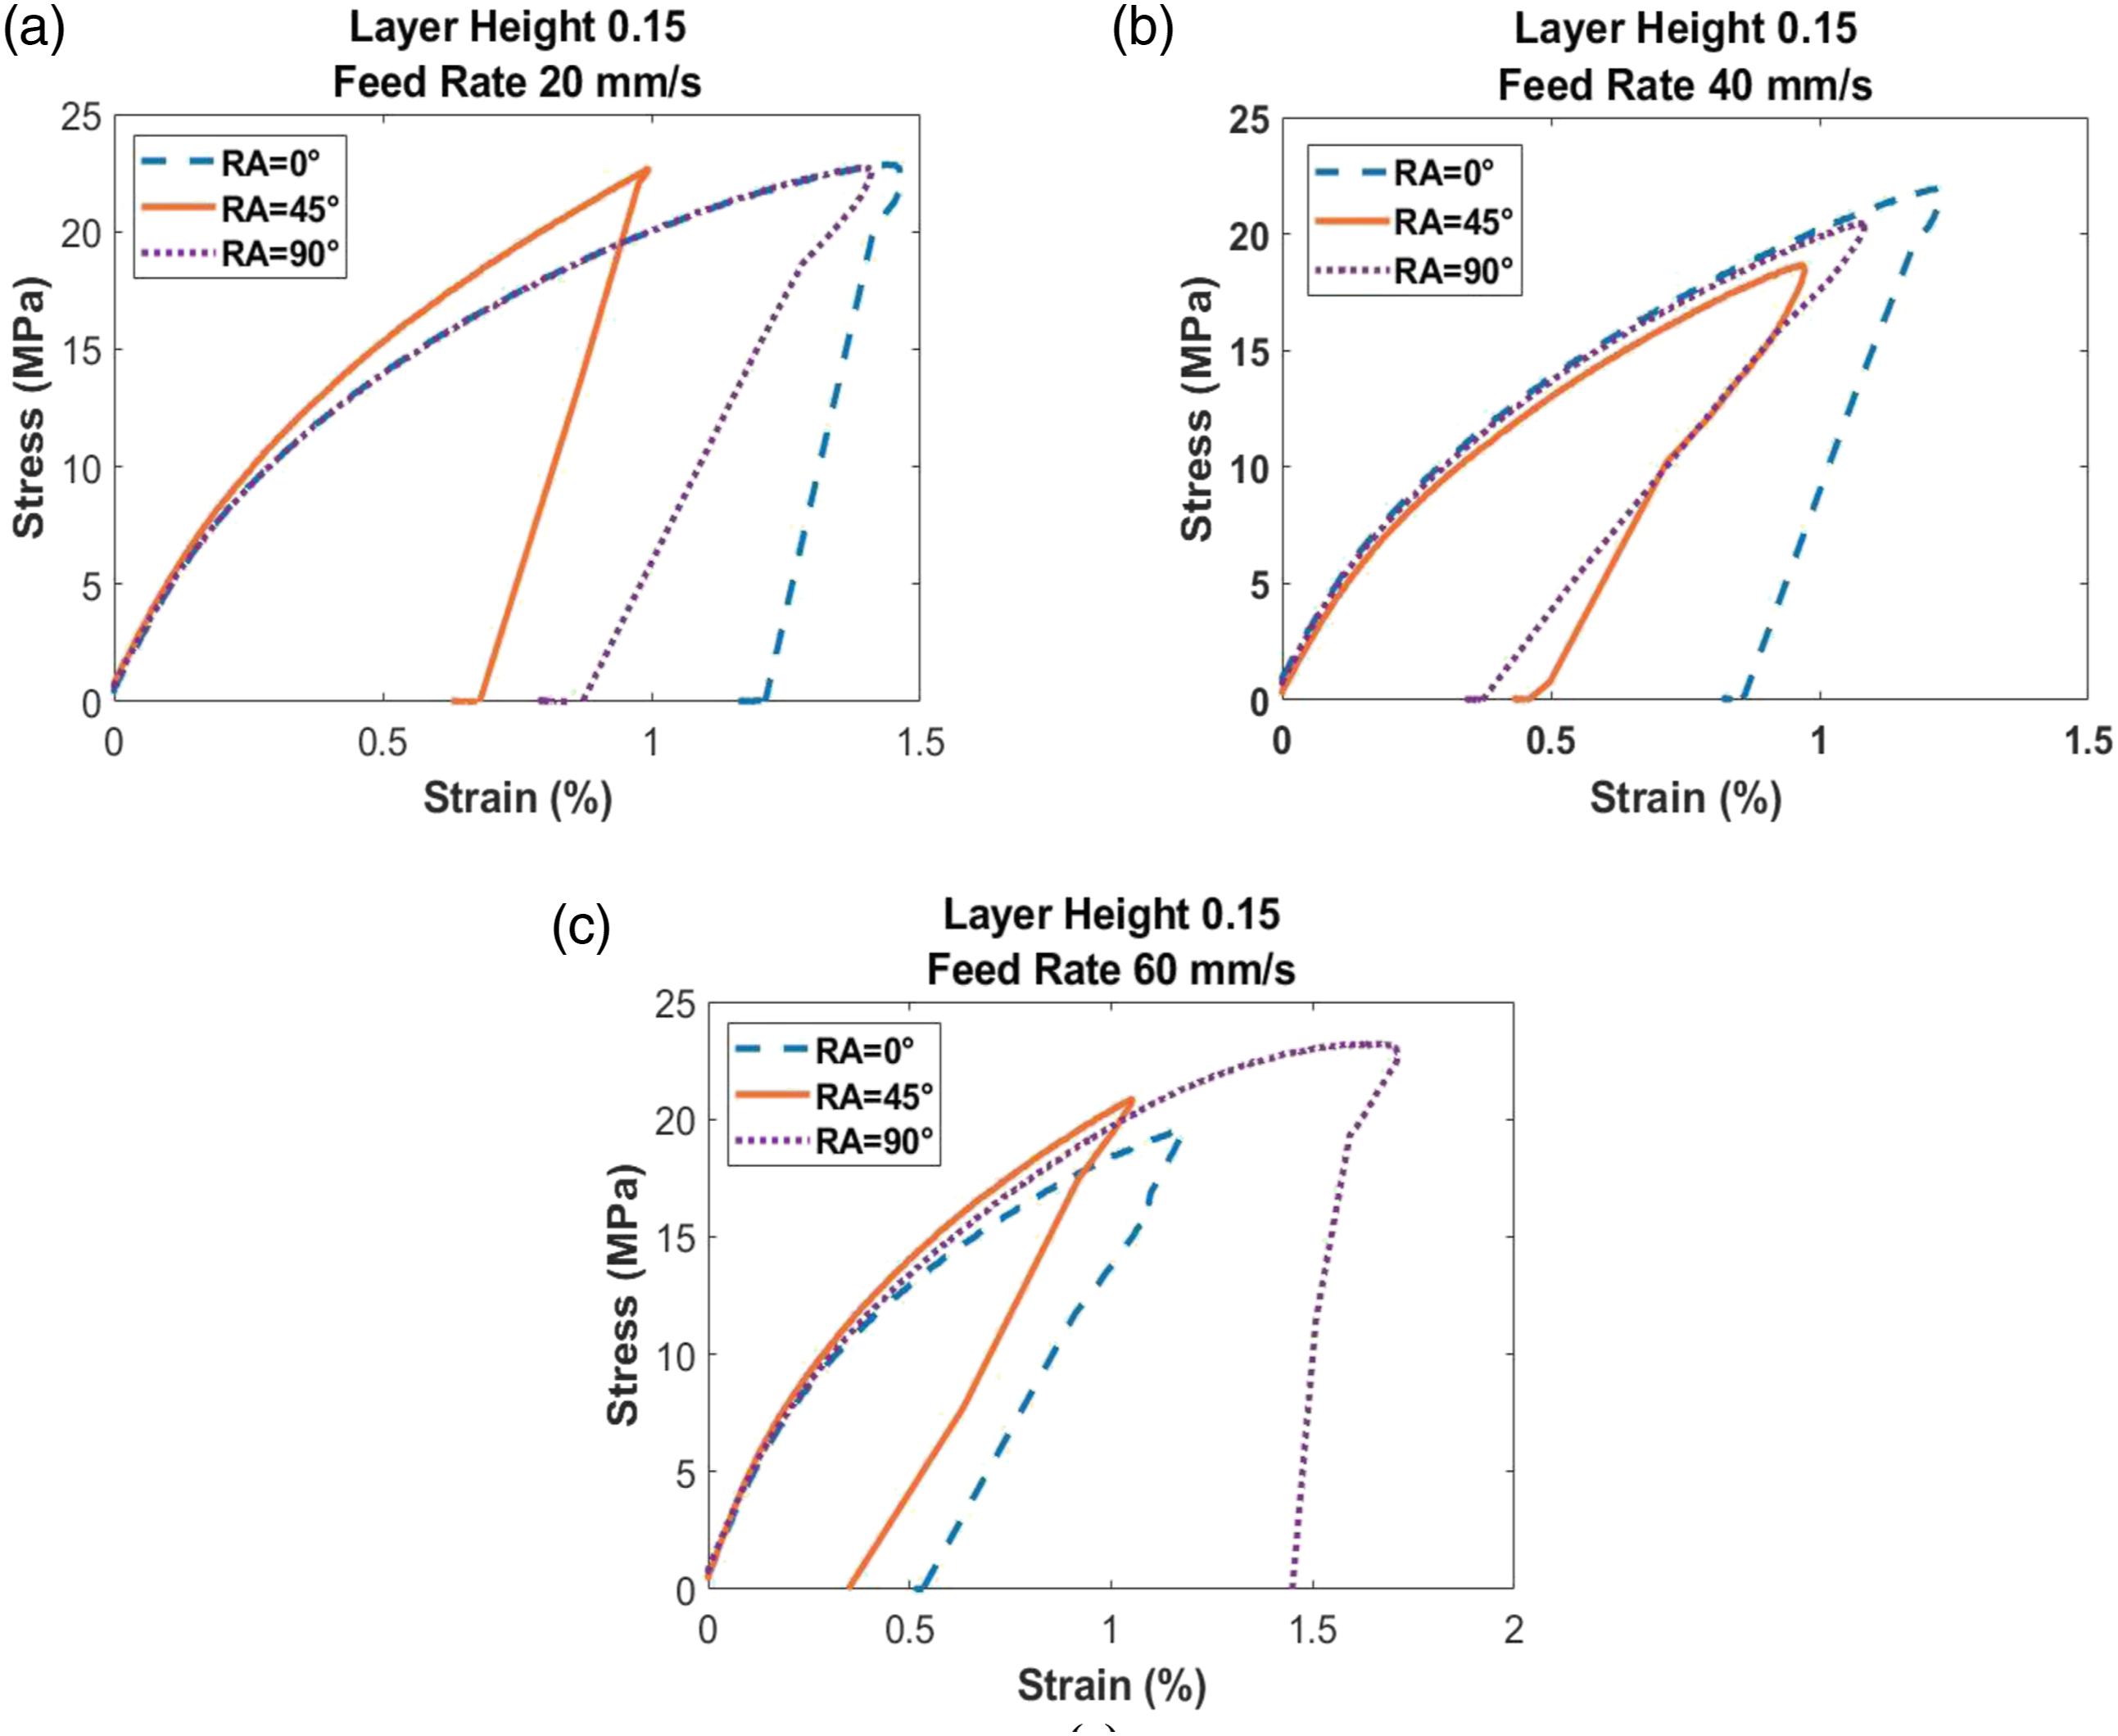
The effect of RA for various FR is given away in Figure 5 at LH 0.15 mm. The highest TS, 23.26 MPa, is obtained at a 90° RA with a FR of 60 mm/s, and the lowest TS, 18.67 MPa, is obtained at a 45° RA with a FR of 40 mm/s, resulting in a 24.58% increment at LH 0.15 mm. Specimen with RA 45° exhibits the strength between that of RA 0° and 90°. The TS is controlled by the bond between adjacent rasters at RA 45°.
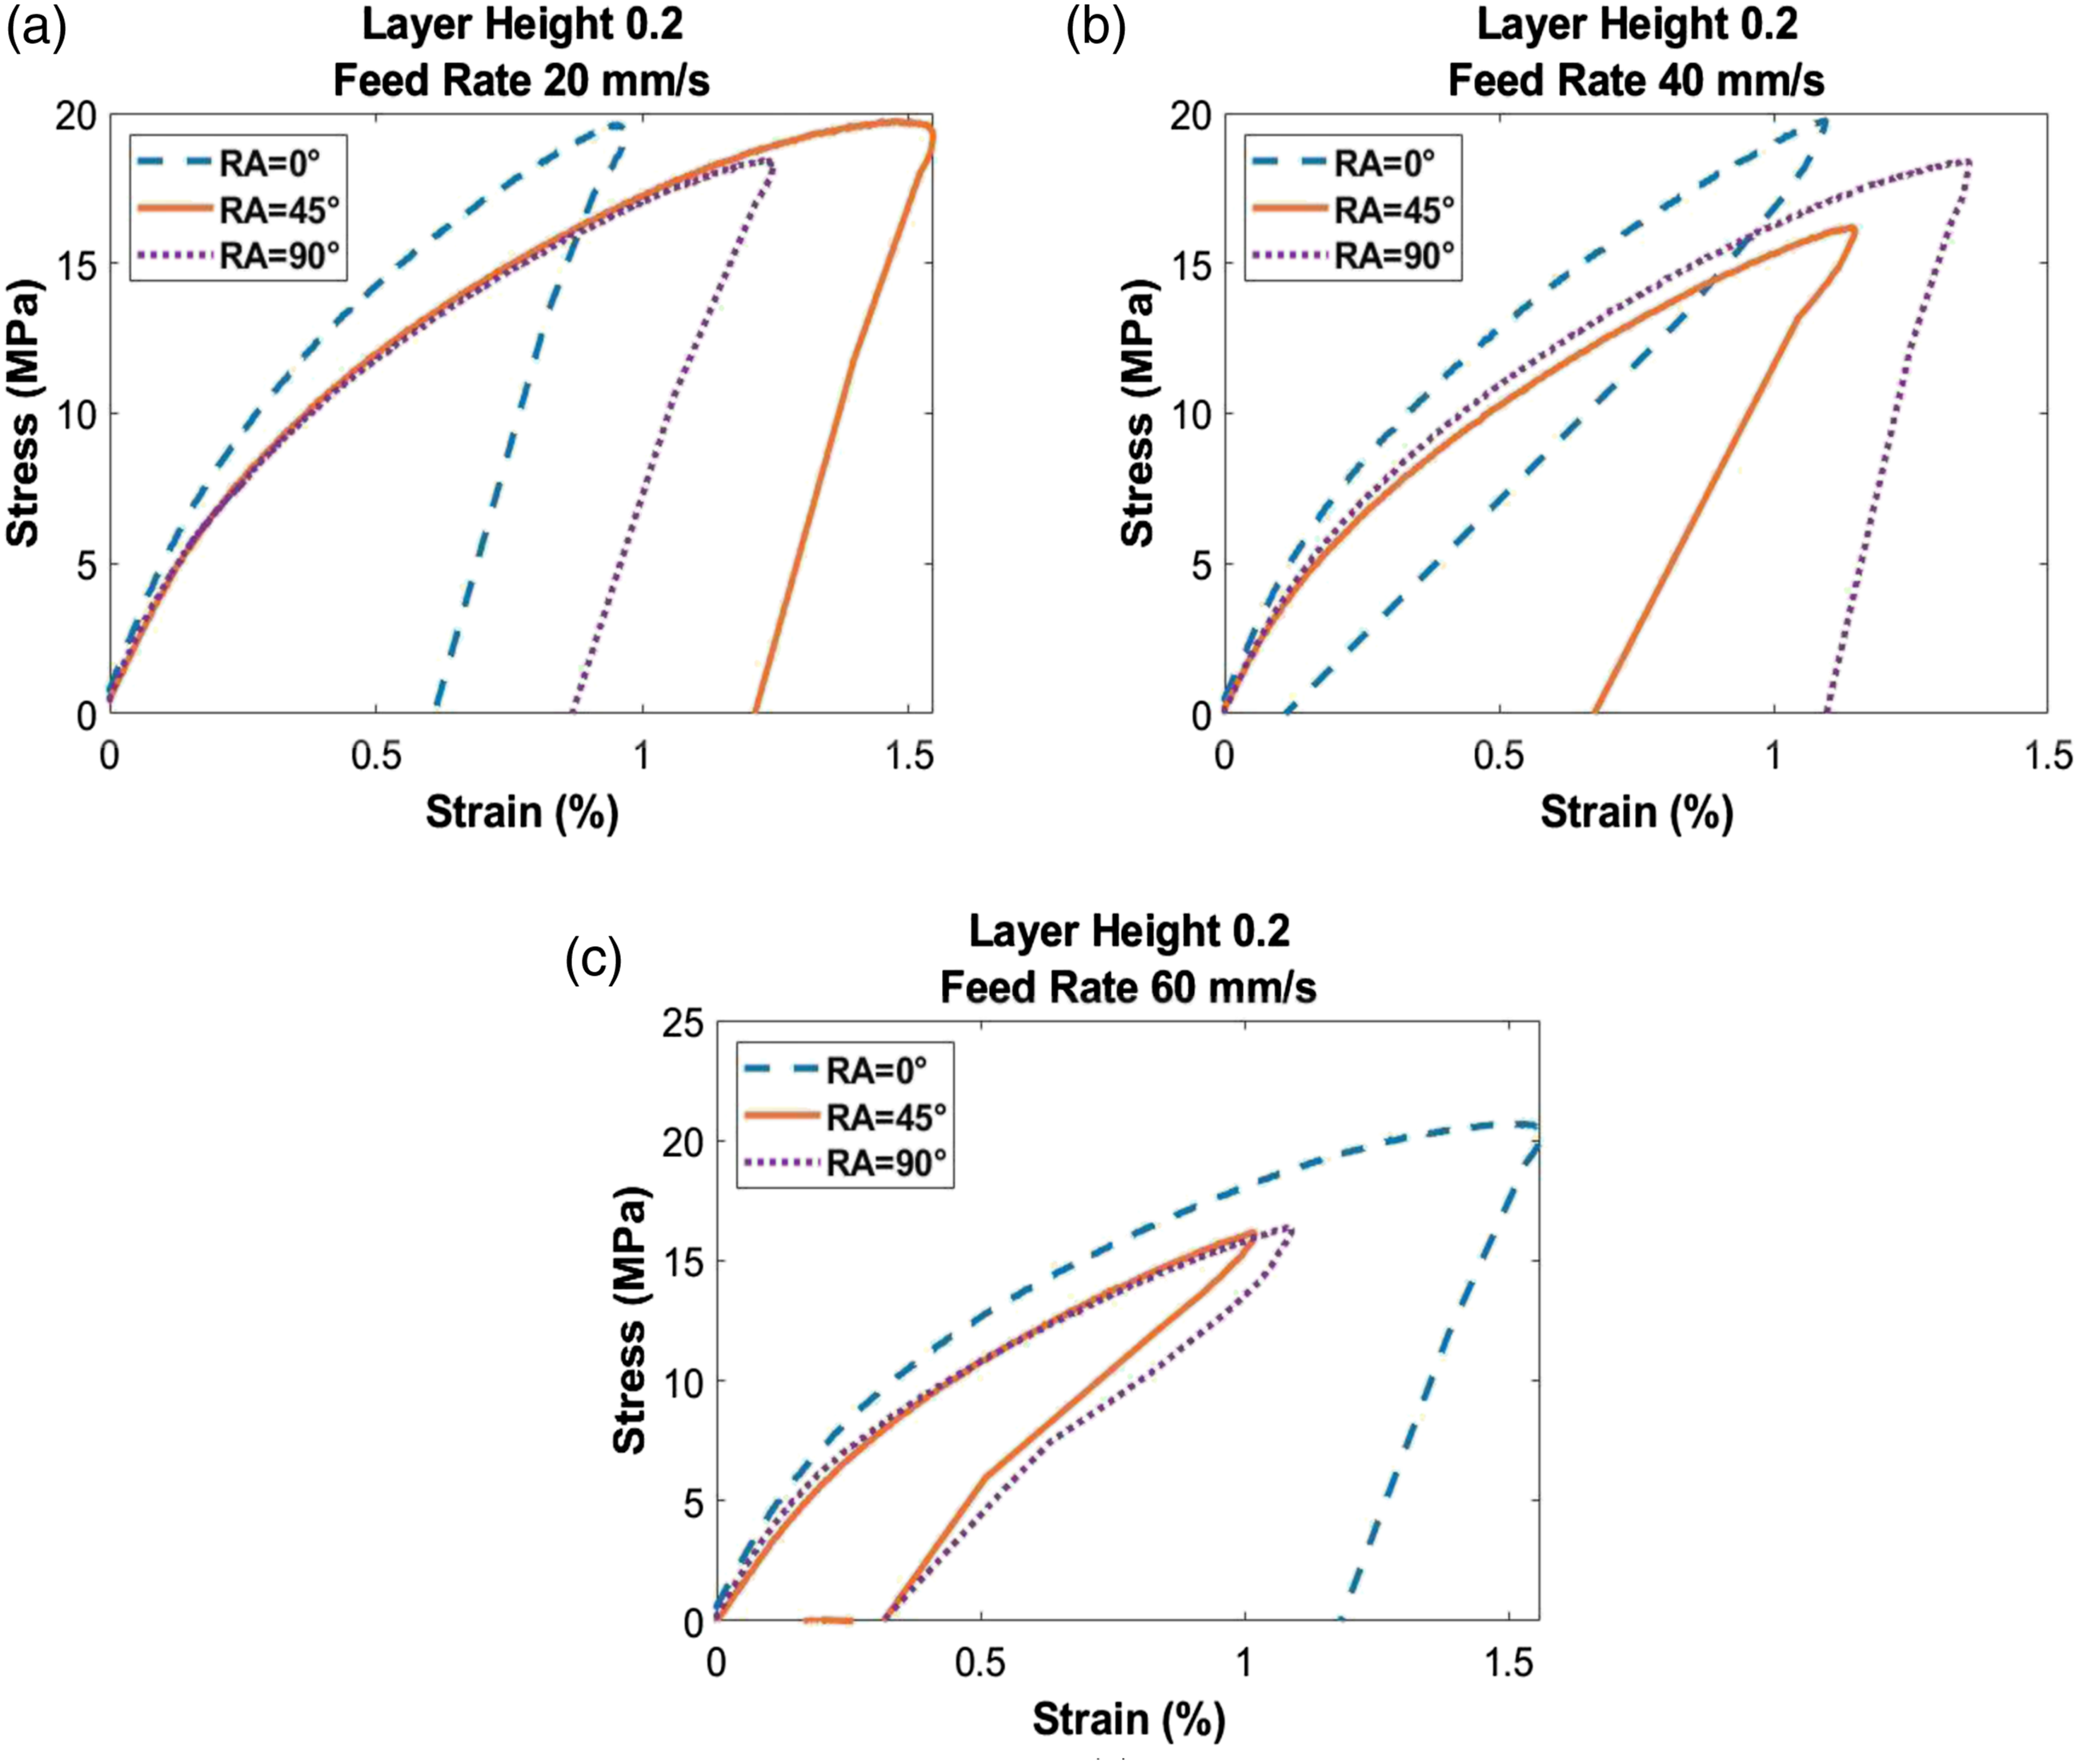
At LH of 0.2 mm, the stress-strain variation as seen in Figure 6. The highest TS, 20.7 MPa, is obtained at 0° RA with FR of 60 mm/s, while the lowest TS, 16.17 MPa, is obtained at a 45° RA with a FR of 60 mm/s, because fracture occurs along the raster thereby depicting the 28.01 percent increment at LH 0.2 mm. Fracture occurred perpendicular to the direction of the layer deposition, with a noteworthy percent elongation at 0° RA. Fracture occurs along the rasters when the RA is 45°.
Effect of LH
The following plots (Figures 7–9) demonstrate the effect of LH. The variation in TS at FR 20 mm/s and varying RAs is shown in Figure 7. With the increment of LH, TS of the material diminishes. It is seen that the highest TS, 24.52 MPa, for LH 0.1 mm and RA 0°. This is due to the fact that a reduced LH leads larger bonding area between layers, which increases strength and thus the ability to bear more tension. The area of raster bonding diminishes as the LH rises, resulting in lower TS. Effect of LH (at FR = 20 mm/s). Effect of LH (at FR = 40 mm/s). Effect of LH (at FR = 60 mm/s).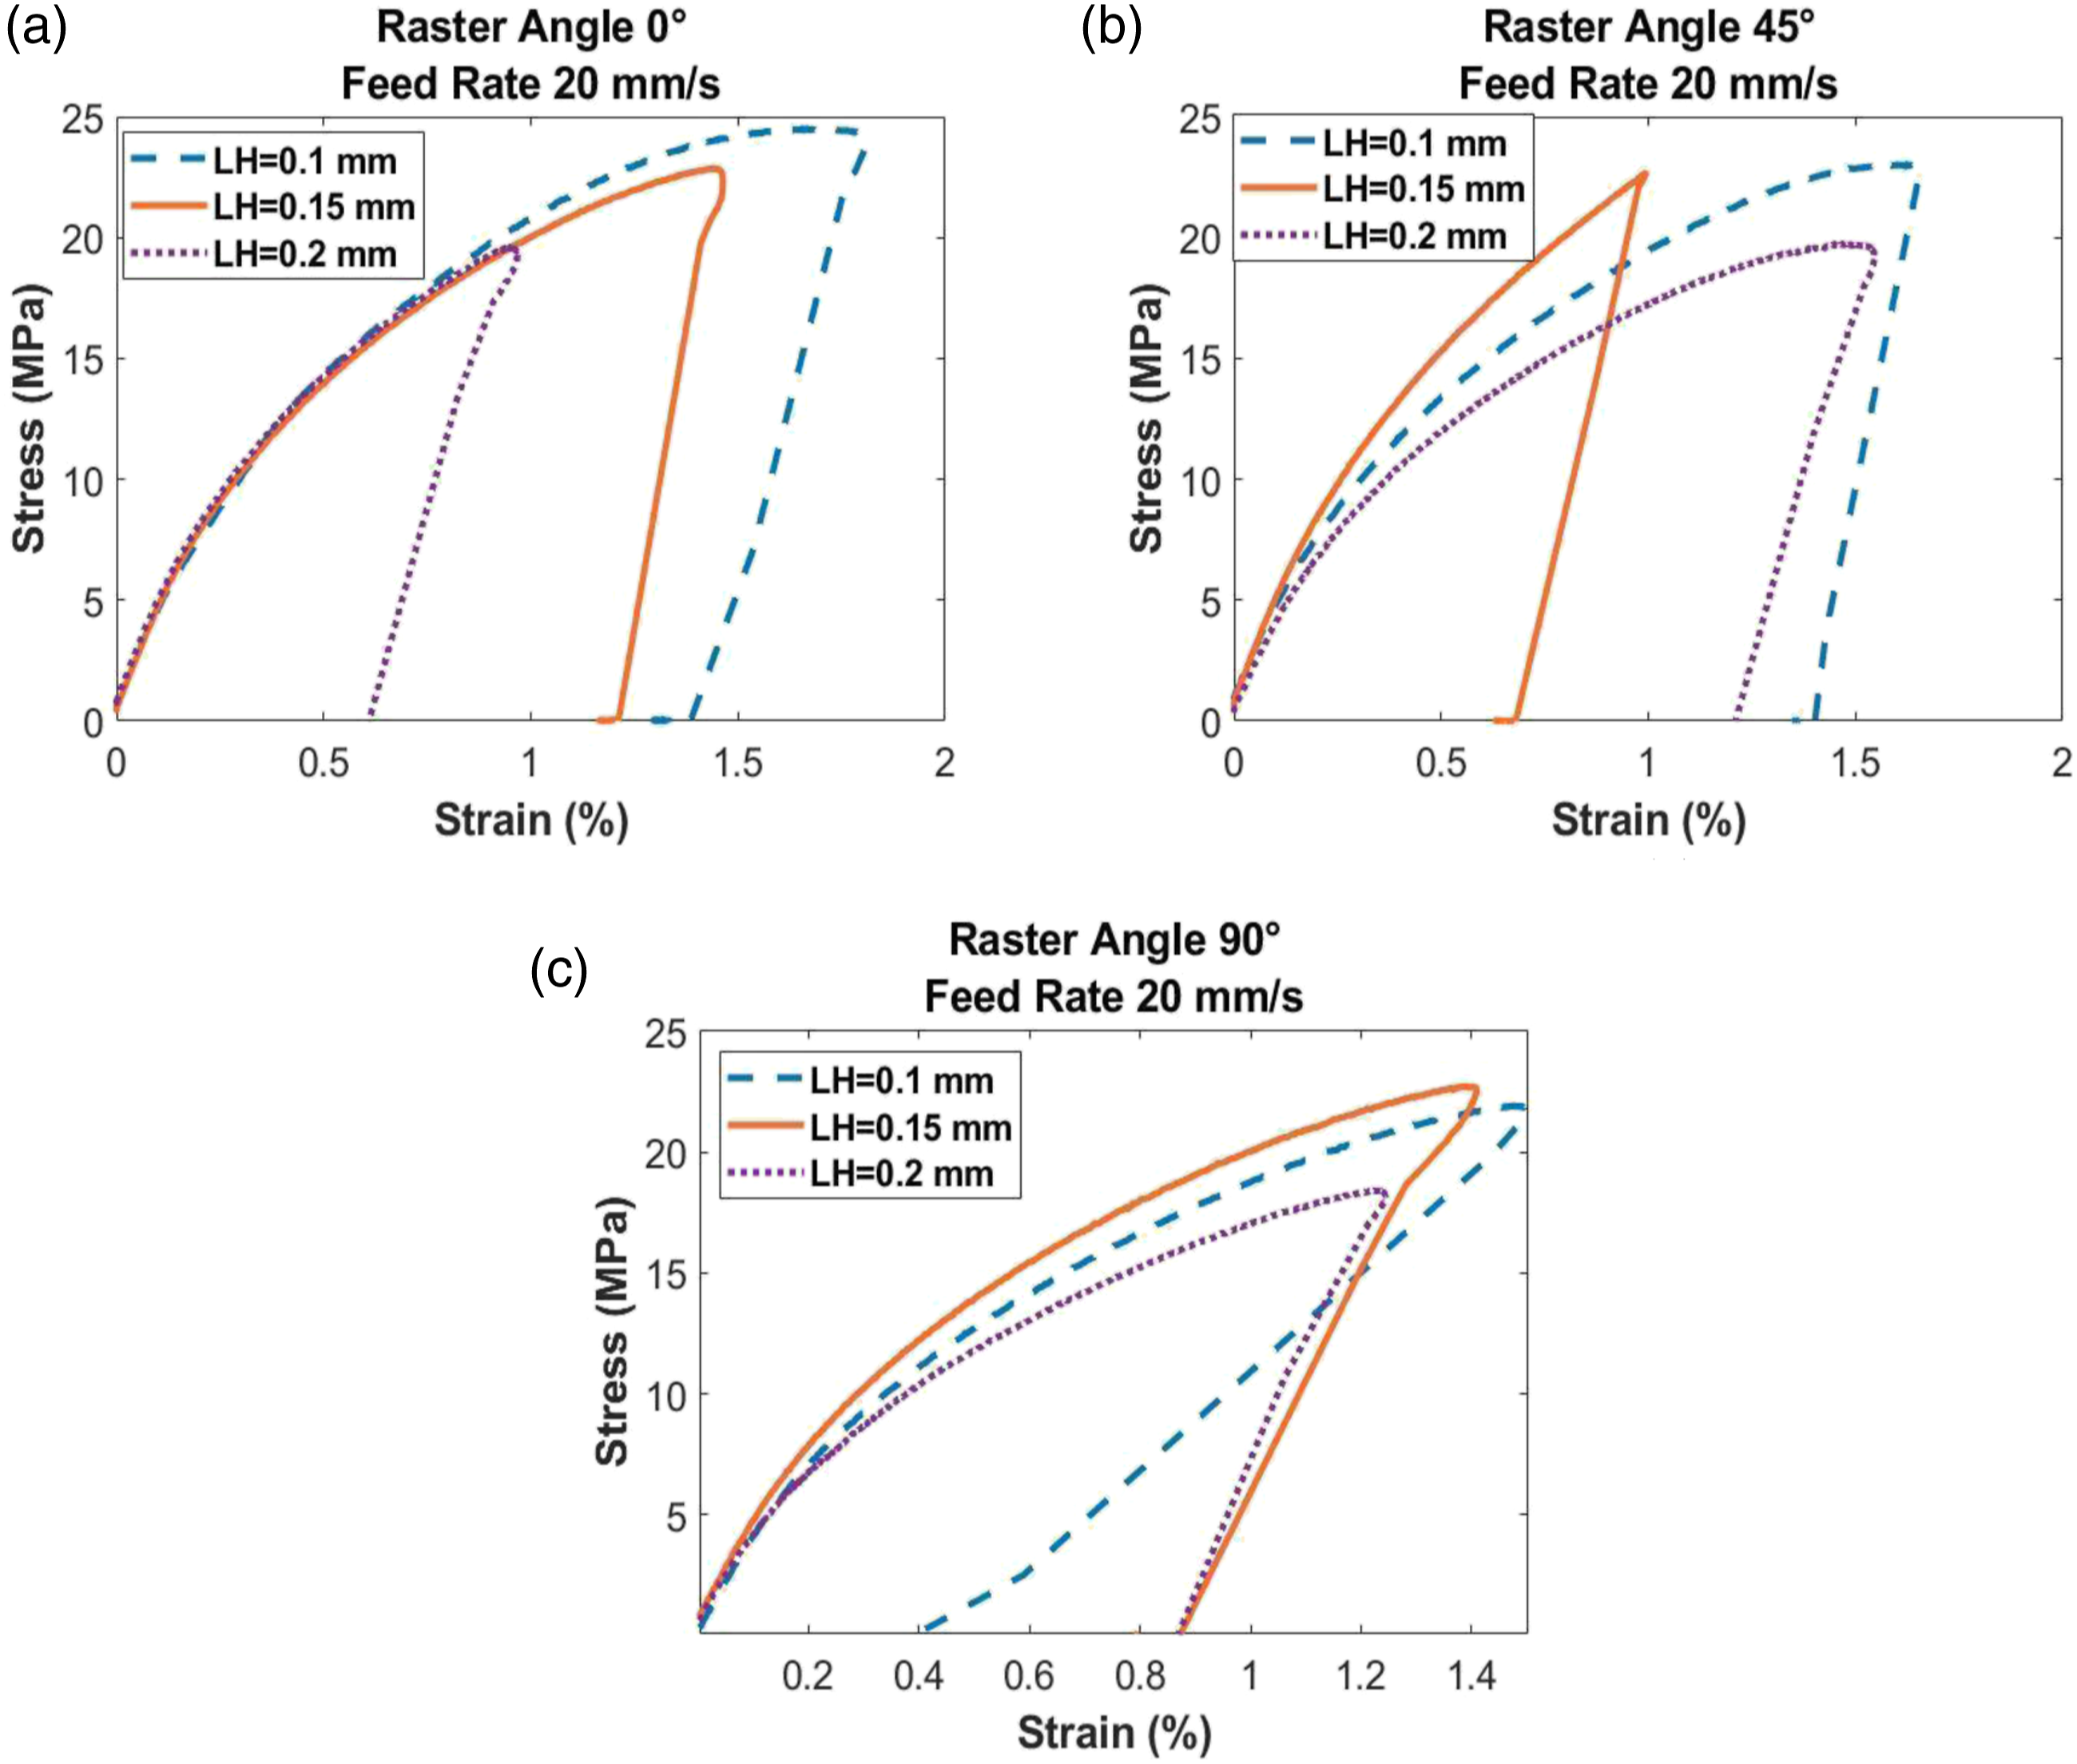
Additionally, at lower LH, higher extrusion force may aid in the quick and intimate link between layers, resulting in increased bond area. Stiffness has been shown to be lowest at the highest LH. Minimum TS at FR 20 mm/s is 18.43 MPa for RA 90° and LH 0.2 mm, and maximum TS for RA 0° and LH 0.1 mm is 24.52 MPa, with an enhancement of 33.04%.
The stress-strain curves are plotted for effect of LH at a FR of 40 mm/s, Figure 8. The lowest TS, 16.21 MPa, is achieved at RA 45° and LH 0.2 mm while the highest TS, 27.62 MPa, is observed with the maximum percent elongation at break 1.617% for RA 0° and LH 0.1 mm. It is improved by 70.39%.
A rise in LH reduces the interlayer bonding by reducing the quantity of the deposited material of the same height and increasing the voids between the layers. In the same way, the bonding strength between extruded filaments is weakened. Figure 9 depicts the variation in the TS for different LH and RA at constant FR of 60 mm/s, Figure 9(a). The stress-strain curve with LH 0.2 mm and RA 45°, the minimum TS, 16.17 MPa, is obtained with 0.177% elongation while at LH 0.1 mm and RA 0°, the highest TS, 24.21 MPa, is achieved with elongation of 0.535%, resulting in a 49.72% increase at FR 60 mm/s. Furthermore, when the depositing speed remains constant, increasing the LH reduces the material’s cooling time, altering the adhesion between layers, and lowering the tensile characteristics of FFF-printed materials.
Effect of FR
The FR has an effect on the performance of fabricated parts because it influences the area of the specimen’s cross-section in the direction of tensile force as well as the layer-to-layer bonding strength. The void content in the material reduces with the increment in FR, while the bonding area improves. It shows a substantial reduction in printing time with the increment of FR, implying that fabrication costs can be reduced.
When the FR was raised, the tensile plastic strain at break decreased, but to a lower extent than when the layer thickness was increased. It should be noted that the tensile elastic modulus revealed very high fluctuation regardless of the FR. At RA 0°, the lowest TS, 19.54 MPa, with FR 60 mm/s and LH 0.15 mm, while the highest TS, 27.62 MPa, with FR 40 mm/s and the highest percent elongation, 1.617%, Figure 10, indicating that all the fibres that are oriented along the loading direction and all of the layers were laid out parallel to the loading direction, indicating a 41.35% increment of TS. Effect of FR (at RA = 0°).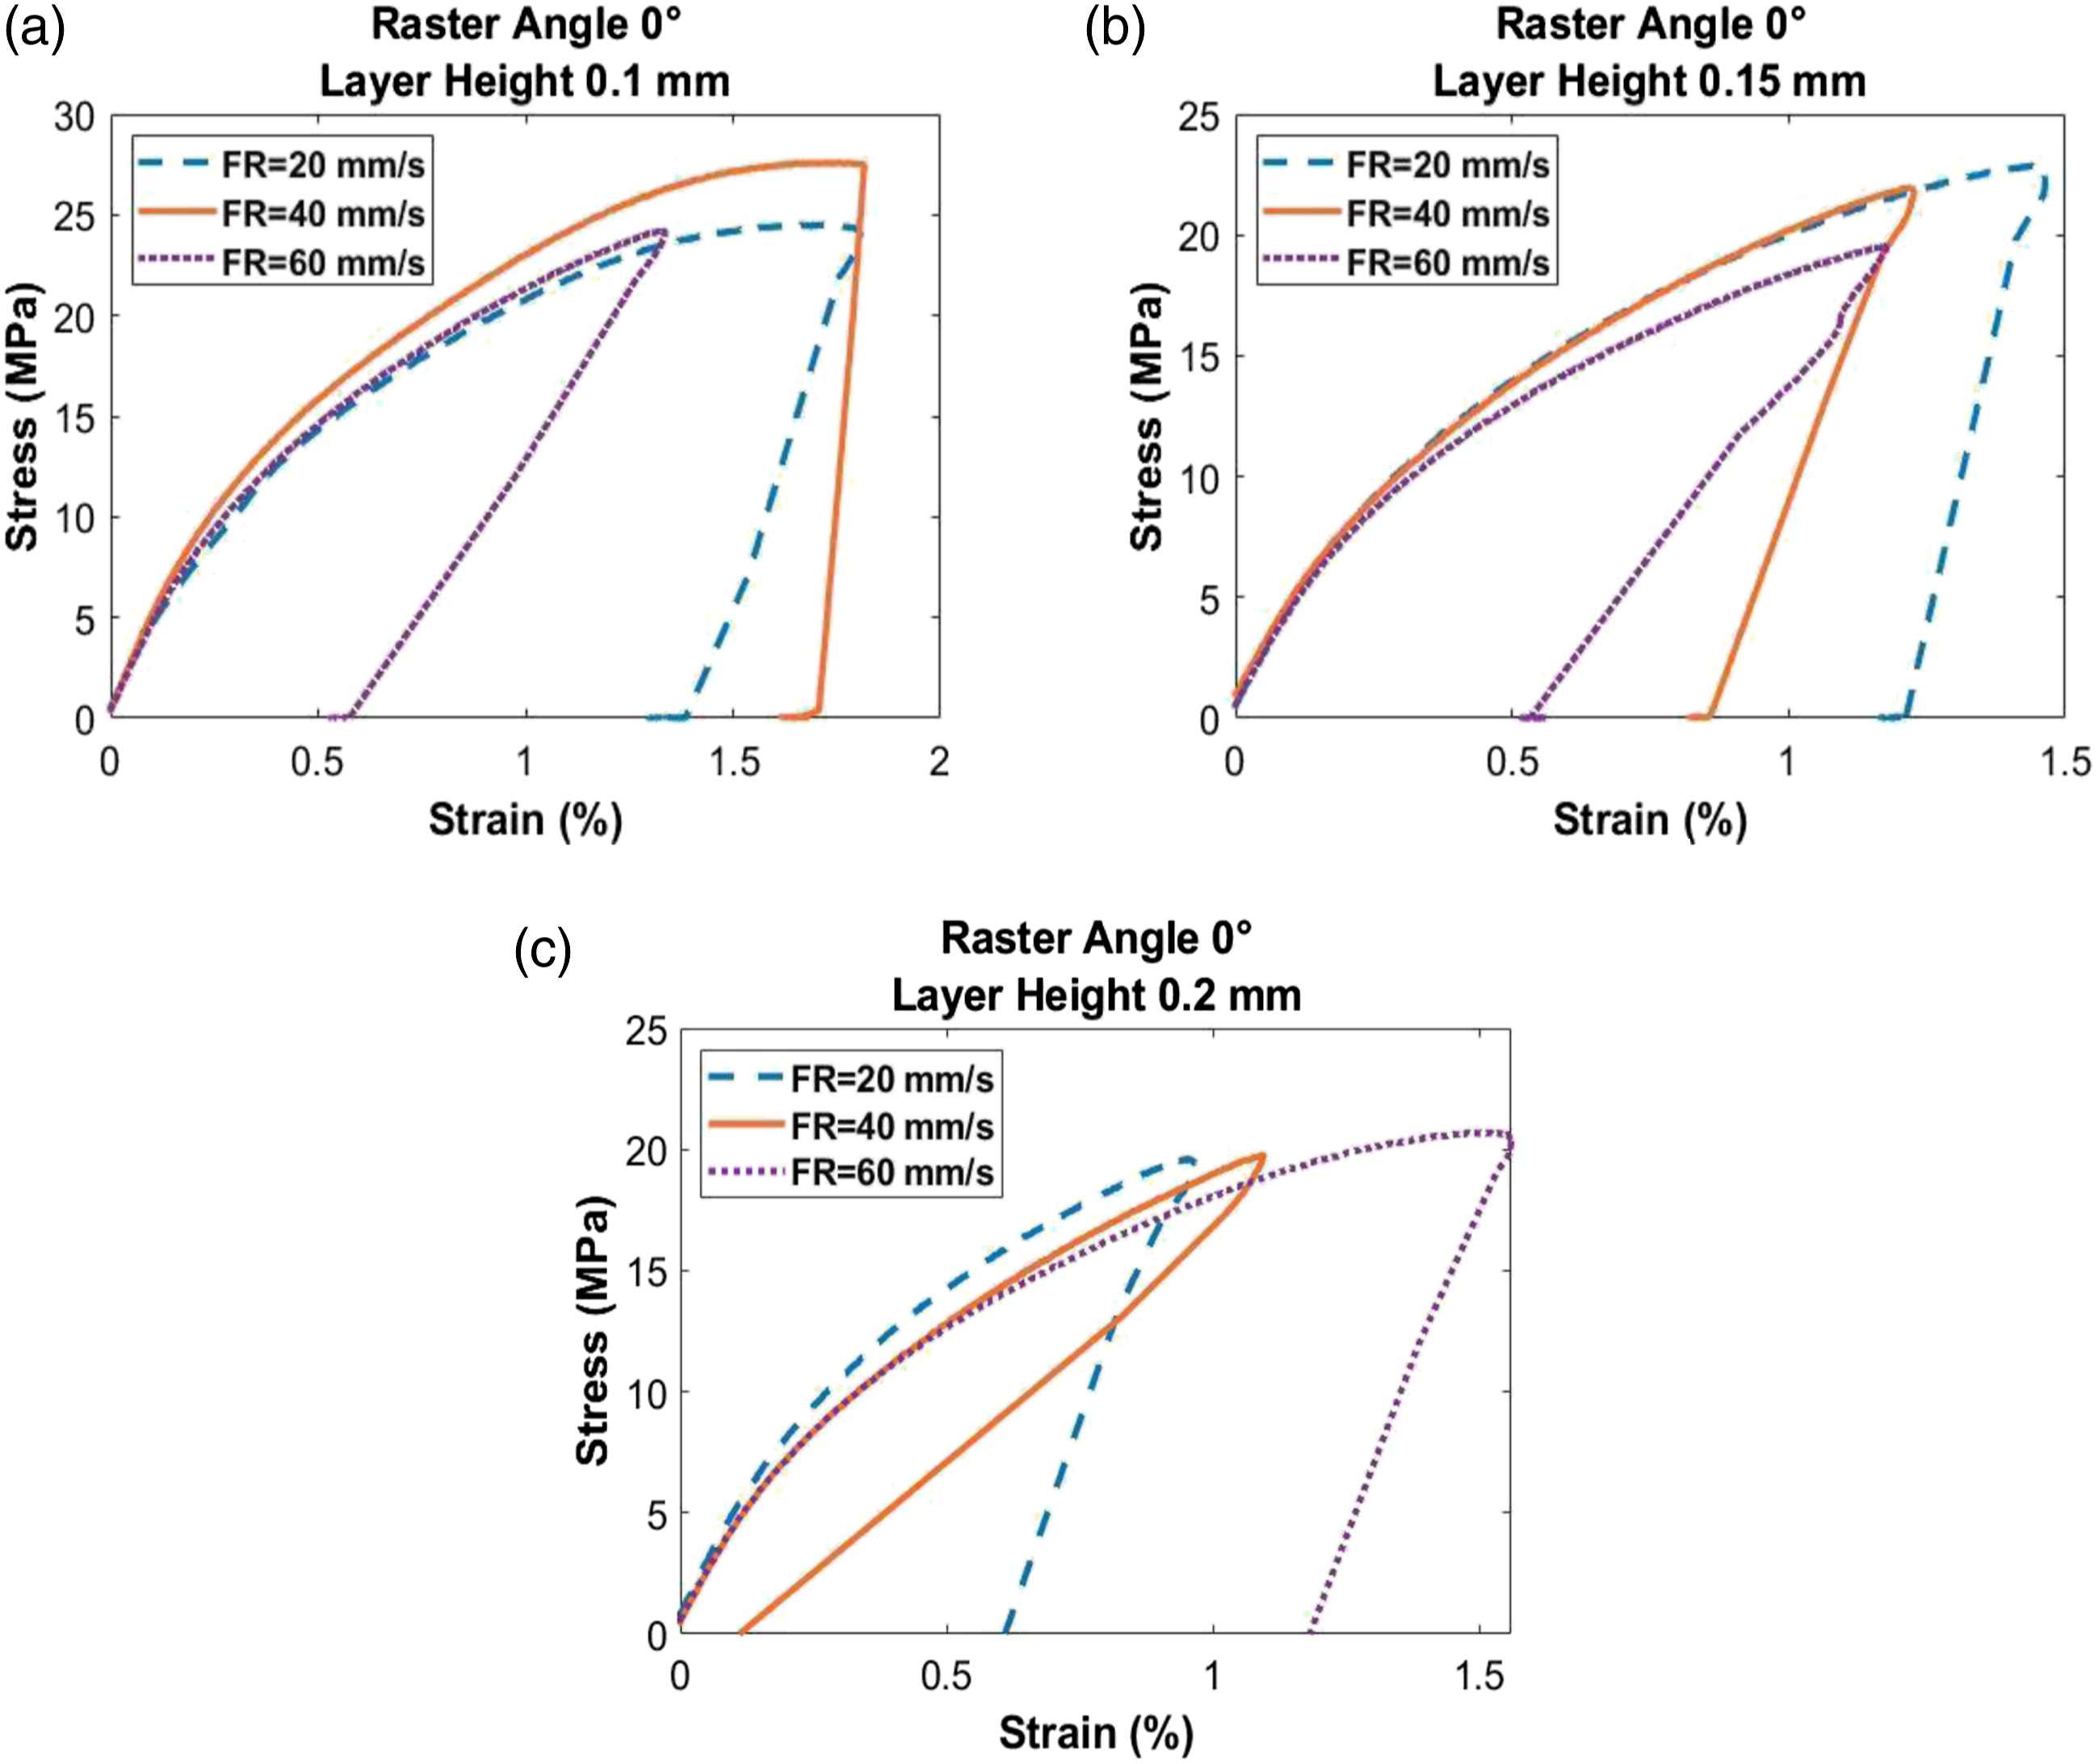
At RA 45°, the effect of FR for various LHs can be observed in Figure 11. The bonding of the adjacent rasters is mainly dependent on the RA. At RA 45°, lowest TS, 16.17 MPa, is exhibited with FR 60 mm/s and LH 0.2 mm while highest TS, 23.04 MPa, is exhibited with FR 20 mm/s and LH 0.1 mm with portraying highest percent elongation 1.351% with 42.49% increment for TS. Effect of FR (at RA = 45°).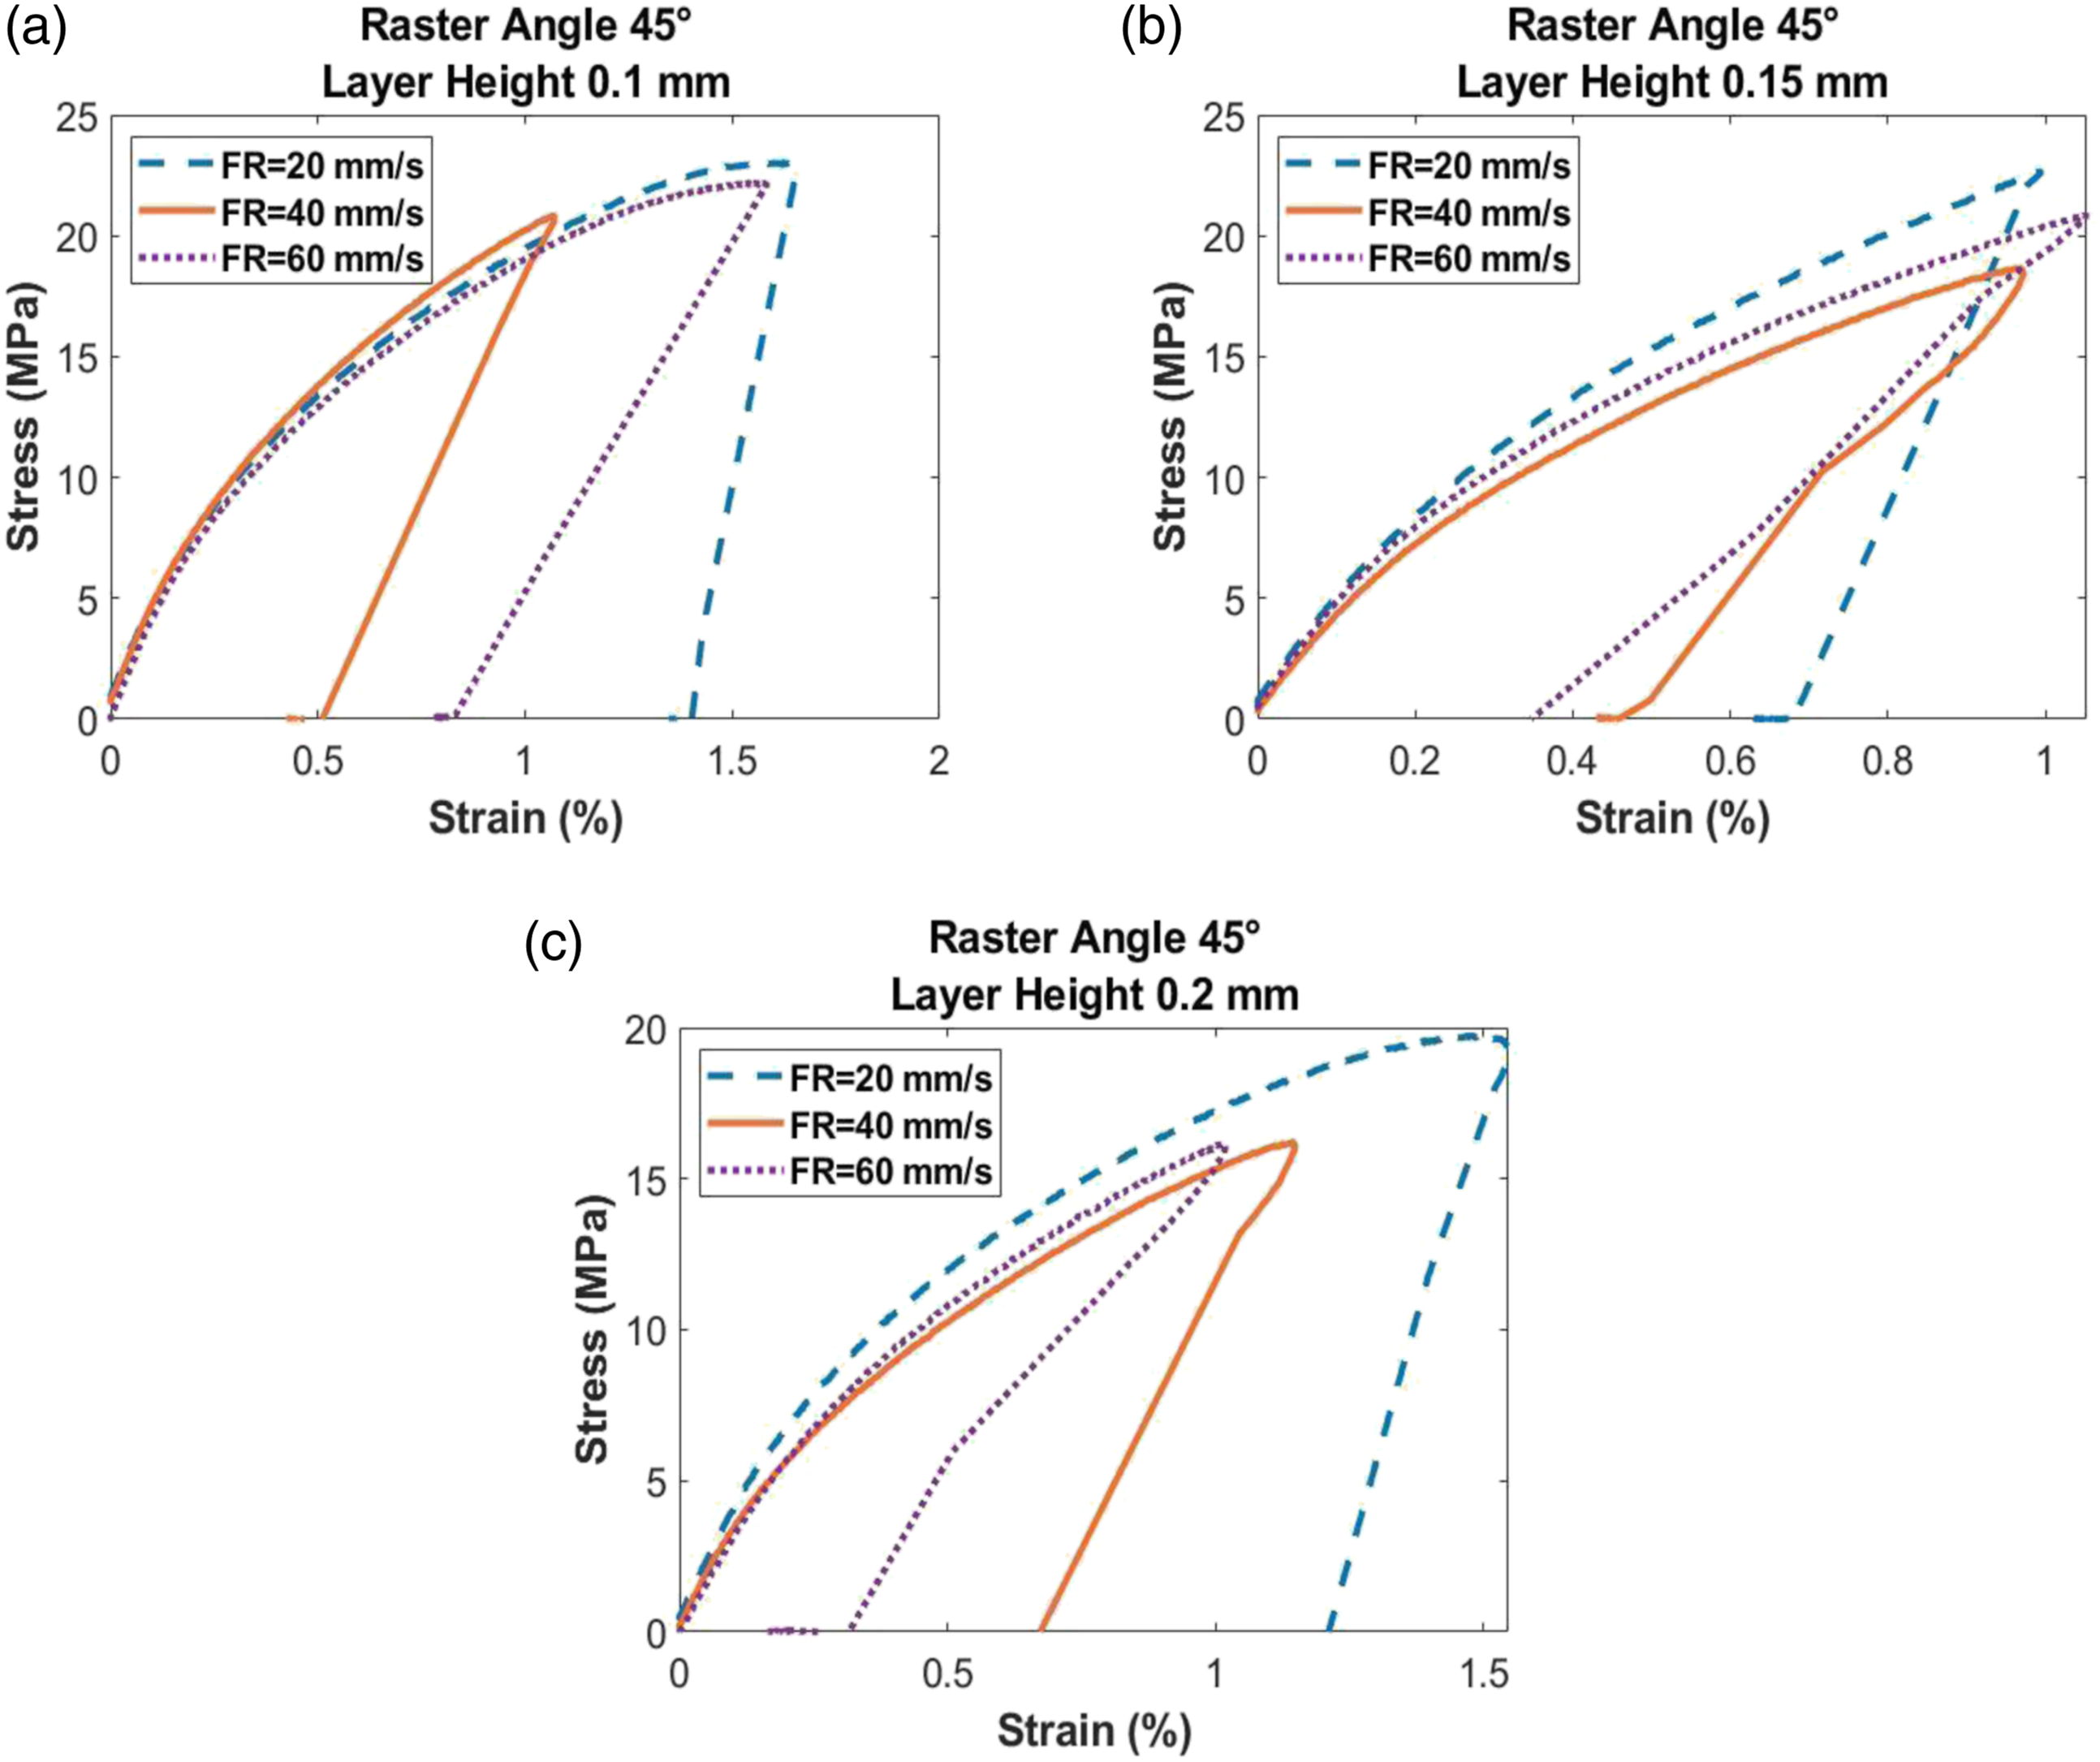
The effect of FR at RA 45° at different LHs can be observed in Figure 12. At a RA 90°, the lowest TS is 16.38 MPa for FR 60 mm/s and LH 0.2 mm, while the highest TS is 23.26 MPa with a FR of 60 mm/s and a LH of 0.15 mm, with a highest percent elongation of 1.396%, indicating a 42% increase in TS. The conceivable explanation is that as the FR is increased, the voids in the material are speedily packed, thereby strengthening the layers and fibres of the material. Effect of FR (at RA = 90°).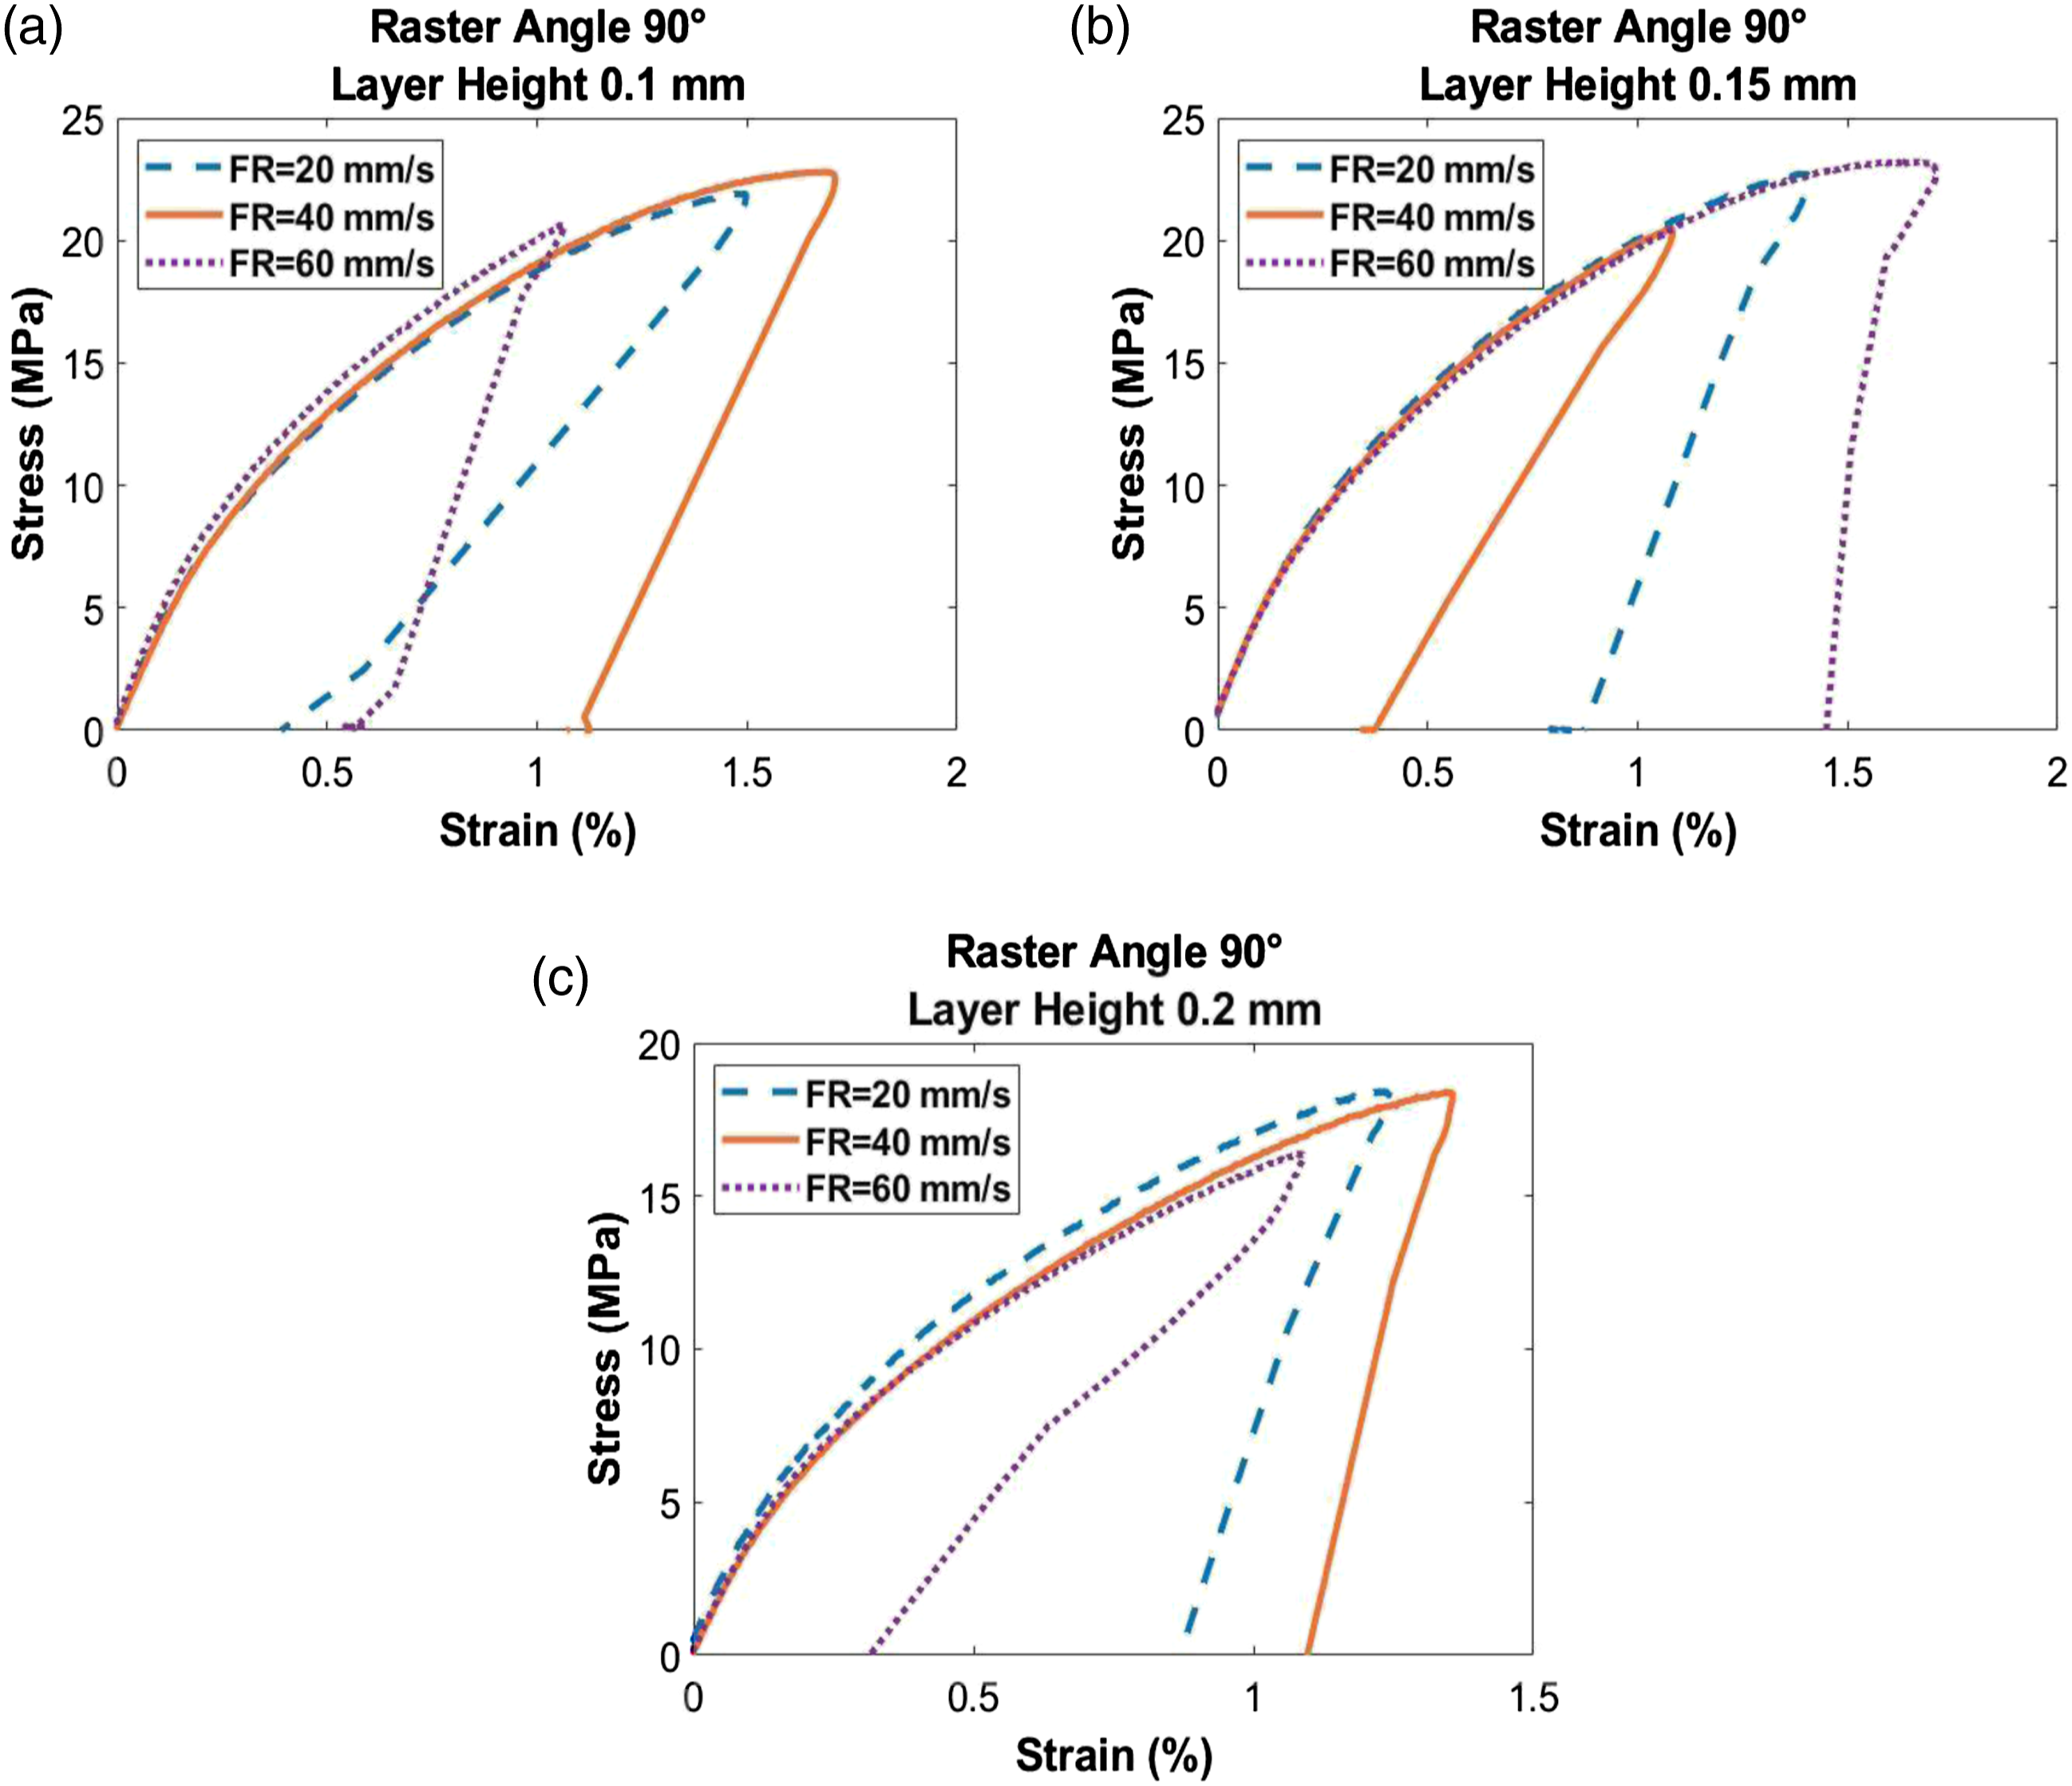
Fractography
In order to better comprehend the mechanism of fracture, the microphotography is performed for the deformed surfaces of the specimens. The fractography is performed for specimens exhibiting maximum and minimum TS at a particular LH.
Figure 13(a) and (b) illustrates the tensile specimens’ fracture surfaces which shows the maximum TS, 27.62 MPa, for RA 0° and FR 40 mm/s and minimum TS, 20.62 MPa, for RA 90° and FR 60 mm/s respectively. These results are at LH 0.1 mm while varying the FR and RA. The existence of voids in the parts is indicated by SEM pictures. In addition, these graphs are also depicting the breaking of CFs. With 0° RA and 40 mm/s FR, as shown in Figure 13(a), failure mostly depends upon raster failure, which provides higher TS. When there is a noteworthy amount of pulling and necking of the separate rasters, this can cause them to break, and this is also detectable as a fracture. The specimen is stiffer because the force is distributed evenly over each fibre and the effect of bonding between rasters is reduced. Brittle failure has been seen for a specimen with 90° RA and 60 mm/s FR, as shown in Figure 13(b), since bonding of neighbouring rasters and raster separation are the most common causes of failure. In most cases, the TS of a bond formed between two rasters will be lower than that of each of the individual rasters involved. Failure surface of the specimen at LH 0.1 mm (a) RA = 0°, FR = 40 mm/s (b) RA = 90°, FR = 60 mm/s.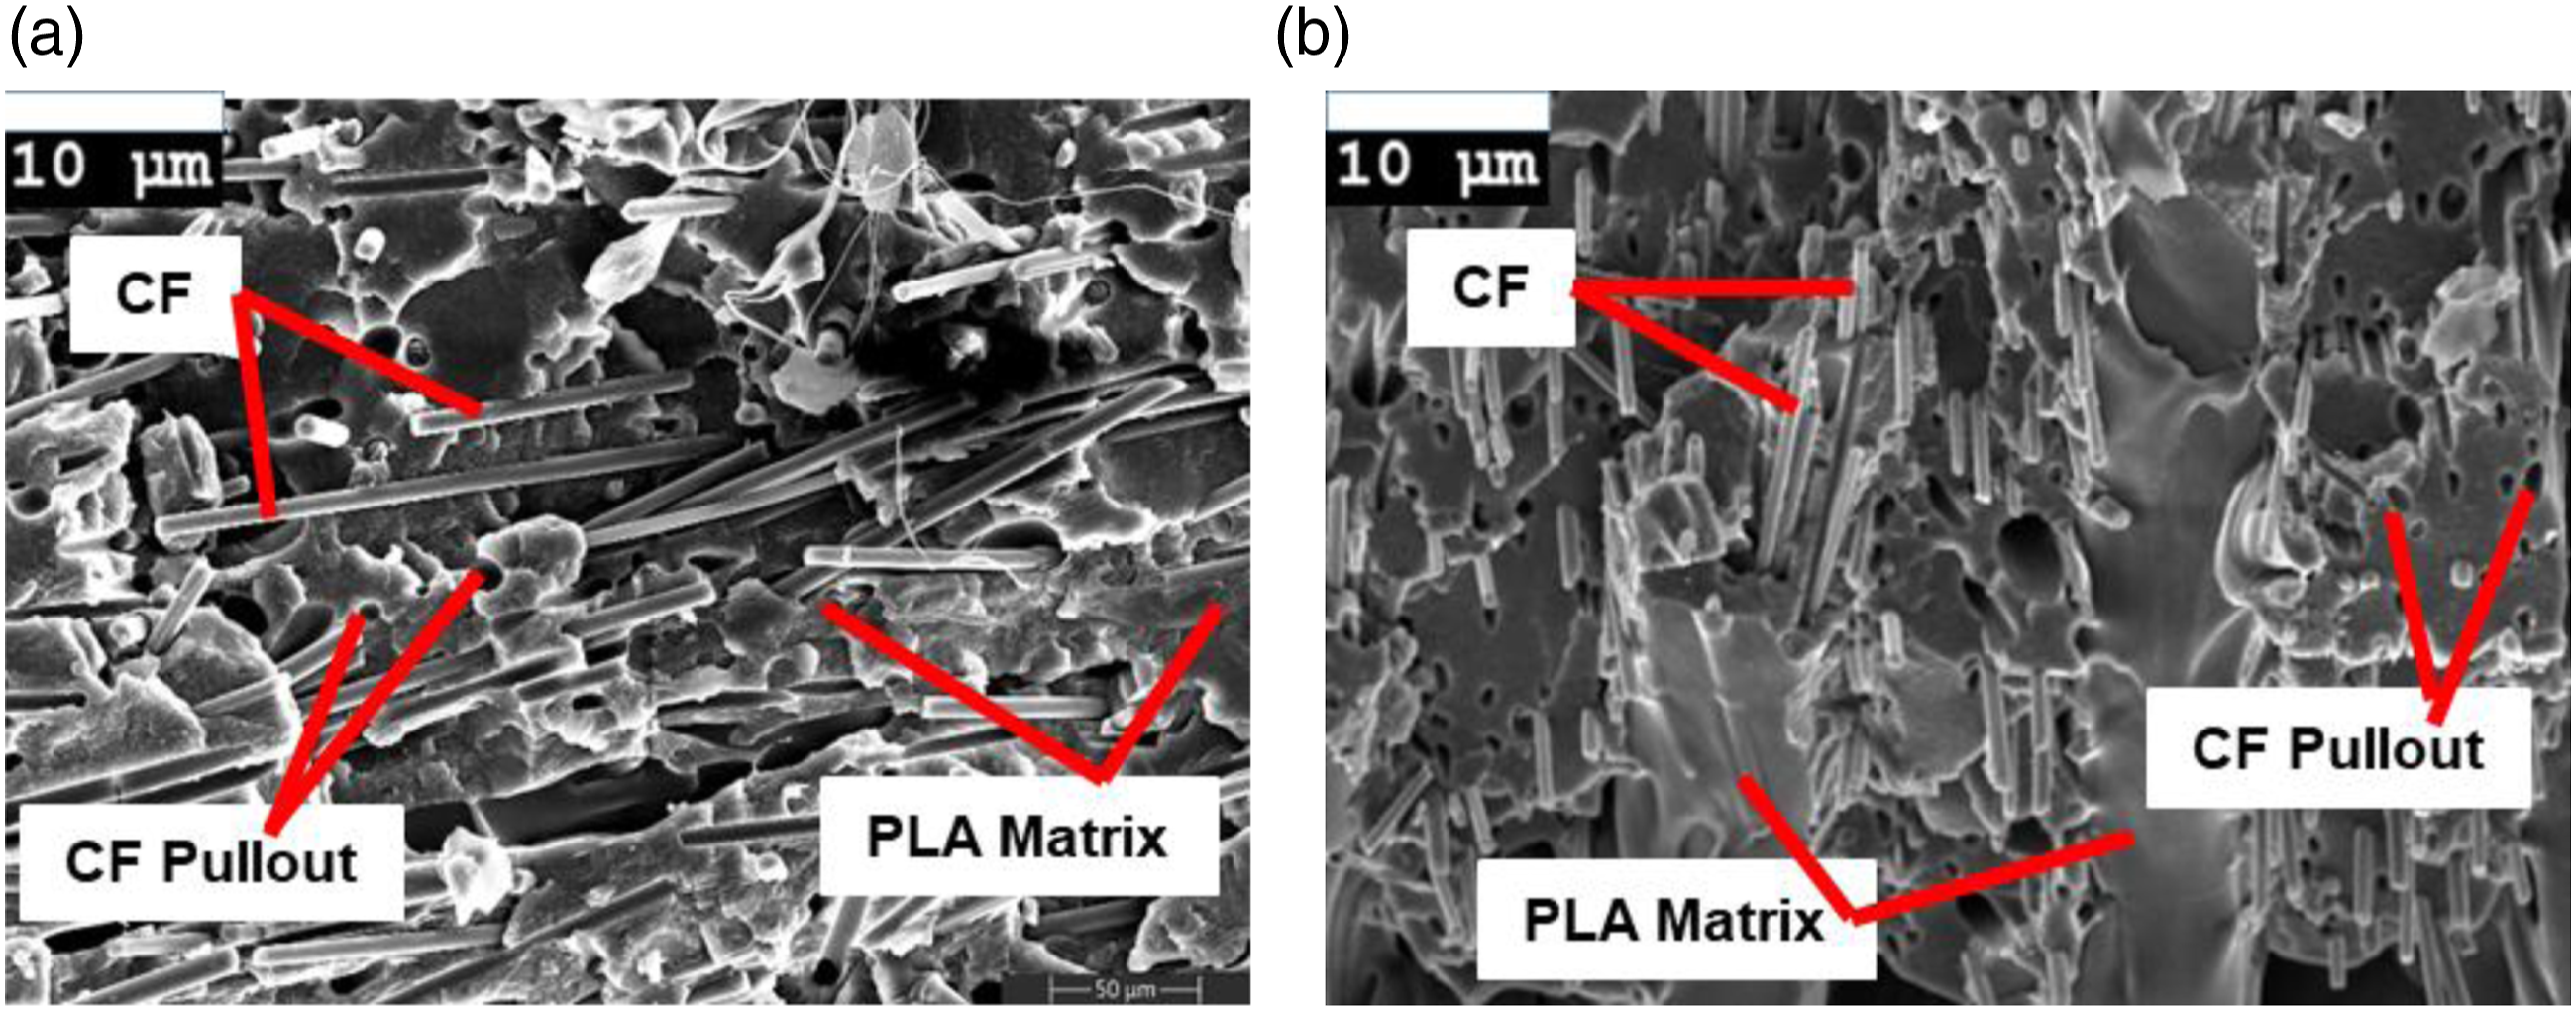
Figure 14 (a) and (b) shows the tensile specimens’' fracture surfaces with maximum TS, 20.7 MPa, for RA 0° and FR 60 mm/s and minimum TS, 16.17 MPa for RA 45° and FR 60 mm/s at LH 0.2 mm, respectively. When the RA is 0° and the FR is 60 mm/s, as shown in Figure 14(a), inter-layer and intra-layer fractures occur concurrently. The fracture strength of layer is mostly determined by the raster-to-raster bonding strength, while the intralayer fracture is primarily determined by the extruded material’s strength. The presence of voids on the cracked surface’s cross-section surface is shown by SEM investigation. Smaller voids indicate excellent interface bonding between rasters and layers, which helps to increase the part’s TS. Failure surface of the specimen at LH 0.2 mm (a) RA = 0°, FR = 60 mm/s (b) RA = 45°, FR = 60 mm/s.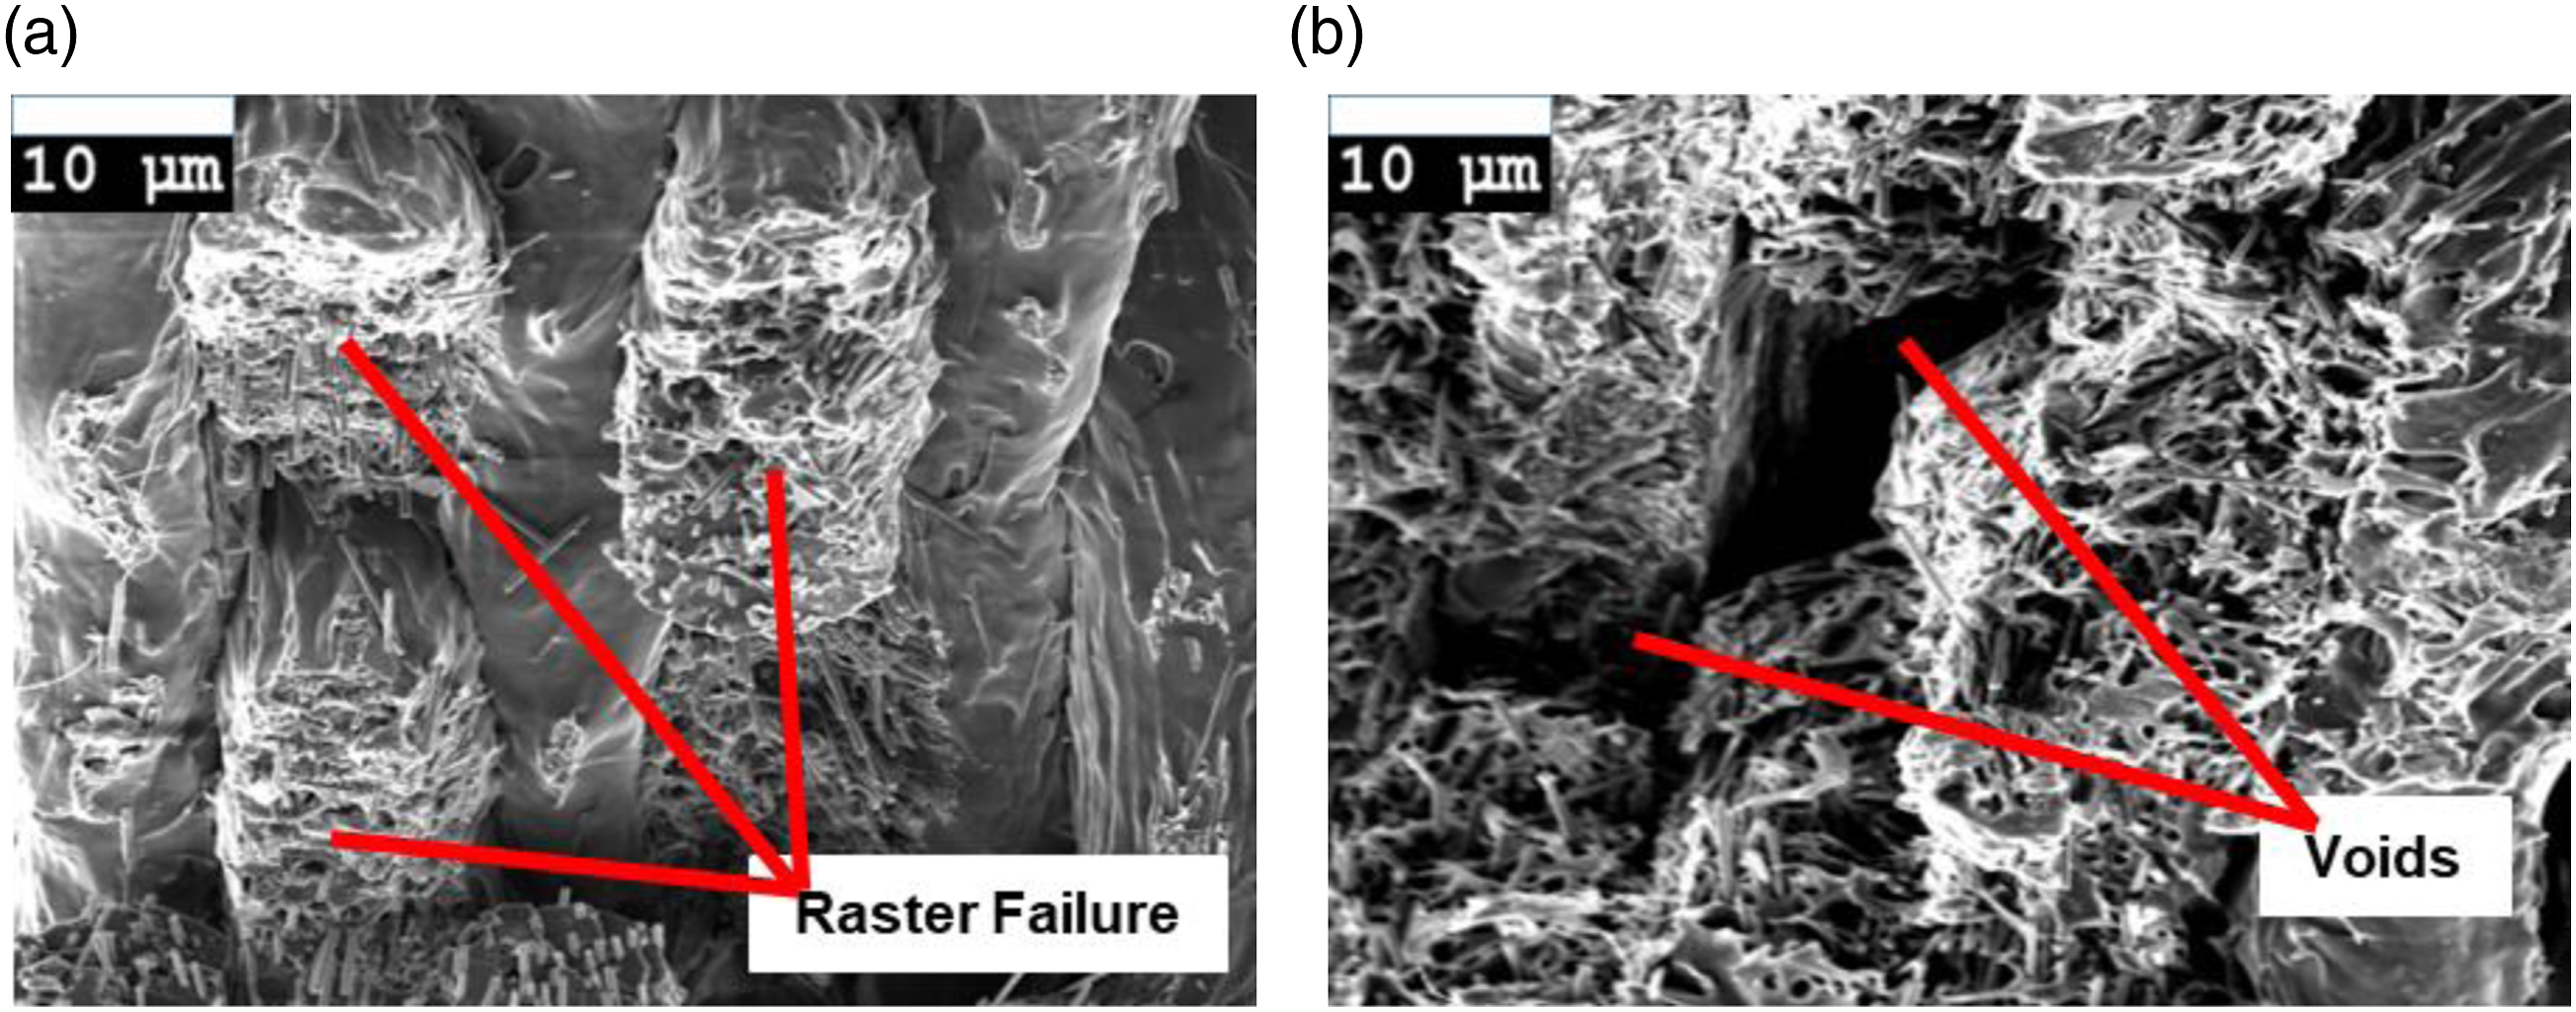
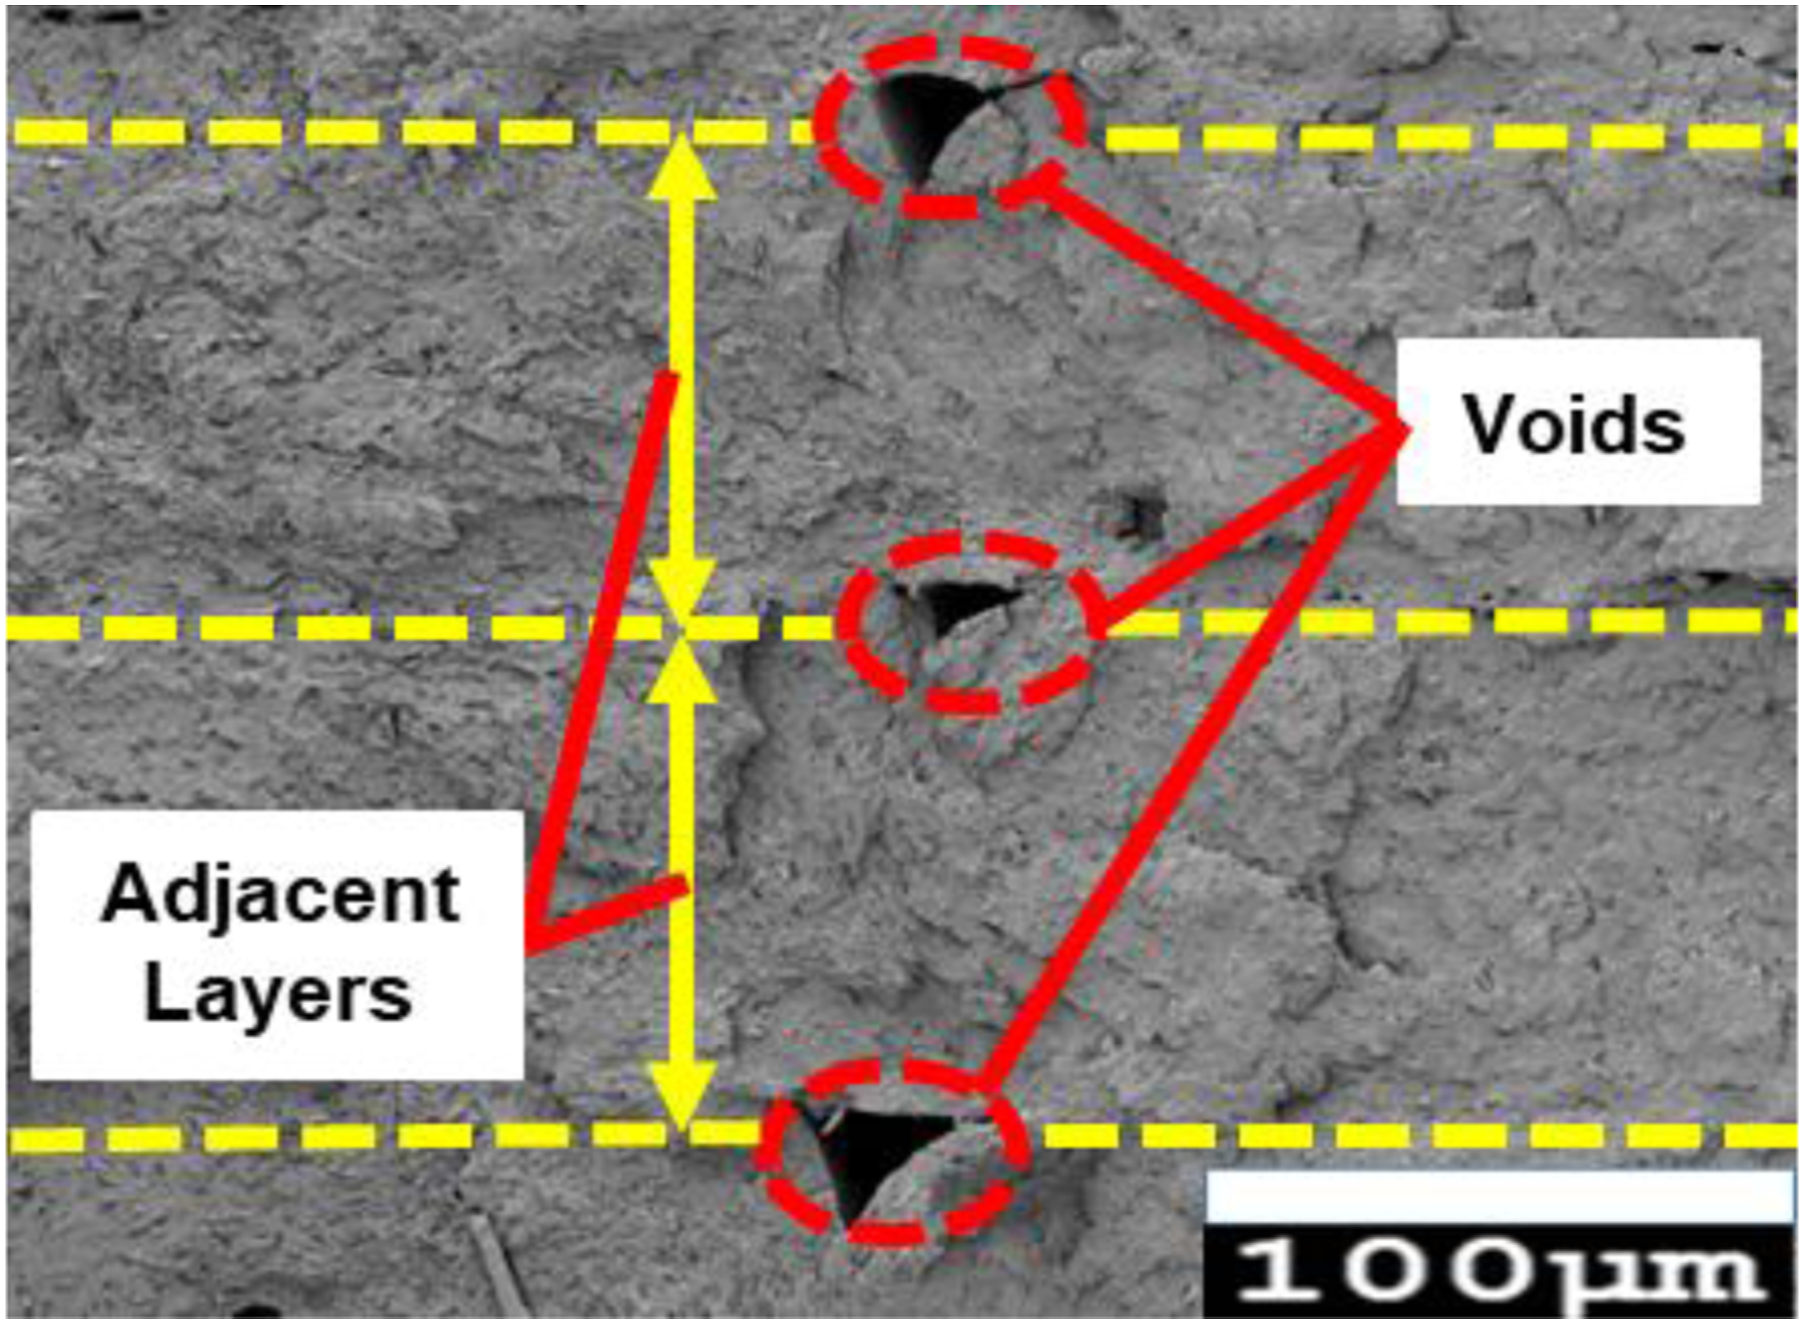
Figure 15 illustrates the fracture surface the specimen at various LH, demonstrating that voids are fewer at lower LH than at higher LH. Stronger bonds and tensile properties arise from using a higher extrusion pressure at lower LH, which enables adhesion raster to raster. The insufficient bonding characteristic between the rasters of the adjacent layers is the cause of the interlayer voids also known as interfacial void, that has developed, Figure 16. These voids influence the tensile characteristics of the fabricated specimen, but it may be reduced to a minimum by selecting the appropriate arrangement of the FFF process constraints. Failure surface of the specimen for different LH (a) LH = 0.1 mm (b) LH = 0.15 mm (c) LH = 0.2 mm. Voids between the two adjacent layers.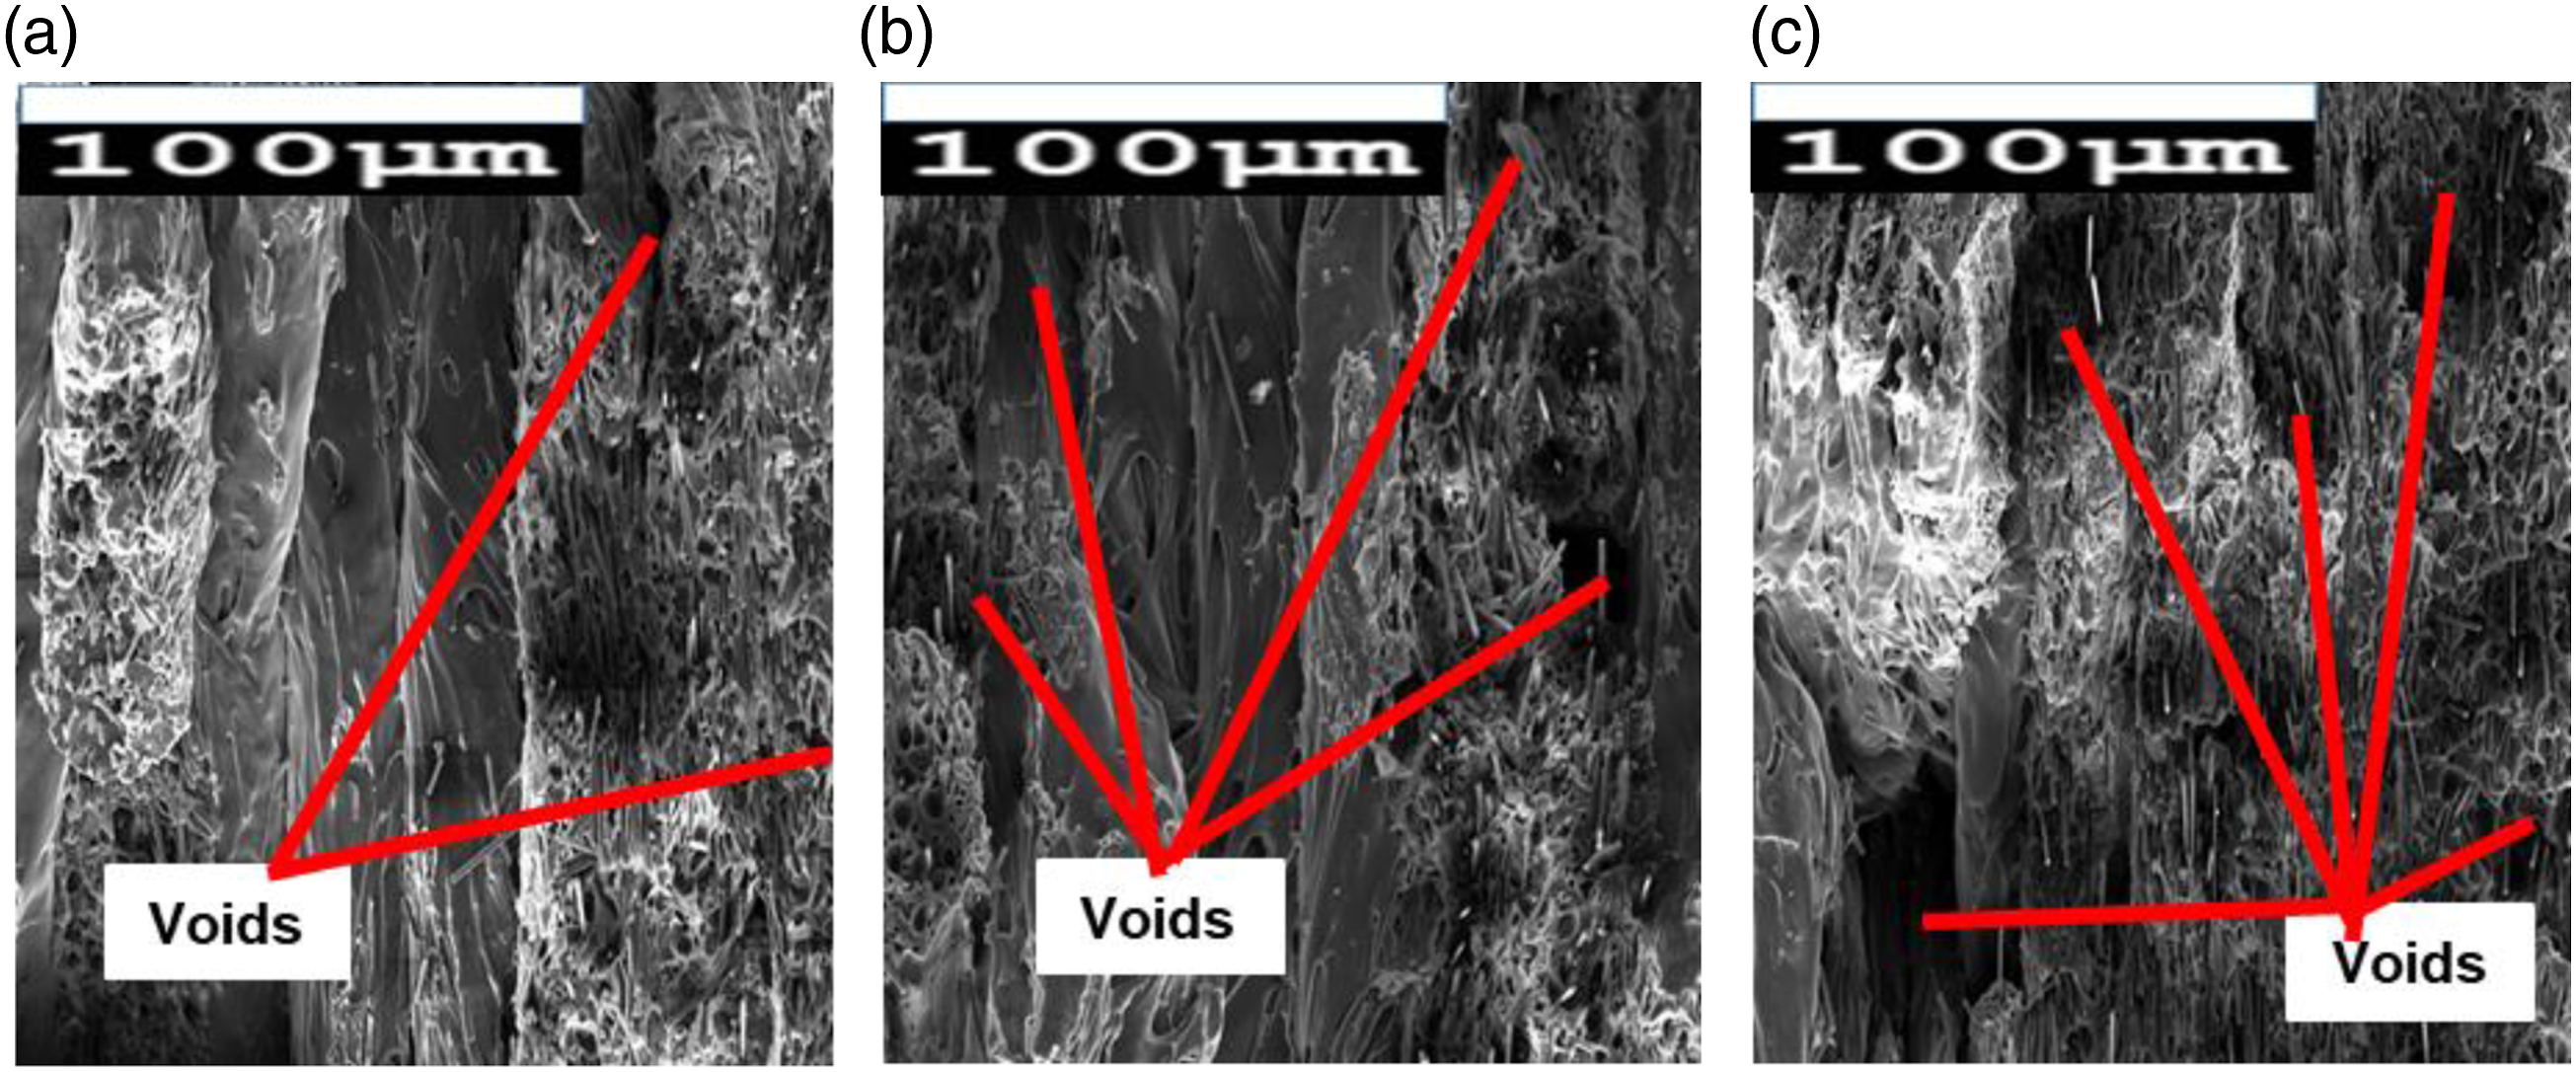
At lower LH, the extrusion pressure is higher which facilitate a quick and intimate attachment between the layers, while increasing the bond strength and TS. The micrographs reveal that the CF-PLA fails because the CFs break and pull out of the PLA matrix. One of the most common reasons for specimen failure during testing is the breaking of an individual raster as a result of excessive pulling and necking. Higher TS is the result of the specimen’s greater rigidity, which is achieved by applying stress individually to each fibre and reducing the effect of raster-to-raster bonding.
ANOVA and regression analysis
A larger is better main effects plot for SN ratios is identified in an ANOVA analysis of the process constraints, namely LH, FR, and RA with selected values over the response factor, namely the TS using Taguchi’s L27 array DOE, Figure 17. The MINITAB 21 software is used to investigate the experimental results. SN ratios plots for the main effects of the processing parameters on TS.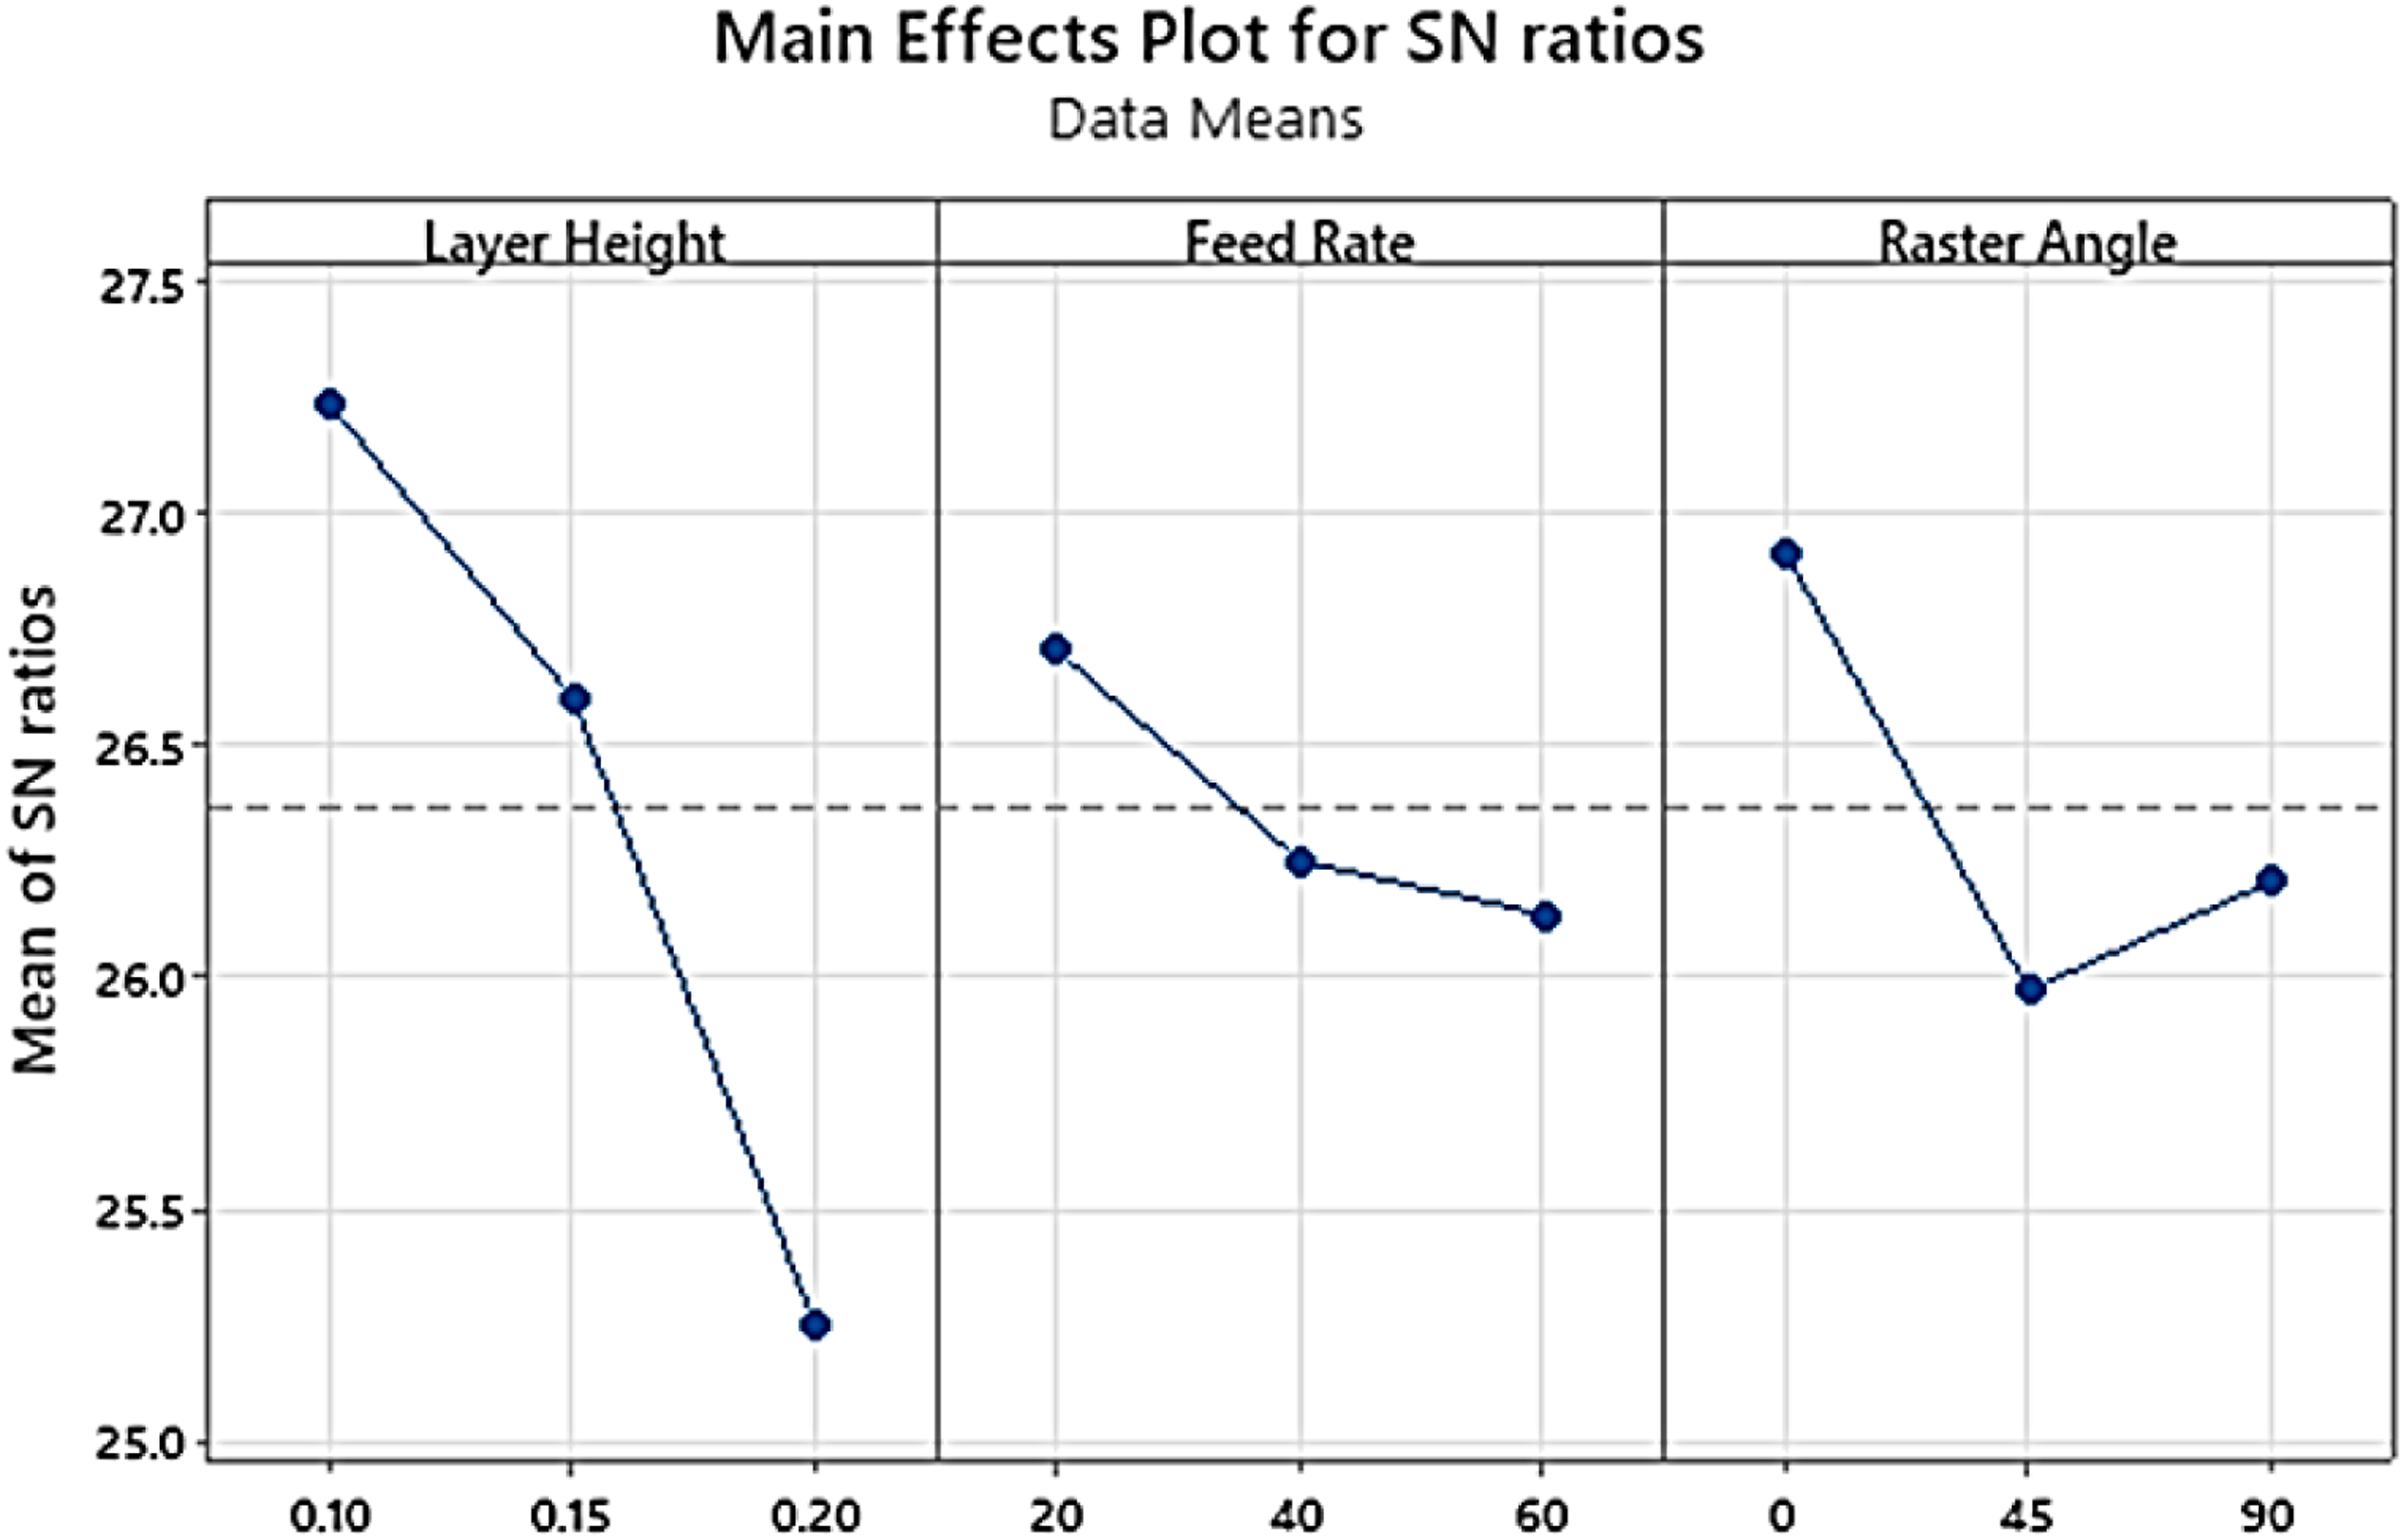
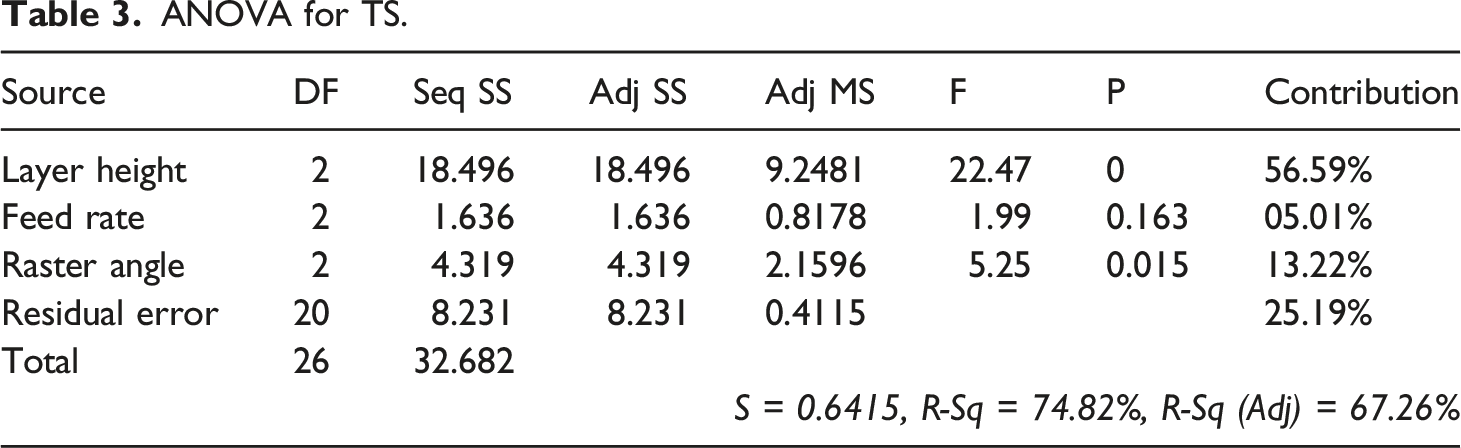
ANOVA for TS.
Relationships between variables can be analysed using a suite of statistical methods known as regression analysis. There are other techniques for modelling and analysing a large number of variables, but in this case the focus is on the three variables viz LH, FR, and RA that affect TS. For prediction, regression analysis is commonly utilised. Using Minitab 21 software, a second-order regression function is developed to characterise the correlation between process parameters and the response variable, and it is represented in following equation: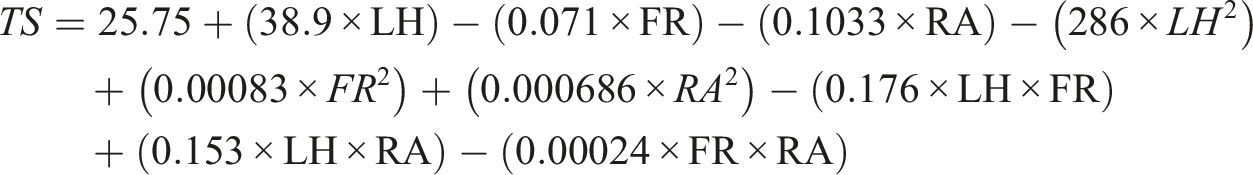
By varying the values of certain process factors, this equation can make predictions about the TS value.
The experimental values are derived from the test results, whereas the predicted values are derived from the tensile test data using second order regression equation, Figure 18. Experimental versus predicted values of TS.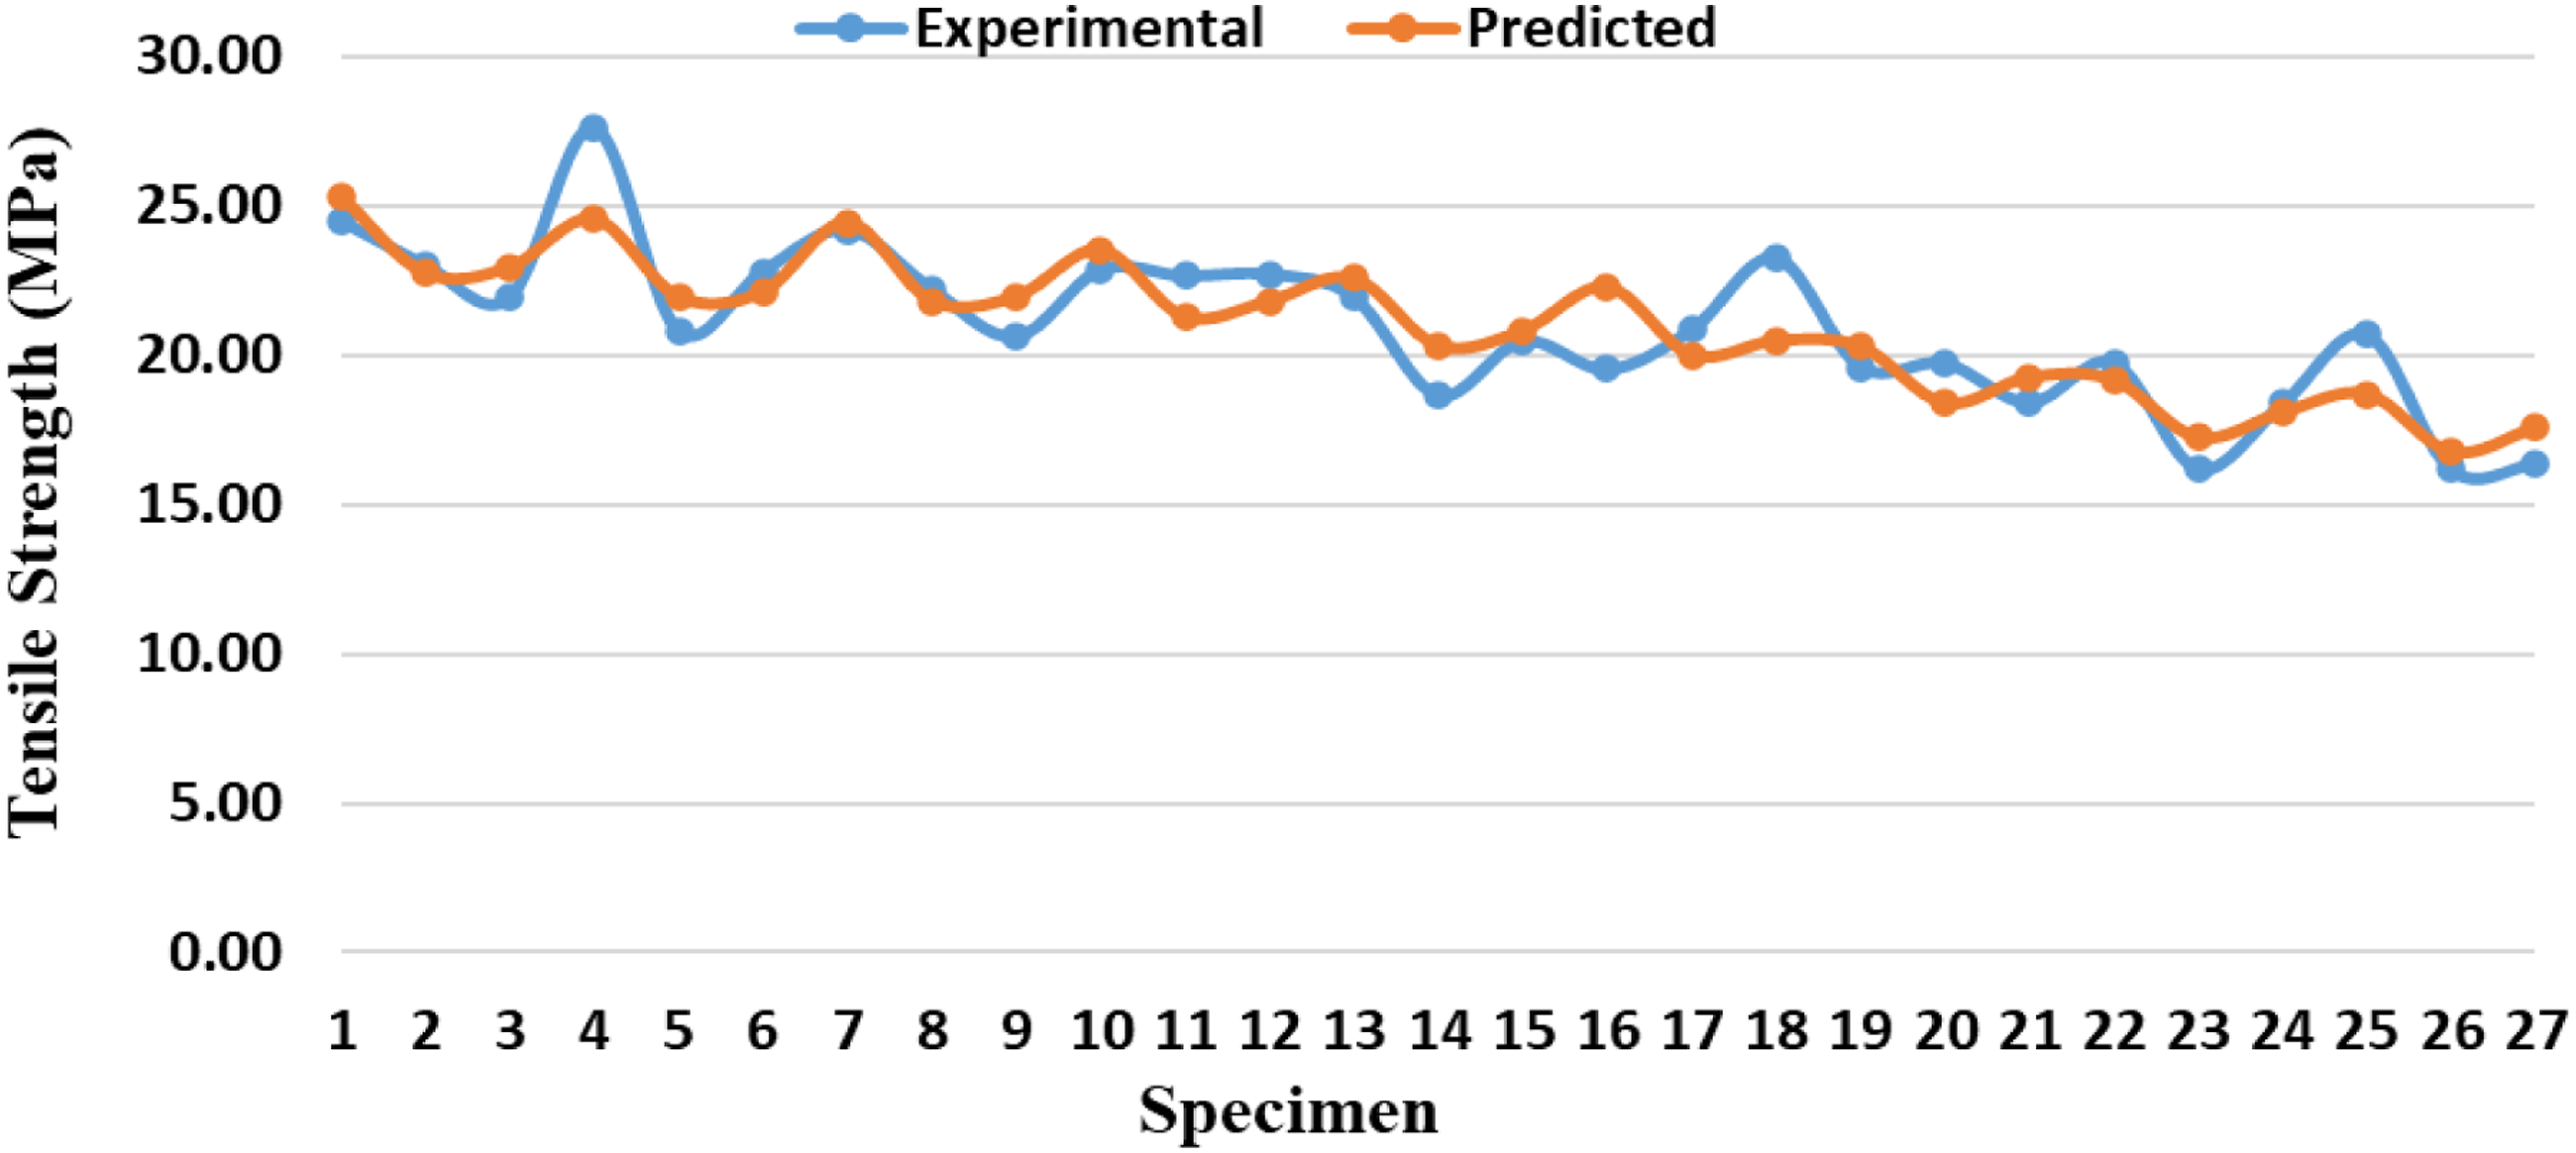
The CF-PLA specimen achieves a maximum TS of 27.62 MPa at LH 0.1 mm, FR 40 mm/s, and RA 0°, which is greater than the results reported by Jasim et al. 47 (23.08 MPa), Özgül et al. 48 (about 22 MPa), Guessasma and Belhabib 49 (about 17 MPa), and Ganeshkumar et al. 50 (about 19 MPa) for pure PLA with gyroid infill pattern.
Conclusion
The determination of this experimental research was to recognise the mechanical behaviour of FFF-printed gyroid infilled CF-PLA specimens with changes in RA, FR, and LH. The findings of this study can be stated as follows:
With decreasing RA, the tensile characteristics is enhanced for of FFF-printed CF-PLA parts. At LH 0.1 mm, the lowest TS, 20.62 MPa (at RA 90°), is increased by 33.95% to attain the highest TS, 27.62 MPa (at RA 0°). The bond strength of adjacent rasters determines the strength at RA 45°, and hence the TS changes between RAs 0° and 90°. With respect to variation in FR, the bonding area diminishes as the LH rises, resulting in lower bond strength between layers and thus exhibiting low TS. The mechanism of failure shifts from ductile to brittle at a FR of 40 mm/s, resulting in the highest TS of 27.62 MPa (at LH 0.1 mm), which is 70.39% greater than the lowest TS of 16.21 MPa (at LH 0.2 mm).
As the FR increases, TS increases which results in maximum TS, 27.62 MPa at FR 40 mm/s, and depicts the 41.35% increment with respect to the minimum TS, 24.52 MPa (at FR 20 mm/s), at RA 0° and LH 0.1 mm. Voids decreases with reduction in LH. At low LH, the material layers and the fibres are firmly reinforced and thereby reducing the number of voids which results in higher TS. Tensile Strength enhanced as LH is decreased from 0.2 mm to 0.1 mm. The minimum strength, 19.76 MPa is obtained for LH 0.2 mm which increases to 27.62 MPa at LH 0.1 mm with the increase of 39.77%. In most cases, the TS of a bond formed between two rasters will be lower than that of each of the individual rasters involved.
Smaller voids indicate excellent interface bonding between the rasters as well as layers, which helps to improve the part’s TS and the highest TS, 27.62 MPa, is observed at RA 0°, FR 40 mm/s and LH 0.1 mm. For TS, LH and RA have the greatest impact, followed by FR.
Footnotes
Acknowledgements
The authors acknowledge the help from ACMS, IIT Kanpur, India for allowing to performing tensile testing. We are also thankful to the grant received from AICTE (file no. 8-88/FDC/RPS (POLICY-1)/2019-20).
Funding
The author(s) received no financial support for the research, authorship, and/or publication of this article.