
Abstract
Optical coherence tomography (OCT) has been found to be a powerful method for non-destructive testing of glass-fiber reinforced polymeric composites. Various authors have investigated the use of OCT in offline lab-scale detection of fiber orientation and defects in thermoset-based composites. This work evaluated the potential of OCT as a technique for detecting common defects in the continuous production of thermoplastic glass-fiber reinforced unidirectional (UD) tapes. Measurements were first conducted with a stationary OCT sensor using a spectral domain system to investigate: (1) insufficiently impregnated fiber regions, (2) unfilled gaps, (3) polymer accumulations causing fiber/matrix irregularities, and (4) rough tape surfaces. Optical microscopic analysis was used for validation. To overcome the limited maximum field of view of modern OCT setups, we then developed a novel inline test rig to accurately simulate process conditions and measure across the whole tape width. We show that OCT is a reliable method for acquiring cross-section information on tape quality both at the lab scale with a stationary sensor and inline with a sensor moving across the tape surface. Our OCT measurements were in excellent agreement with our offline microscopic investigations. OCT is a powerful, non-destructive and high-resolution method for quality assessment of glass-fiber reinforced UD tapes and has great potential for use in inline quality assurance systems.
Keywords
Introduction
Fiber-reinforced polymer composites form an ubiquitous class of materials. In particular, endless fiber-reinforced plastic products containing glass fibers or carbon fibers are used in numerous contexts, ranging from applications in sports and medicine to use in sophisticated structural parts in the automotive and aerospace industries. One of the main advantages over other construction materials is their superior strength-to-weight and stiffness-to-weight ratio. This is particularly important when the ultimate application requires low weight and high mechanical integrity coupled with energy efficiency or low fuel consumption.
For many decades, the production of polymeric composites used mainly thermosets as matrix materials. In its initial state, a thermoset is a low-molecular-weight liquid (resin) with very low viscosity, which is advantageous for penetration and impregnation of reinforcing fibers. 1 Upon addition of specific hardening agents, the polymer chains form a crosslinked network, which results in a hard and brittle polymer matrix. Since the chemical crosslinking reaction is irreversible, thermosets are difficult to recycle. 2
In recent years, a strong trend towards using thermoplastic matrices has emerged, as they offer many advantages over thermosets: (1) reversibility of the forming process, (2) design flexibility, (3) functional integration, and (4) a high potential for process automation. Fiber impregnation by thermoplastic polymers is more difficult and requires much higher processing temperatures and more energy due to their different molecular structures and viscosities. One of the most common and efficient methods of producing endless fiber-reinforced thermoplastic unidirectional (UD) tapes is based on the pultrusion process,
3
in which fibers are pulled through an impregnation die in a melt impregnation process. The steps in the basic process of thermoplastic tape production are shown in Figure 1. Process chain of a thermoplastic unidirectional tape production process.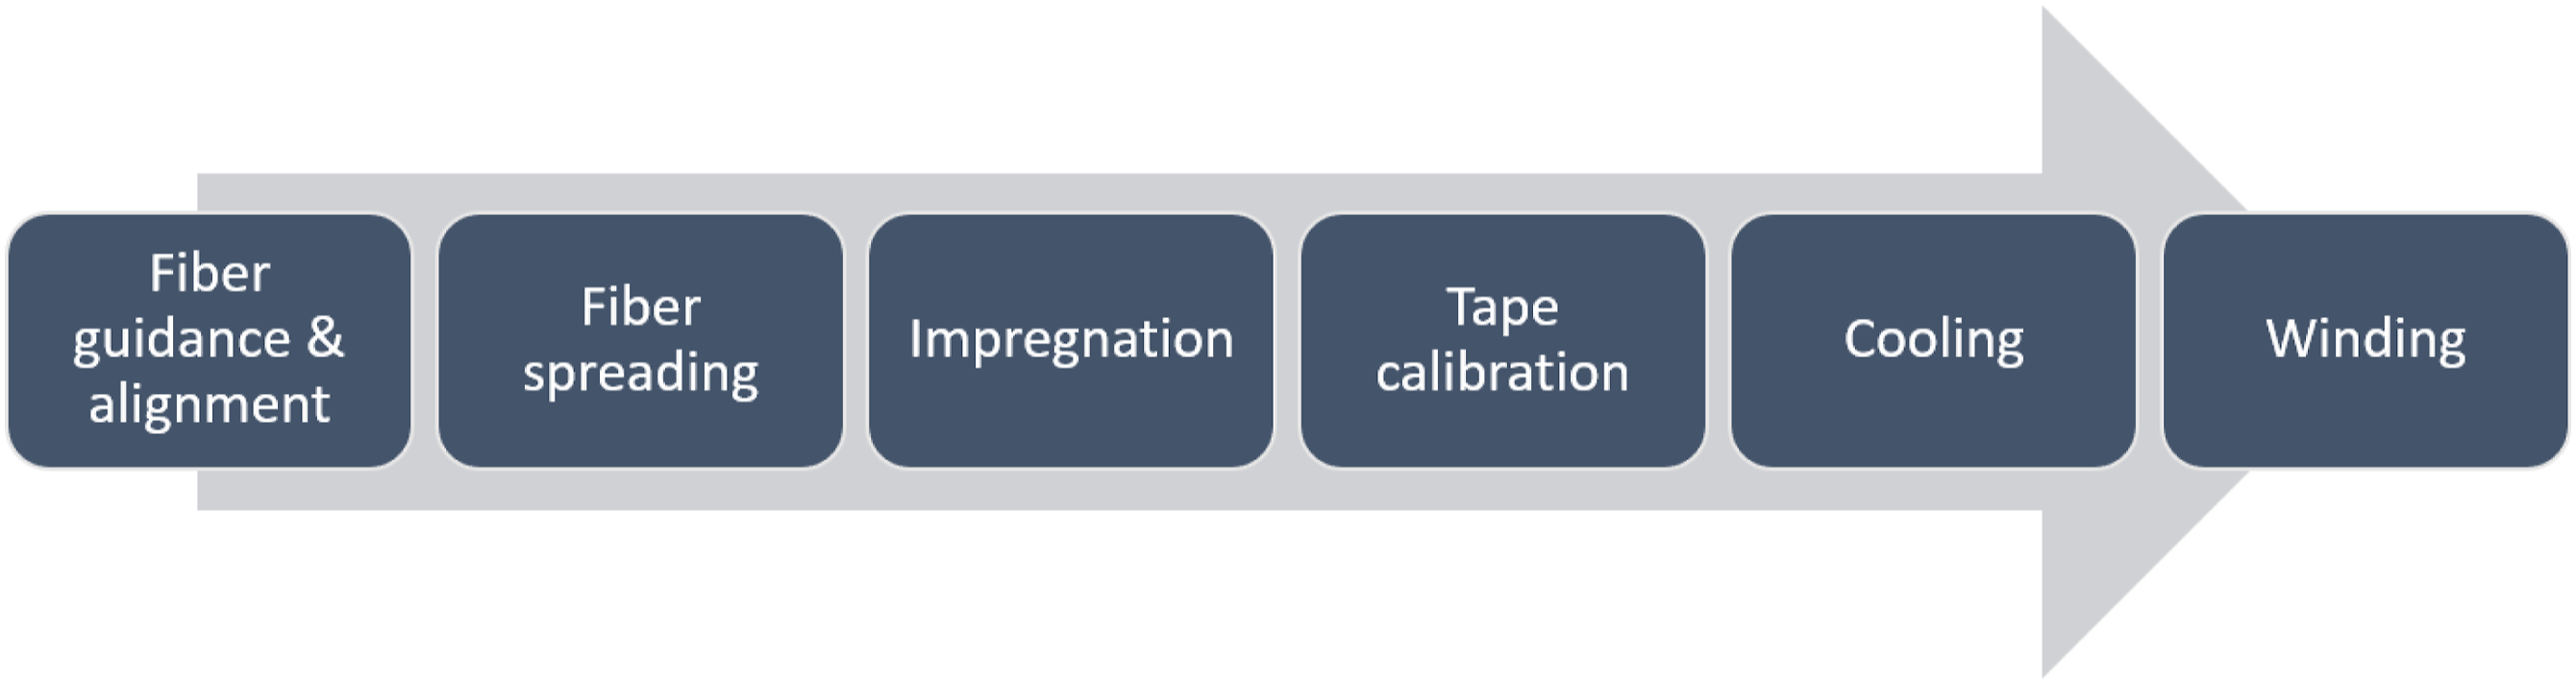
To achieve a flat unidirectional tape structure, multiple rovings (fiber bundles) are continuously pulled off a creel and aligned next to each other by a fiber-spreading unit to achieve a homogeneous fiber carpet. Thus, the initially compact elliptical cross-sections of the rovings become flat and rectangular. In industry, various fiber-spreading methods are applied that are either mechanical, pneumatic or vibrational. The aligned fiber carpet then enters an extrusion die, where it is impregnated with thermoplastic melt provided by a single- or twin-screw extruder. Immediately afterwards, the tape is solidified and calibrated to its final thickness and surface finish, typically by means of calender.
The quality of the final UD tape strongly depends on the design of and interactions between the individual processing steps. Since the process is complex, various tape defects can occur which affect the optical and mechanical properties of the product. Inside the extrusion die, for example, the polymer melt takes the path of least flow resistance through the fiber carpet. Unevenly spread fiber rovings lead to a variation in flow resistance which, in combination with the high melt viscosity of the matrix material, may result in empty, partially filled or completely polymer-filled gaps. These gaps can be a few millimeters up to several meters long and several micrometers up to a few millimeters wide. Figure 2(a) shows micrographs of an empty gap in an UD tape sample consisting of polycarbonate (PC) and glass fibers (GF). Another common defect occurs when fibers, entering the extrusion die, are insufficiently impregnated with polymer melt, as shown in Figure 2(b). Dry-fiber regions in the final product are associated with very poor mechanical and optical properties. Hopmann et al.
4
focused on the critical parameters in an extrusion-based melt-impregnation process regarding fiber impregnation. When fibers are not properly embedded in the matrix, they are unable to transfer mechanical loads. Dry-fiber regions have thicknesses in the lower millimeter range and lengths of up to several meters. Micrographs of a polycarbonate/glass fibers unidirectional tape sample with an empty gap (a) and a dry-fiber region (b).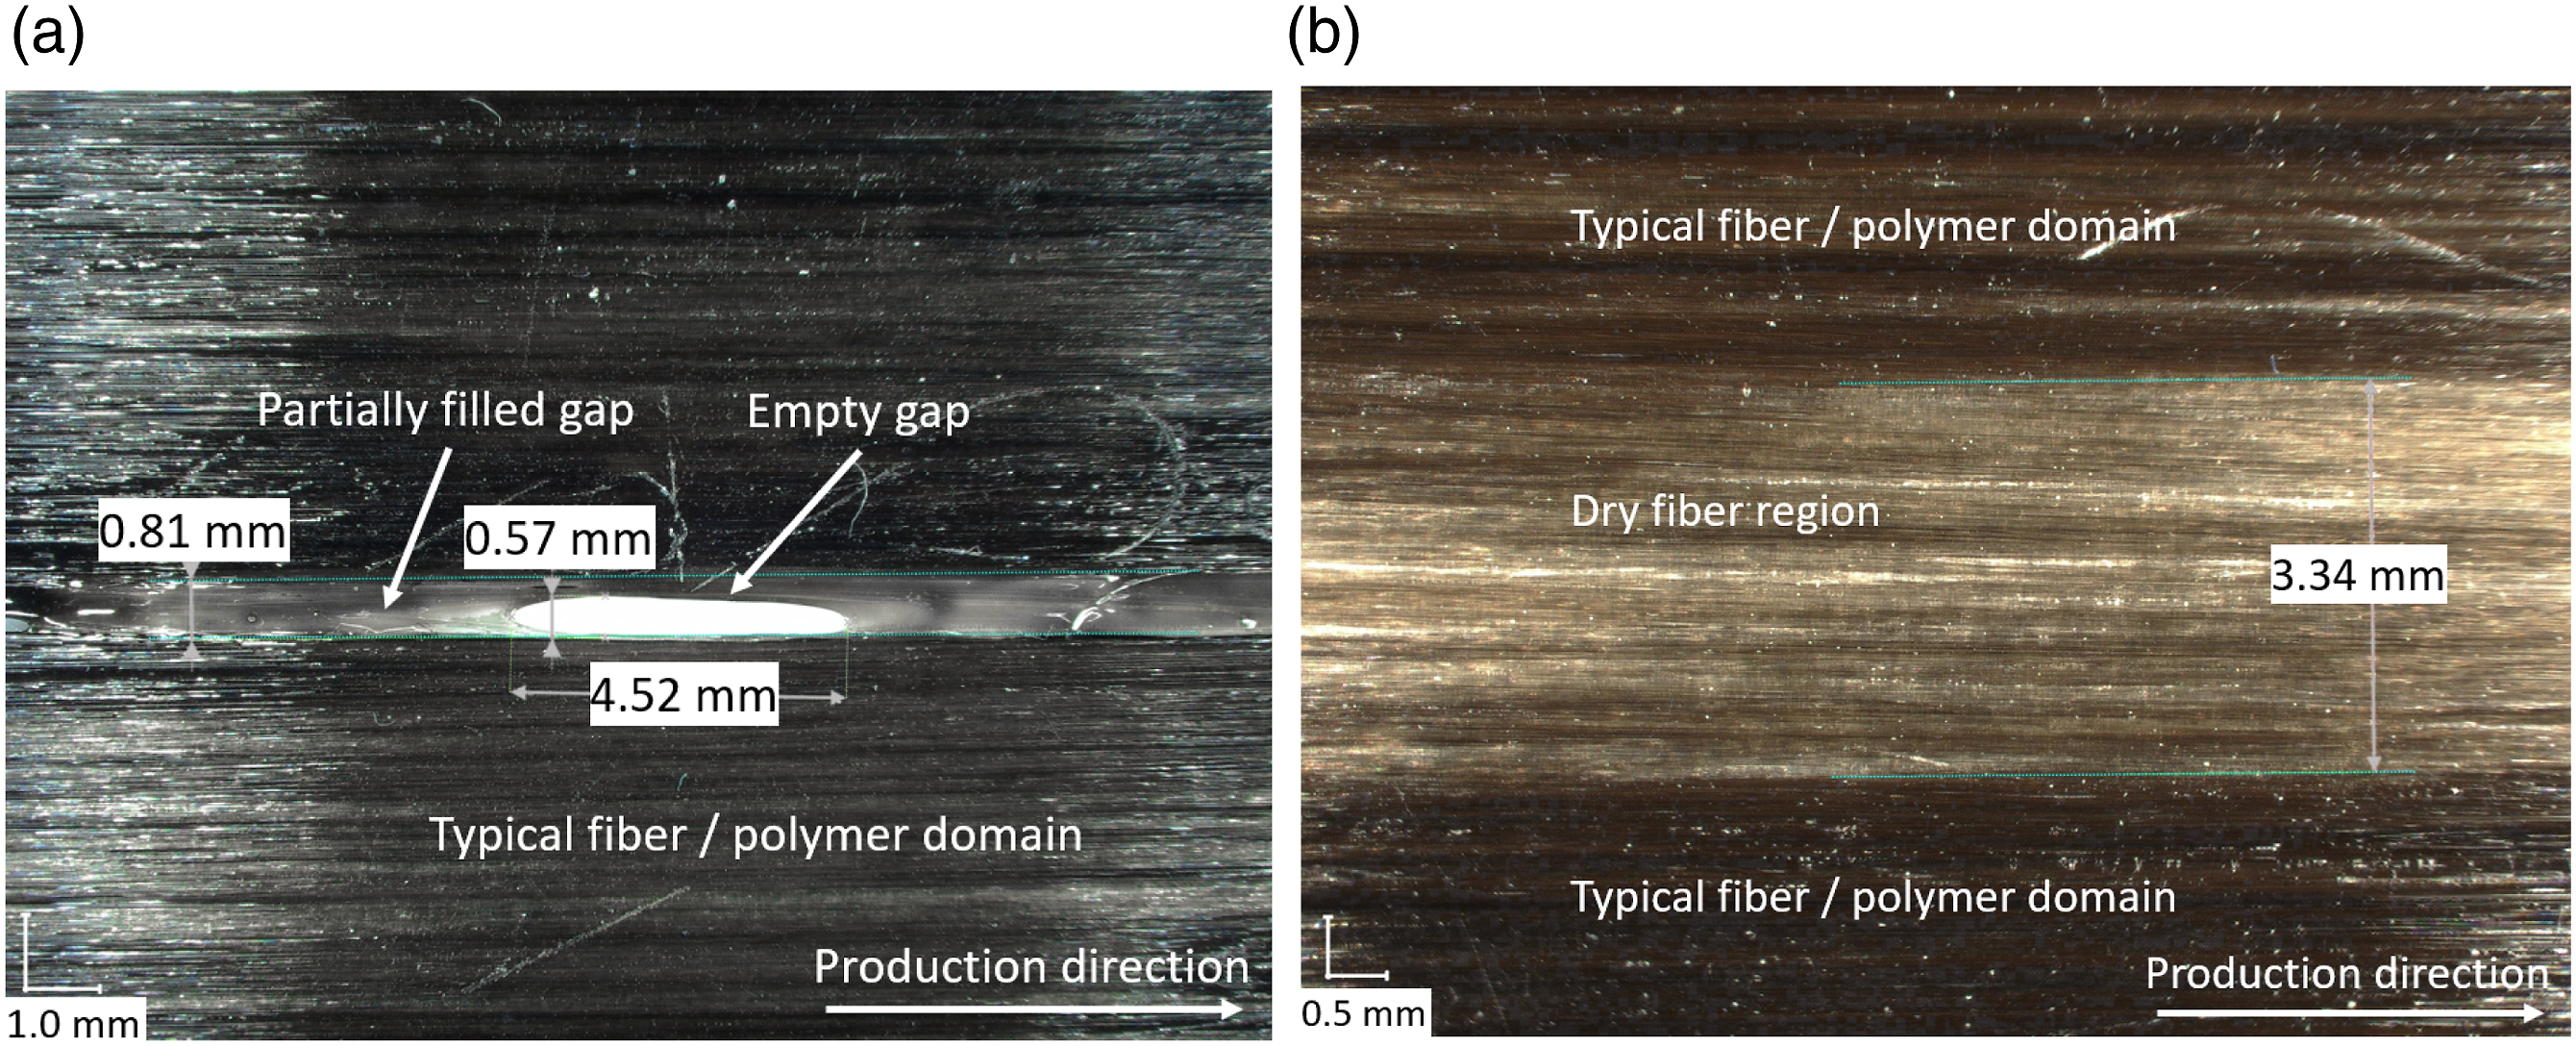
The variety of potential defects and their effects on optical and mechanical product properties show that suitable measurement technologies are essential in the production of high-quality thermoplastic UD tapes. Several studies have investigated the usefulness of various measurement techniques in the quality assessment of polymer composites.
Duchene et al. 5 reviewed non-destructive measurement techniques (NDT) for mechanical damage assessment of polymer composites, predominantly of thermosetting epoxy resins reinforced by carbon- or glass fibers. The existing methods were classified as: (1) acoustic-wave-based, (2) imaging techniques, (3) computed tomography, (4) infrared thermography, (5) shearography, or (6) terahertz spectroscopy. Banerjee et al. 6 applied a frequency-modulated thermal wave imaging approach for the subsurface defect detection of jute fiber-reinforced polypropylene composites.
Several publications have examined defects in thermoplastic UD tapes. Van de Steen et al. 7 used scanning electrode microscopy (SEM) and optical microscopy of polished composite fracture surfaces to investigate three different impregnation techniques in terms of product impregnation quality and fiber distribution. Shearography was investigated as potential defect detection method in wood-plastic composites by Barmouz et al. 8 Machado et al. 9 examined carbon-fiber reinforced unidirectional polymer ropes with several artificial defects, using contactless high-speed eddy current probes. Defects smaller than 1 mm in length were detected with an excellent signal-noise-ratio (SNR) at 4 m/s. Koster et al. 10 compared several inline measurement systems, including confocal laser distance sensors, active/passive thermography, eddy current and air-coupled ultrasonics. Further, to evaluate tape thickness, fiber distribution, and fiber-volume content of thermoplastic CF tapes, a combined inline measurement approach that uses thermography and optical thickness measurements was developed. Essig and Kreutzbruck successfully measured differences in impregnation quality by air-coupled ultrasonics. 11 This method was also used by Essig and Fey et al. 12 on a special inline test rig to detect artificially induced defects (fiber cuts, matrix cuts, circular holes, impact damages, and sharp bends) at tape speeds of up to 5.35 m/min.
Several publications have dealt with the stationary investigation of glass-fiber reinforced composites by optical coherence tomography (OCT), which was originally developed for biomedical diagnostics. Among the first to use OCT in this context were Dunkers et al.13–17 who investigated multilayer fabrics based on E-glass fibers and epoxy- and vinyl-ester resins; they focused on fiber tow architecture and the detection of potential defects, such as voids and various types of impact damage (kink banding, fiber/matrix debonding, long cracking, and matrix fracture).
Stifter et al. 18 compared OCT with other NDT measurement technologies, including X-ray computed tomography (CT), μ-CT and confocal microscopy. Using a polarization-sensitive measurement setup, Oh and Wiesauer evaluated the inside stress distribution of various glass-fiber reinforced polymer (GFRP) samples and found correlations with structural failure.19,20 Awaja et al. 21 successfully demonstrated OCT as a method for studying the effects of thermal degradation on the surface of particle- and fiber-reinforced composites.
OCT was also used to study delamination and its propagation in a multilayer non-crimp laminate used for a wind turbine blade. 22 Defect detection and quality assessment of multi-layer E-glass composites using an epoxy resin were investigated extensively, with a focus on defects at various layer depths and on important quality parameters (e.g., tape thickness).23,24 OCT is capable to investigate translucent composites only, since e.g. carbon fibers do not transmit light and will therefore block incident light.
In this work, we investigated the suitability of OCT for inline quality measurements in the continuous production of thermoplastic UD tapes. Prior studies have already demonstrated the potential of OCT in the discontinuous production of thermoset-based glass-fiber reinforced polymer composites.
We first present OCT measurements of stationary PC/GF tapes, focusing on the detection of (1) insufficiently impregnated (i.e., “dry”) fiber regions, (2) unfilled gaps, (3) rough tape surfaces, and (4) polymer accumulations that cause downstream fiber/polymer irregularities. Compared to other measurement technologies OCT allows the investigation of surface defects but also bulk defects within suitable photoconductive sample materials.
For validation we conducted perpendicular microscopic measurements of the according tape cross-sections measured by OCT. Further, using a special test rig, we assessed the ability of OCT with moving sensor to detect inline the aforementioned production defects.
OCT fundamentals
Oct is a non-destructive and non-invasive optical imaging technique that typically operates in the near infrared (NIR) spectral range. Since its introduction in ophthalmology in the 1990s, 23 it has been used in an increasing range of applications both in biomedicine and in materials science.25,26
Conventional OCT exploits low-coherence interferometric phenomena to obtain structural information about turbid samples – that is, translucent or optically opaque materials –, which scatter light strongly. OCT generates depth-resolved measurements of the backscattering/back reflection strength at internal structural sites. Spectral Domain (SD-) OCT uses the Fourier-Domain (FD-)OCT technique, where the spectrum contains the depth information as an axial distribution (A-scan). An A-scan is a single depth scan and can be extracted by taking the inverse Fourier transform of the measured signal. Figure 3 illustrates an OCT system schematically. Optical coherence tomography system based on a Michelson interferometer (a) and the fundamental scanning routine in the X/Y-direction (b).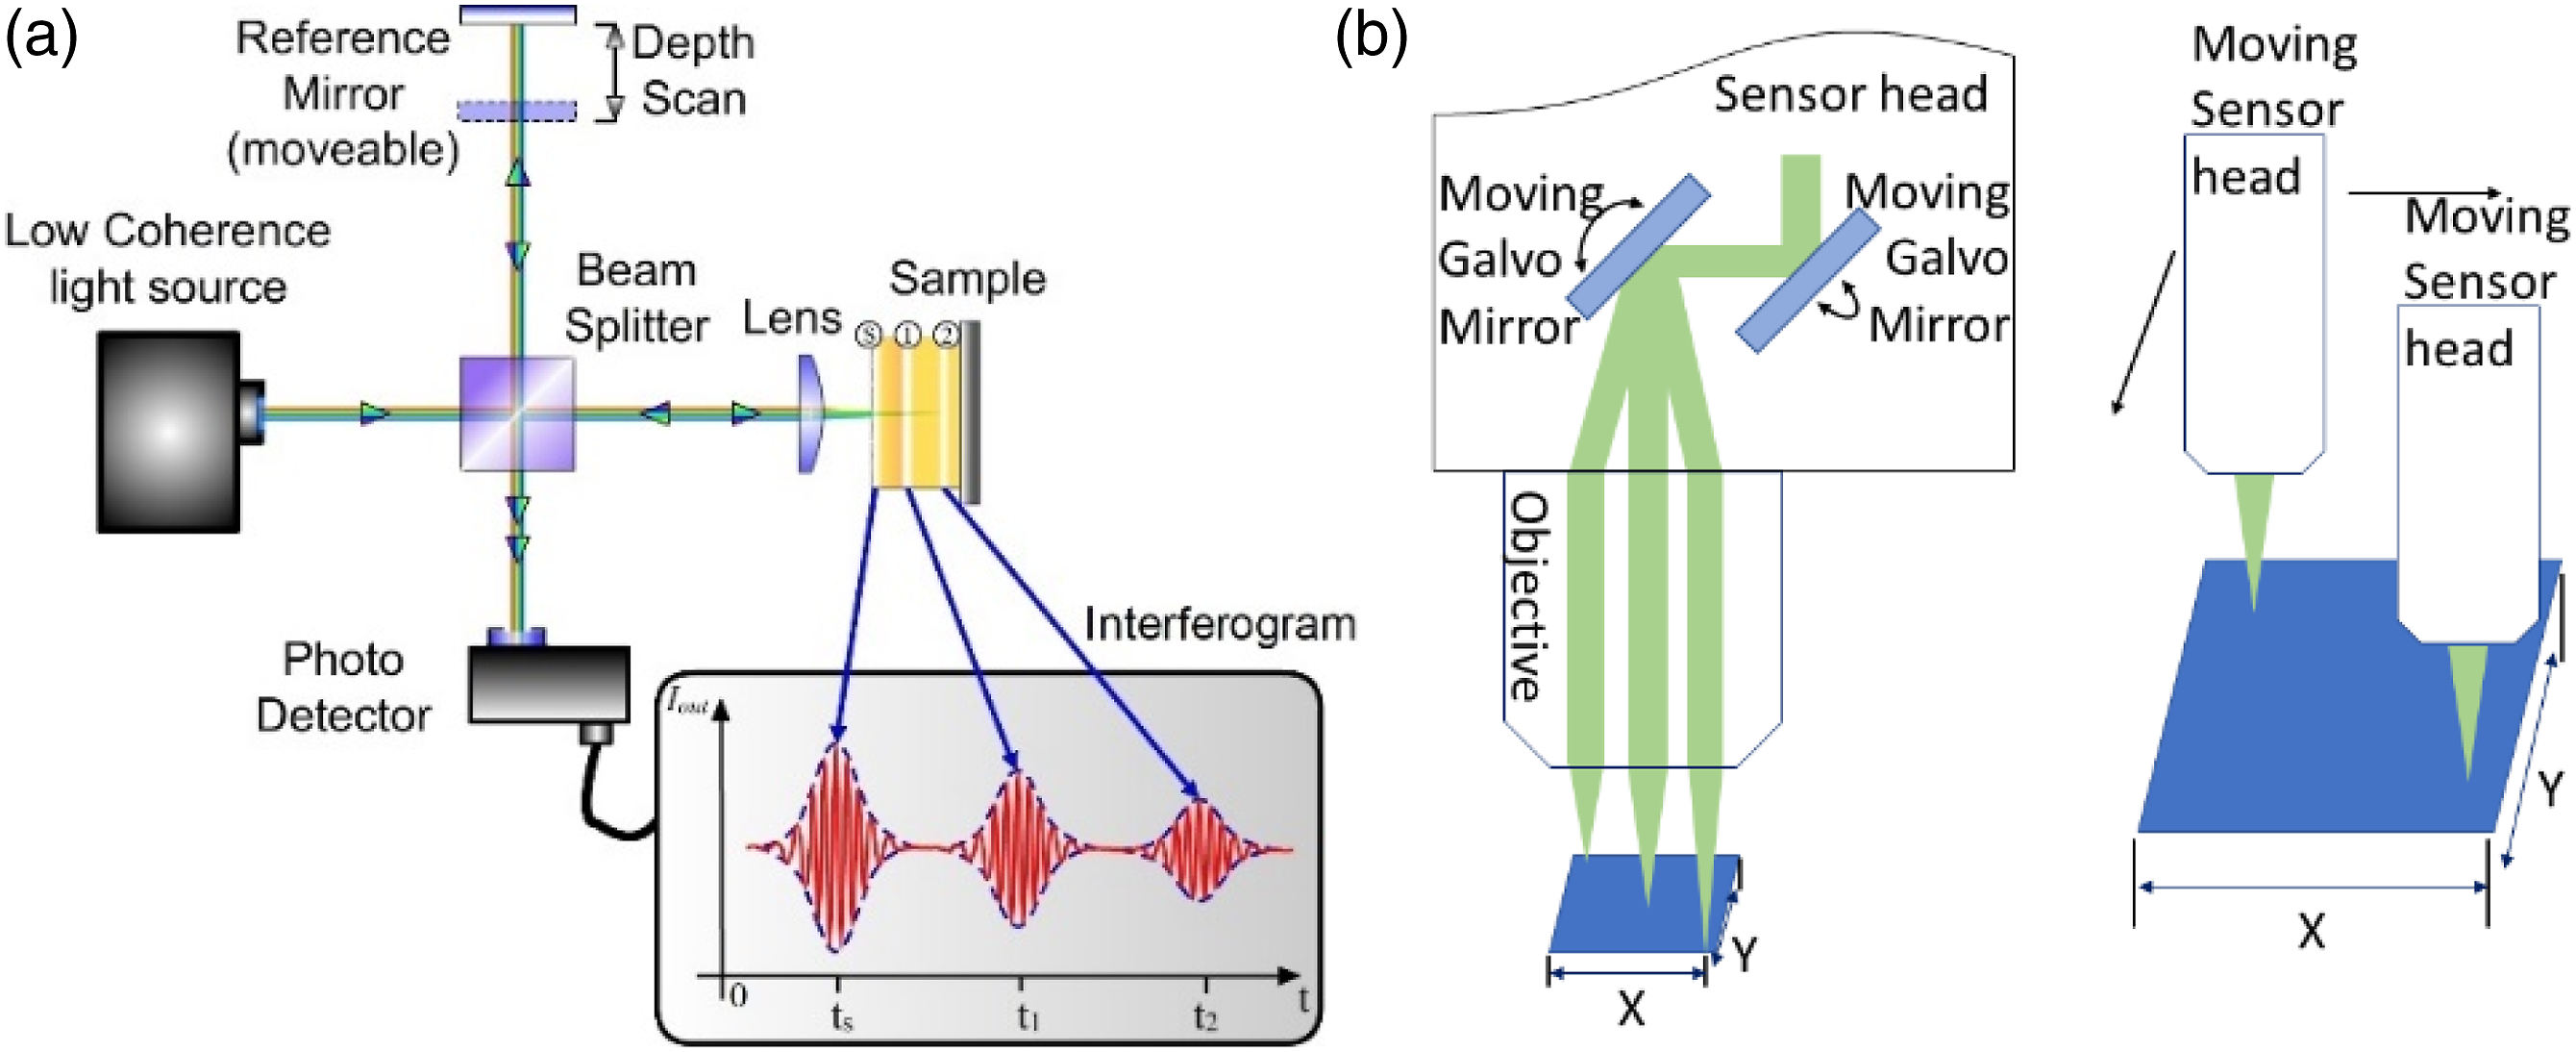
Recording multiple A-scans by moving either galvo mirrors in the sensor head or the sensor head itself in the X/Y-direction allows a B-scan or a volume scan to be created: While a B-scan is the result of a line scan along the sample, a volume scan is a line-by-line scan of an area (i.e., it consists of multiple B-scans). Recording the data across an area at a defined depth is called C-scan or en-face scan, as illustrated by Figure 4. Data recording by A-scan (depth profile), B-scan (multiple A-scans along a line), volume scan (multiple B-scans of an area), and C-scan/en-face scan (area scan at a defined depth).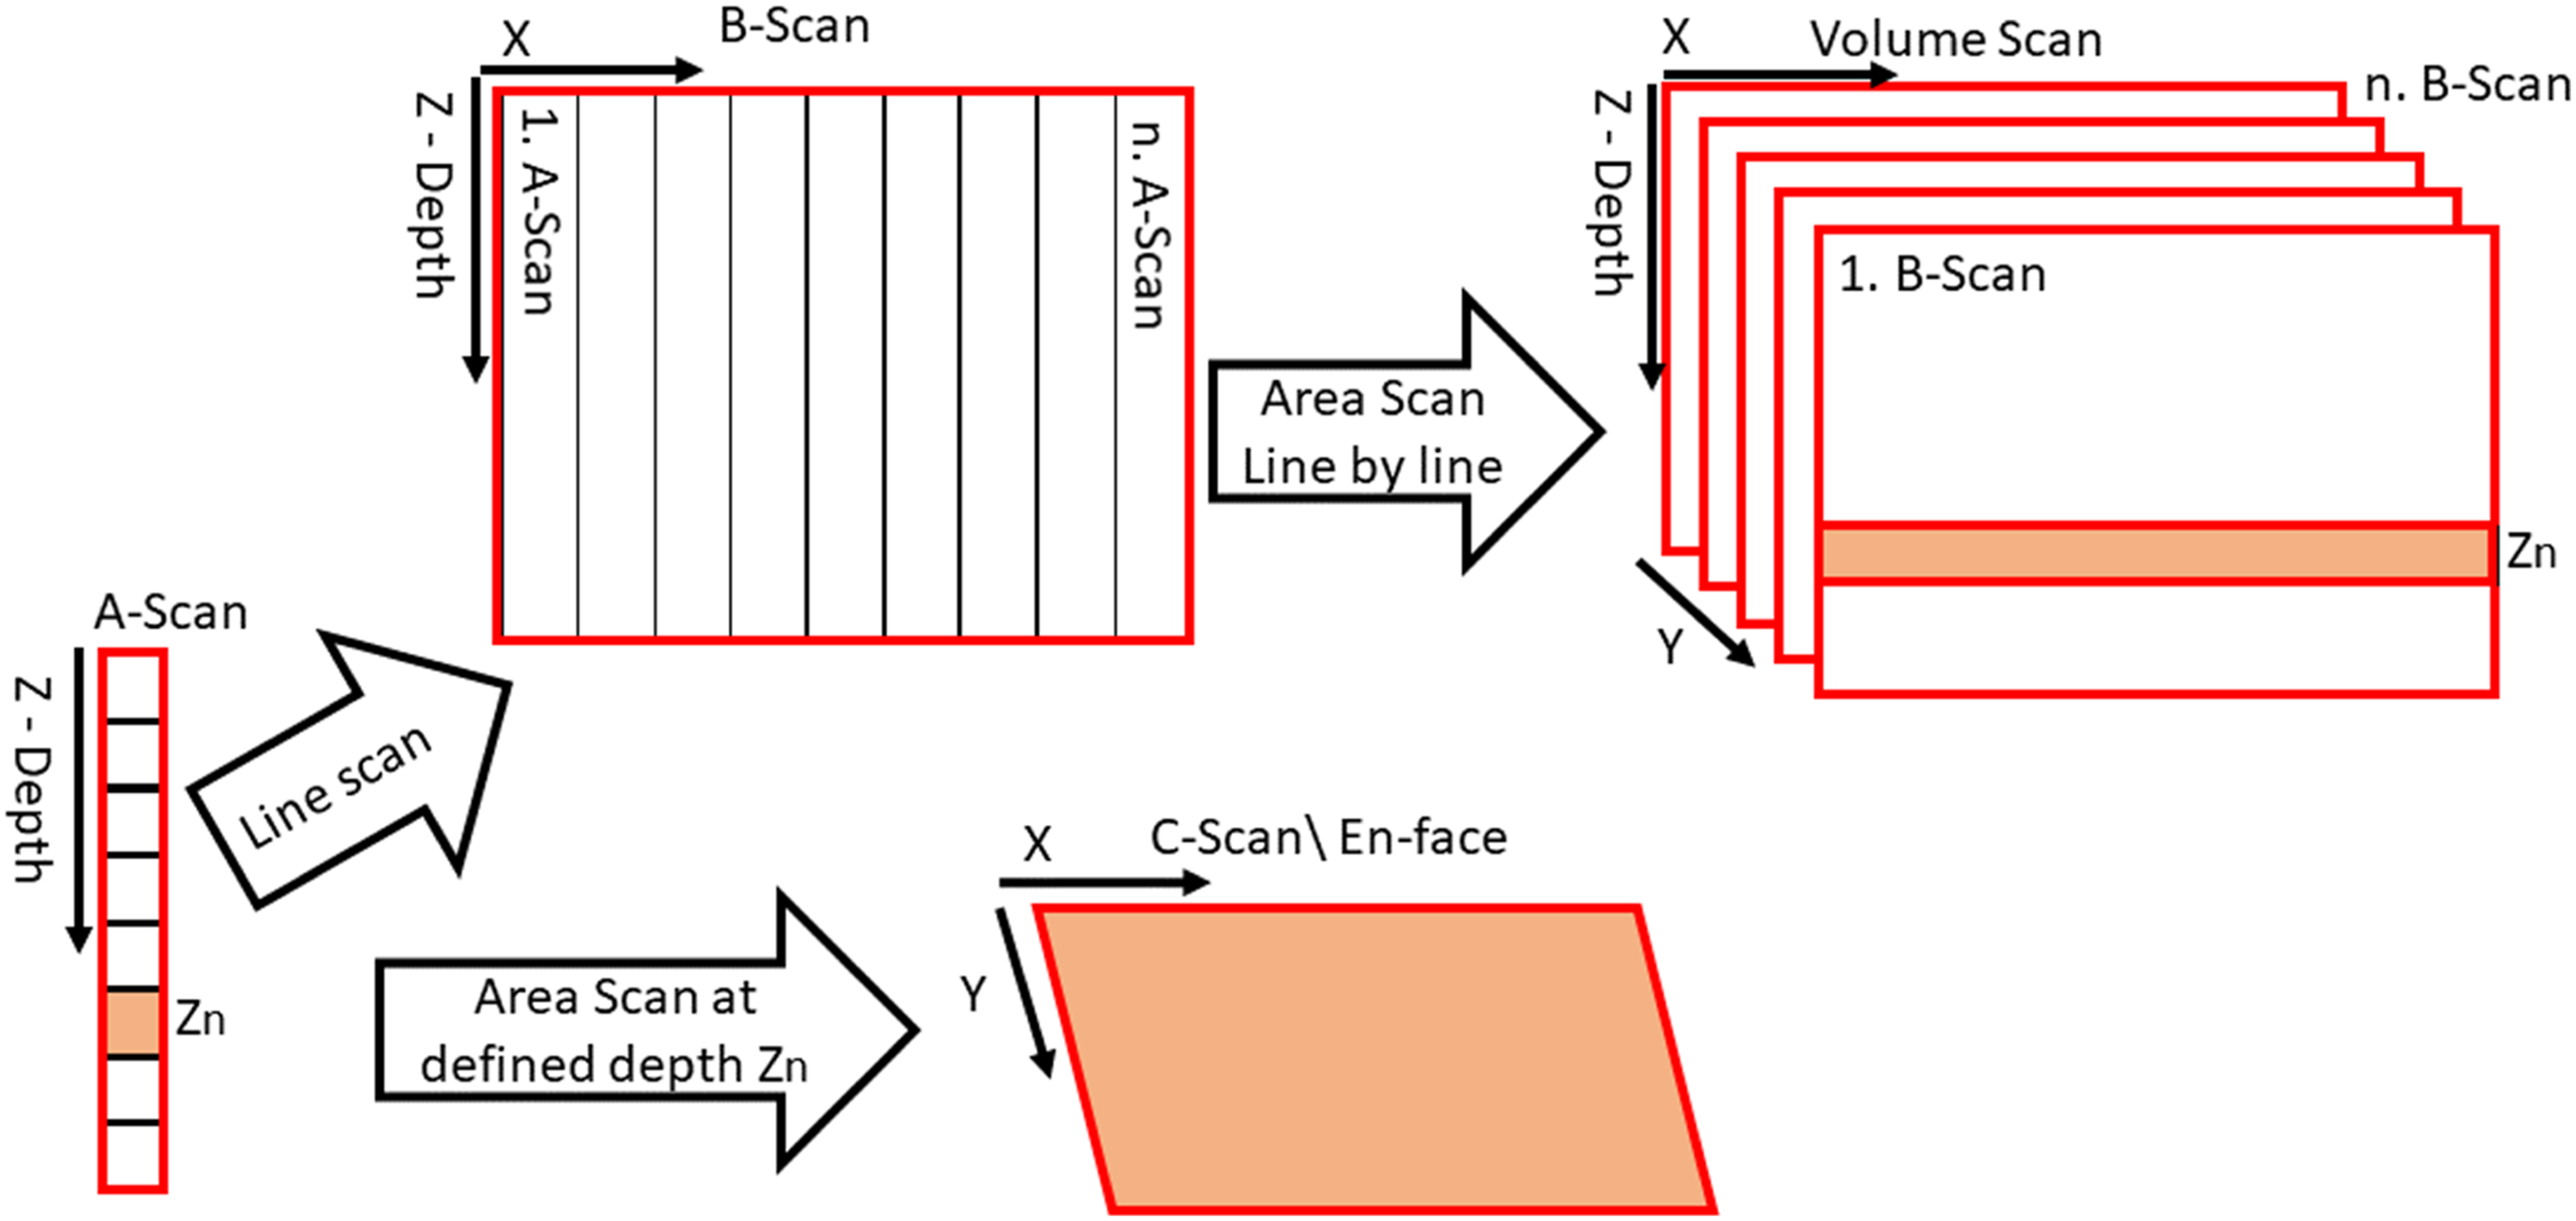
In the field of non-destructive testing (NDT), the usefulness of OCT was also demonstrated in the testing of polymer coatings and polymer layers, such as tapes, multi-layer foils and polymer composites. In these applications, it can be used to visualize inclusions, fillers, internal defects, and delaminations.27–29
Experimental
Measurement equipment
OCT equipment for stationary and moving measurements
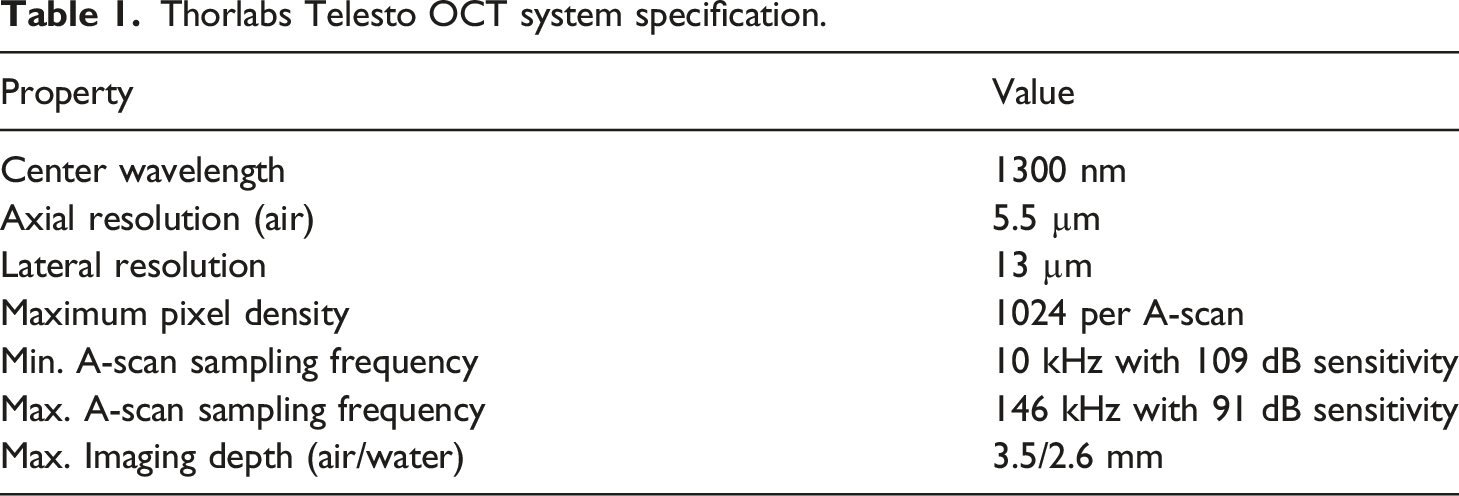
Thorlabs Telesto OCT system specification.
Microscopic analysis and probe preparation
For microscopic evaluation, we used a commercial Keyence VHX 7000 digital microscope with a VH-ZST dual zoom lens kit, which allows magnifications ranging from 20×–200× and 200×–2000×. For the cross-sectional analysis of dry-fiber regions, the sample was embedded in an epoxy resin (EP) with ultra-low mixing viscosities (250 mPas at 25°C), which is typically used for vacuum infusion of glass, aramid fibers and carbon fibers (resin: EP type L, hardening agent: GL2, Co. R&G Faserverbundwerkstoffe Composite Technology). This is essential for the penetration of dry-fiber regions under vacuum before hardening. Additionally, five weight-percent of an orange-colored paste was added before embedding to increase the contrast between fiber/matrix and the originally translucent EP resin.
Materials
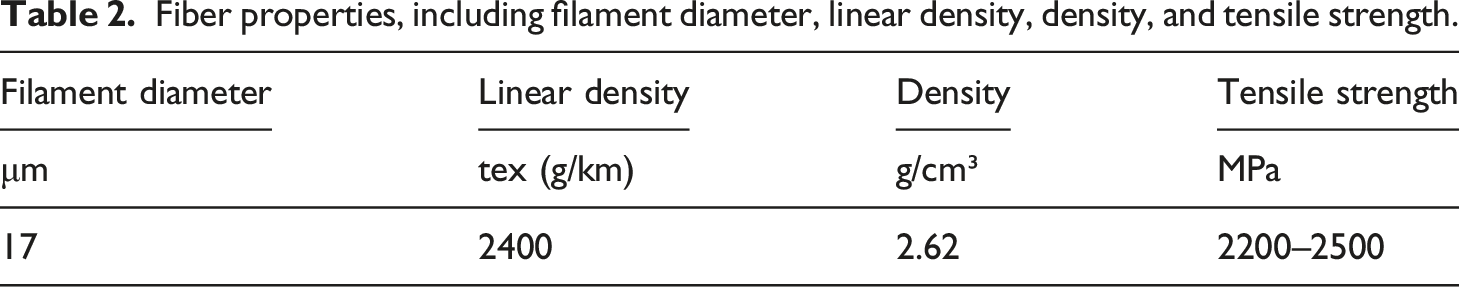
Fiber properties, including filament diameter, linear density, density, and tensile strength.
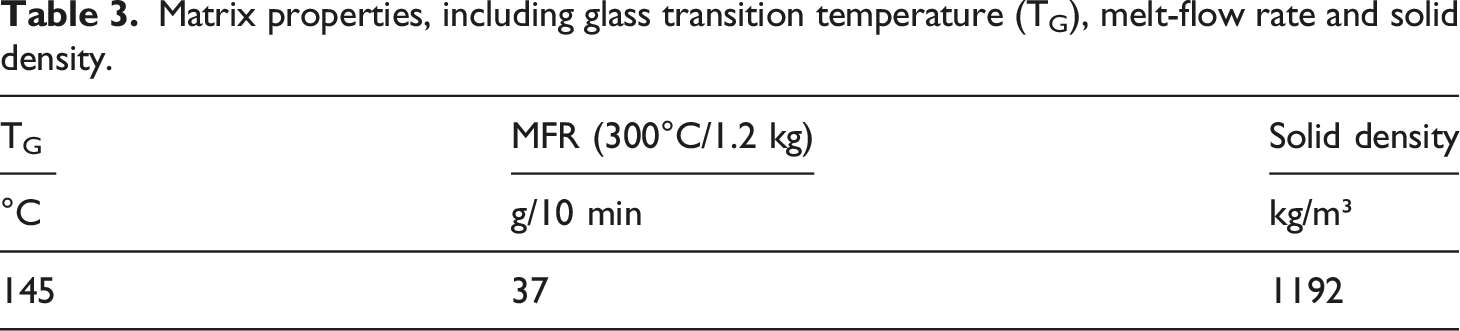
Matrix properties, including glass transition temperature (TG), melt-flow rate and solid density.
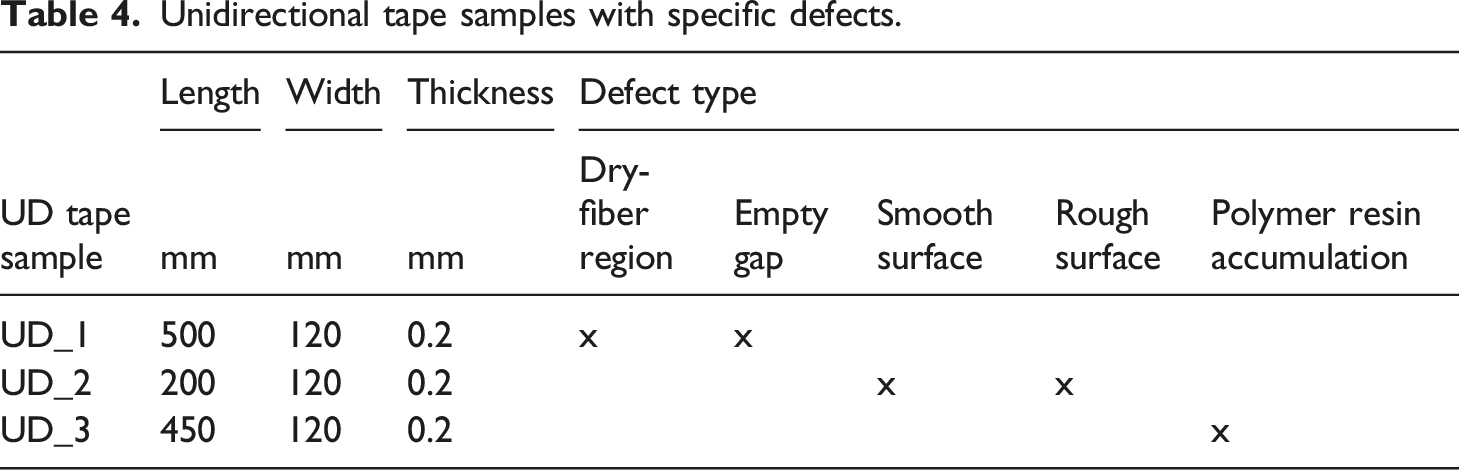
Unidirectional tape samples with specific defects.
Experimental procedure
OCT investigations with stationary sensor
First, a feasibility study in the form of stationary OCT measurements was conducted to find out which defects can be detected reliably. The OCT sensor was fixed to an adjustable scanner stand, and the samples were placed below for investigation. In this – conventional – measurement mode, the maximum field of view was 16 × 16 mm2 for planar measurements. The information obtained from the measurement system was thus limited to the predefined area of interest. Due to the refractive index of the tape samples being unknown, no absolute size indications were possible by OCT. The index was fixed to 1.0. For the analysis of the measurement data, the software ThorImage 5.4.9 was used.
OCT investigations with transversely moving sensor
For evaluation of a complete tape cross- section, a mechanical test rig of four steel rollers mounted on a frame made of aluminum profiles was developed. A toothed drive belt connected a stepper motor, controlled by a microcontroller, to one of the two lower rollers. To increase the wrap angle and avoid potential slippage between tape and rollers, a toothed synchronization belt additionally connected the driven roller with the two adjacent rollers. The fourth, only pivoted and non-driven, roller was used for tensioning of the tape sample by a spring-loaded tensioning mechanism.
Any arbitrary take-off speed between zero and 35 m/min could be selected using a potentiometer linked to an LCD screen, both of which were connected to the microcontroller. Industrial production lines, which typically operate in this speed range, could thus be simulated. To the top of the test rig, a two-dimensional area portal with a working area of 300 × 300 mm2 was attached to allow relative transverse movements between the OCT sensor and the tape surface at a defined movement speed. A manual linear stage was attached between sensor head and Y axis carriage to allow precise adjustment of the working distance between sensor and tape surface. On the hardware side, the area portal’s maximum speed was limited to 0.5 m/s, and the maximum acceleration to 1 m/s2. Figure 5 shows a schematic of the test setup. CAD model of the motorized test rig for investigation of OCT inline capabilities. (a) Front view: The tape sample can be driven infinitely in a loop at a defined take-off speed. A stepper motor, controlled by a microcontroller, equipped with toothed drive and synchronization belts is used for circular movement of the tape. The roller on the upper right is non-driven and used for tensioning of the tape. To the top of the rest rig, a two-dimensional area portal equipped with a fixture for the OCT sensor head is attached, which allows transverse measurement across the whole tape width/surface. Between the carriage and the OCT sensor a manual linear stage is attached to allow precise adjustment of the working distance. (b) Side view: Moveable light barriers are attached on each side of the tape sample. When the carriage crosses these, a logic trigger signal is sent to the OCT system to initiate scanning.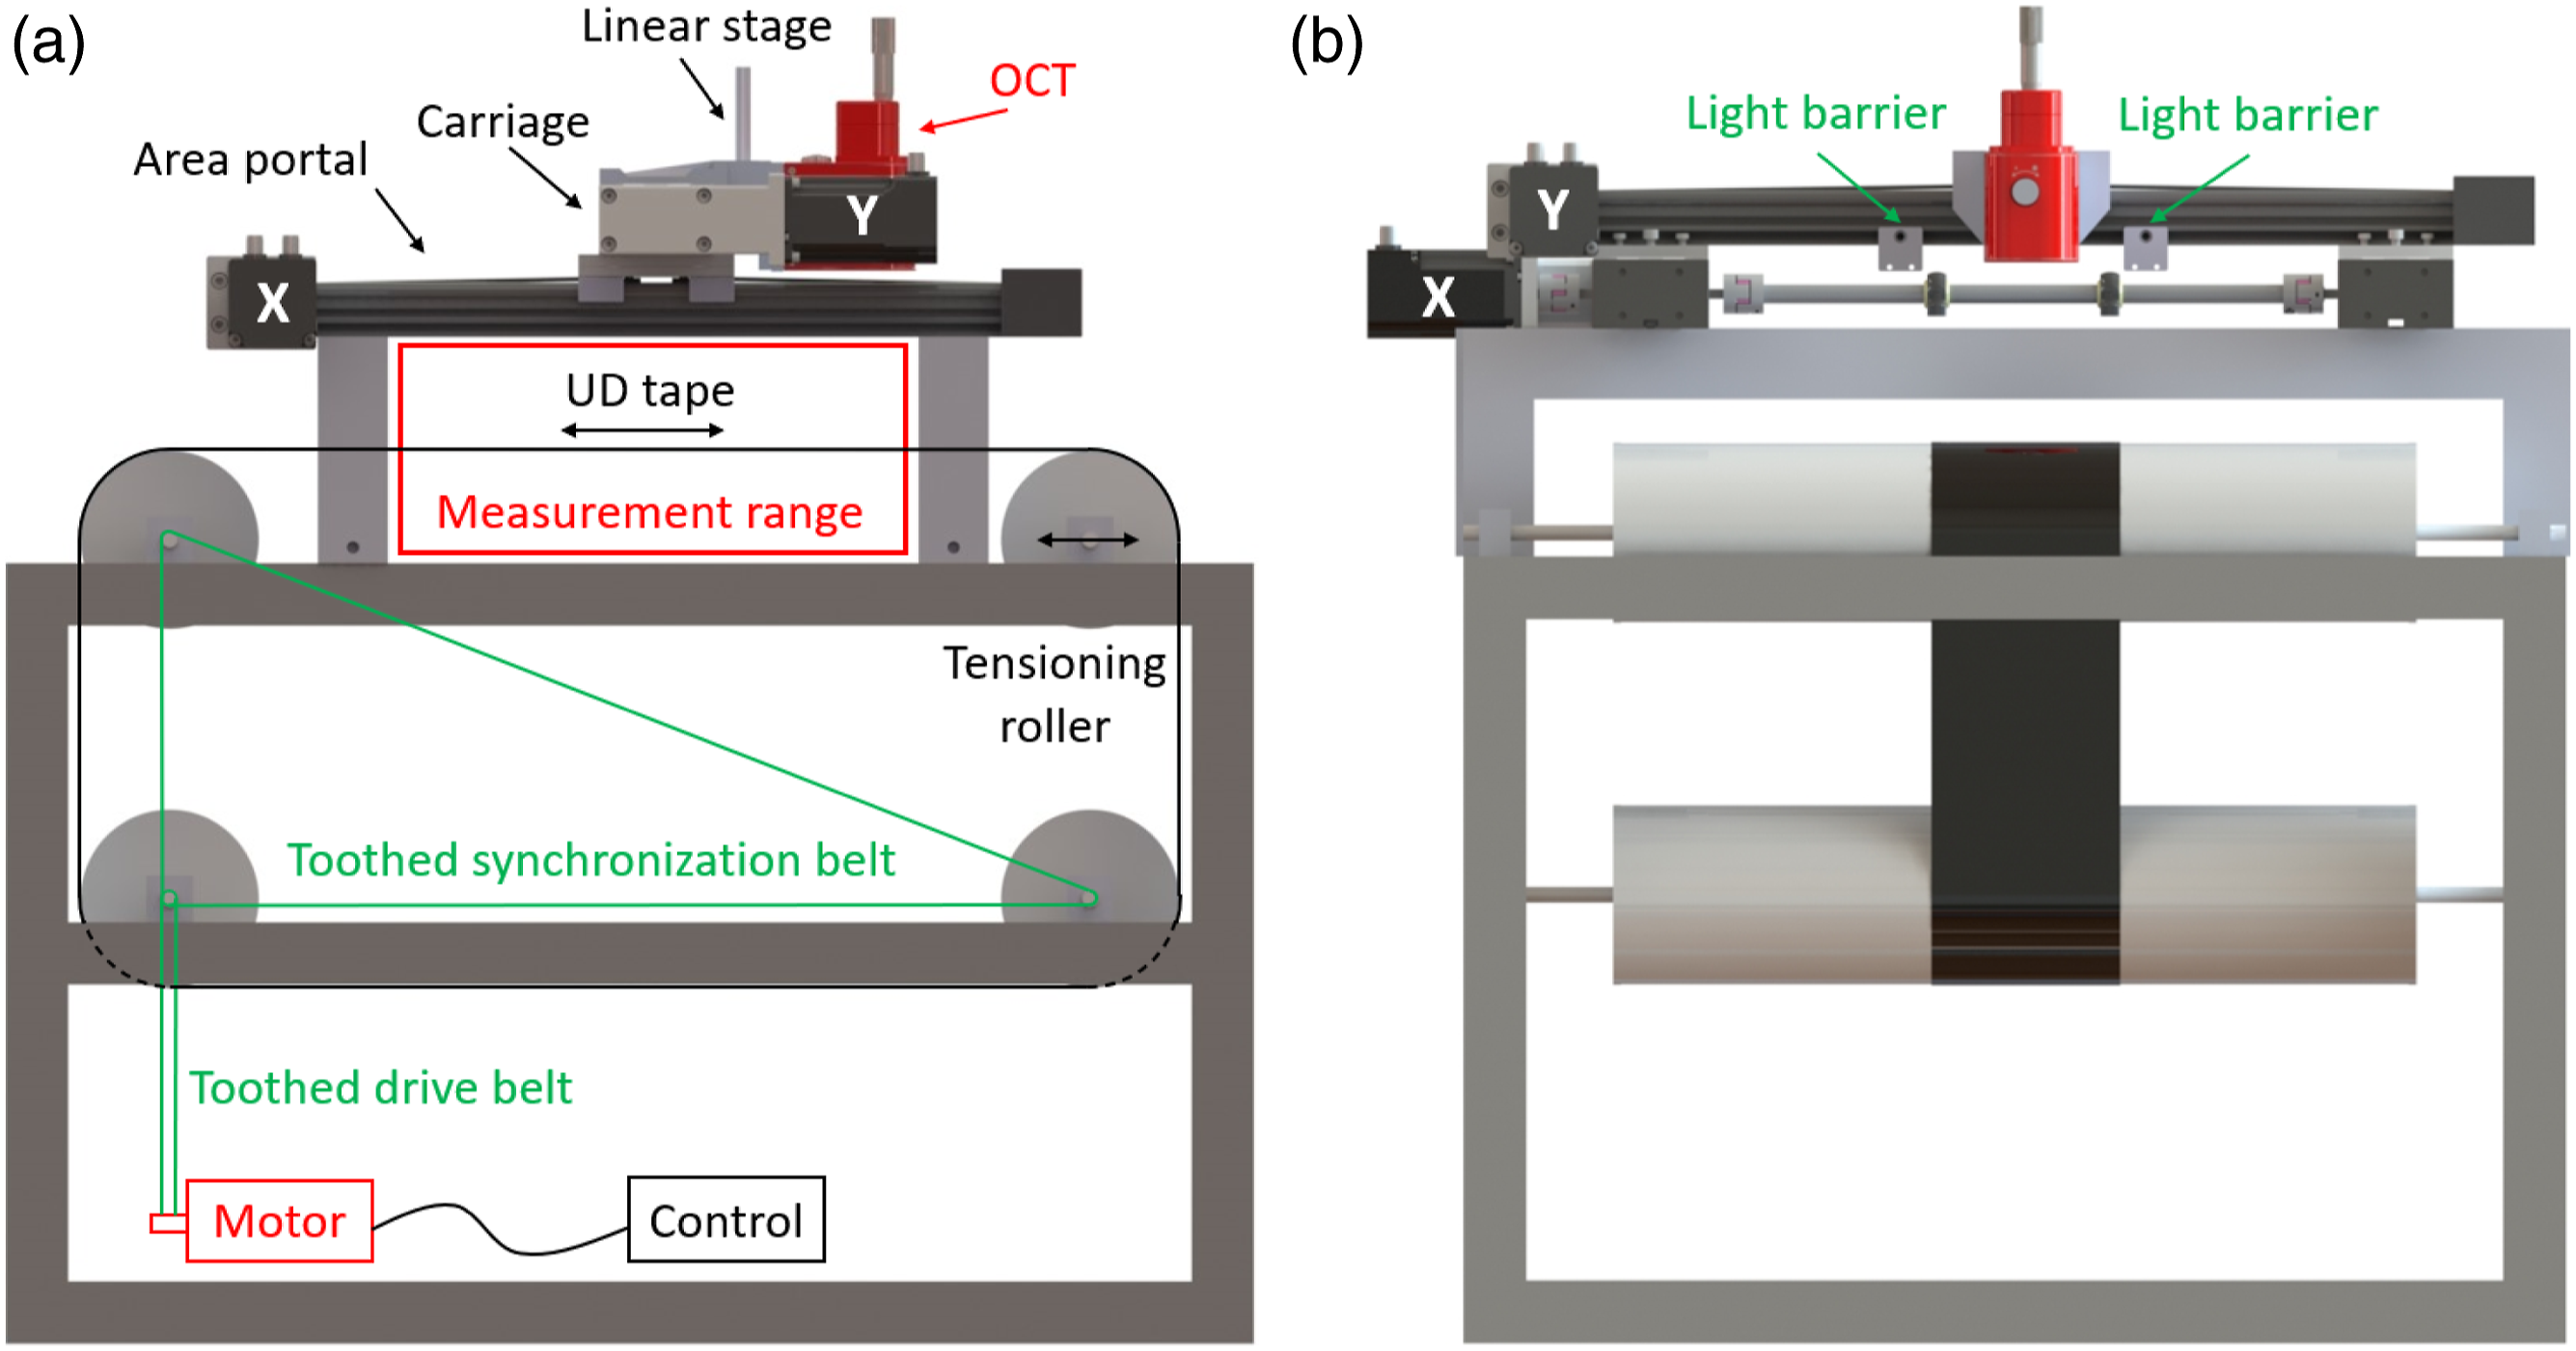
Figure 6 presents a top view of the measurement principle. Two light barrier switches, attached to the Y axis of the area portal immediately before and after the tape edges, are used to trigger measurement in each direction. A second microcontroller reads the switching signal and forwards the trigger impulse to the OCT system. The carriage, which is attached to the Y axis of the 2D area portal, is equipped with the OCT sensor head and repeatedly traverses forwards and backwards linearly, perpendicular to direction in which the UD tape moves. A “zig-zag” pattern of consecutive measurement lines is created as the tape moves at the desired take-off speed. Schematic representation of the inline measurement principle.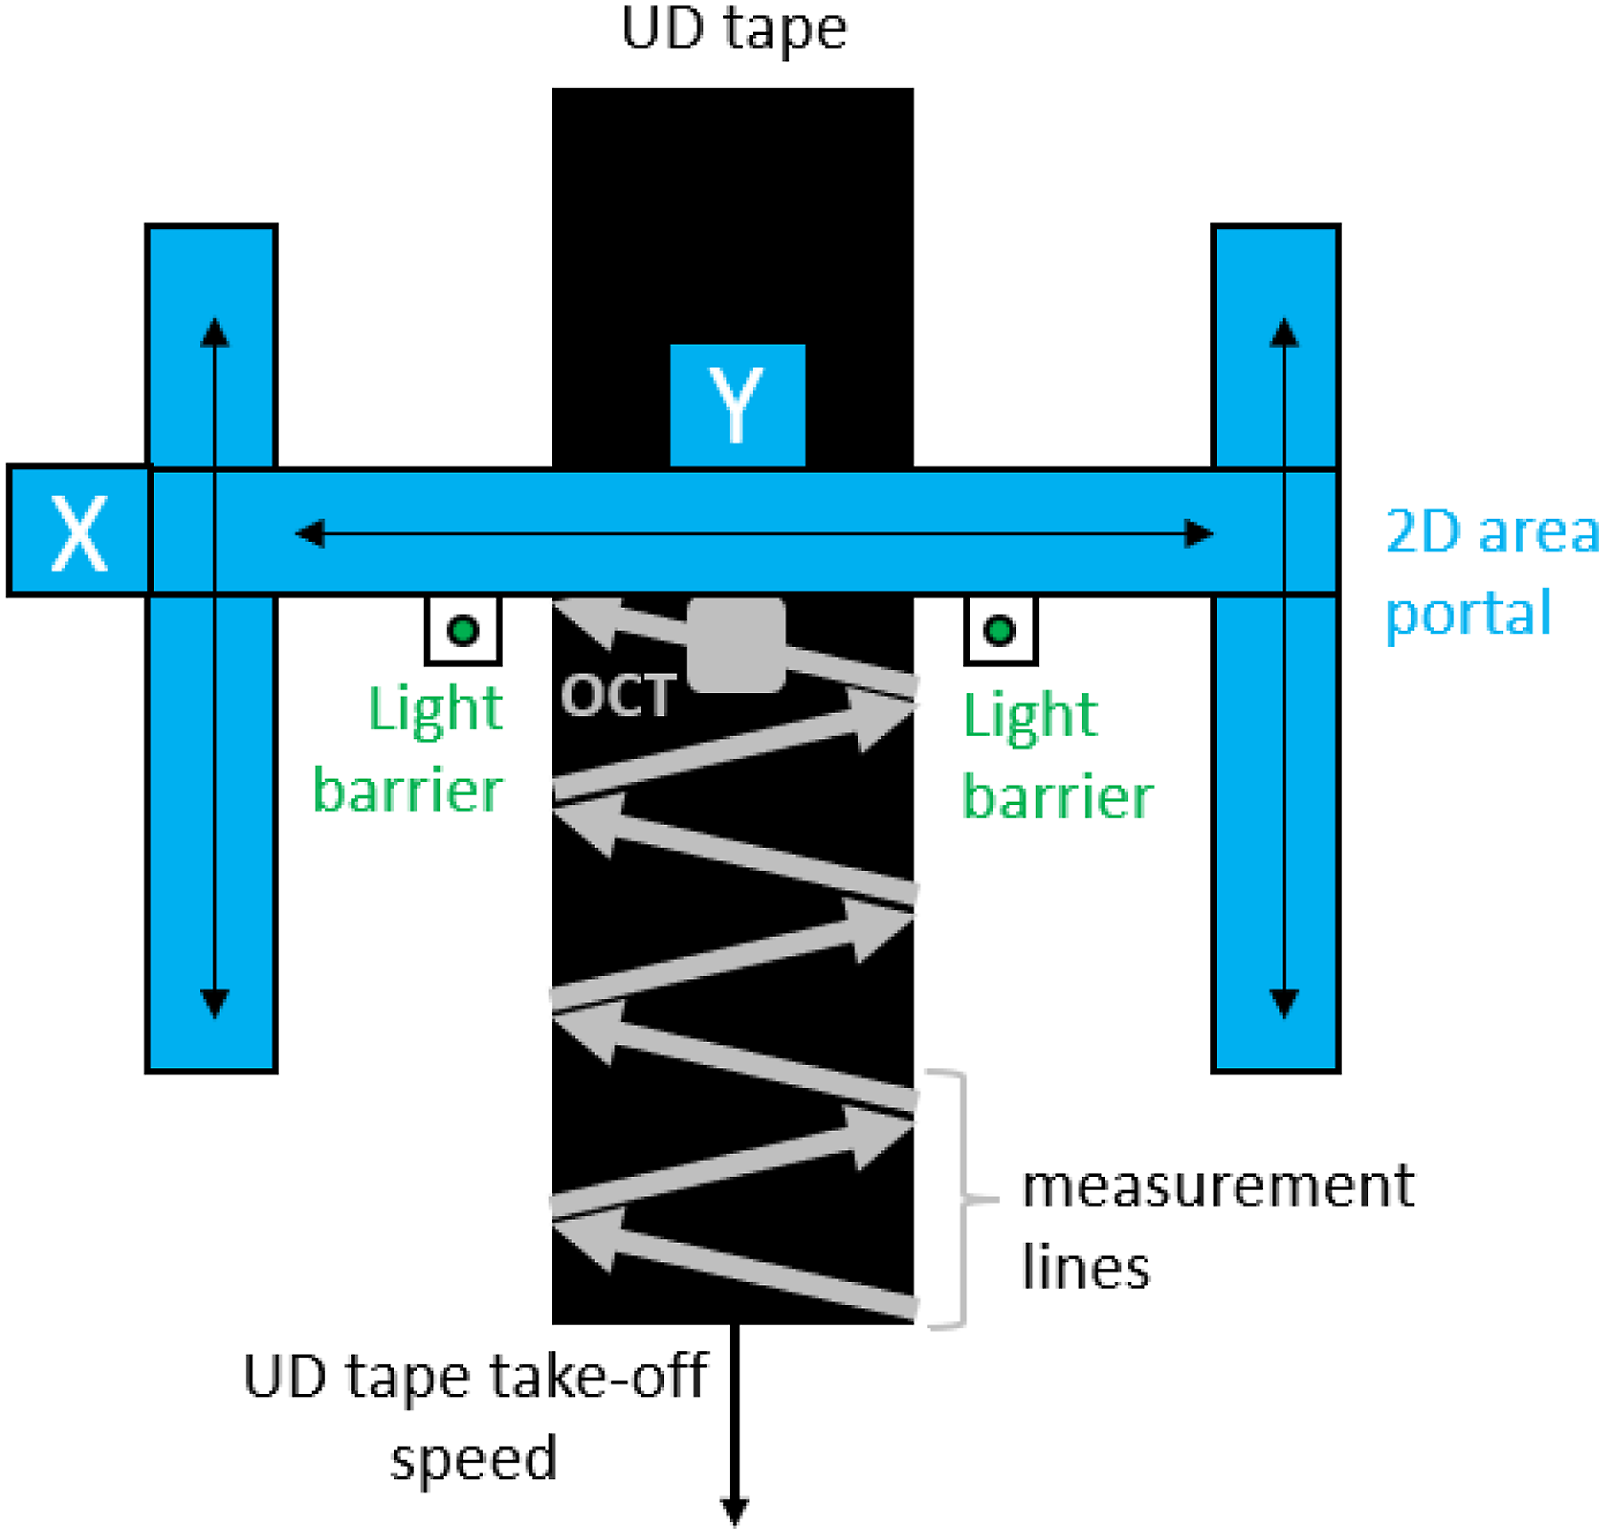
The OCT system is triggered by the light barriers for full transverse measurement of the UD tape. To automatically start and stop the acquisition of A-scans over the tape width and to save them in a raw-data-format B-scan, custom software based on the Thorlabs SDK was written in Python.
Figure 7 shows the circular flow of the individual steps in the continuous measurement process and the connection between test rig, OCT device, and the Python program. Sequential circular flow chart of the continuous measurement procedure.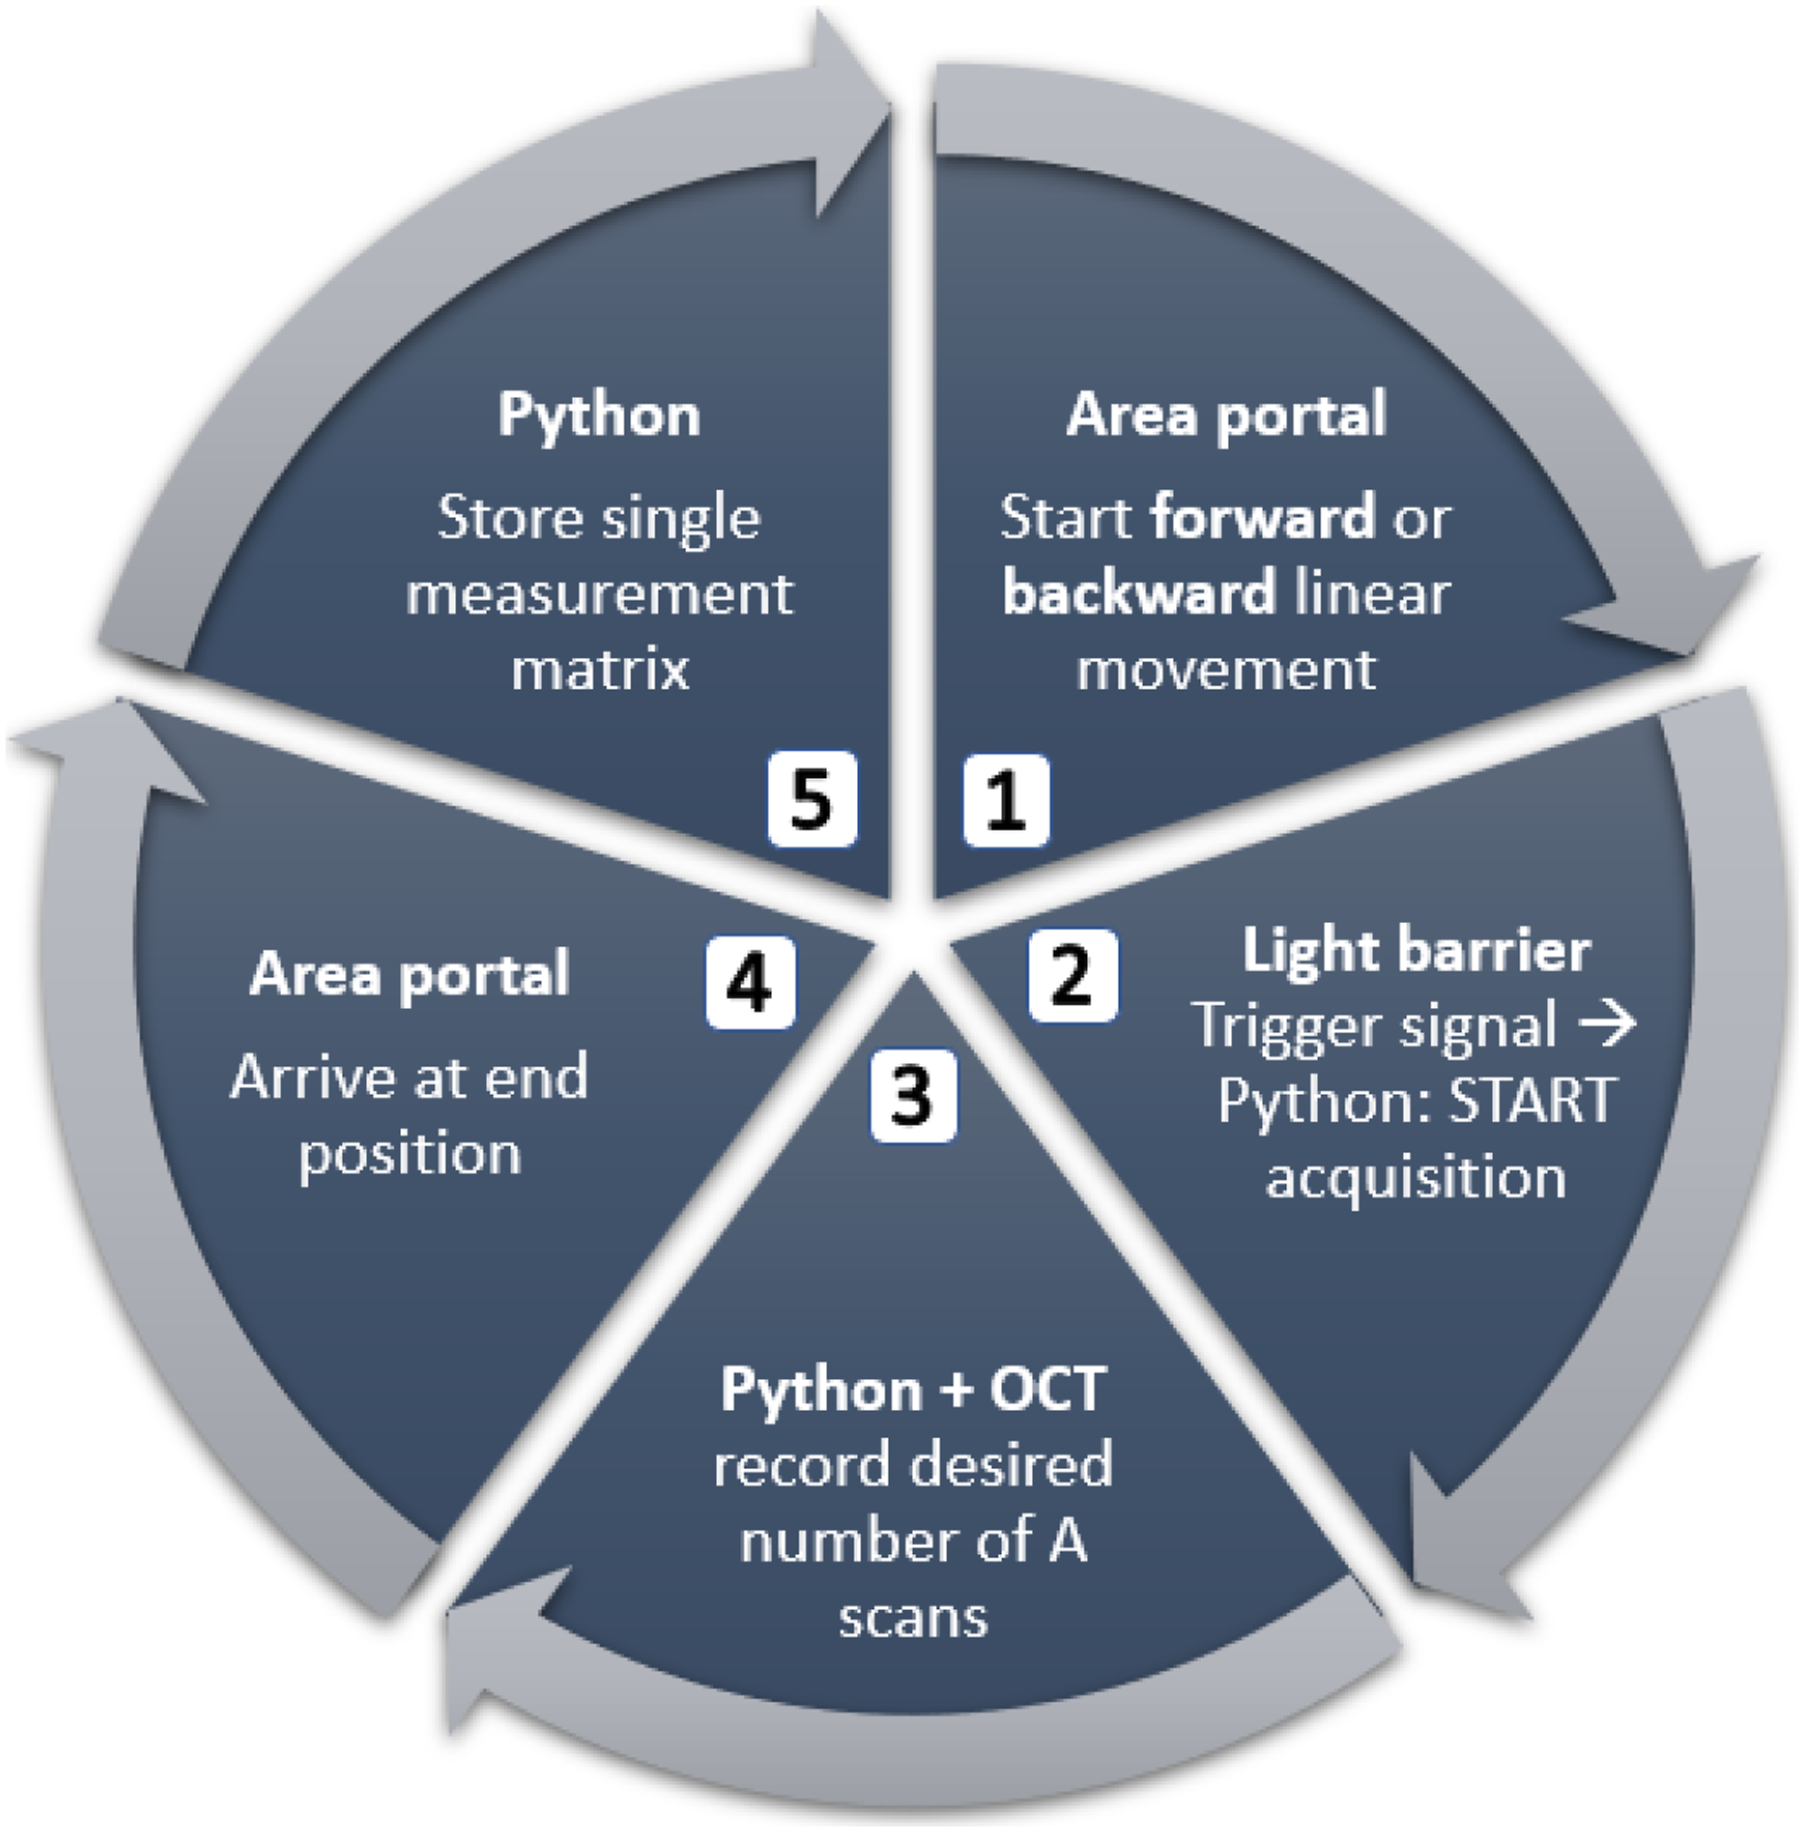
In the first step, the 2D area portal begins to move linearly either forwards or backwards and begins a new process (1). When the carriage passes through the first light barrier in the travel direction, located directly before the tape edge, a digital trigger signal (LVTTL 3.3 V) is sent to the OCT light-source unit, thereby starting the measurement (2). While the sensor moves across the tape at a constant speed, the Python script in combination with the OCT sensor records a predefined number of A-scans (3). When the carriage arrives at its end position (4), the Python script writes the data matrix to the hard drive for later evaluation (5). This process can be repeated when multiple measurements are desired.
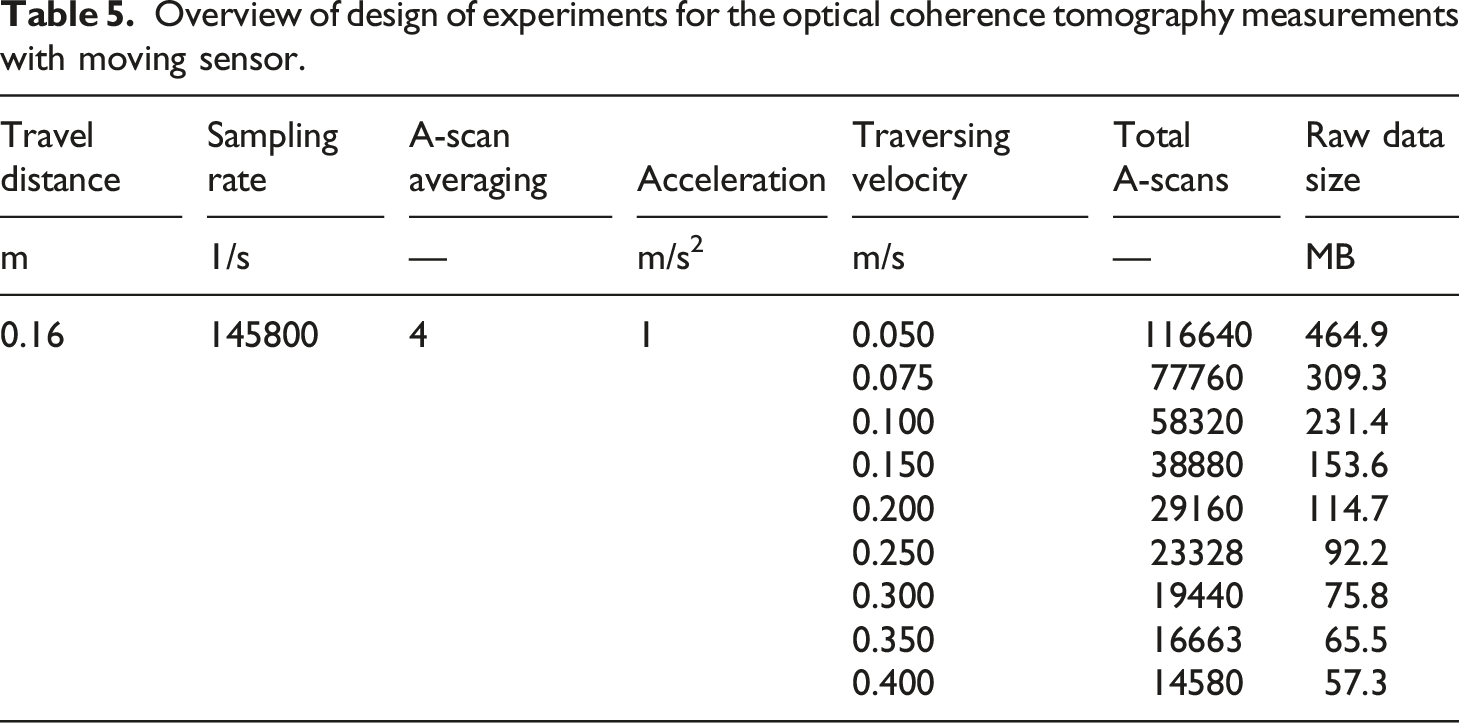
Focusing on the effect of the transverse sensor velocity on the quality of the OCT scan and therefore the robustness of the measurement, we performed experiments with a moving sensor and stationary UD tapes.
Overview of design of experiments for the optical coherence tomography measurements with moving sensor.
Measurement data evaluation procedure
Figure 8 visualizes the data evaluation procedure. Sequential flow chart of full cross-sectional optical coherence tomography inline measurements.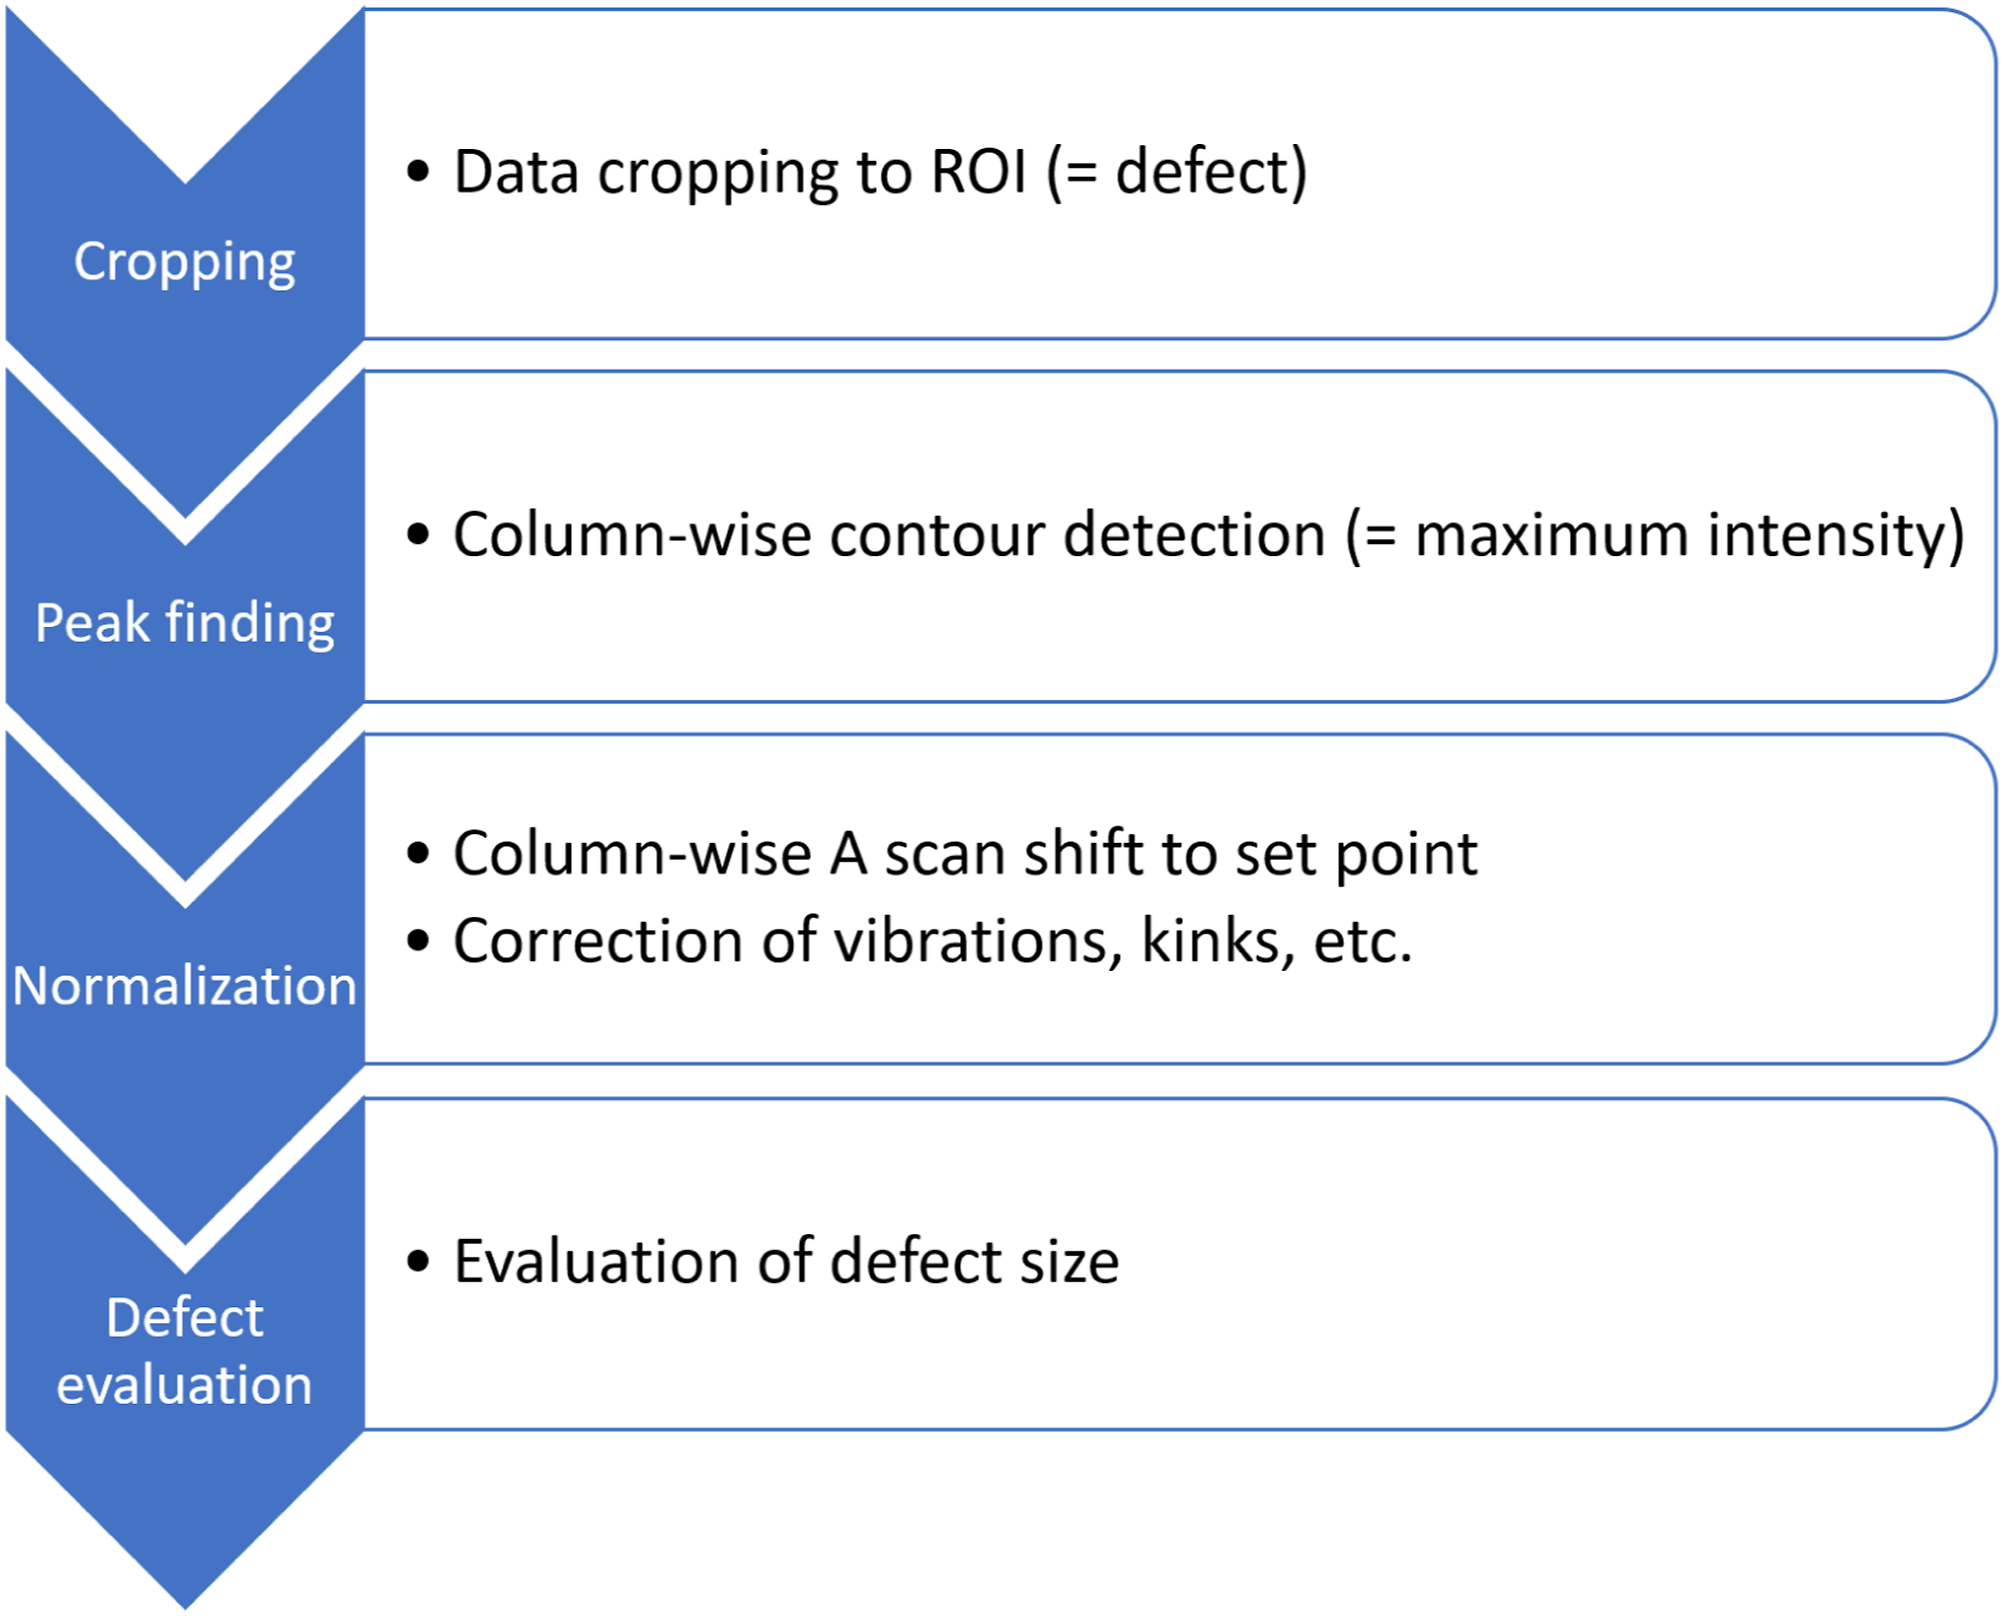
First, the raw data matrix is manually cropped to the ROI defined by the defect area. A peak-finding algorithm then identifies the maximum signal intensity measured on the upper tape surface of the tape for each A-scan along the tape cross section. The A-scans are shifted to a set point to normalize the resulting B-scan. This is essential to compensate for variations in working distance during the measurement (e.g., due to uneven tape tensioning, kinks and vibrations). Finally, defects are evaluated manually, and the total defect width in the Y direction can easily be calculated based on A-scan sampling frequency, sensor moving speed, A-scan averaging value and the total number of A-scans along the defect.
Results and discussion
Comparison of OCT measurements using stationary and moving sensor
UD_1: Dry fiber region
Figure 9(a) shows a top-view micrograph of the dry-fiber region of UD_1. The white lines represent sections with insufficiently or unimpregnated fiber sections. In this view, the border between dry and properly impregnated regions is almost indiscernible. Figure 9(c) shows the B-scan of UD_1 along the dry region. Coherent light is scattered due to changes in the refractive index, which can be observed at the upper and lower surfaces of the tape. Taking the strongly scattered signal inside the tape into account, we can clearly distinguish between insufficiently and properly impregnated fiber regions. Potential reasons for stronger scattering within the dry regions are: (1) a greater refractive index gradient between fibers and embedding medium if the local medium is air and (2) multi-scattering effects between individual fibers in a fiber bundle. Dry fiber region of sample UD_1. (a) Top-view micrograph: The bright vertical lines represent multiple dry fiber regions, which are surrounded by properly impregnated areas on the left and right (dark areas). (b) Image taken by the in-built camera of the OCT sensor, showing the direction of measurement across the tape surface (arrow). (c) Visualization of the OCT measurement (B-scan) with stationary sensor. The regions with strong signal scattering indicate the dry-fiber regions inside the tape. Scale bars: 0.5 mm (horizontal), 0.2 mm (vertical). OCT: Optical coherence tomography.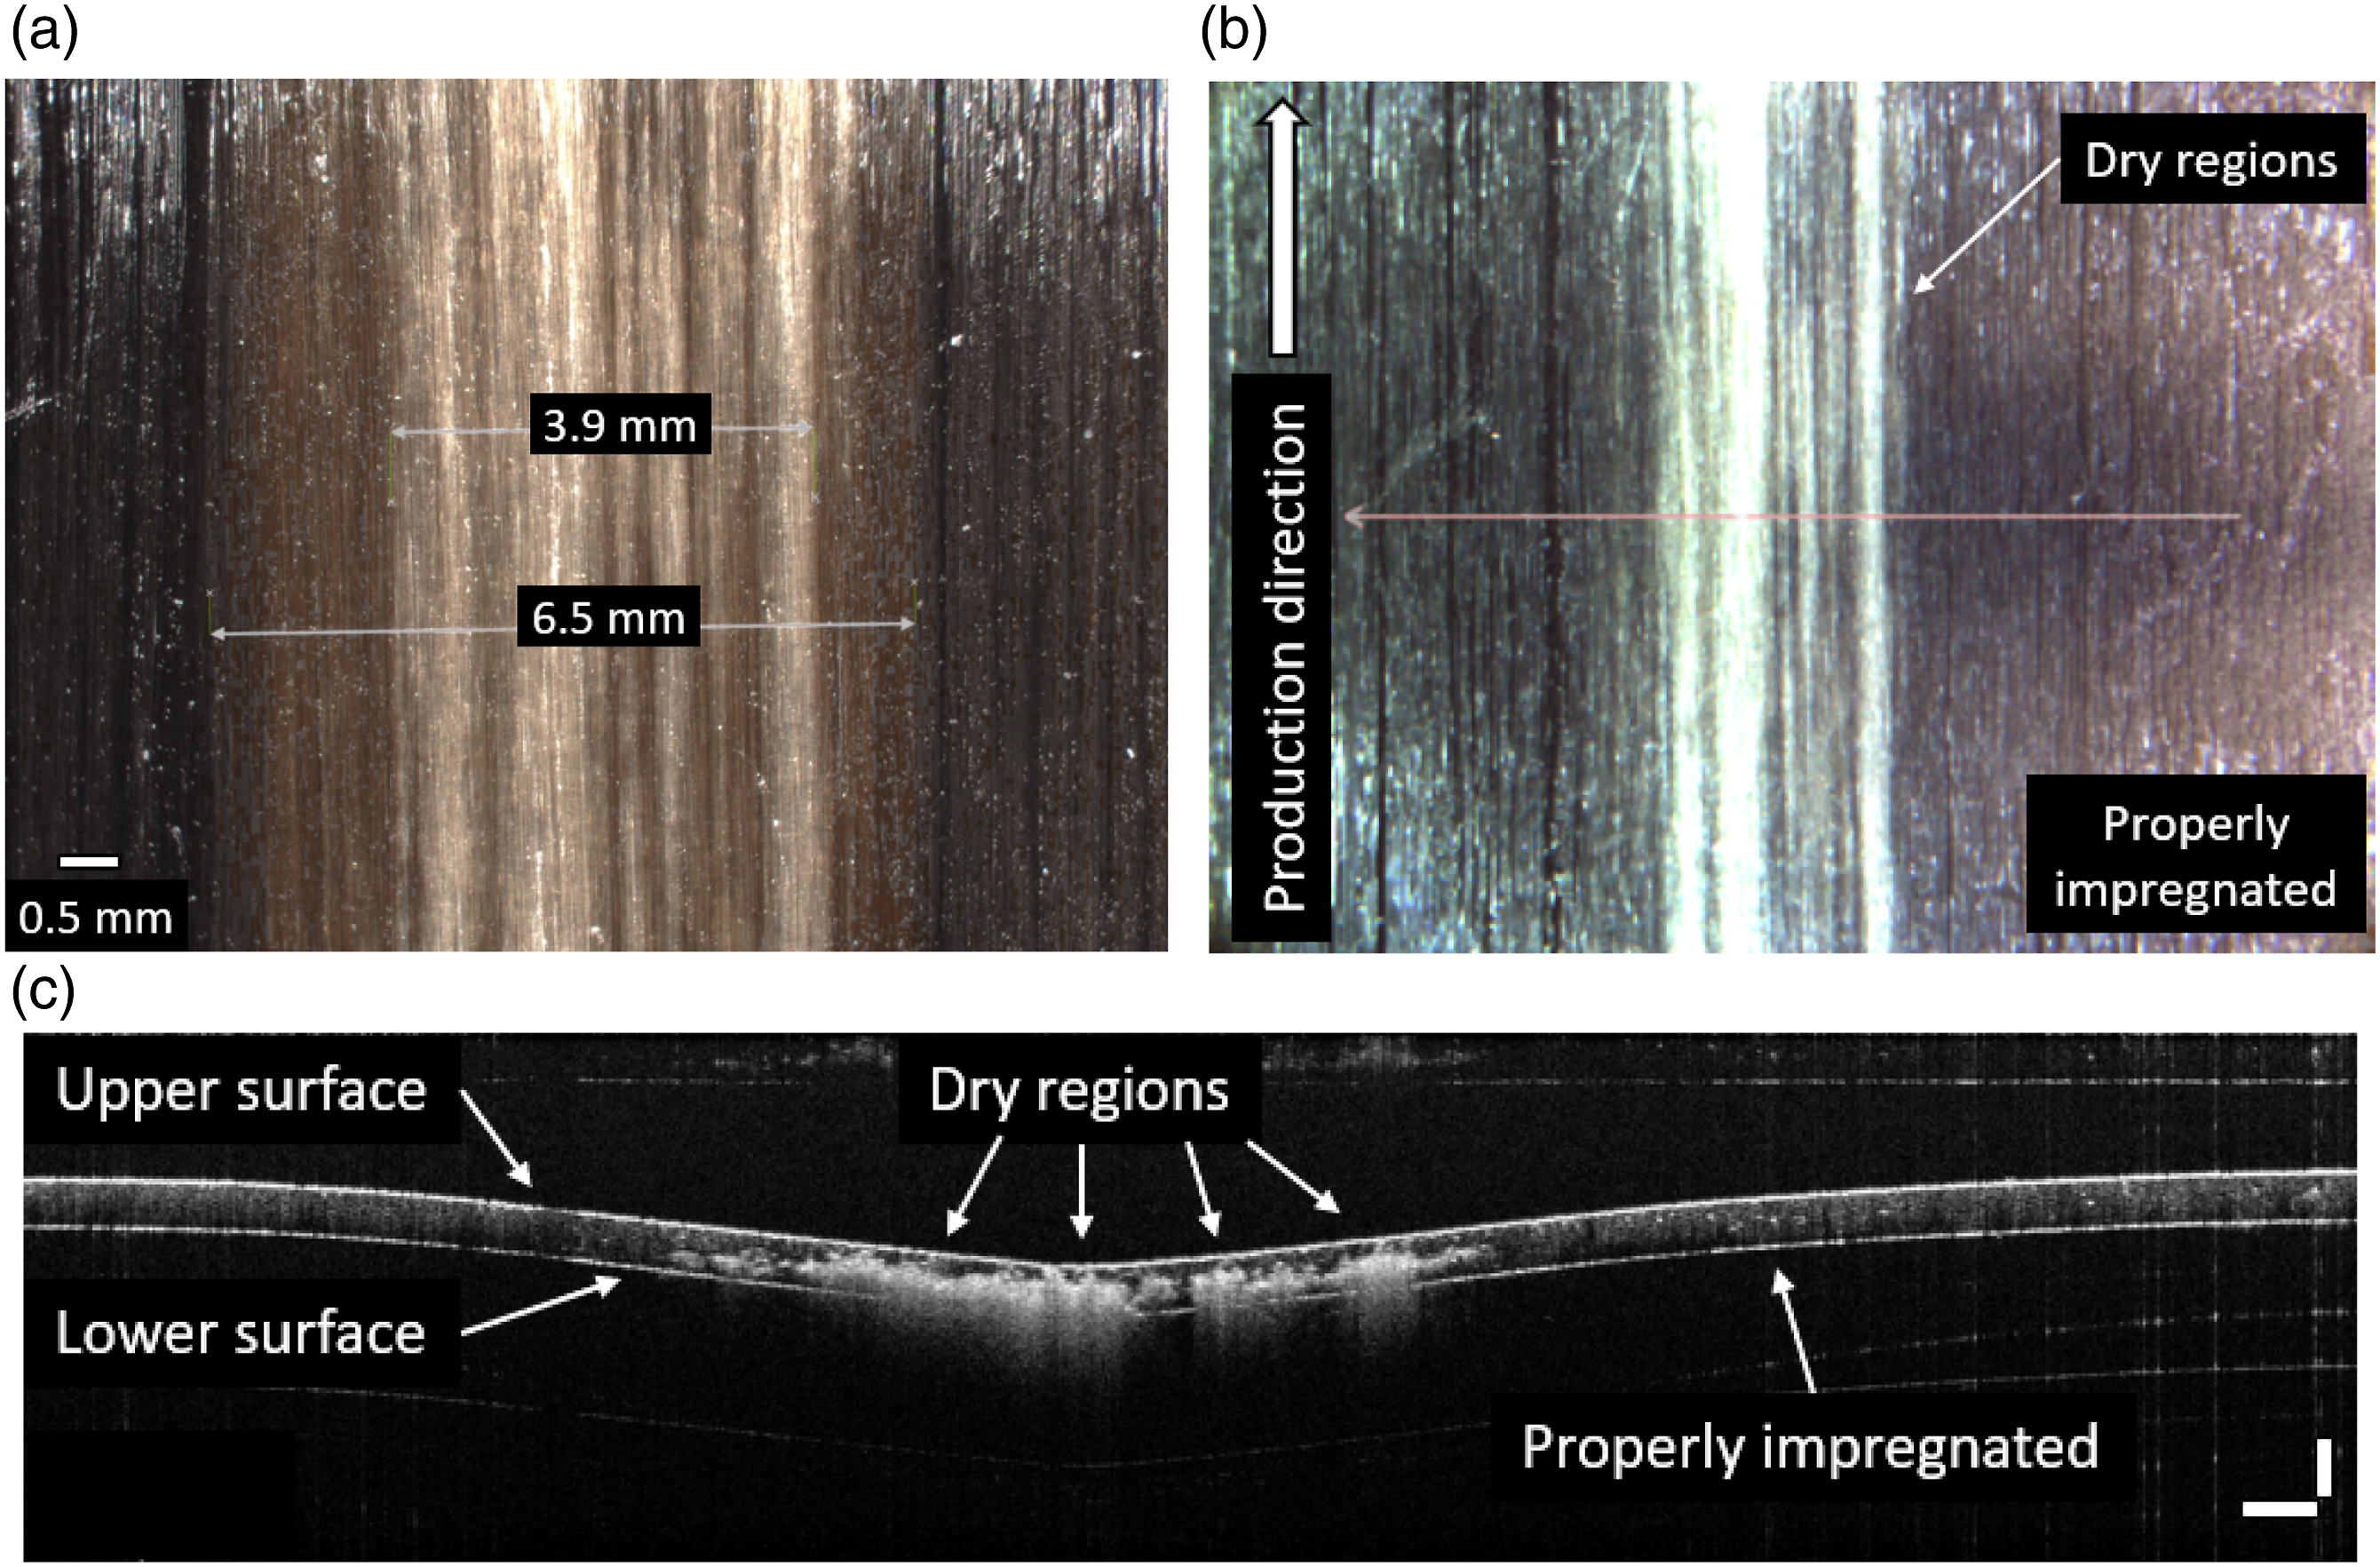
As shown in Figure 10(a) UD_1 was additionally embedded in orange-colored EP resin and polished for cross-sectional microscopic investigation. The orange color improves the contrast between UD tape and the naturally translucent resin. According to the micrograph, the total width of the dry region is approximately 5.37 mm. In the inner core a nearly unimpregnated region with a width of around 1.33 mm is present, clearly visible due to ingress of orange resin into the tape. Figure 10(b) shows the results of the OCT measurement with the sensor moving at a traversing speed of 50 mm/s. The two white vertical lines indicate the lateral expansion of the dry-fiber region with a total width of 5.39 mm in the Y direction. This is in very good agreement with the microscopic measurements. To aid interpretation, the aspect ratio of the OCT image was stretched in the Z direction. Cross-sectional micrograph of the dry region of UD_1 embedded in orange-colored EP resin (a). Optical coherence tomography B-scan taken with sensor moving at a travel speed of 50 mm/s (b). For better visibility, the aspect ratio of the image was modified. The two vertical white lines indicate the total defect width of 5.39 mm in the Y direction.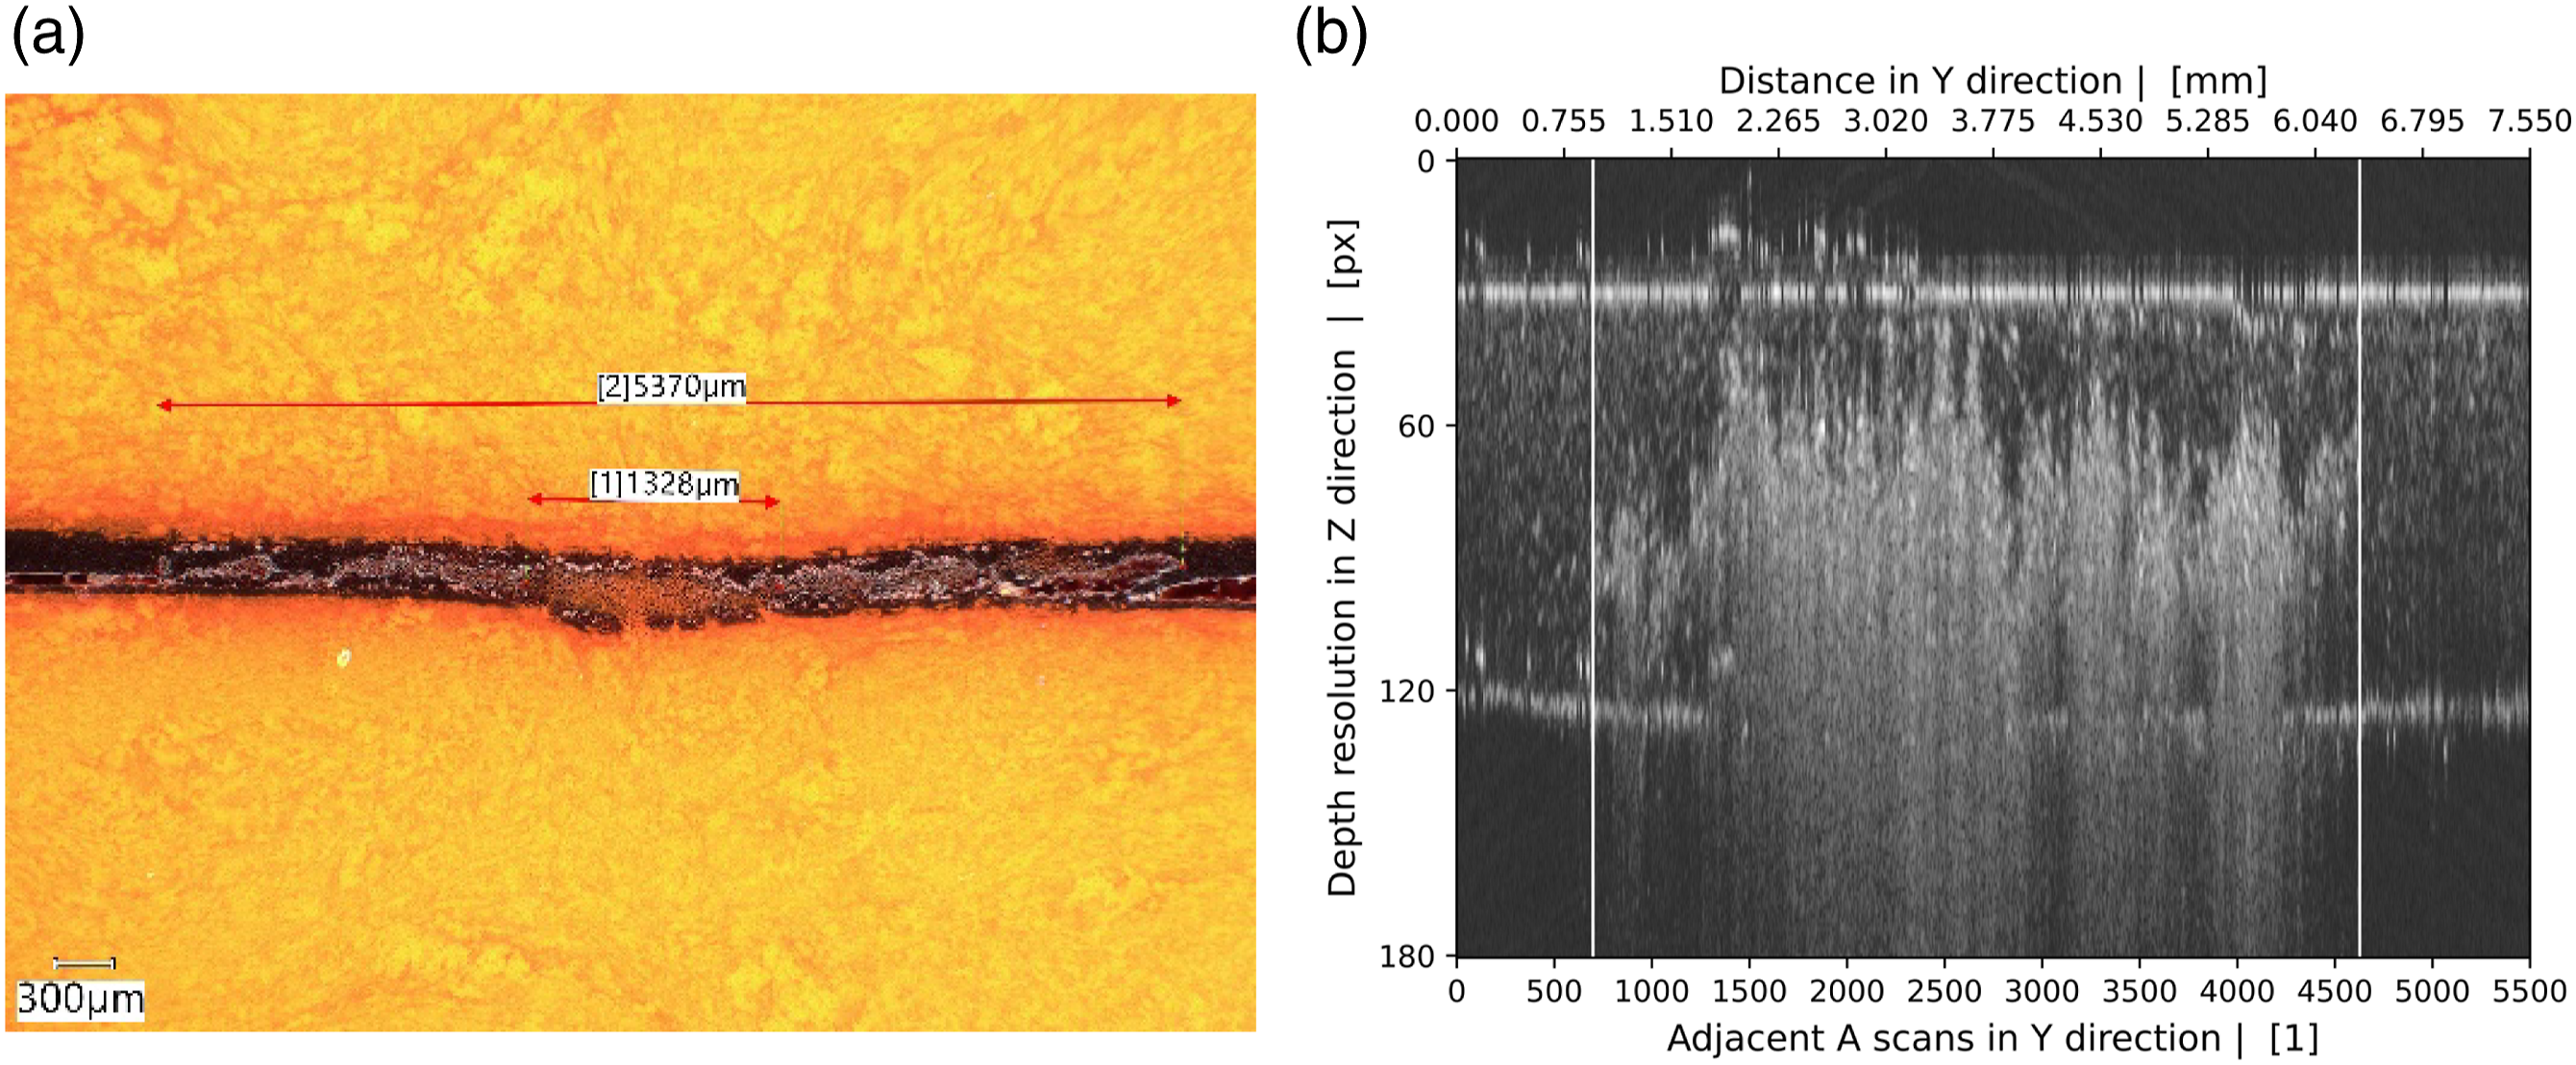
UD_1: Gap
Figure 11 presents the top view of an open gap in UD_1 and the resulting stationary OCT scan. The unfilled region has a width of 0.4 mm. The gap visible in the center of the picture arises from signal interruption due to an absence of material able to scatter the incoming coherent light. Open gaps therefore appear as black regions in the OCT image. Open gap of sample UD_1. (a) Top-view micrograph showing a gap with a total width of 0.4 mm (b) Image generated by the in-built camera of the OCT sensor, indicating the direction of measurement on the tape surface (arrow). (c) Visualization of the OCT measurement (B-scan) with stationary sensor, where the interrupted measurement signal indicates the gap. Scale bars: 0.5 mm (horizontal), 0.2 mm (vertical). OCT: Optical coherence tomography.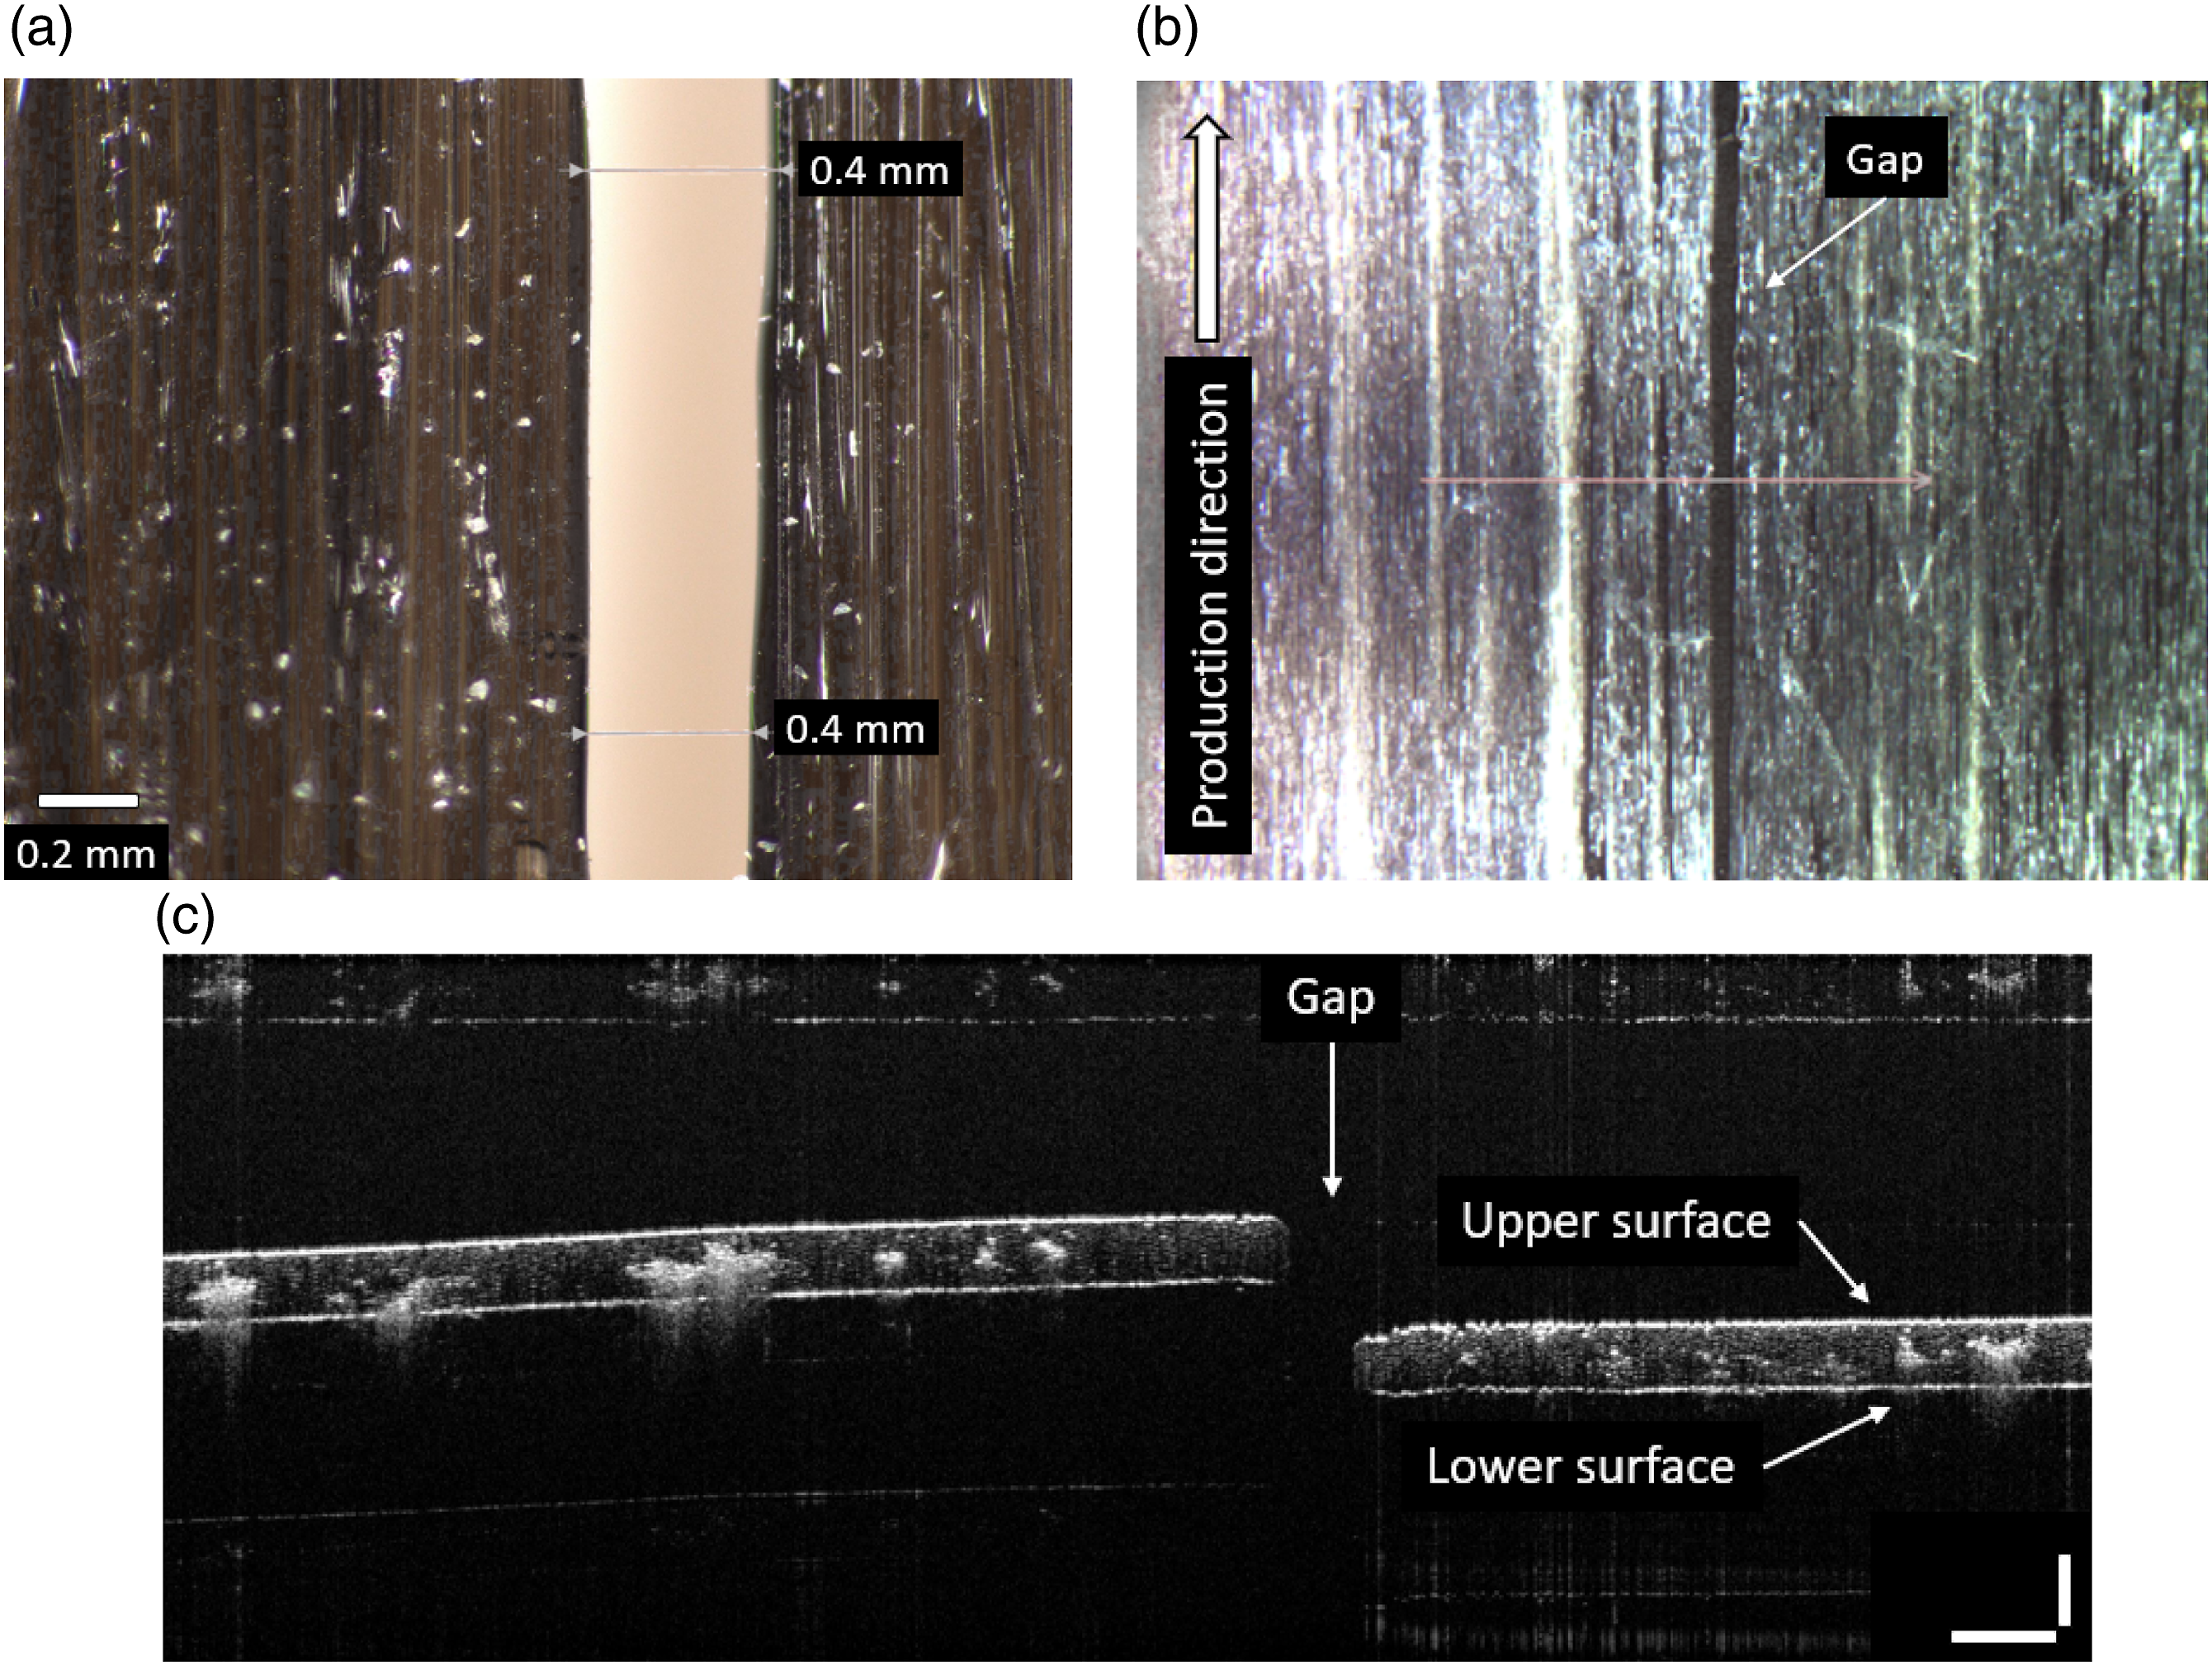
Figure 12 shows the results of an OCT measurement with a sensor moving at a speed of 50 mm/s. The total width of the gap of 0.42 mm in the Y direction perfectly matches the results of the microscopic measurements. Optical coherence tomography B-scan of UD_1 with sensor moving at a travel speed of 50 mm/s, showing the open gap. The two vertical lines indicate the total gap width of 0.42 mm in the Y direction.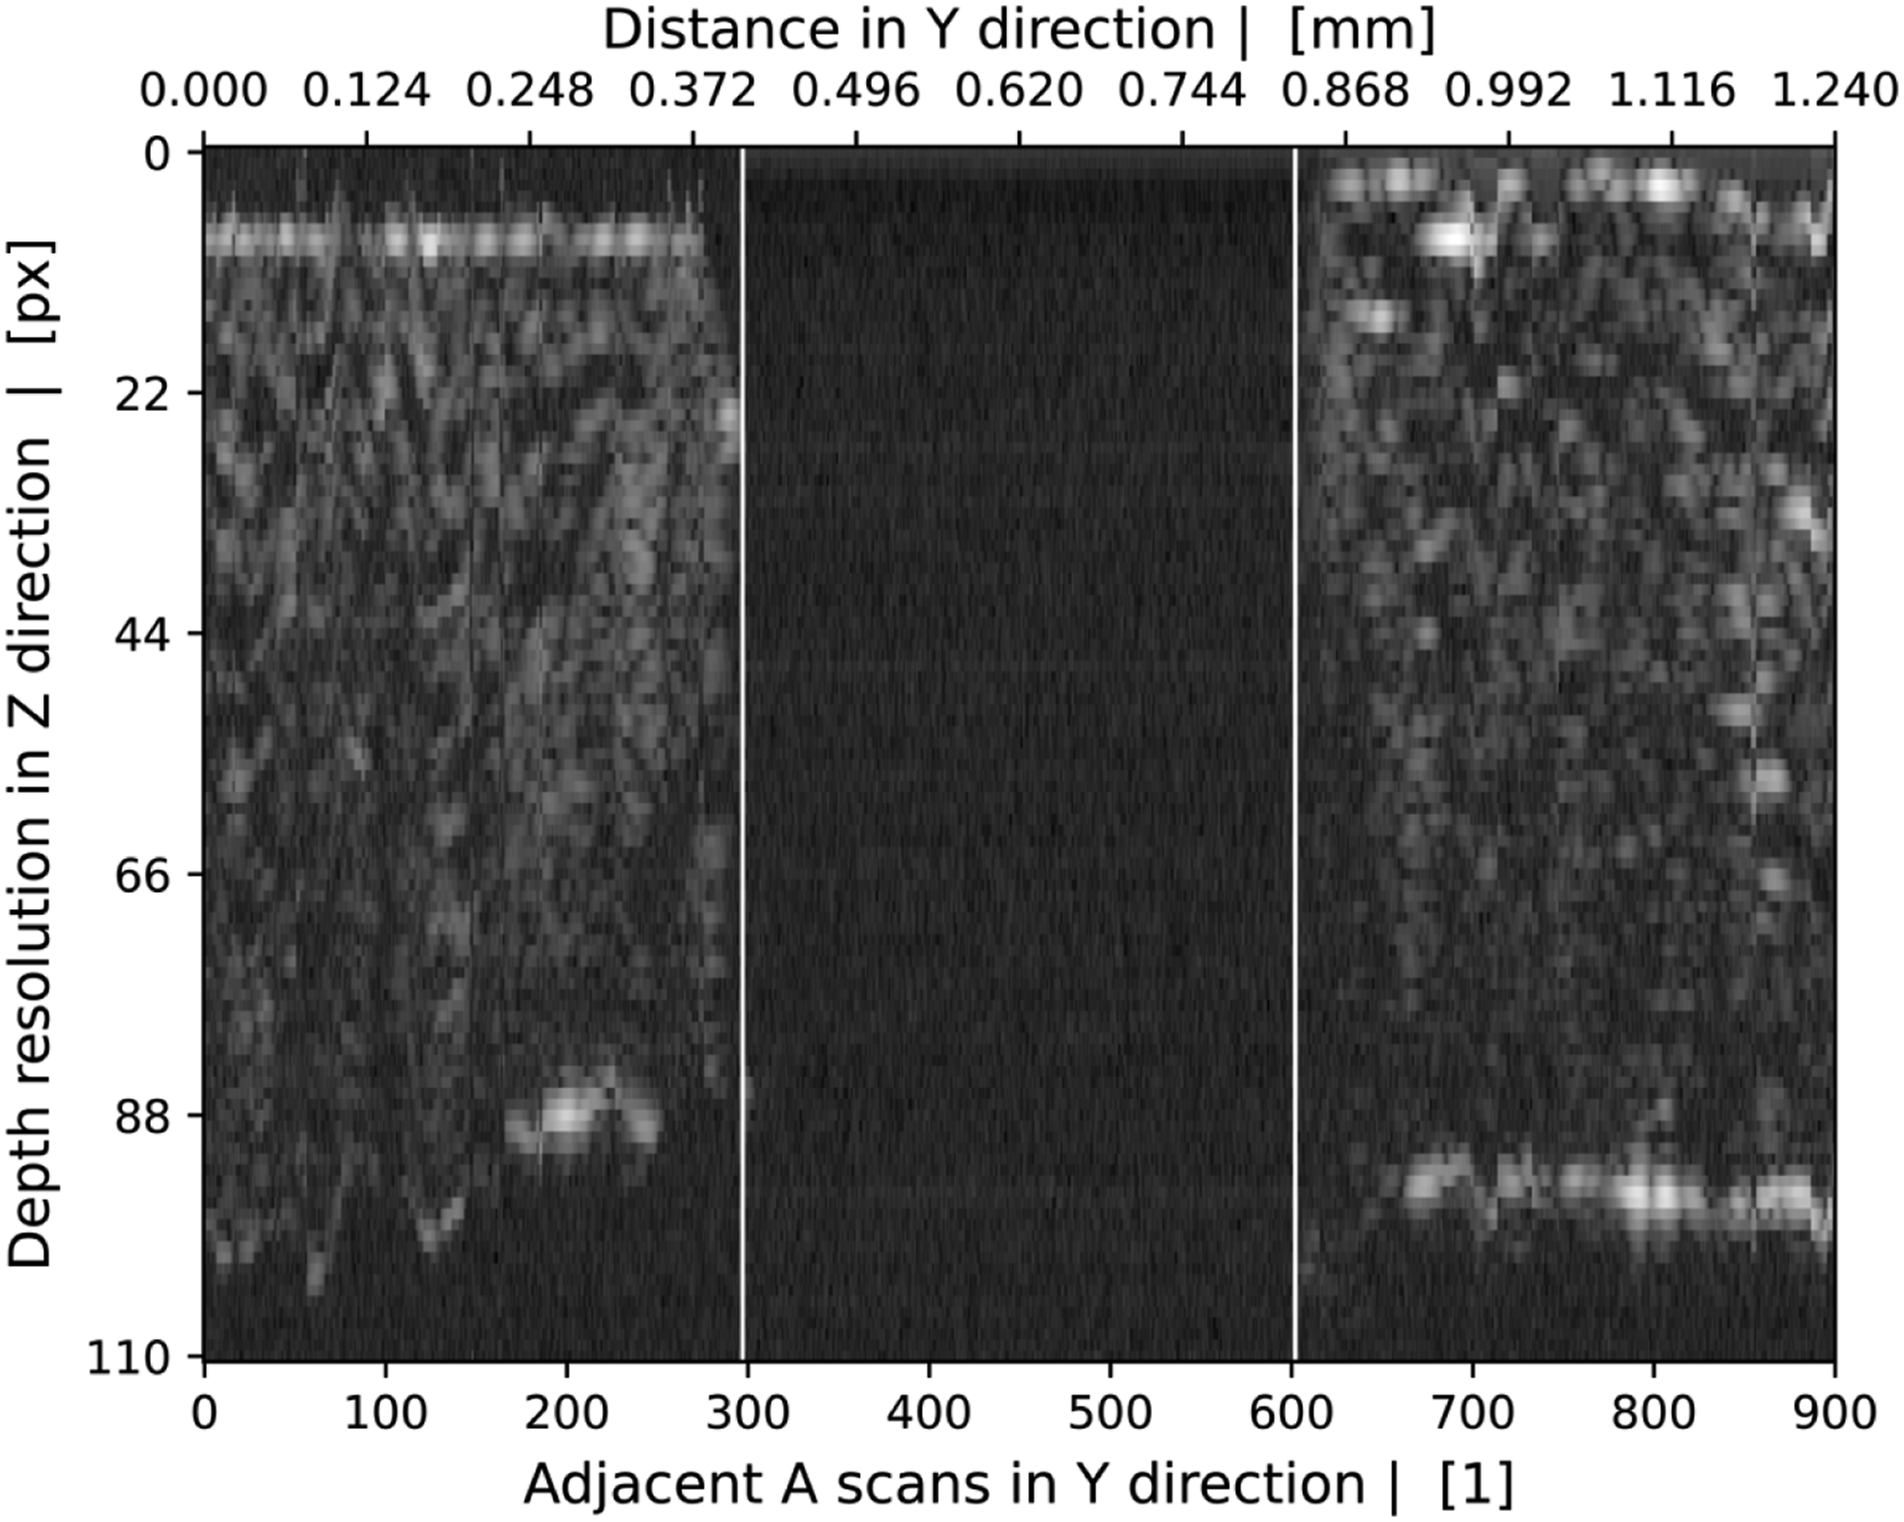
UD_2: Smooth & rough surface
Figure 13(a) shows the top view of a micrograph of sample UD_2. In the upper section the tape surface has been well polished during production and thus has a smooth and closed-surface finish. Below the smooth section, marked in red, a transition to a rough and interrupted surface – possibly an unfilled polishing gap – is visible. Figure 13(c) shows the B-scan immediately above the transition region. Except for small irregularities, the upper and lower surfaces are consistent, and tape thickness is homogeneous over the width. The same measurement was conducted below the transition zone, the B-scan of which is displayed in Figure 13(d), where the interrupted upper and lower tape surfaces are clearly visible. These regions exhibit great variations in tape thickness. Using such a tape in post-production processes such as tape laying or consolidation would possibly lead to high porosities in the tape stack and other critical flaws in the final product. Smooth surface of sample UD_2 (above the area marked in red). (a) Top-view micrograph with separation mark indicating the transition from smooth to rough surface. (b) Top-view image taken by the in-built camera of the OCT sensor, with the direction of measurement across the tape surface indicated (arrow) exemplary for the smooth section. (c) OCT B-scan with stationary sensor. Both upper and lower surface lines are perfectly closed, and thickness is constant. (d) B-scan of the rough region with interrupted tape surfaces and high variations in tape thickness. Scale bars: 0.5 mm (horizontal), 0.2 mm (vertical). OCT: Optical coherence tomography.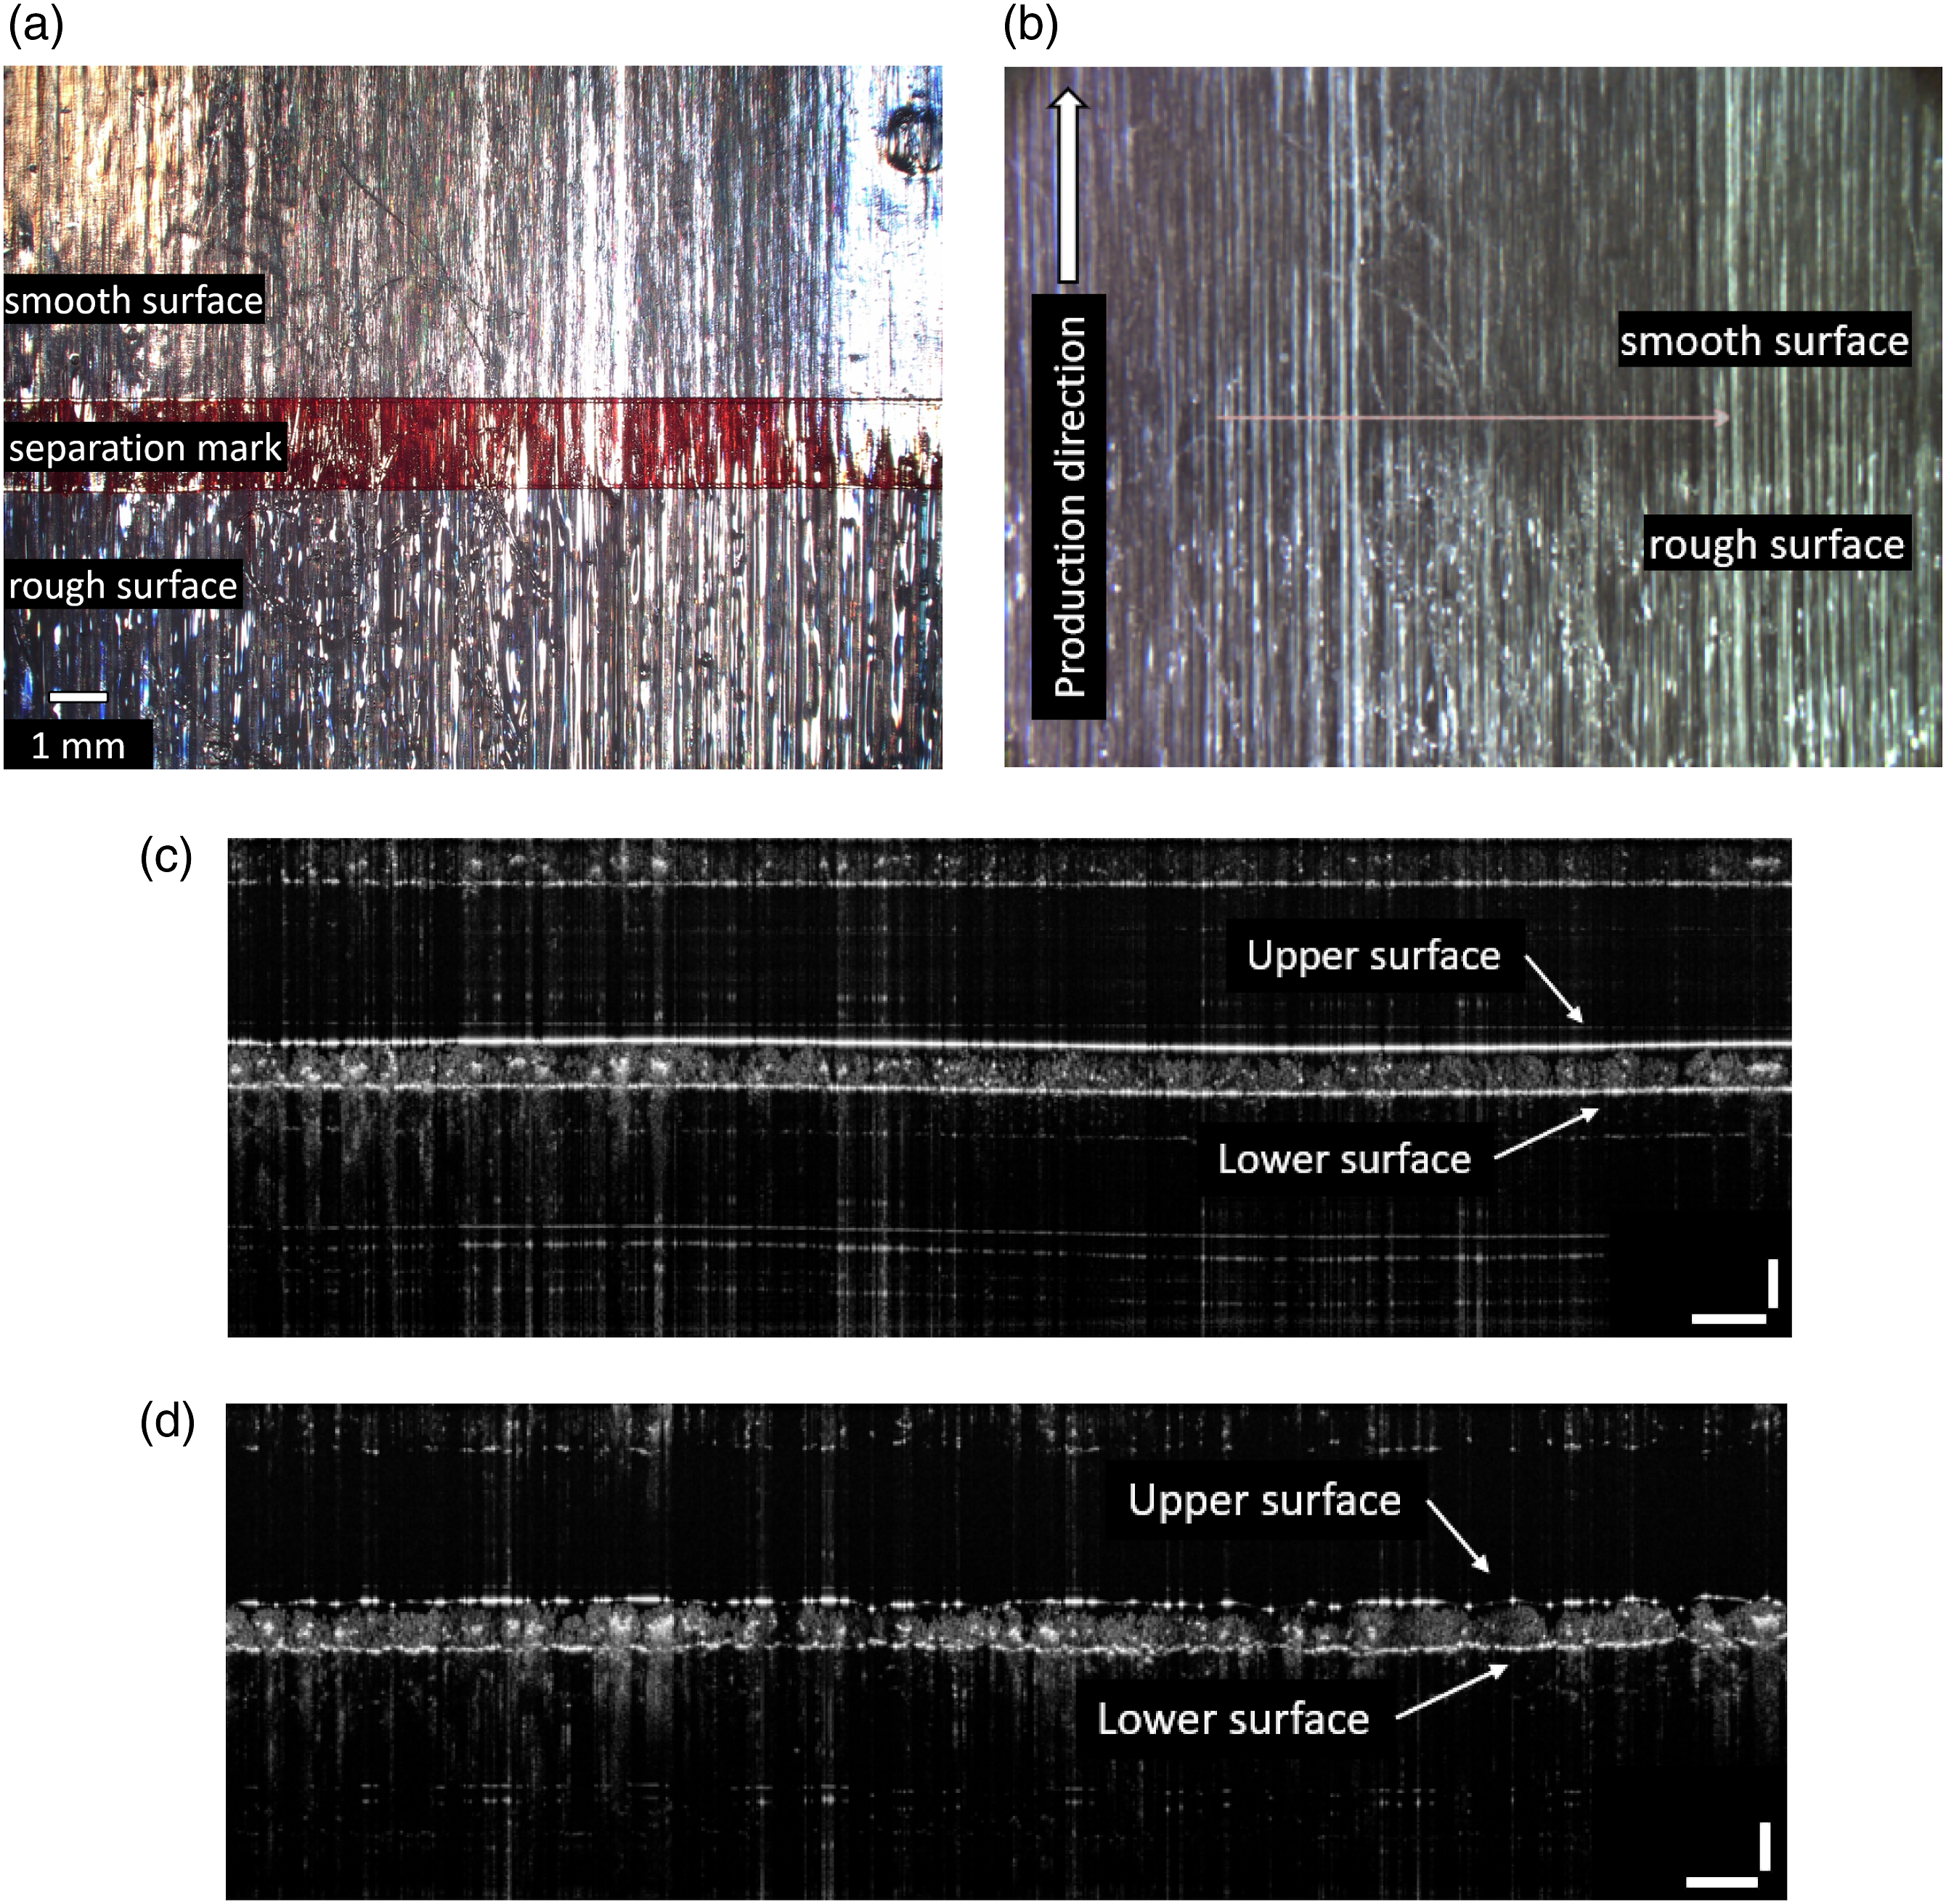
In Figure 14(a), UD_2 with smooth surface was measured by the OCT sensor moving at a traversing speed of 50 mm/s. Again, the closed tape interfaces can be identified. Figure 14(b) shows the B-scan of the rough section under the same conditions. As in the stationary measurements, thickness variations and interrupted surfaces can be detected. For better comparability neither B-scan was linearly normalized. Section from an optical coherence tomography B-scan of UD_2 with moving sensor at a travel speed of 50 mm/s, comparing a smooth surface (a) and rough surface (b).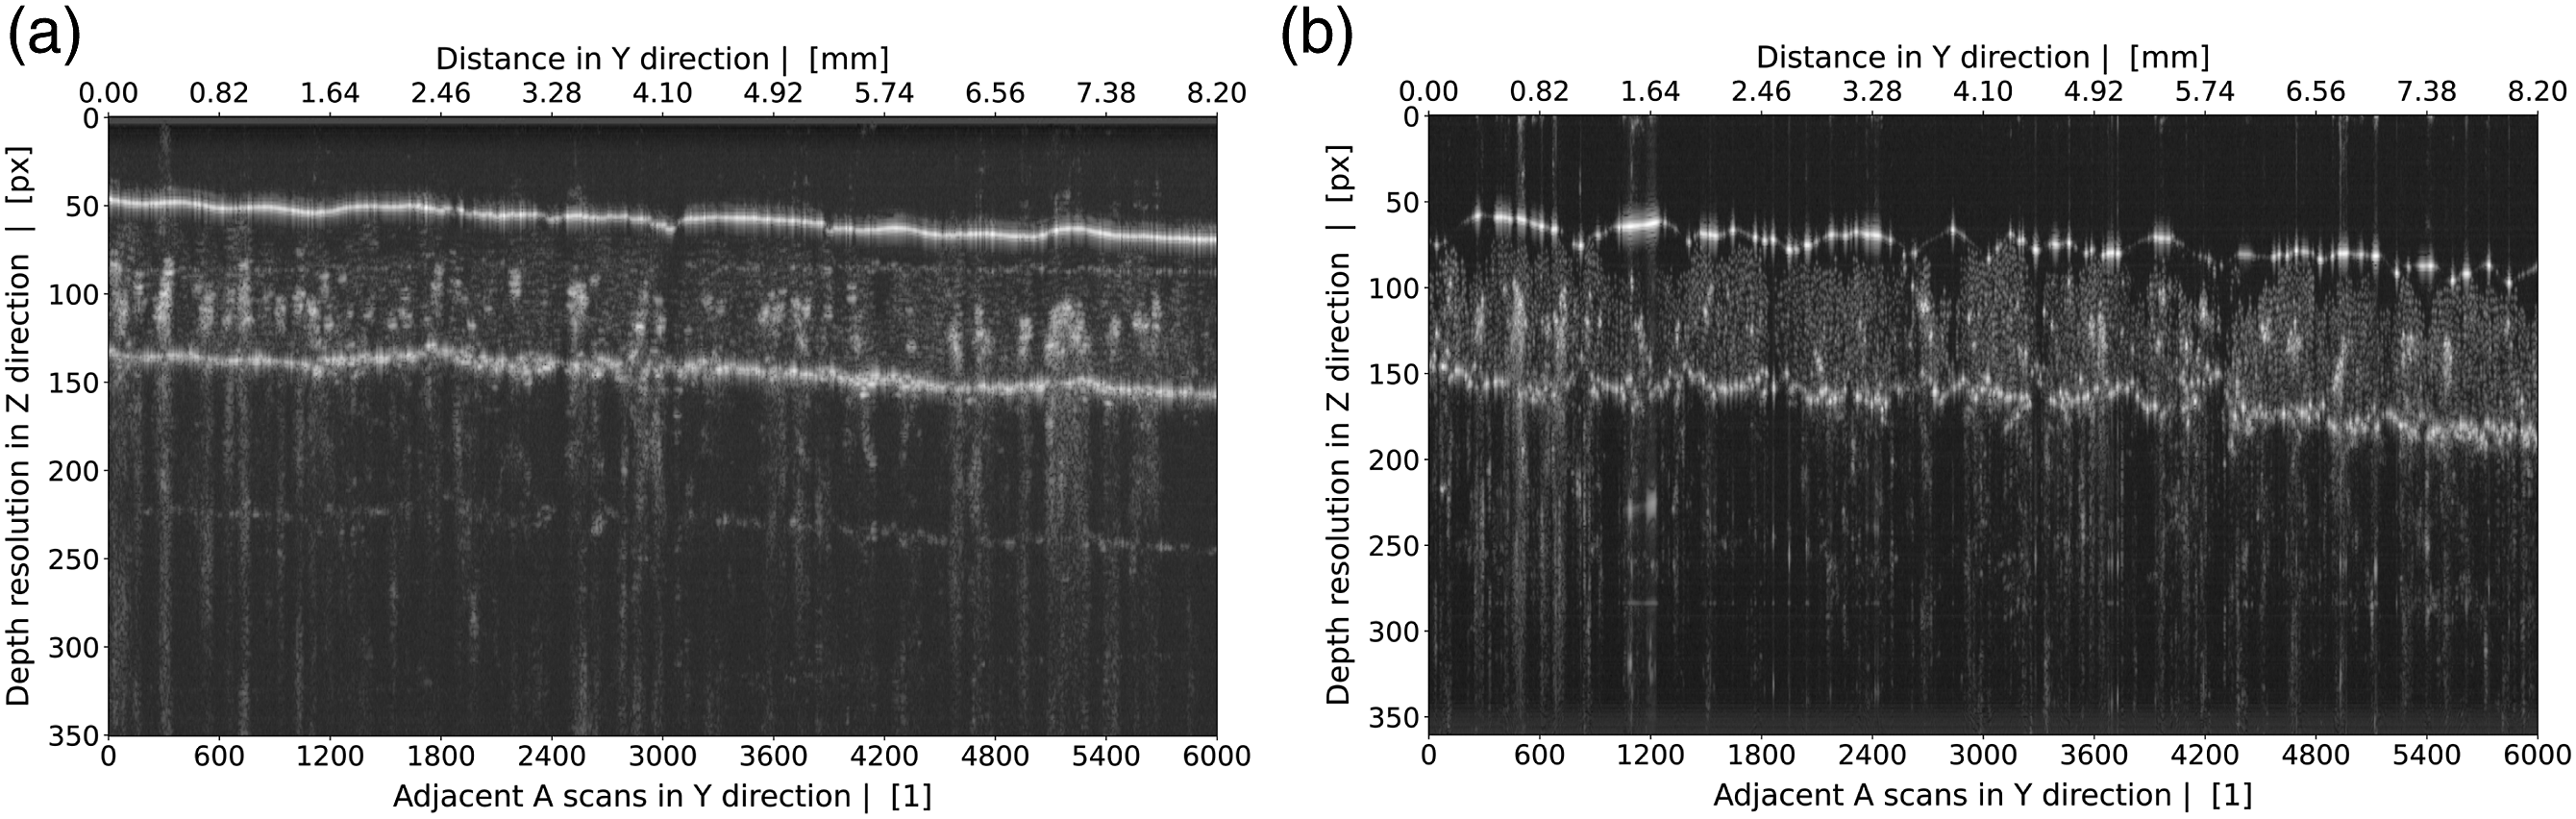
UD_3: Accumulation of polymer resin
In Figure 15(a), a top-view micrograph of UD_3 shows an accumulation of polymer resin followed by a region of fiber misalignment. Depending on the measurement position, the flaw has a transverse width between 4.2 and 4.9 mm. The polymer accumulation caused inhomogeneous fiber/matrix distribution in the production direction, and only after a distance of multiple centimeters was a homogeneous fiber carpet re-established and satisfactory impregnation quality achieved. The stationary OCT measurement with stationary sensor was conducted right below the accumulation spot, as visualized in Figure 15(b). The resulting B-scan in Figure 15(c) clearly indicates the irregular thickness distribution and also the interrupted upper and lower surfaces. Accumulation of polymer resin followed by an inhomogeneous fiber/matrix distribution in sample UD_3. (a) Top-view micrograph: depending on the measurement position, the defect has a total width of approximately 4.2–4.9 mm. (b) Image taken by the in-built camera of the OCT sensor, with the direction of measurement across the tape surface indicated (arrow). (c) B-scan from OCT measurement with stationary sensor. In the right half of the tape cross section, interrupted surfaces and inhomogeneous thickness distribution are clearly visible. Scale bars: 0.5 mm (horizontal), 0.2 mm (vertical). OCT: Optical coherence tomography.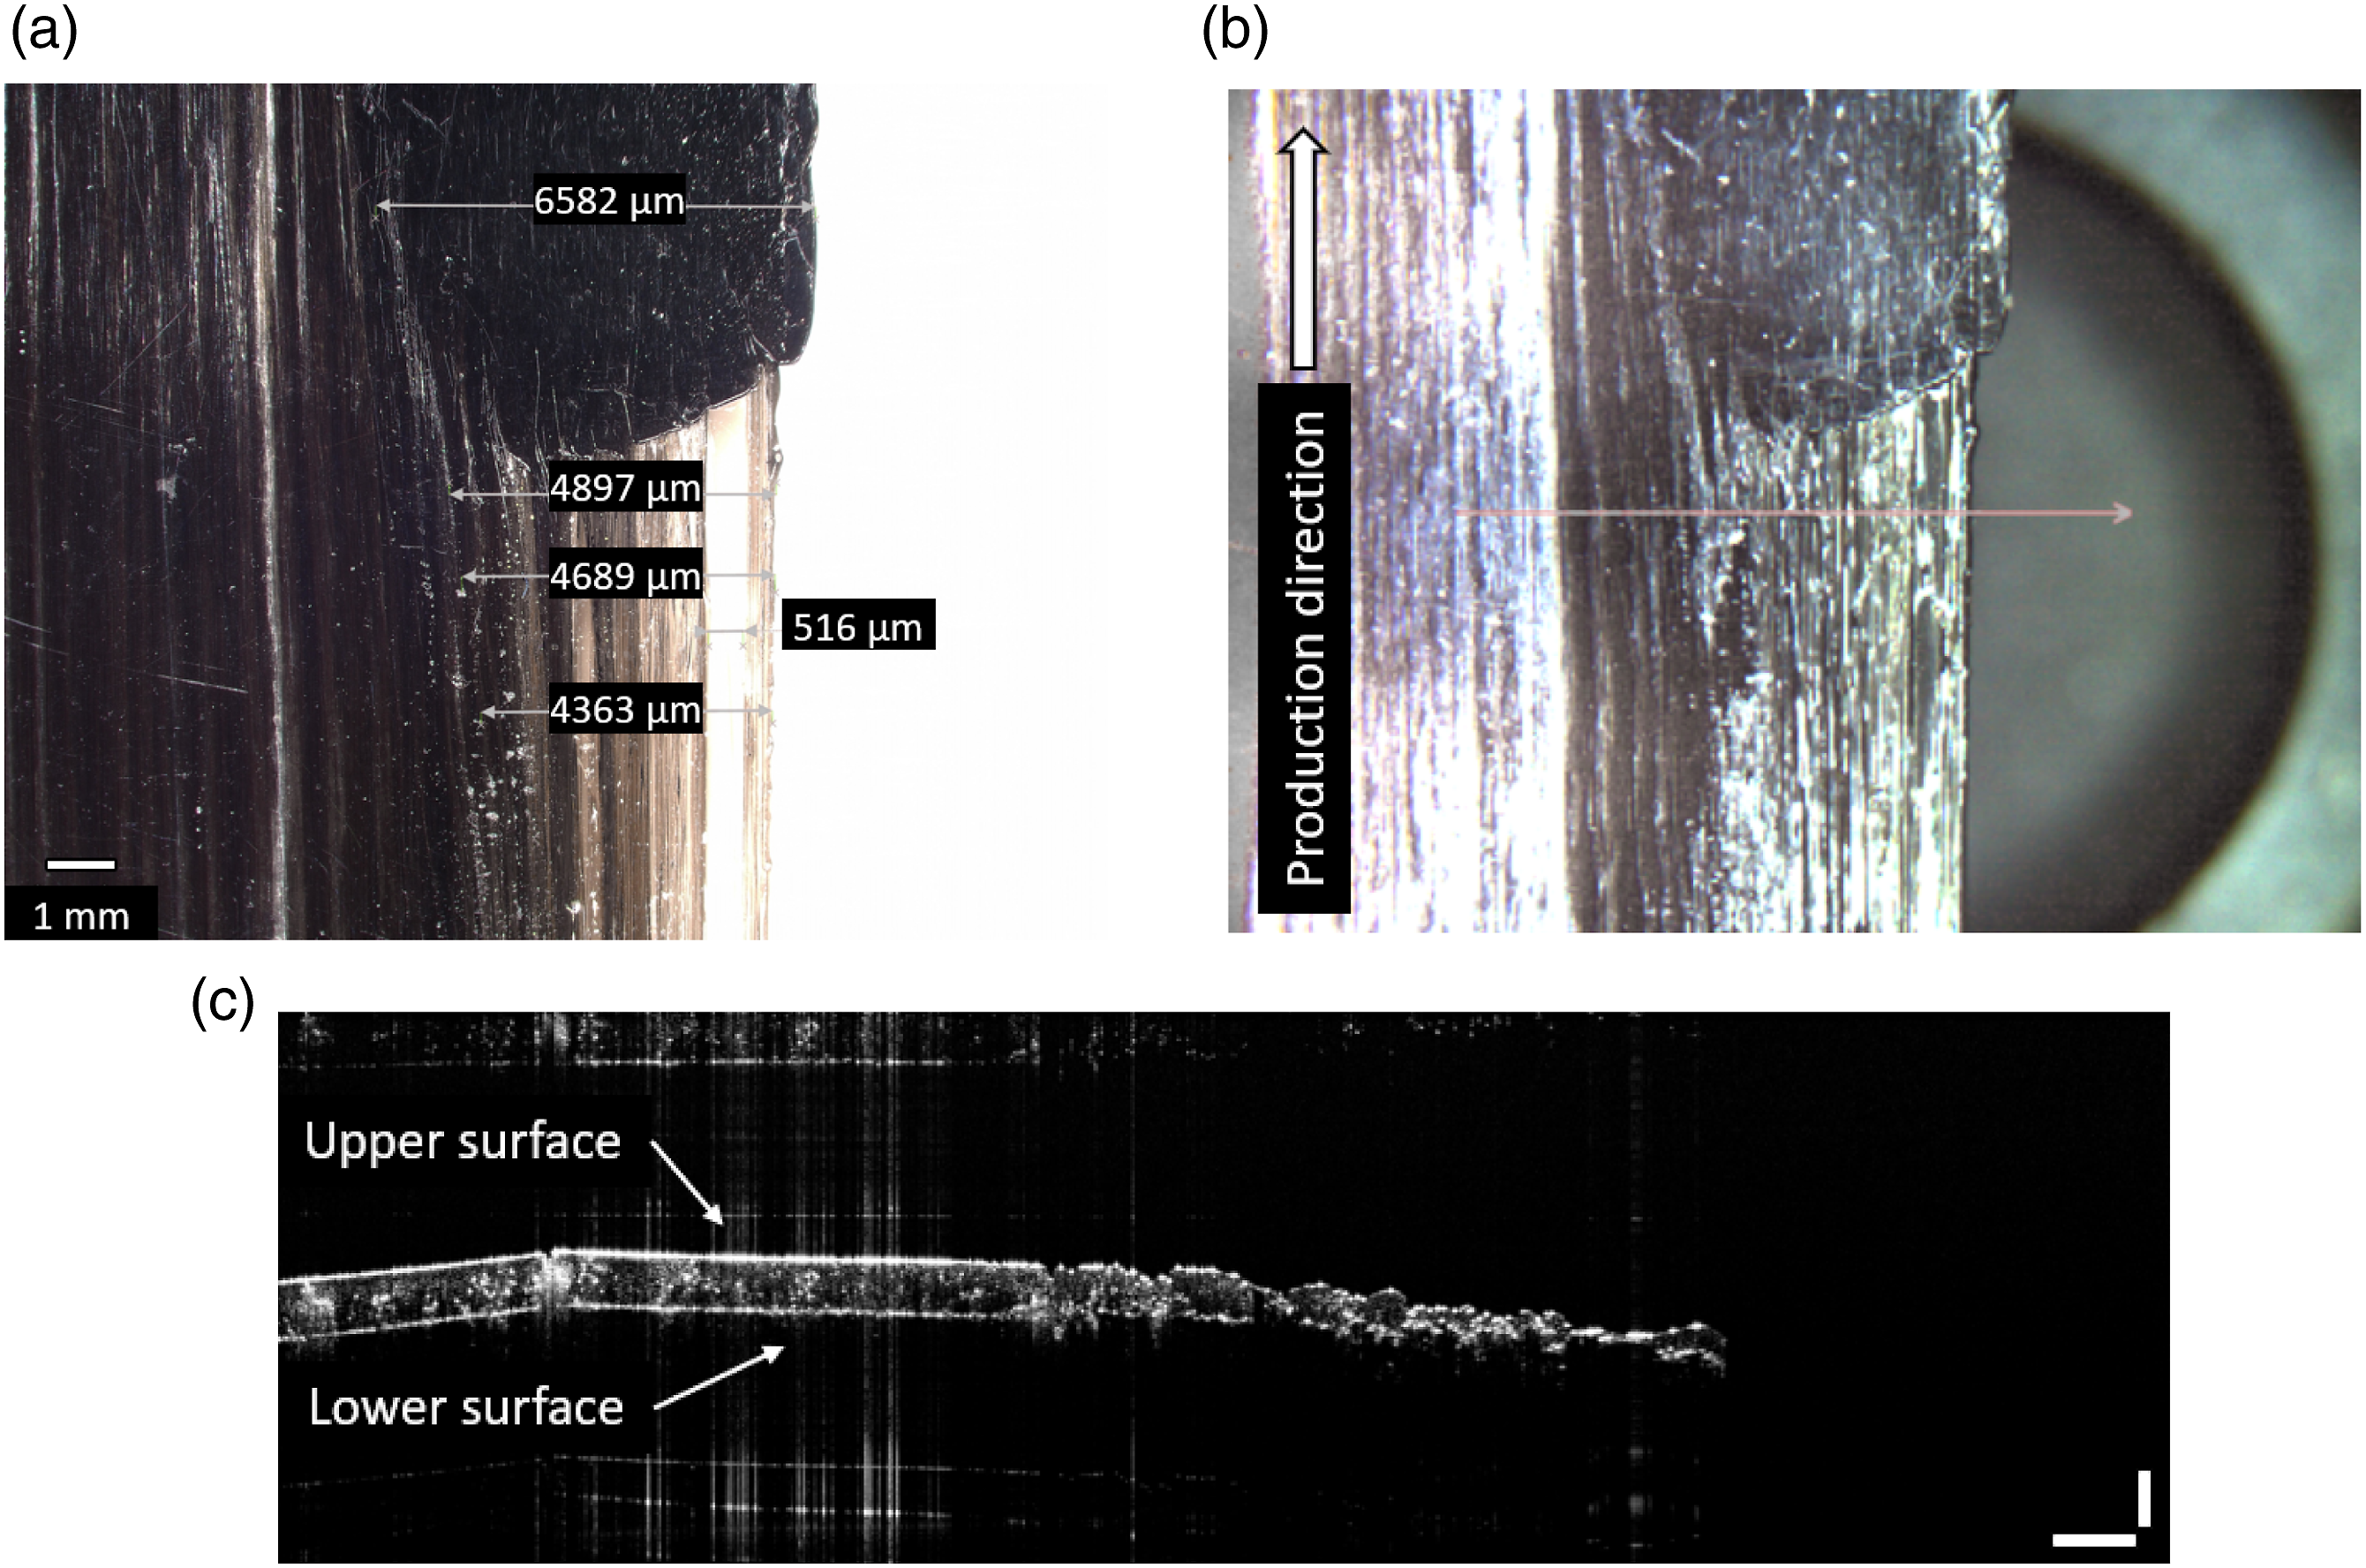
Figure 16 shows the measurements of UD_3 with OCT sensor moving at a travel speed of 50 mm/s. The total defect width of 4.55 mm is in very good agreement with the microscopic results. Optical coherence tomography B-scan of UD_3 with sensor moving at a travel speed of 50 mm/s, showing the irregular tape section after the polymer accumulation. The two vertical white lines indicate the total defect width of 4.55 mm in the Y direction.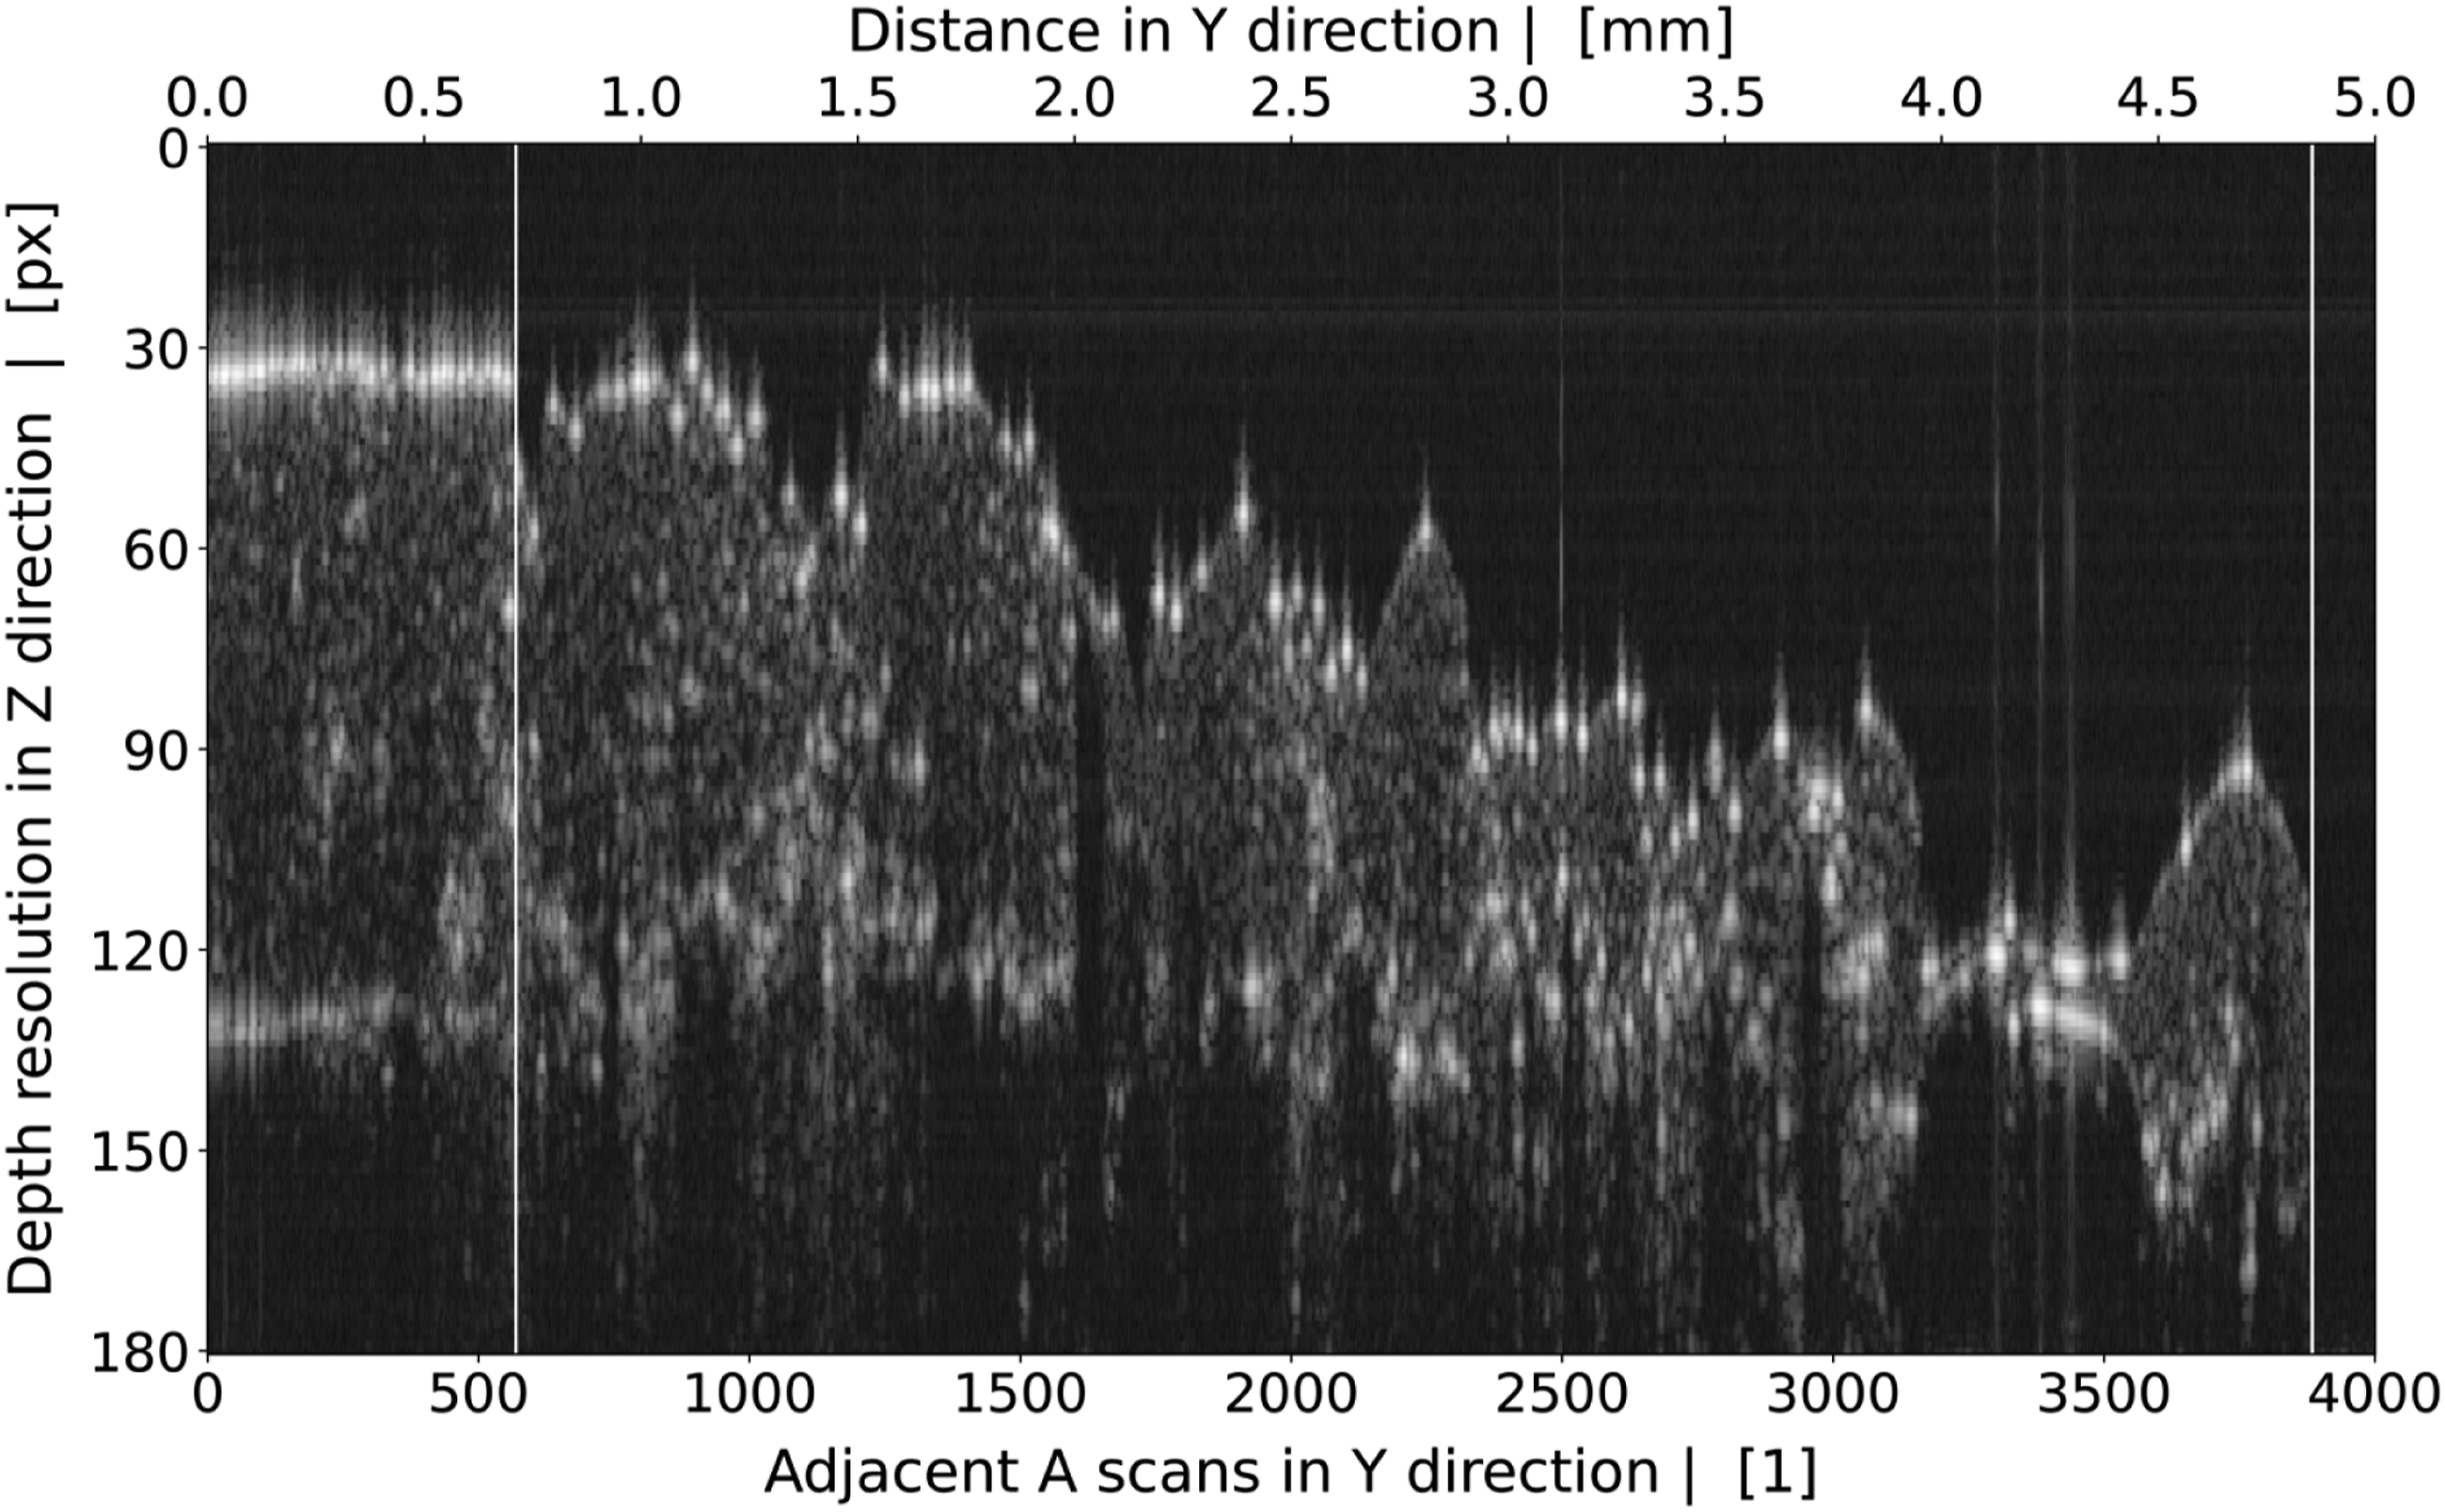
Influence of sensor traversing speed
UD_1: gap
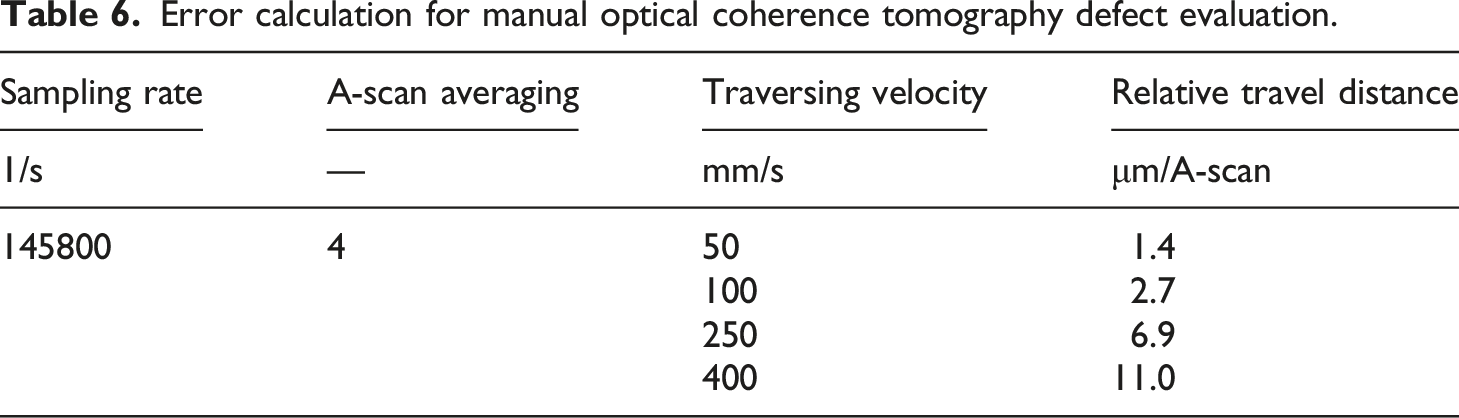
In addition to comparing OCT data obtained from stationary and moving sensor measurements with micrographs, another focus of this work was on the analysis of the influence of the sensor speed on measurement accuracy. Figure 17 compares OCT images of the open gap of UD_1 measured at four different travel speeds: 50, 100, 250 and 400 mm/s (see Table 5). There are slight variations in the normalization algorithm. For each travel speed the gap edges were identified by manual visual inspection of the postprocessed OCT measurements individually. Considering the sampling rate, A-scan averaging, and the resulting number of A-scans between the gap edges the total gap width can easily be calculated. It is worth mentioning that the manual selection of edge borders is error prone. Keeping sampling rate and A-scan averaging fixed, a lower travel speed leads to a higher lateral resolution and noise in the edge region, hence making a clear distinction more difficult. In Table 6 the relative travel distance, thus the potential error of a border shift by one single A-scan in relation to the test conditions was calculated. The open gap of UD_1 measured at various sensor traversing speeds. The calculated total gap widths (between the two vertical white lines) are: 0.42 mm (50 mm/s) (a), 0.38 mm (100 mm/s) (b), 0.40 mm (250 mm/s) (c), and 0.40 mm (400 mm/s) (d). Error calculation for manual optical coherence tomography defect evaluation.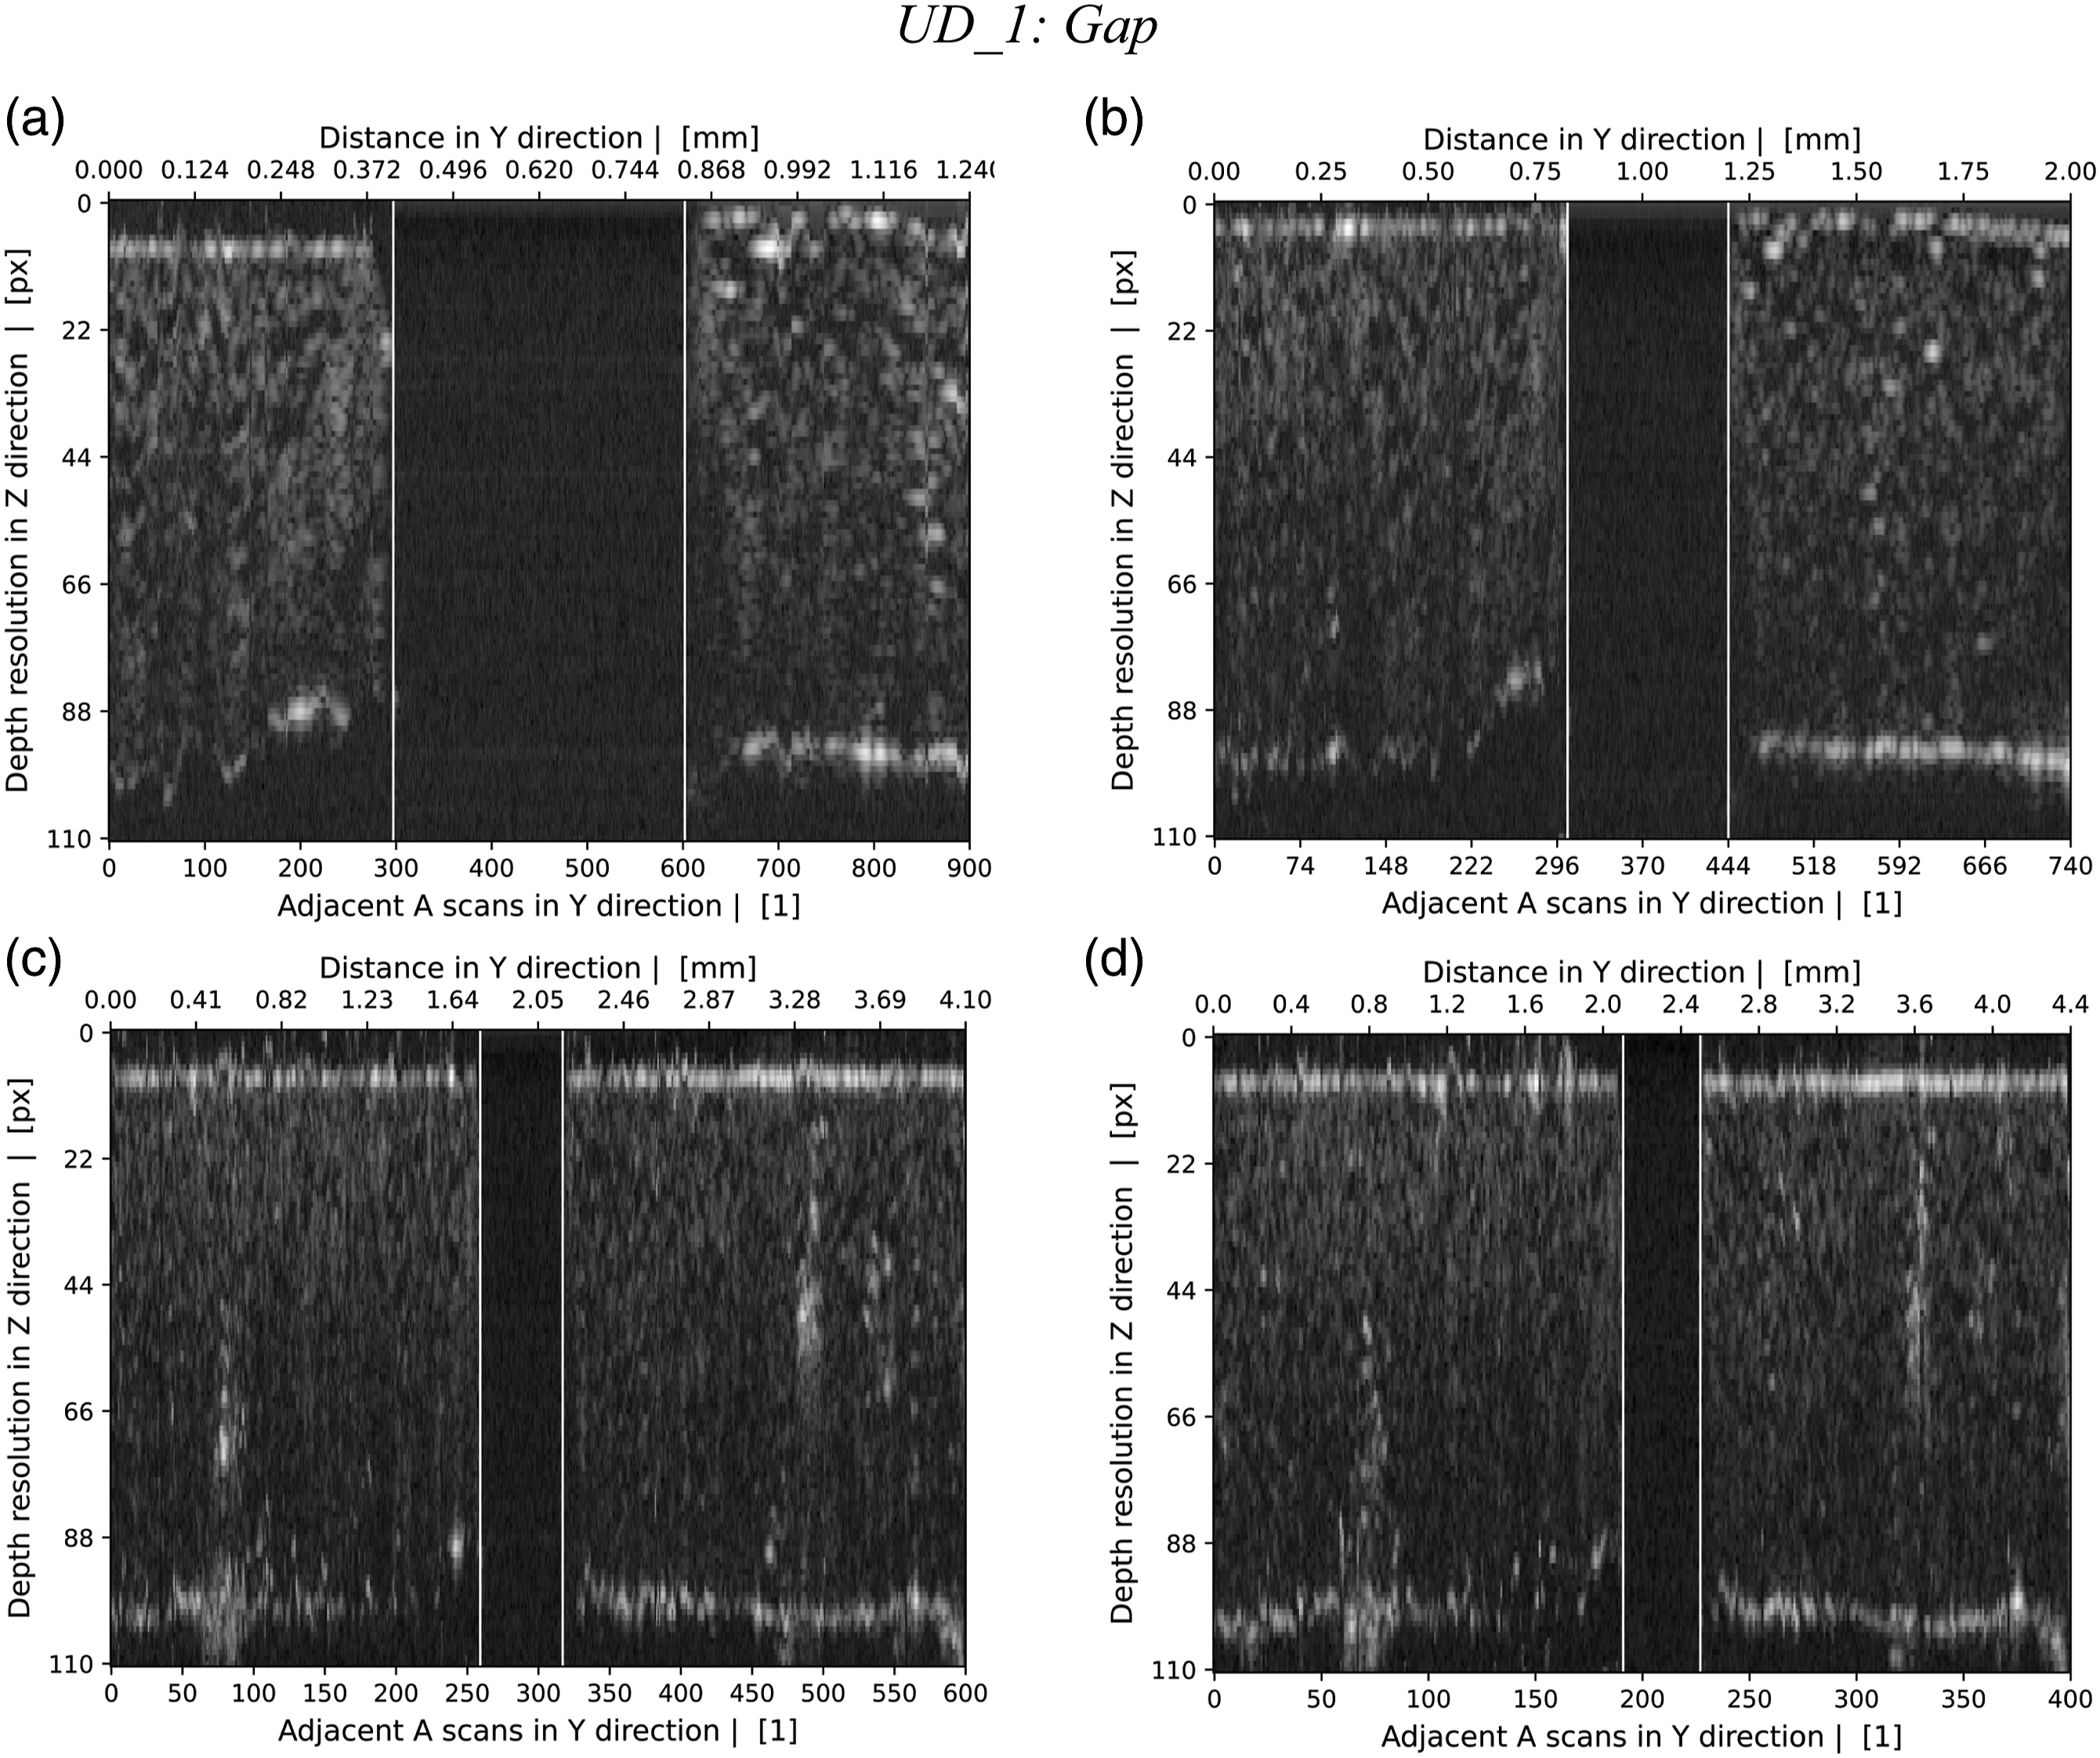
The resulting gap widths according to travel speeds, (1) 0.42 mm (50 mm/s), (2) 0.38 mm (100 mm/s), (3) 0.40 mm (250 mm/s), and (4) 0.40 mm (400 mm/s), accord very well with the gap width of 0.40 mm measured by (stationary) microscopy within ±5% deviation which was also measured manually. At higher travel velocities, no information loss was detectable in relation to defect width.
Because fewer A-scans are needed at higher velocities, the size of the raw data and consequently the computational capacities required for data evaluation can be reduced significantly, thereby improving inline performance.
Conclusion and outlook
We have successfully applied OCT to investigate several defects that typically occur in the production of thermoplastic unidirectional glass-fiber tapes. Defects included (1) dry-fiber regions, (2) unfilled gaps, (3) rough tape surfaces, and (4) polymer accumulations with fiber/polymer irregularities. OCT is capable of investigating surface defects and also bulk defects within the sample. A prerequisite is a suitable photoconductive sample material for light transmittance and scattering. By comparing our results to those of microscopic investigations, we have demonstrated that OCT is capable of providing the same information on optically visible defects (e.g., open gaps), but additionally provides insights into the cross-sectional condition of a tape (e.g., in dry-fiber regions) at high resolutions and sampling rates, which are in most cases impossible to realize non-destructively with other methods.
An important disadvantage of modern setups is the severely limited measurement window, typically in the lower mm2 range. The Thorlabs Telesto TEL321 has a maximum window size of 16 × 16 mm2 for 2D area scans. To overcome this, we developed a novel inline test rig and investigation procedure. Using a quasi-continuous approach, by moving the OCT sensor head transverse relative to the fiber direction, measurements across the entire tape width were conducted.
From experiments with moving sensor we learn that a well and uniformly tensioned tape is essential to: (1) avoid slippage between the rollers and the tape, (2) avoid a relative transverse movement of the tape towards one end of the rollers, (3) minimize variations in working distance between OCT lens and tape surface, (4) minimize vibrations caused by a loose tape, and to (5) flatten out curved tape surfaces or edges.
The lateral dimensions of the dry regions, gaps and fiber irregularities measured at 50 mm/s sensor traveling speed were in very good agreement with measurements results based on a stationary sensor. Another test series investigated the tape sample UD_1 with a prominent empty gap at various sensor speeds ranging from 50 to 400 mm/s. Although the manual visual inspection and defect edge definition is error prone, no significant deviation of the calculated gap widths in relation to the width determined stationary by micrograph was detected within the entire tested speed range (0.4 mm ± 5%). This provides an additional rationale for using higher measurement speeds, as they have several advantages: (1) shorter measurement repetition time and therefore little information loss between consecutive measurements, (2) smaller measurement data, and (3) faster and cheaper data evaluation. Though at higher movement speeds mechanical vibration manifested as variations in working distance between sensor lens and tape surface, smart contour detection and normalization algorithm can handle these variations easily.
A drawback of this measurement approach is a degree of information loss between consecutive measurements which depends on the velocity ratios between tape and sensor, and which must be considered.
A combination of OCT and, for instance, a camera-based quality assurance system coupled with a smart defect/quality evaluation algorithm is a promising novel inline measurement approach in the production of thermoplastic glass-fiber reinforced UD tapes.
Footnotes
Funding
The author(s) disclosed receipt of the following financial support for the research, authorship, and/or publication of this article: This work was supported by the Österreichische Forschungsförderungsgesellschaft (COMET - Competence Centers for Excellent Technologies).