
Abstract
This work presents the experimental determination of fracture mechanics parameters of composite specimens manufactured by fused filament fabrication (FFF) with continuous carbon fiber reinforced thermoplastic filaments, based on Linear Elastic Fracture Mechanics (LEFM). The critical mode I translaminar fracture toughness (KIc) and the critical energy release rate (GIc) are found for unidirectional and cross-ply laminates. The specimens were submitted to quasi-static tensile testing. Digital Image Correlation (DIC) is used to find the stress field. The stress fields around the crack tip are compared to linear elastic finite element simulations. The results demonstrate the magnitude of fracture toughness is in the same range as for polymers and some metals, depending on lay-up configuration. Besides, fractographic analyses show some typical features as river lines, fiber impression, fiber pulls-out and porosity aspects.
Keywords
Introduction
Composites are in the state-of-the-art of the concept of the material with high performance and low weight for structural purposes. Because of their applicability and a good ratio between strength and weight, researches about these materials are on continuous progress. Composites have been implemented in several applications since the early 1960s, such as aerospace, naval and automotive industries.
Besides, innovative manufacturing solutions have been studied to improve and expand the use of composite materials in automated manufacturing, to obtain minimum material waste during production and simplicity for product customization. Examples are AFP (automated fiber placement)1,2 and ATL (automated tape laying)2,3 which are well established as a solution for the automated manufacturing of composites. Moreover, additive manufacturing by FFF (fused filament fabrication) has been recently explored, with some examples in the literature4,5 and a commercial 3D printer for continuous carbon fiber composites are already at the market, by the company Markforged®. The ISO/ASTM 52900 6 describes additive manufacturing as the process of joining materials to make parts from 3D model data, usually layer upon layer, as opposed to subtractive and formative manufacturing methodologies.
The FFF is essentially the same technology as the FDM (fused deposition modeling), a trademark registered by Stratasys®. FFF is an additive manufacturing process where a printer deposits a melted material from a plastic filament using a moving head. The material is heated up to a temperature slightly higher than its melting point within the head and then extruded through a nozzle onto a bed, solidifying in order to form layers.7,8 Although its relative simplicity, there are interests in applying the FFF in many engineering fields such as sports items as tennis rackets, 9 unmanned aerial vehicles (UAVs), 10 prosthesis in general11,12 and aerospace trim tool. 13 The FFF was originally developed for use with thermoplastic materials. Some of these common thermoplastics applications are Acrylonitrile Butadiene Styrene (ABS), Polylactic Acid (PLA), Polycarbonate (PC), Polyamide (PA) and Polystyrene (PS) among others. However, it has been evolving to process composite materials made of thermoplastics and stiff fibers.14–25 There are plenty of continuous fiber thermoplastic composites that can be produced with the FFF process, like Kevlar, carbon fiber and glass fiber. This represents great advantages since structures made of these composites can be modelled for custom applications, lower production time and no need for specific further tooling after printing when compared to some traditional composite manufacturing. Besides, a thermoplastic composite can be recycled and the fiber direction customized accordingly to the application. One of the big challenges for this kind of composite manufacturing is the limitation of matrix and fiber types used. During this process, a filament of continuous carbon fibers embedded in nylon thermoplastic is deposited onto a printing bed, forming material layers which consolidate altogether, 26 producing a thermoplastic carbon fiber composite.
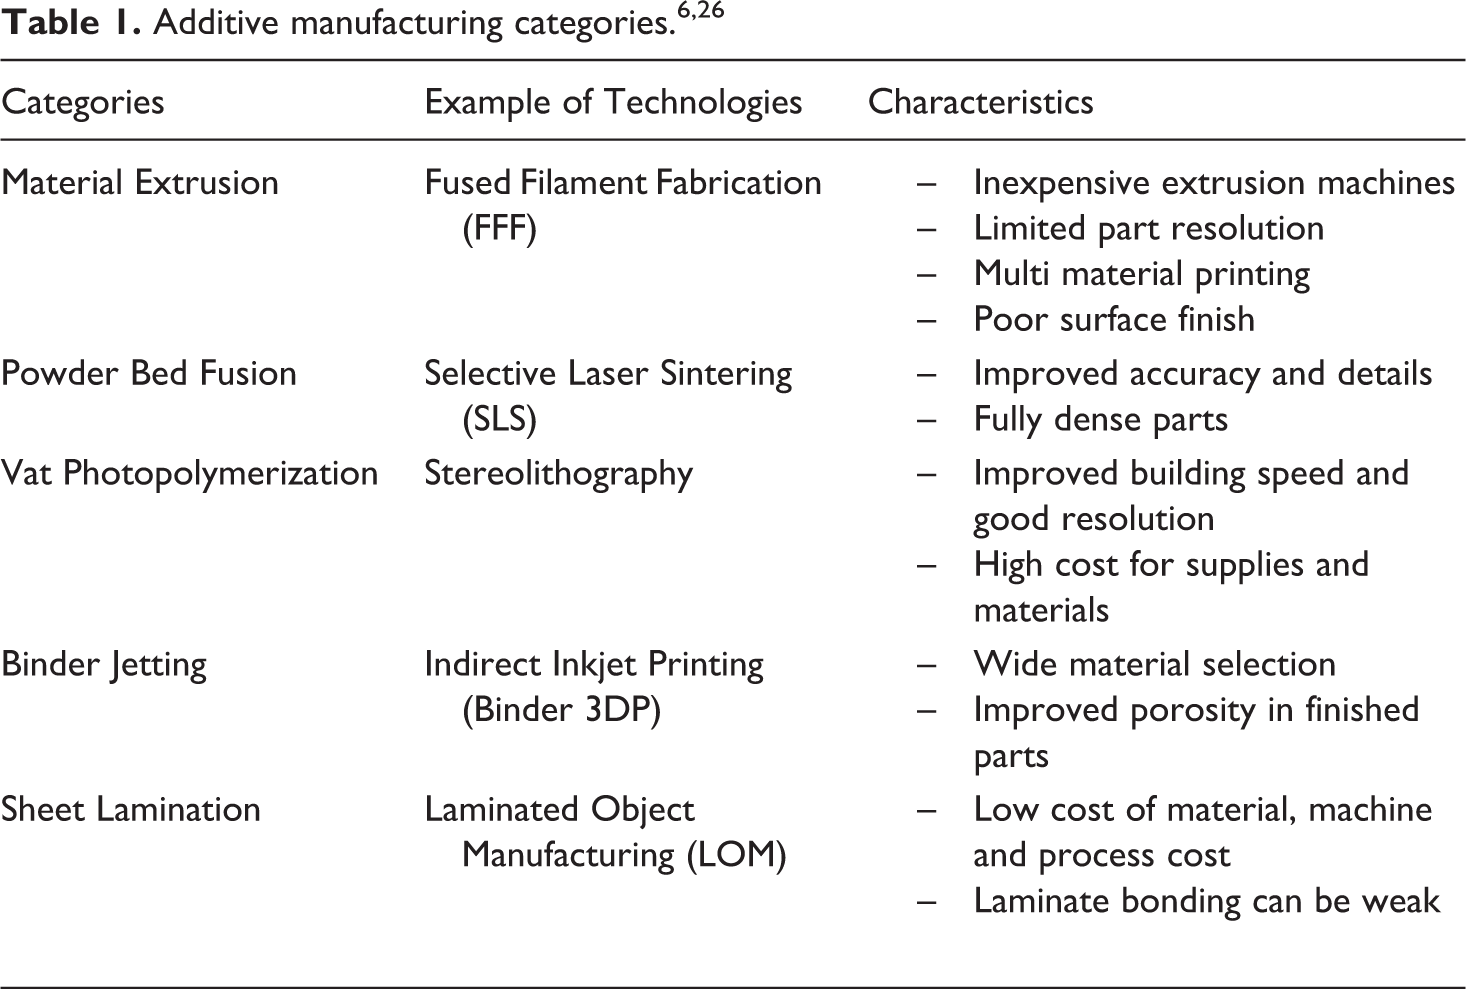
Additive manufacturing categories and respective examples of similar technologies are illustrated in Table 1, which focuses on polymeric/composites materials. Table 1 shows five distinct categories of additive manufacturing and the respective main characteristics.
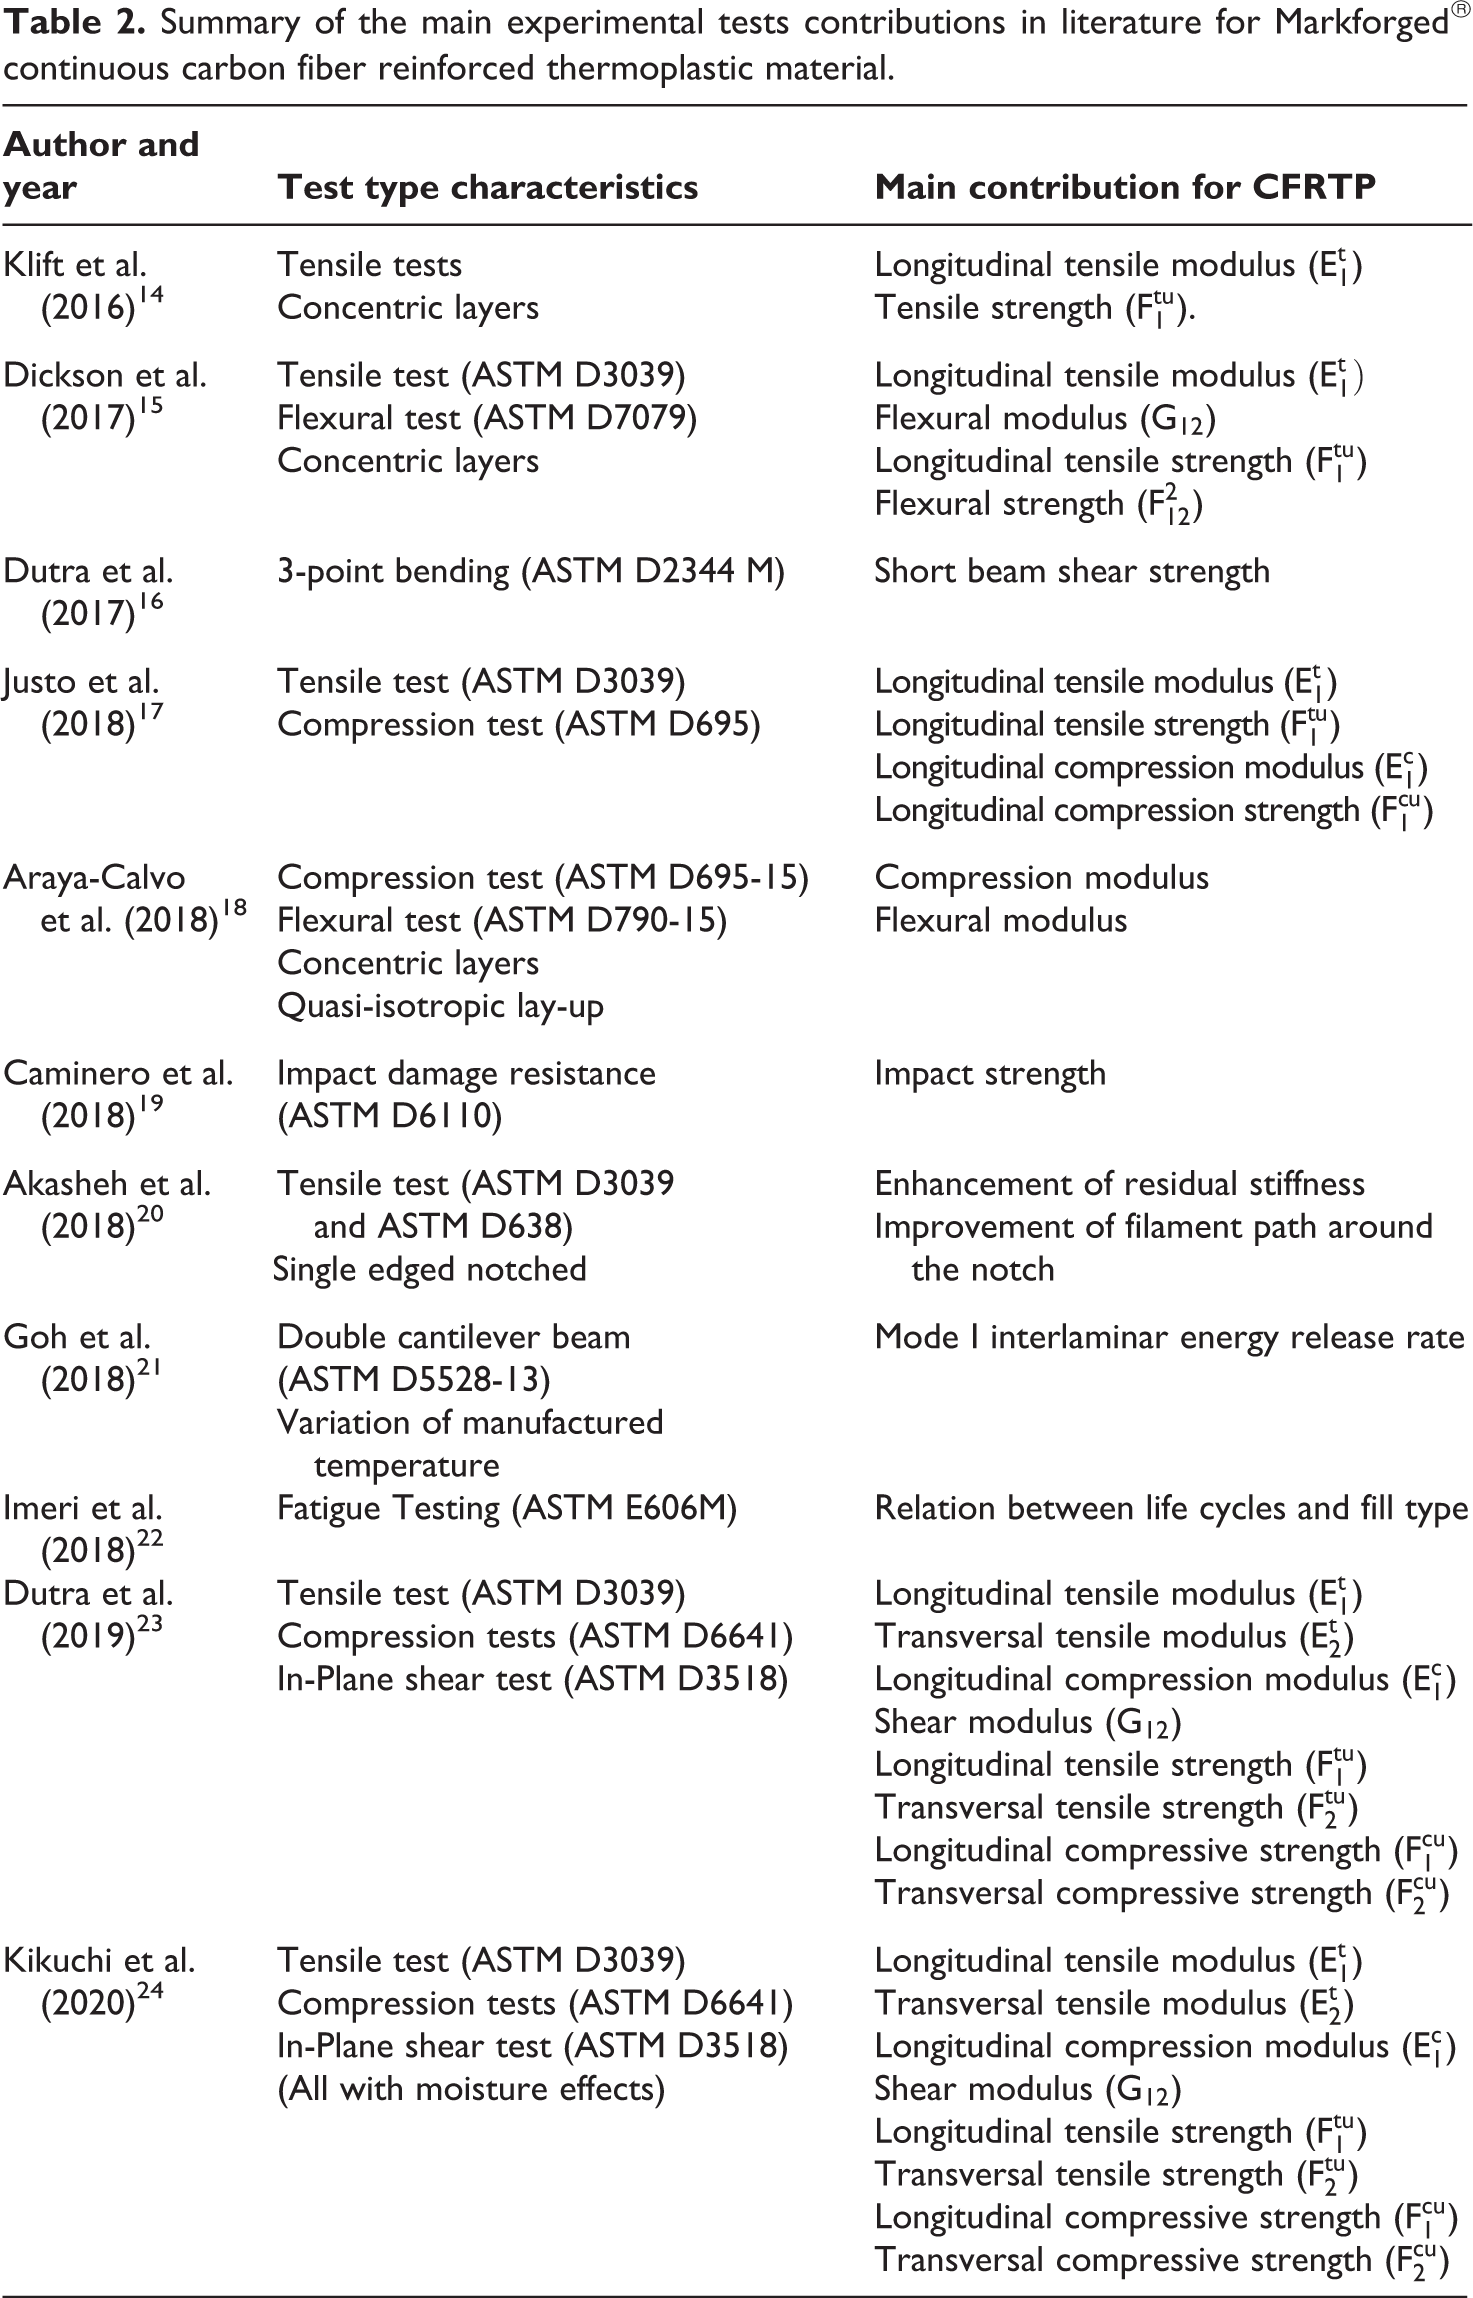
The 3D printed continuous carbon fiber composites have been the focus of research since it was released in 2013. 7 Table 2 shows important work about 3D printed CFRTP (continuous fiber reinforced thermoplastic) composites, compiling significant properties that are already available on literature and the respective test types. Some of these properties are the basis for the calculation in data reduction herein. As demonstrated in Table 2, the material has been characterized on static properties,14–19 while three authors20–23 have initiated preliminary studies about fracture in CFRTP composites. Dutra et al. 23 estimate some of the properties for a 3D printed laminate with continuous carbon fibers using static tests while Kikuchi et al. 24 estimate those properties with moisture effects. Extrapolating these values using micromechanics characterization of laminae, these data are here used as input for simulations in FEM (finite element method) and the calculations applying the ASTM STP 410 standard 27 equations, in a LEFM characterization.
Summary of the main experimental tests contributions in literature for Markforged® continuous carbon fiber reinforced thermoplastic material.
The fracture testing of the material can be performed using a few types of specimens, consisting of fracture toughness (KIc) and energy release rate (GIc) characterization. A common specimen type for fracture tests is the compact tension (CT). However, it is here applied the double-edge notched (DEN) to the translaminar characterization of fracture toughness. The advantages of DEN are: easily testable, low load transfer interference and easier to fabricate than other specimen types. The disadvantages of DEN are: the possibility of asymmetrical sharpness of crack tips and variations in crack growth between sides. 28 Although disadvantages, several authors used this specimen shape29,30 since it is an appropriate geometry to estimate the KIc and GIc of a material using just the ultimate load. This happen because this kind of specimen induce to brittle crack propagation. Another reason to choose the DEN shape is resource utilization. For instance, the estimated composite filament volume required to manufacture a single Compact Tension (CT) specimen is approximately 17 cm3 in almost 6 h of 3D printing time using a Markforged printer Markone®, while for a DEN specimen these amounts decrease to 12.5 cm3 in less than 4 h, saving 4.5 cm3 of fiber and 1 h of machine time per specimen printed. These estimates were performed by the 3D printer software interface and demonstrate the advantage of the DEN specimen shape in terms of material savings and printing time spent in comparison to the CT specimen.
Therefore, this work contributes with linear elastic fracture mechanics characterization approach of the critical translaminar fracture toughness KIc and the critical energy release rate GIc of CFRTP composites manufactured by the FFF process. For this aim, unidirectional [90°]12 and cross-ply [(90°/0°)3]2s laminates in a double-edge notched (DEN) standard were used to perform tensile tests until the total rupture of each specimen. A video gauge was used to obtain displacements and strains on the surface of the specimens, in order to estimate the fracture toughness in a linear elastic view. Besides the tensile tests, fractographic analyses were performed to present the main features for Mode I CFRTP failure surface. Additionally, a linear relationship was proposed between the number of layers at 0° and 90° direction and the translaminar fracture toughness of the printed laminate. In view of the exposed, the present work contributions include the methodology employed for fracture testing and an estimate of critical translaminar fracture toughness for the studied 3D printed composite. This characterization is useful for studies on printed materials under possible fracture scenarios. For example, the KIc presented herein can be used in damage tolerance (DT) models including an initial crack in 3D printed components and this can be applied for a fatigue study of the 3D laminate based on the results here presented.
Experimental procedure
Materials and manufacturing procedure
Double-Edge Notched (DEN) is the specimen shape chosen for the tests performed in this work. Figure 1 represents the geometry of the specimens tested with respective dimensions for unidirectional and cross-ply lay-up, based on standard for isotropic materials ASTM STP 410. 27
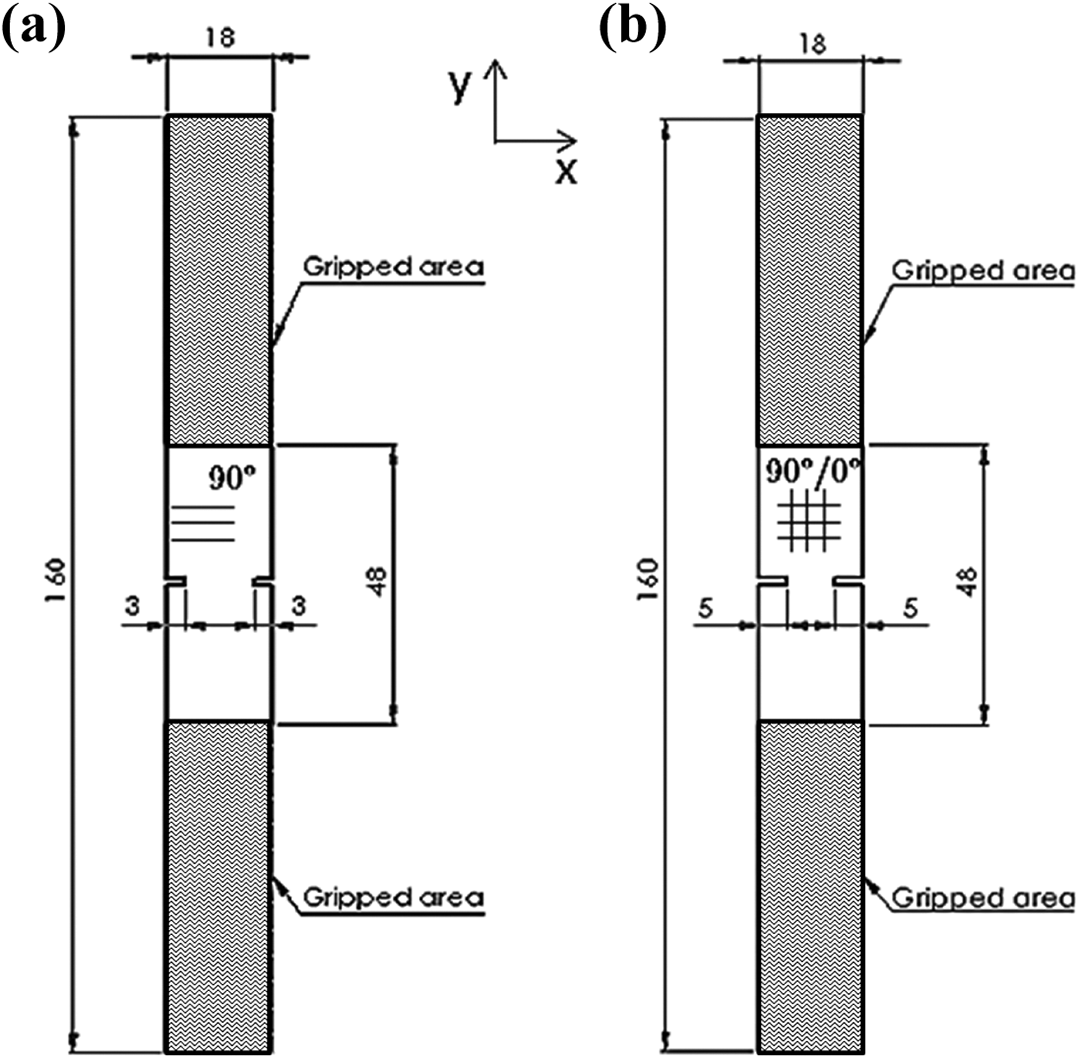
DEN geometry: (a) unidirectional and (b) cross-ply dimensions. Following ASTM STP 410. 27
The specimens in Figure 1 were manufactured in two lay-up configurations: Unidirectional: [+45°(ny)/−45°(ny)/[90°12(c)]/+45°(ny)/−45°(ny)]T Cross-ply: [+45°(ny)/−45°(ny)/[(90°/0°)3(c)]2s/+45°(ny)/−45°(ny)]T
The lay-ups above have 16 layers each, and orientation angles are measured concerning the y-axis in Figure 1, with nominal layer thickness of 0.125 mm. In each specimen, the four external layers, [±45°(ny)], two on the top and two on the bottom, are made of pure nylon (as indicated by the subscripts “ny”) as default of the 3D printer used, in order to protect fiber reinforced layers, and cannot be modified. The total number of carbon fiber reinforced thermoplastic layer is 12 in each specimen (those with subscripts “c”), to have symmetric stacks while keeping the total thicknesses low.
The 3D printer and the carbon fiber reinforced thermoplastic filament employed in specimen production are from the company Markforged®. The carbon fiber filament and nylon filament used are the proprietary Markforged® ones (see datasheet of the material 31 ), while the printer is a Mark One® (Figure 2) equipped with a multi-nozzle system, where the first nozzle is for the pure nylon filament and the second nozzle is for the carbon-nylon filament. The default operating temperature of the nozzles is 265°C for the nylon filament and 260°C for the carbon-nylon filament. It is important to notice that a carbon fiber filament has around 35% of carbon fiber volume fraction while each filament has about 1000 fibers per bundle.14,23 The porous volume ratio (or void volume ratio) was calculated using the methodology from ASTM C830-00, 32 which was 1.92 ± 0.02%.
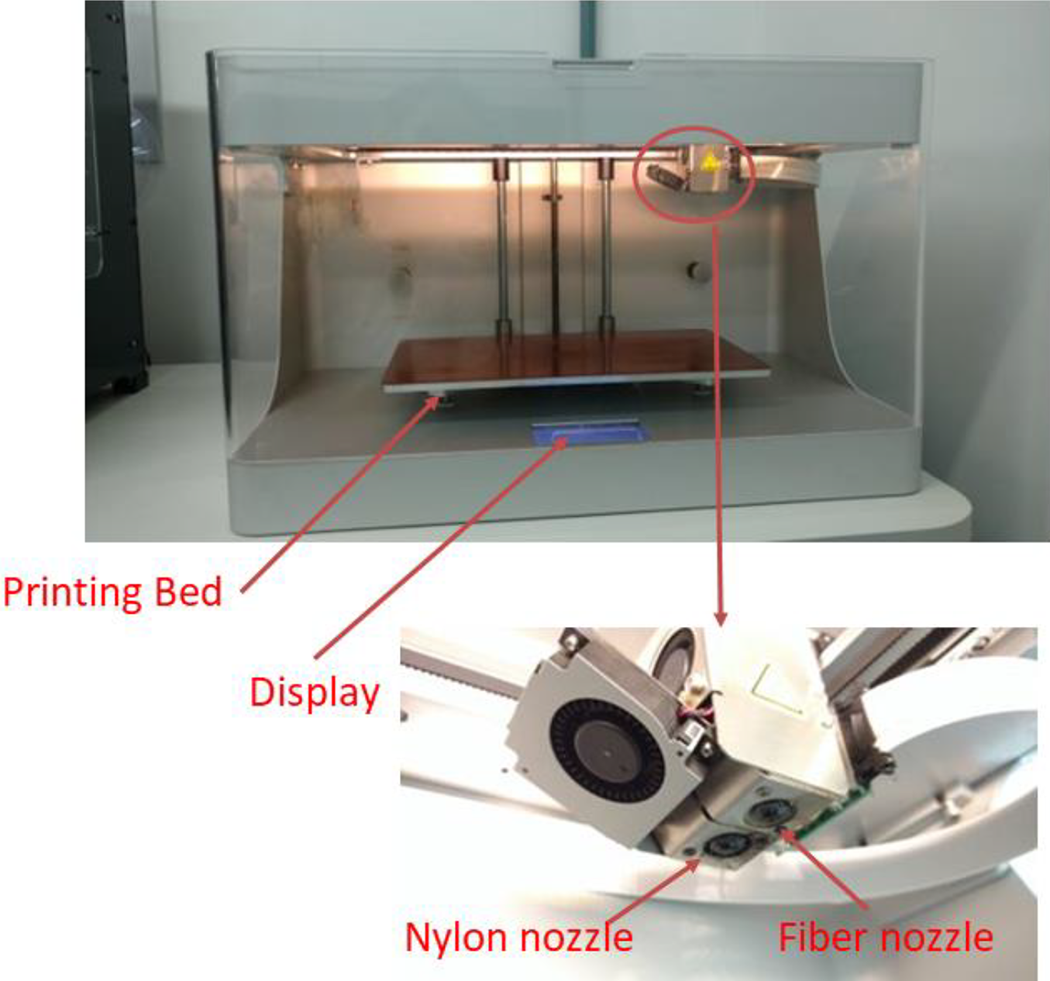
3D printer and the respective temperature display, printing bed and nozzles.
Specimen preparation for mechanical characterization
DEN specimens were obtained by cutting 3D printed full plates. These plates were cut off around the edges by a cutter machine model Extec Labcut 5000 in a rotation speed of 2000 rpm. The speed had to be enough to not melt the nylon matrix and, at the same time, produce a flawless cut. To produce the initial crack in all specimens, a Buehler IsoMet 5000 machine with a rotation speed of 2500 rpm and a 0.8 mm blade was used. In the sequence, a knife blade of 0.45 mm and a razor blade of 0.1 mm of thickness are handled to provide the final sharp crack.
For cross-ply samples, before using the utility blade and razor blade, a 0.5 mm hacksaw blade was utilized to deepen the cross-ply crack, which is 5 mm long while the unidirectional has a crack size of 3 mm.
To measure the crack tips and examine the sharpness of the crack fronts, all initial cracks were observed with the stereoscope model Olympus SZ61-Infinity. Figure 3 presents two crack front types and sizes for unidirectional and cross-ply configurations. As can be seen in Figure 3, the crack sharpness is nearly 0.04 mm in unidirectional specimens while it is approximately 0.28 mm for cross-ply specimens.
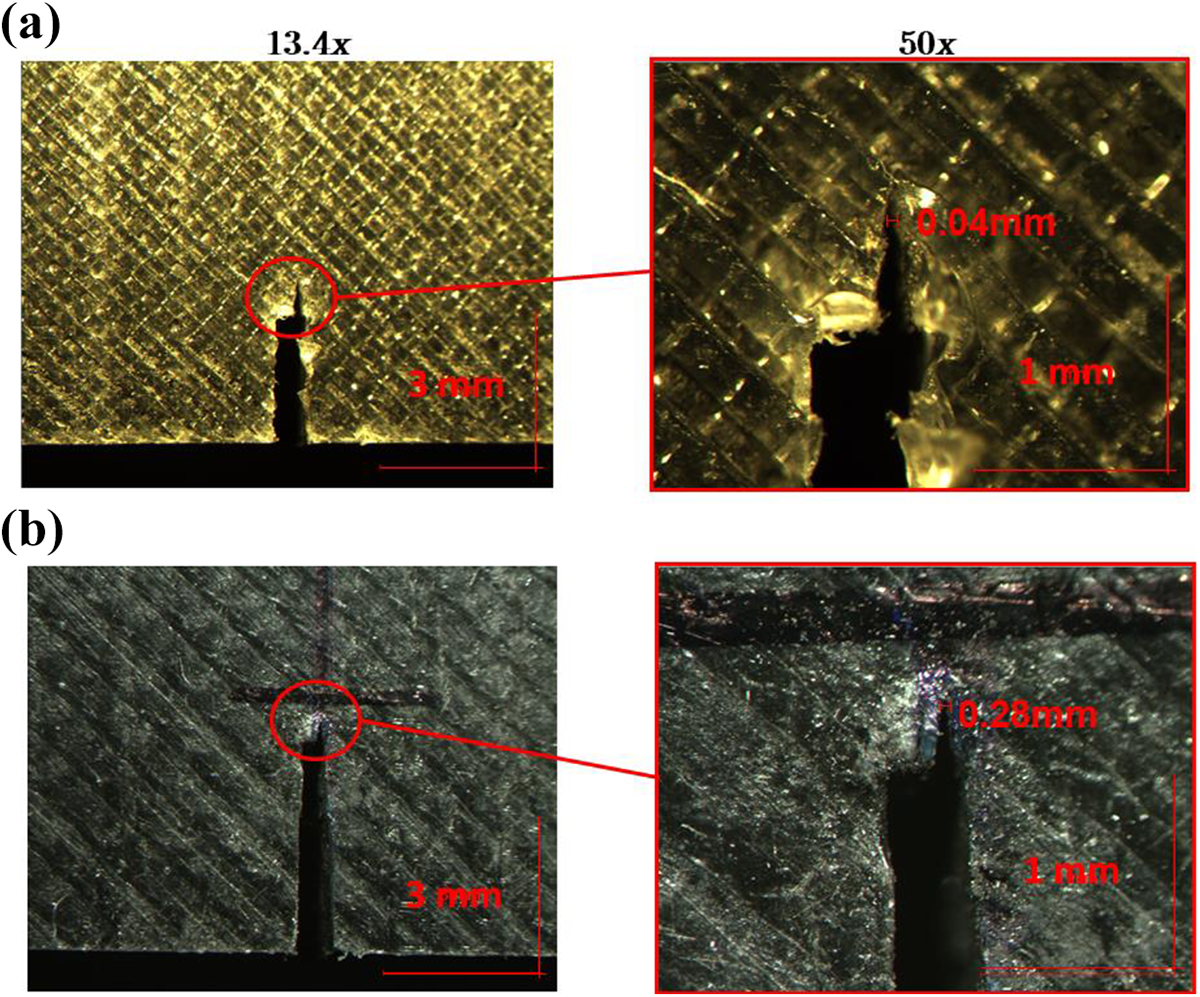
(a) Unidirectional crack tip and (b) cross-ply crack tip.
The 3D printed unidirectional specimens were named from U1 to U9 and the 3D printed cross-ply specimens were named from CP1 to CP10.
After all the manufacturing steps, all the specimens were inspected using ultrasound C-Scan model ISONIC 2006, to detect voids and interlaminar failures. The final thickness diagram represents the uniformity of the specimens. One representative specimen thickness diagram is presented in Figure 4. In general, the scanning showed good attenuation in results, indicating no visible failure since the diagram is almost homogeneous in color.
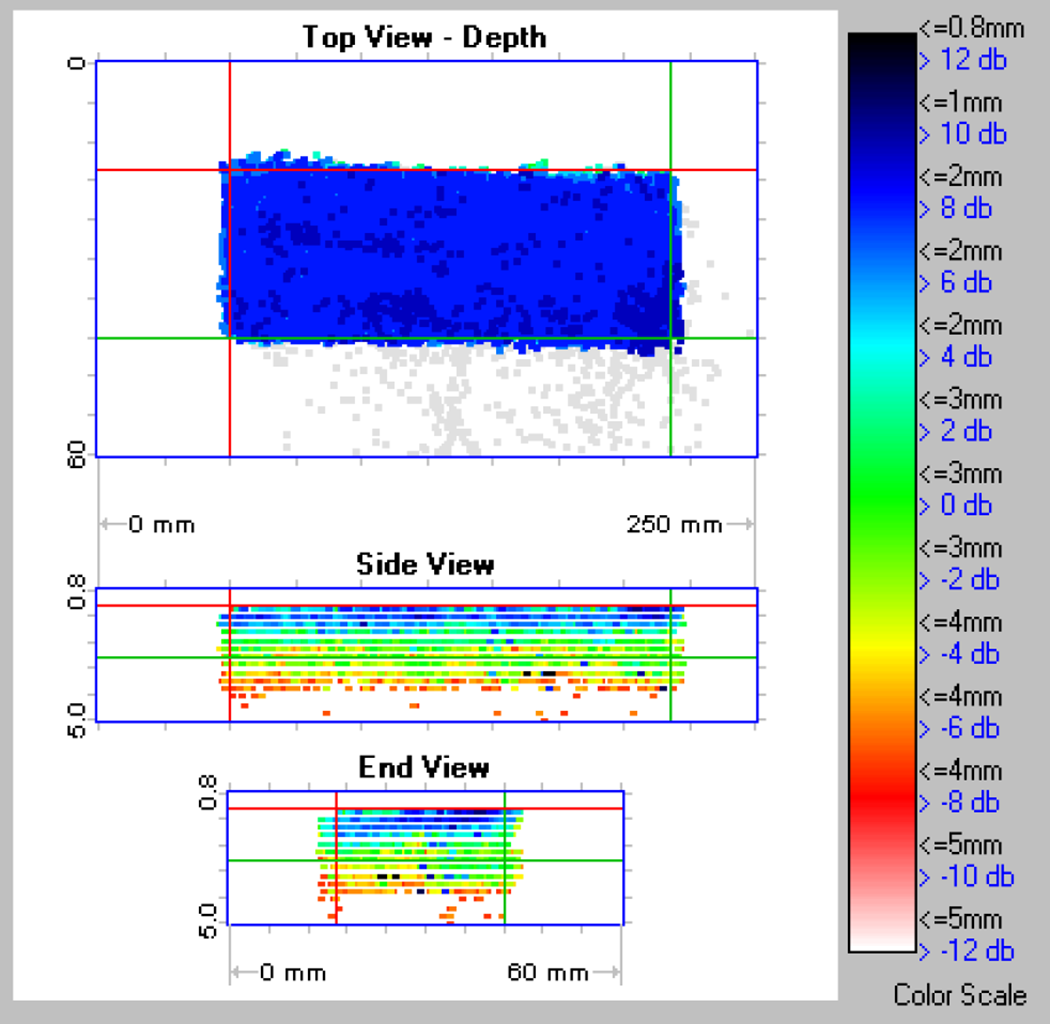
Thickness diagram provided by C-Scan.
Translaminar fracture toughness characterization
All specimens were analyzed with Digital Image Correlation (DIC). DIC is a technique where displacement and strain are calculated based on pixel movement of a reference image in an initial undeformed state to an image after deformation, tracking the same region of pixels.
For this kind of image correlation, some hypotheses are adopted: all specimens are assumed planar, camera lenses are parallel with the specimen and the displacements for all layers are the same. The region of interest for this kind of specimen is in between the double crack. Because of that, these regions were coated in matt white paint with black speckle pulverized, to create a precise tracking area to be used for DIC. This random array of black and white is essential to create a light intensity field necessary to DIC work well. 33
The equipment employed was an Imetrum® 34 video gauge with a camera screen size of 19 x 14 mm and 1388 x 1038 pixels of resolution, besides 1000 fps. The post-processing software used was the open-source Digital Correlation Image Engine (DICe). 35 Figure 5 shows some of the painted samples and a captured image utilized in DICe software for post-processing.
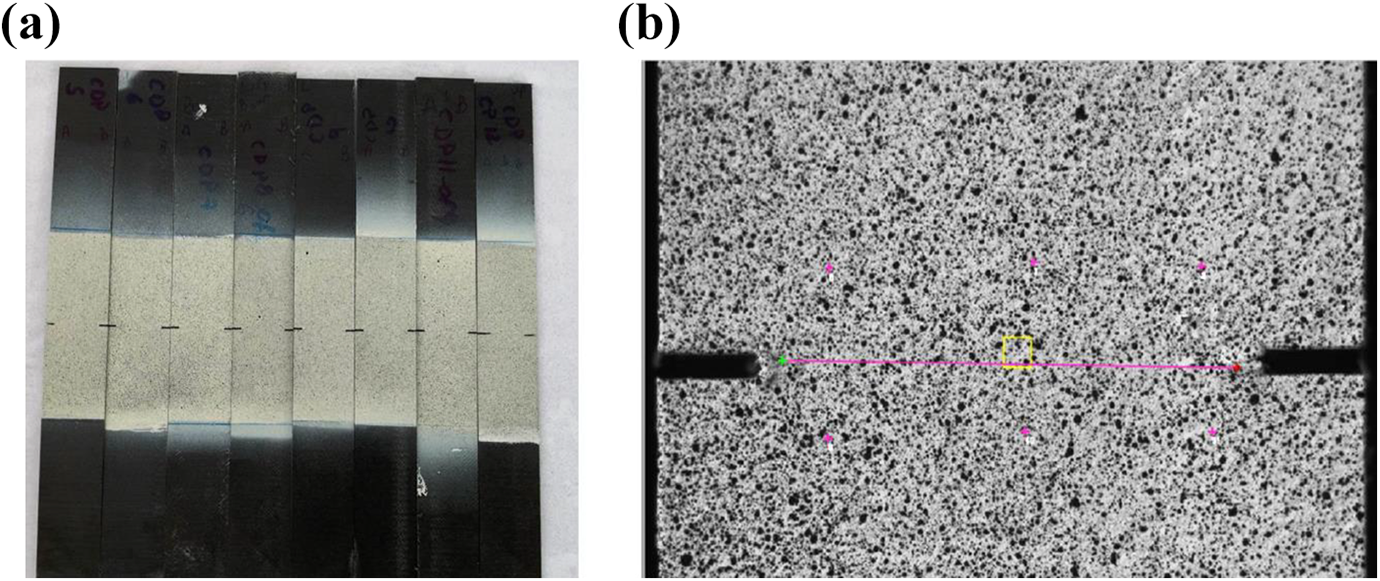
(a) Samples painted in white and speckled in black and (b) captured image from DIC interface program.
On the evaluation of fracture toughness, the DEN specimen requires a tensile test to allow KIc to be evaluated, where the specimen is under tensile load until complete rupture, when crack propagation occur between the symmetrical cracks. This test was performed with an Instron model 5500 R combined with a 30 kN load cell and an applied displacement speed of 0.5 mm/min, in standard environment temperature. The tensile machine was connected with a video gauge system, which corresponds to the DIC database (Figure 6).
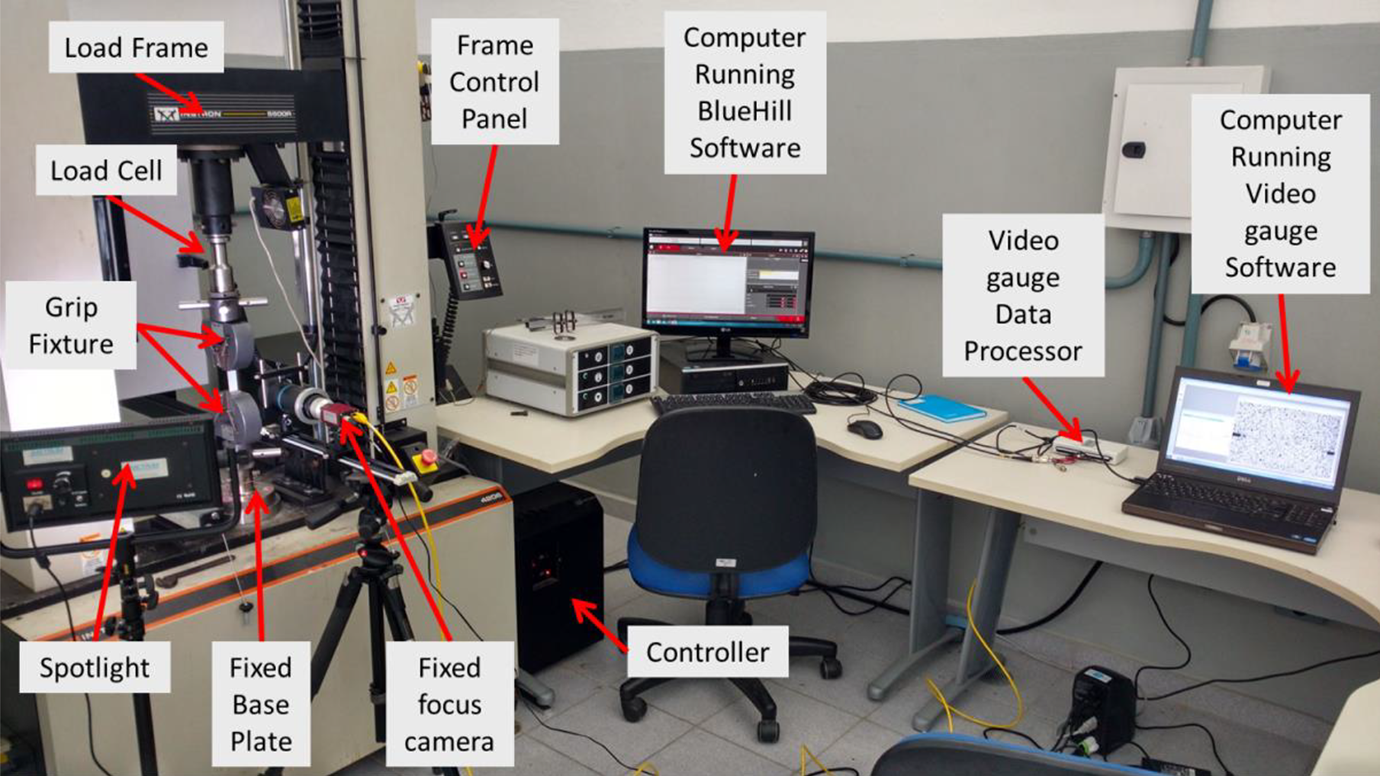
Equipment used in tensile tests.
Data reduction techniques
Following other authors,36–38 the data reduction procedures herein implemented can be divided into three parts: ASTM STP 410 standard equation, numerical model (FEM) and DIC testing. It is important to mention that all these reduction procedures consider linear elastic fracture mechanics theory, plane stress assumptions and especially orthotropic laminates, as well as brittle fracture for DEN specimen type.
Standard equation
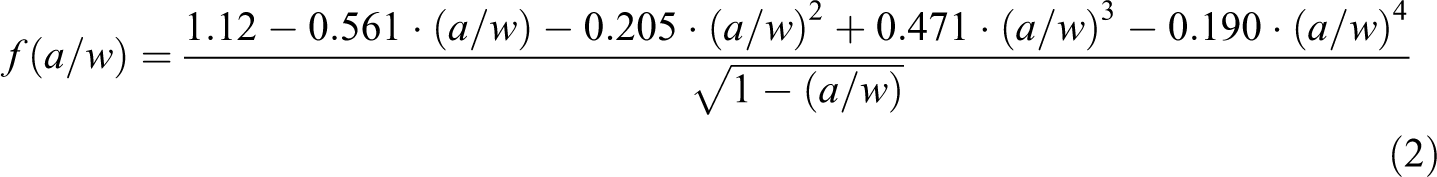
The purpose here is to calculate the KIc and GIc for the specimens as an equivalent especially orthotropic material through the ASTM STP 410 standard. 27 Reviewing LEFM equations, the fracture toughness KIc is found by:

where f (a/w) is the geometry correction function, a is the crack size, w is the specimen width and σ is the applied stress. The f (a/w) chosen is a more accurate geometry correction function proposed by Tada et al. 39 derived from ASTM STP 410 27 say:
The critical energy release rate GIc related to an orthotropic material40,41 is given by:
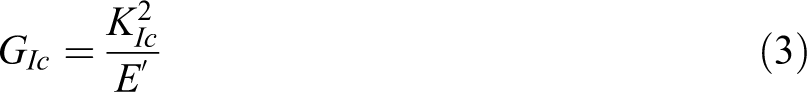
where E’ = E for isotropic materials in-plane stress, which condition implies that the stress components through thickness are zero. The specimen’s thicknesses here tested are lower than length and height (160 x 18 x 2 mm). Consequently, plane stress is assumed. In the case of orthotropic materials, if the crack coincides with a symmetry plane of orthotropy and plane stress state, E’ can be written as:
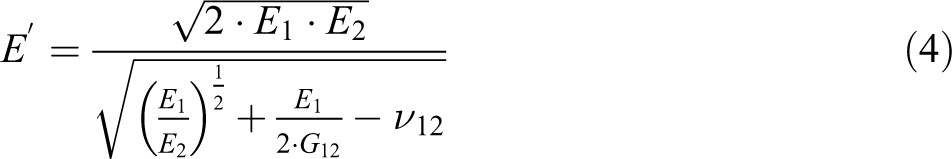
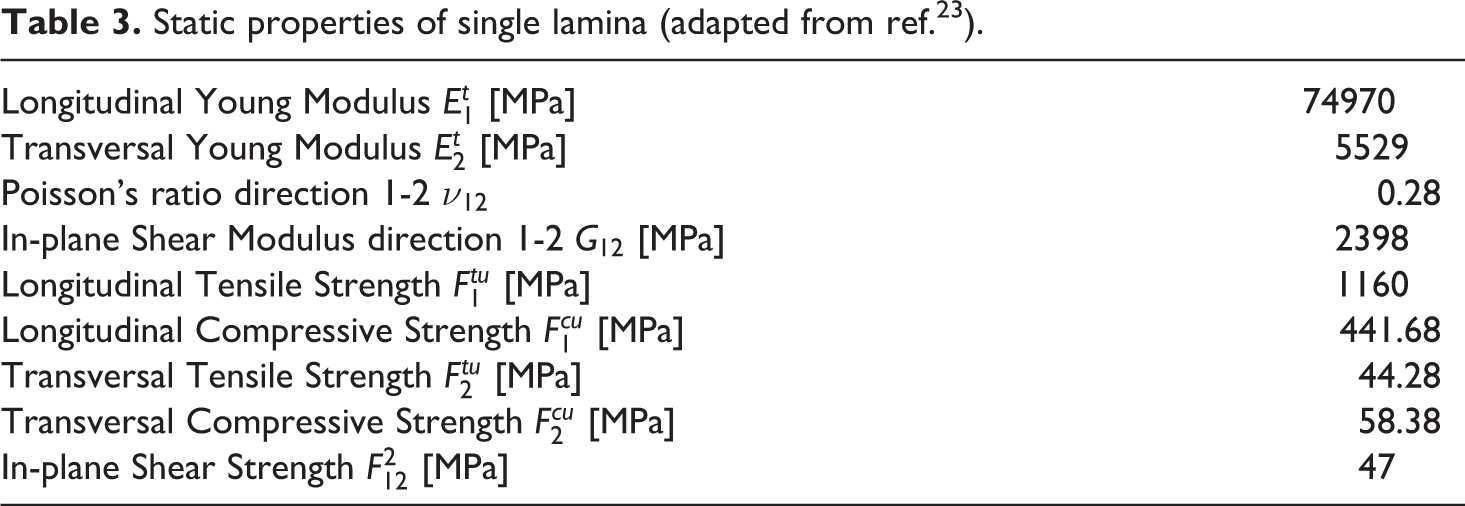
where E1 and E2 are the elasticity modulus in longitudinal 1 (fiber) and transversal 2 (matrix) directions of the composite, respectively. G12 is the shear modulus on plane 1 − 2 and ν12 is the Poisson’s ratio. The mechanical properties values used as an input in this work were obtained by Dutra et al. 23 and extrapolated applying composites micromechanical theory for transversal and longitudinal strengths of composites. 42 Hence, Table 3 presents properties of 3D printed single lamina with continuous carbon fiber. Therefore, some properties shown were calculated with global extension stiffness matrix terms from equivalent constitutive equations for a composite. 43
Static properties of single lamina (adapted from ref. 23 ).
Numerical model
A Finite Element Model (FEM) was developed to predict the stress and strain fields over the specimens. Each specimen was linearly modelled as an equivalent especially orthotropic plate with respective layers, for both unidirectional and cross-ply lay-ups. Therefore, the KIc was estimated for unidirectional and cross-ply specimens and extrapolated for individual layers at 0° and 90° through DIC experimental results in both specimens’ configurations, in order to compare with numerical results, assuming same displacement for all lay-up during the tests. The concept of J-integral was applied. The J-integral is a path-independent integral used as an equivalent of total strain energy rate and can be computed using FEM as well.
36
Accordingly, linear elasticity J-integral is the combination of Mode I (opening mode) and Mode II (in-plane shear mode), represented as
The Abaqus® CAE 6.14 46 was the interface chosen to run the analyses and build the FE model, which considers a linear elastic especially orthotropic material and ideal sharp crack tip. Based on a convergence study done with the model here implemented, the element size adopted is 0.25 mm and, on the region of 0.5 mm around the crack tip, the element size chosen is 0.1 mm to provide a good discretization around the crack tip. The discretization has the objective of bringing appropriate results in J-integral simulations. The element type is a quadratic eight-node shell named S8 R in a structured mesh. Figure 7 presents the mesh and boundary conditions used in the simulations, considering one-quarter model due to symmetries, with the force employed is load per unit distance over the loaded edge, in N/mm. The U1, U2 and U3 are the degrees of freedom in translation and R1, R2 and R3 are the degrees of freedom in rotation.
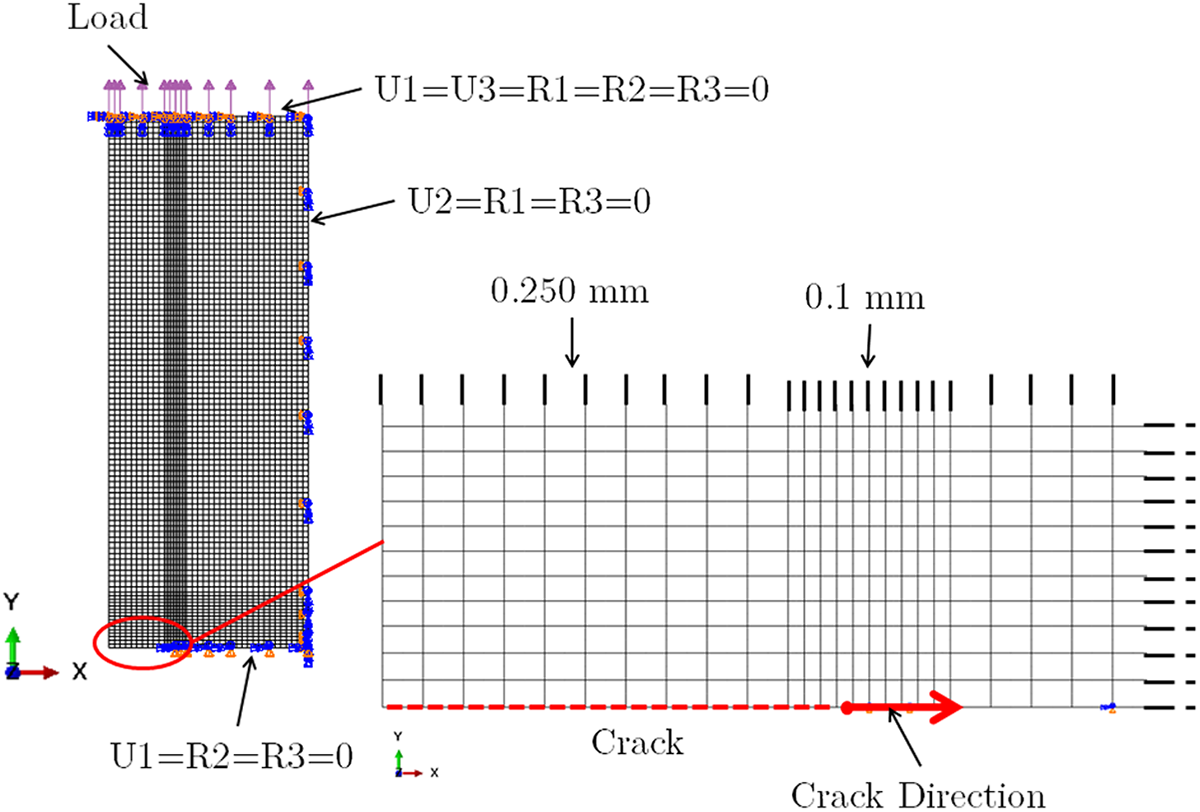
DEN one-quarter FE model: boundary conditions, load direction and mesh size.
Tsai-Wu criterion42,43 was applied in static simulation to investigate the stress field and critical regions on DEN geometry. As Figure 8 exhibits, the maximum stress concentration in the DEN specimen for tensile load is found around the crack tip, as expected. These FE results are useful to estimate the fracture loads.
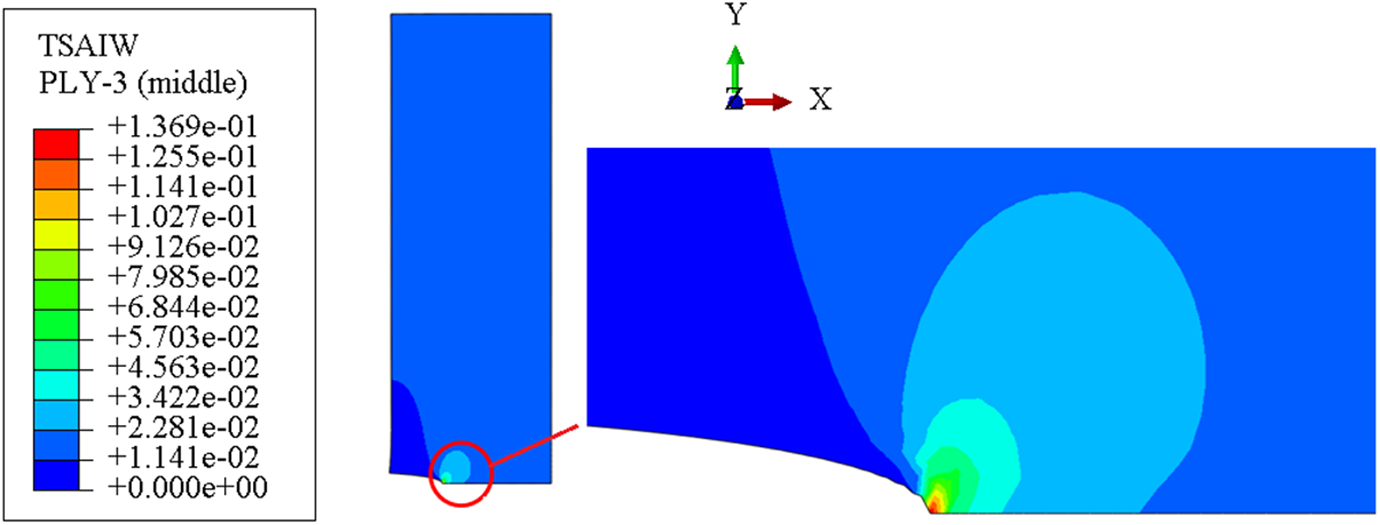
DEN model: Tsai-Wu criteria under tensile load of 1 N/mm.
The J-integral was calculated using the FE model. For a linear elastic orthotropic material under plane-stress assumption loaded in Mode I opening, J = GIc. 36 Applying the equality in equation (3), the fracture toughness becomes:

where
Digital image correlation
The Digital Image Correlation (DIC) was used to generate an experimental data set, where the data reduction is applied to calculate the fracture toughness of both lay-up configurations (unidirectional and cross-ply) and both laminae directions (0° and 90°) in a linear approach. The calculated results for stress and strain of each layer using DIC displacements were compared with the final results of laminae at 0° and 90° from FEM analyses. Besides, the equivalent orthotropic plate results were compared with the final results of the unidirectional and cross-ply laminates from FEM and ASTM STP 410 standard. 27
The DIC works bringing strains in x and y-direction of the specimens, reminding the load was considered in y-direction while the crack is in the x-direction (Figure 7). These strains, combined with the theory for linear elastic especially orthotropic laminates, can be used to estimate the stresses in both directions of the specimen by:
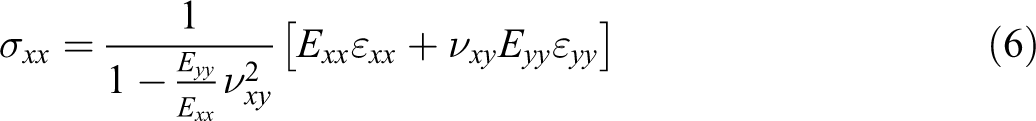
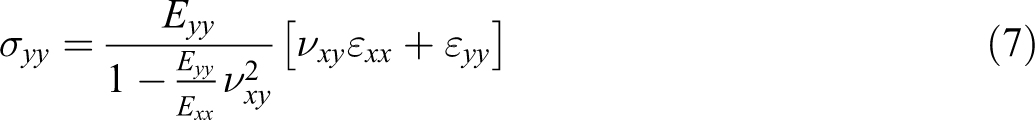
Finally, the stress field at the instant of the crack propagation (

taking r as the distance from crack tip. In the equation (8), a KI per distance r graph can be plotted. A linear tendency curve is outlined to extrapolate the KI when the distance r is 0. In other words, KI is estimated at the crack tip immediately before unstable propagation, and the KIc is evaluated at the crack tip.37,38
Fractographic analyses
The topology of both quasi-static fracture lay-up surfaces was studied by scanning electron microscopy (SEM) using a TESCAN VEGA3. The samples analyzed were previously gold coated in a rotary-pumped sputter coater Q150 R ES to enable electron transmission. The images were taken at a range of 5 kV – 10 kV acceleration voltage at different magnifications. The damage zone and failure mechanisms therein were visualized, and the characteristic features from each type of loading were observed and compared to each other.
Results and discussion
The load per displacement experimental data for unidirectional and for cross-ply specimens are shown in Figure 9. The maximum (ultimate) loads for unidirectional specimens were about 900 N, while for the cross-ply specimens were nearby 3500 N. This maximum load difference occurs because the fiber reinforcement direction in unidirectional specimens ends up perpendicular with the loading direction, while in cross-ply specimens half of the layers have fibers aligned with the loading direction. The test curves indicate alternate phases of the tensile tests. Parandoush 47 also noticed these phases, attributing them for the loading of the matrix material between the fixture and test specimen at the beginning of the test and the slight decrease of the curve slope due to fiber-matrix interface debonding. Figure 9(a) shows the load displacement curves for the unidirectional specimens, with the fibers parallel to the crack propagation. On the other hand, Figure 9(b) shows in the left side the fiber-matrix interface slope curves. After debonding of the interfaces the curve slopes change to the carbon fibers aligned with the load tensile curve (right side of the figure).
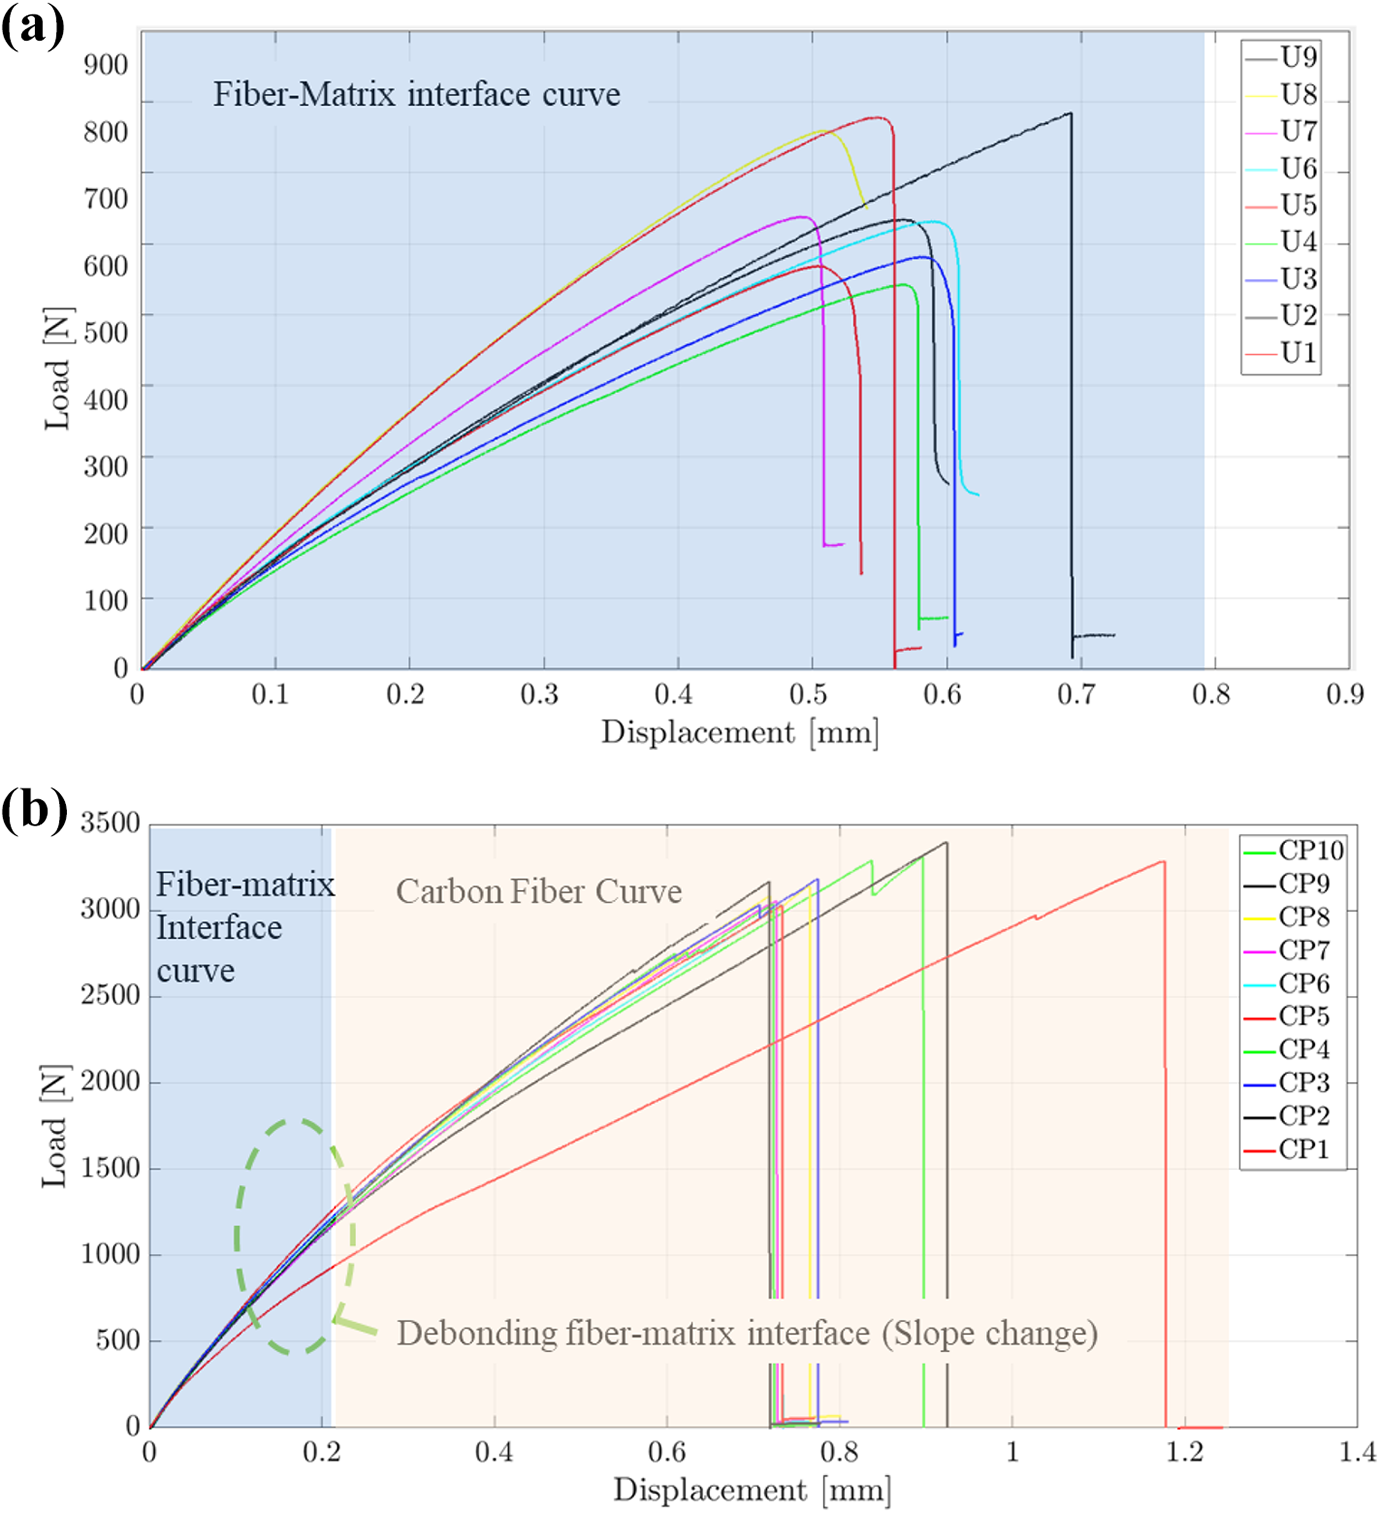
Load × displacement curves: (a) unidirectional specimens and (b) cross-ply specimens.
It is assumed that each specimen has its respective maximum load coincident with the crack initiation since the fracture is brittle. The respective maximum loads were applied to the corresponding specimen on the FE model, in order to obtain the specific J-integral for every case. In the end, the energy release rate GIc is calculated with the equation (3). Using equation (5),
The DIC gives basically the strain
In Figure 10, the horizontal axis measurement from r = 0 mm to r = 12 mm corresponds to the distance between crack tips for the unidirectional specimen and a single lamina in 90° direction from the unidirectional stack. Equivalently, in Figure 11 the measurement from r = 0 mm to r= 8 mm corresponds to the distance between crack tips for the cross-ply specimen and for single lamina in 0° and 90° direction from the cross-ply stack. Although the curves of Figure 9 show some degree of nonlinearity, the linear theory is assumed valid in view of the strong similarity between stress prediction from linear FEM with those from experimental digital image correlation in Figures 10 and 11, when comparing the values after 2 mm from the cracks. Moreover, because the number of carbon fiber reinforced layers is considerably bigger than the number of pure nylon layers in the studied specimens, and the carbon fiber reinforced material has a much higher stiffness than pure nylon,23,24 it is reasonable to assume an overall behavior closer to the carbon fiber reinforced material. Besides, stress growth around the crack tip can be not uniform because of some manufacturing imperfections and plasticity zone effects. 44 Reminding here the plastic effect was neglected to be considered only a linear approach. Consequently, the comparison between curves from FEM and DIC data around crack tip may be ineffective.
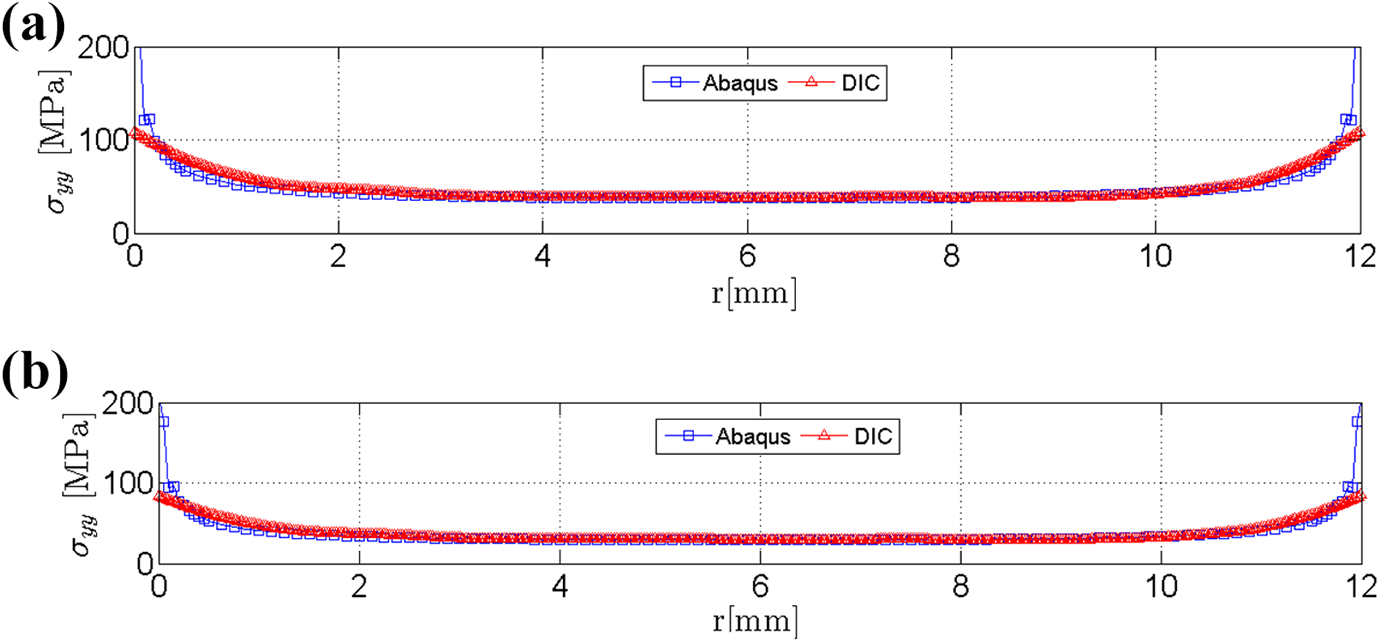
σyy versus r curves from DIC data and FE results for (a) laminae 90° and (b) unidirectional laminate.
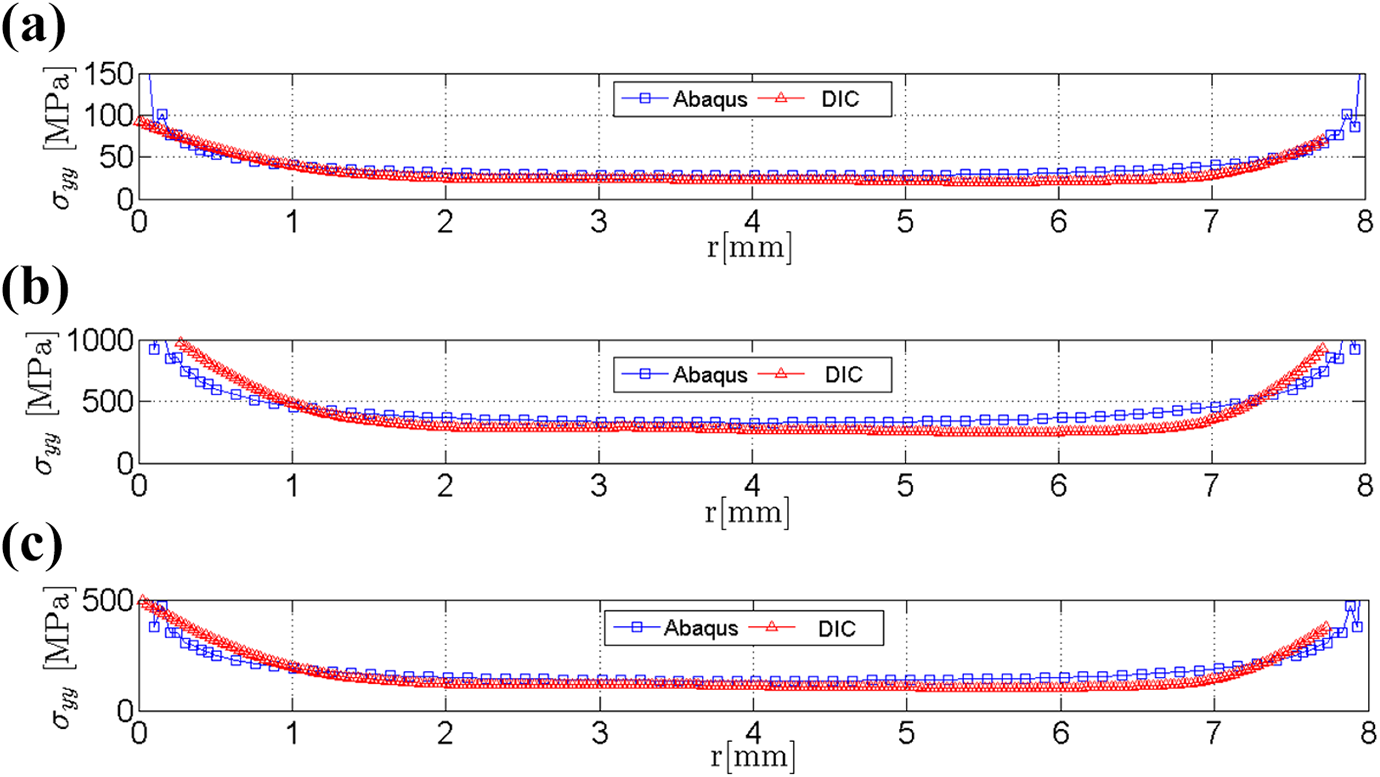
DIC data and FE σyy estimations for (a) a single lamina 0° from cross-ply laminate, (b) a single lamina 90° from cross-ply laminate and (c) entire cross-ply laminate.
It is important to notice the differences in propagation between both side cracks of a specimen. Whilst cracks are theoretically symmetrical, the unstable crack propagation observed was not quite symmetrical. The most accepted hypothesis is related to imperfections around the cracks tips, which stimulate these effects. Also, the cracks are handcrafted produced and, therefore, they are prone to unsymmetrical radius and dimensions. Accordingly, the linear regression results for KIc extrapolation can be influenced by the time instant choice of the test video recorded to make the DIC analysis. The data region of the KIc curves fitted by linear regression can also directly influence the final results. To avoid this situation, the following procedure was adopted: The image captured by video for every tested specimen is from the previous instant before the first visible unstable crack propagation (whichever side occurs first); The linear regression and the KIc extrapolated at the crack tip were calculated for unidirectional samples within the region between 2 mm and 5 mm from the right-handed crack tip side as well as between 7 mm and 10 mm for the left-handed crack tip side; The linear regression and the KIc extrapolated at the crack tip were calculated for cross-ply samples within the region between 1.2 mm and 3.8 mm from the right-handed crack tip side as well as between 4.2 mm and 6.8 mm for the left-handed crack tip side.
The KI for both single lamina and laminates are calculated with equation (8), where the calculated stress
The black part of the results curves are the regions considered in linear regression for the purpose of finding the KIc value using the extrapolation of r = 0 in equation (8). For each regression, a linear equation is obtained. Thereby, they extrapolate a distance from the crack tip that indicates the KIc required in that position. In other words, the expression in equation (8) to calculate KI permits to characterize the fracture toughness at the crack tip. Note plastic zone is disregarded from this method. Despite that, the closest 2 mm from crack tip have been disregarded from the linear regression in order to avoid potential plastic zone interferences.
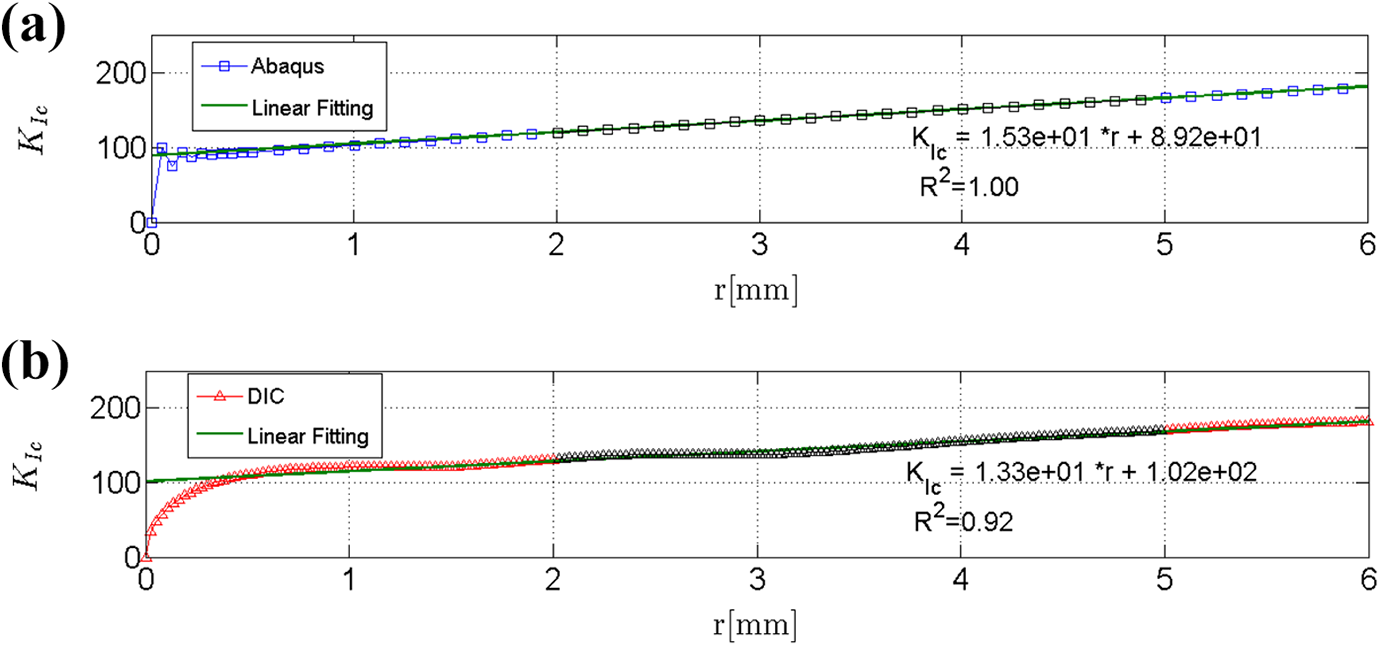
Linear regression for a unidirectional laminate of (a) FE data and (b) DIC data with respective equations. KIc in
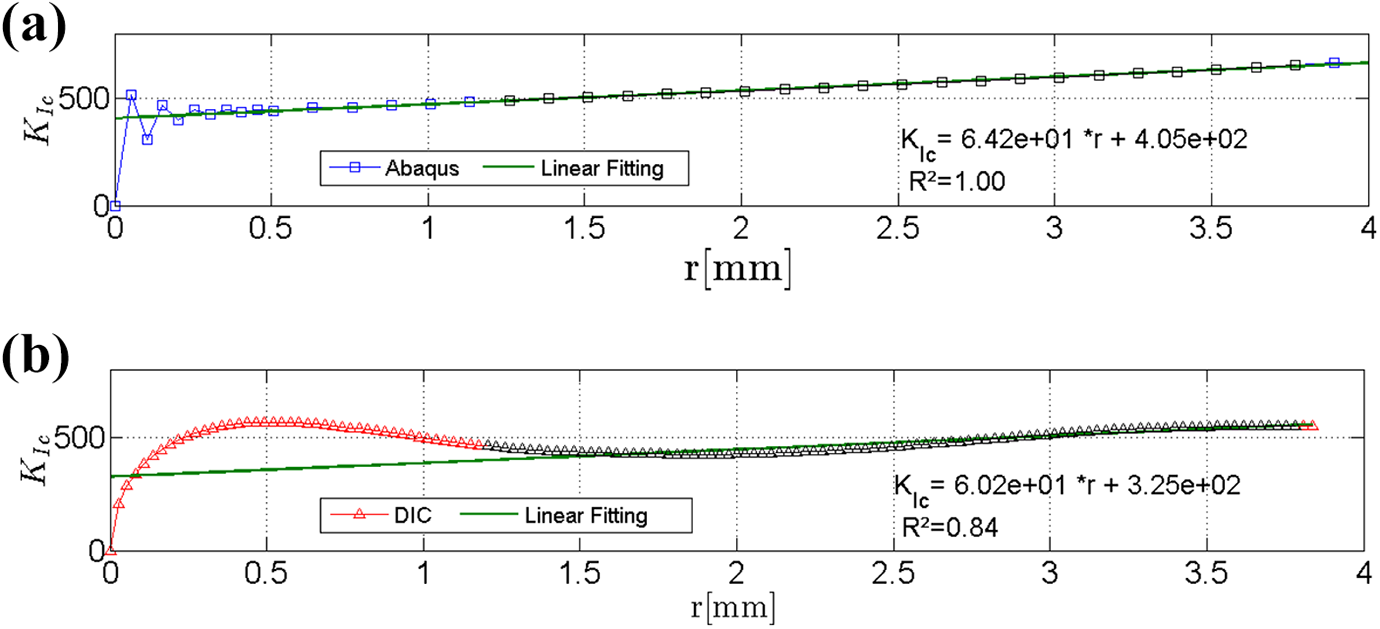
Linear regression for a cross-ply laminate of (a) FE data and (b) DIC data with respective equations. KIc in
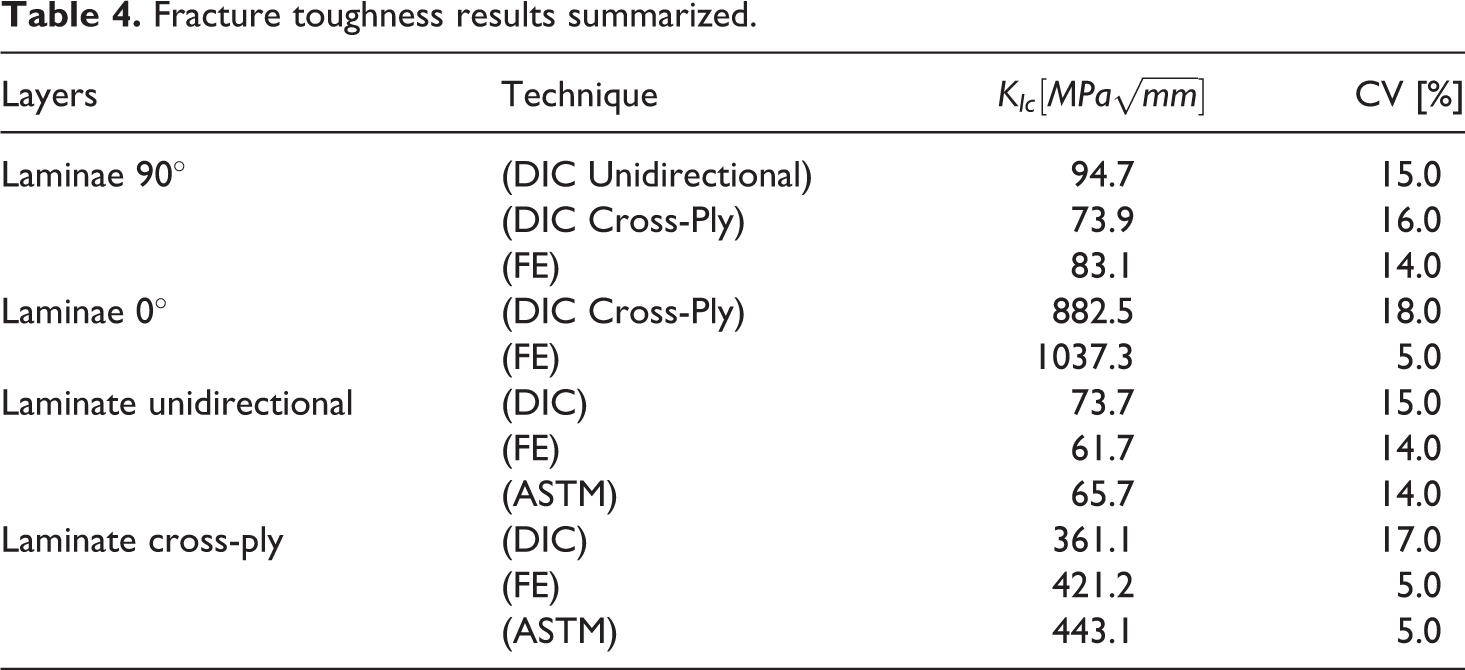
The summarized results are shown in Table 4. They are divided by the layers type (for a single 0° lamina, single 90° lamina, unidirectional and cross-ply laminates) and technique applied (DIC, FEM and ASTM STP 410 27 ). The results for laminae at 0° and 90° are extrapolations of DIC results and can be compared with FE results. The Coefficient of Variation (CV) is the measure of the standard deviation divided per the average of the sample, showing on percentage how the sample varies.
Fracture toughness results summarized.
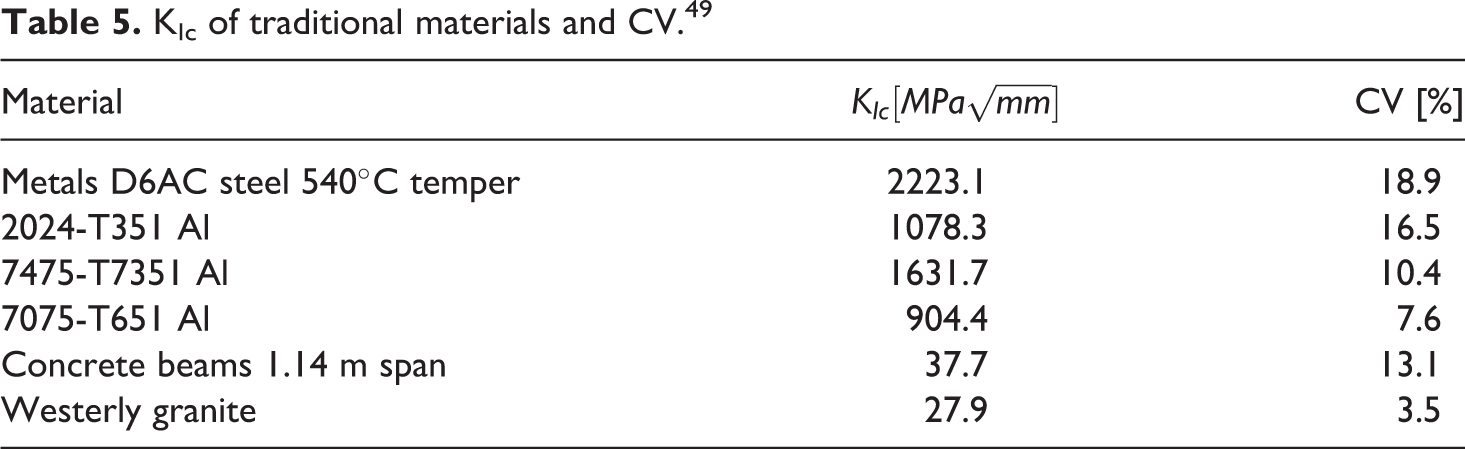
According to Dowling, 49 fracture toughness exhibits more statistical fluctuation than other material properties, with typical values of 10%, which may reach 20%. For metals, the average is 15% approximately. Even though the CV of KIc for the material here studied is about 15%, this variation is acceptable but it is not a rule for composite materials. The CV for composites depends on types of manufacturing, matrix material, and reinforced material. Table 5 exemplifies some traditional materials fracture toughness.
KIc of traditional materials and CV. 49
Typical values for engineering metals are from 632.5 to 6324.5
KIc for some polymers and composite materials.
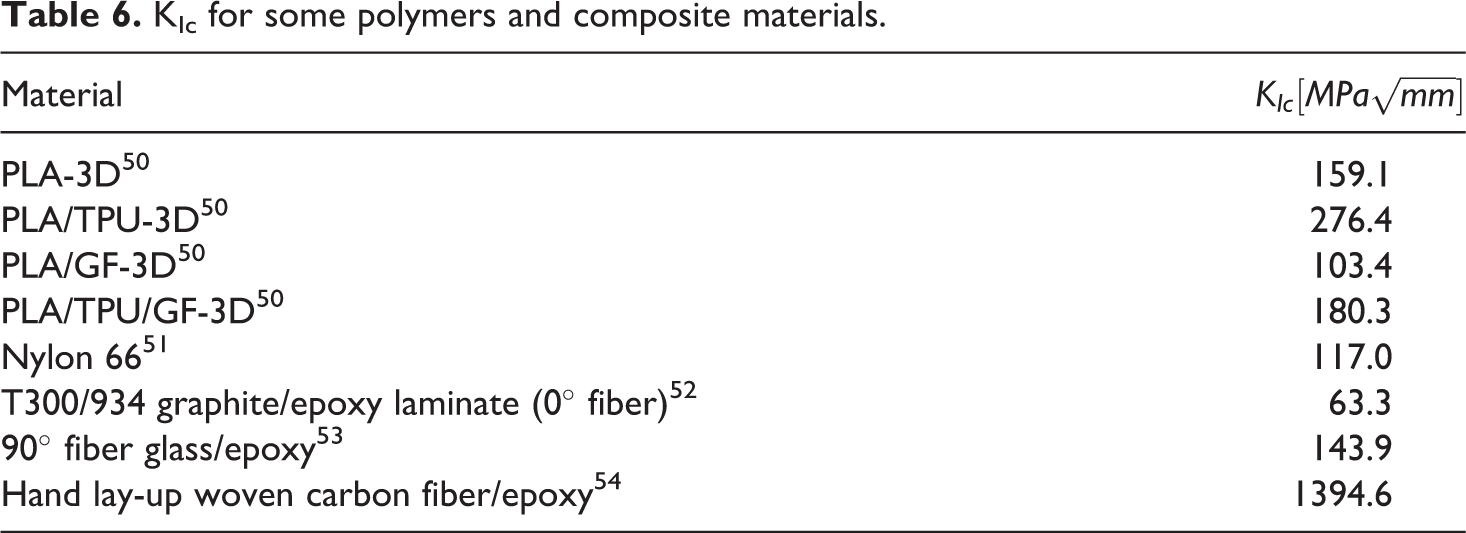
Comparing present results with the literature values presented in Table 6, the KIc for the unidirectional 3D printed laminate has a value equivalent to polymers, being approximately equal to T300/934 graphite/epoxy laminate. The translaminar fracture toughness values for the 3D printed cross-ply laminate is higher than thermoplastic materials but smaller than some types of metals. Furthermore, the approximate calculation for a single 0° lamina demonstrates an average fracture toughness value of 948
In order to predict fracture toughness of a cross-ply laminate based on the constituent laminae at 0° and 90° (adapted from 55 ), the follow equation is given by:

where n0 is the number of 0° layer direction,
Consequently, a graph containing the 0° layers number per KIc value can be inferred. Thereby combining the lay-up information of a cross-ply structure, the fracture toughness in Mode I can be predicted. The graph is shown in Figure 14 with the respective standard deviation region of indicated values (shaded region). This graph represents the capacity of an additive manufactured continuous fiber composites to suit requirement of static and damage tolerance projects just changing the fiber deposition direction.
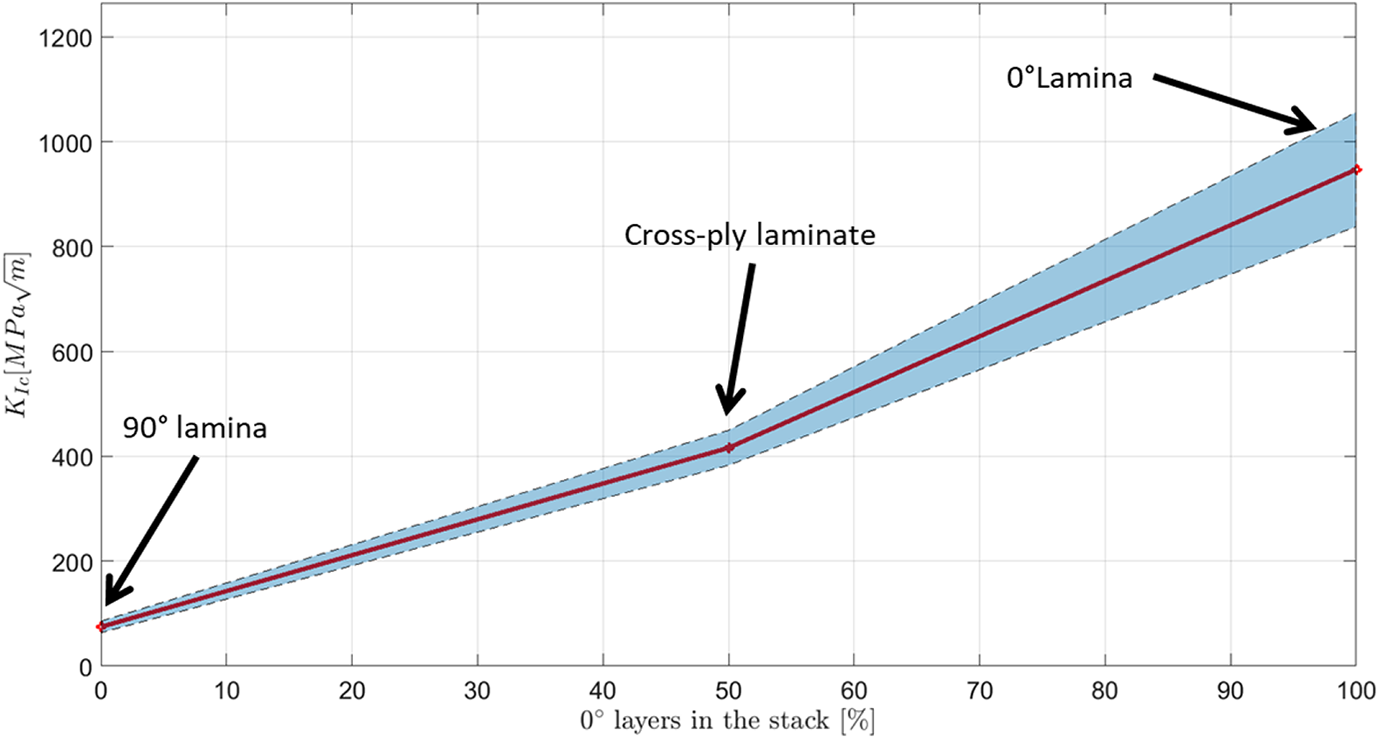
Predicted KIc in terms of the proportion of 0° layers in a 0°/90° layup configuration. The shaded area represents standard deviation.
Fractography
Fractographic analyses were performed in four unidirectional specimens and four cross-ply specimens to examine the fracture surfaces and demonstrate some of failure features occurred during tensile testing. Some features are seen on specimens, as river lines, scarps and fiber impressions, confirming the failure in Mode I. 56 Figure 15 illustrates these features in a unidirectional and a cross-ply failure surfaces, respectively. In Figure 15(b) it can be seen the crack tip surface at the top image and two layers after the crack propagation: on the right side is a layer at 90° and on the left side a layer at 0°. It can be seen that final fracture surface is in the same level of the crack tip initial surface, and some fibers pull-out.
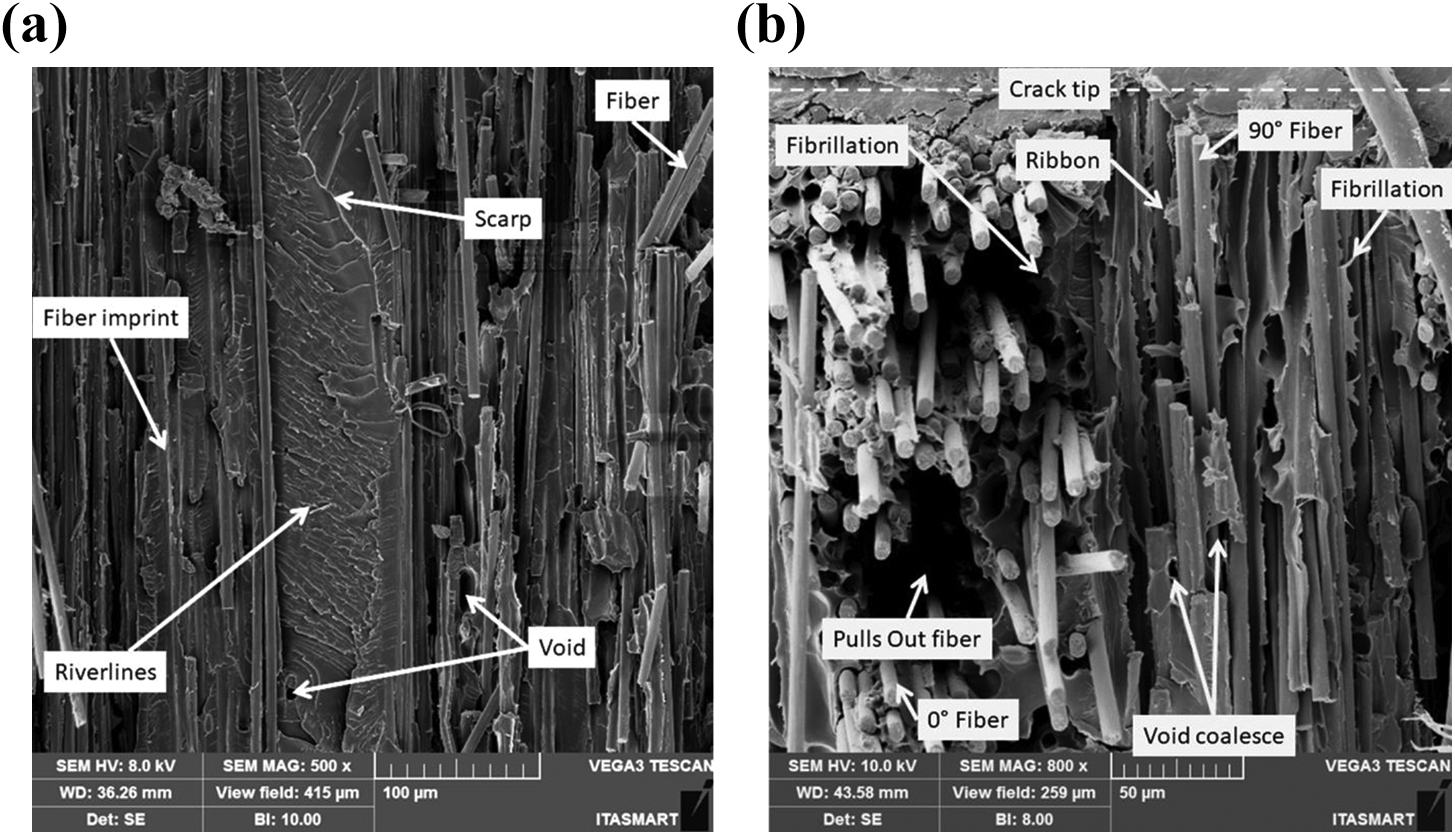
(a) River lines, voids, fiber imprints and scarps – unidirectional specimen. (b) Crack tip, plastic deformation, pull-out and crater features – cross-ply specimen.
A peculiar formation was observed in specific areas where apparently unusual voids occurred in matrix among the fibers in pull-out, here called as “craters”. The craters shapes indicate local shear failure coming from compression in the region with peculiar characteristics: a fiber enclosed in resin nearby the crack tip 56 (Figure 16(b)). These formations were observed in fracture sections nearby the crack tip in cross-ply specimens.
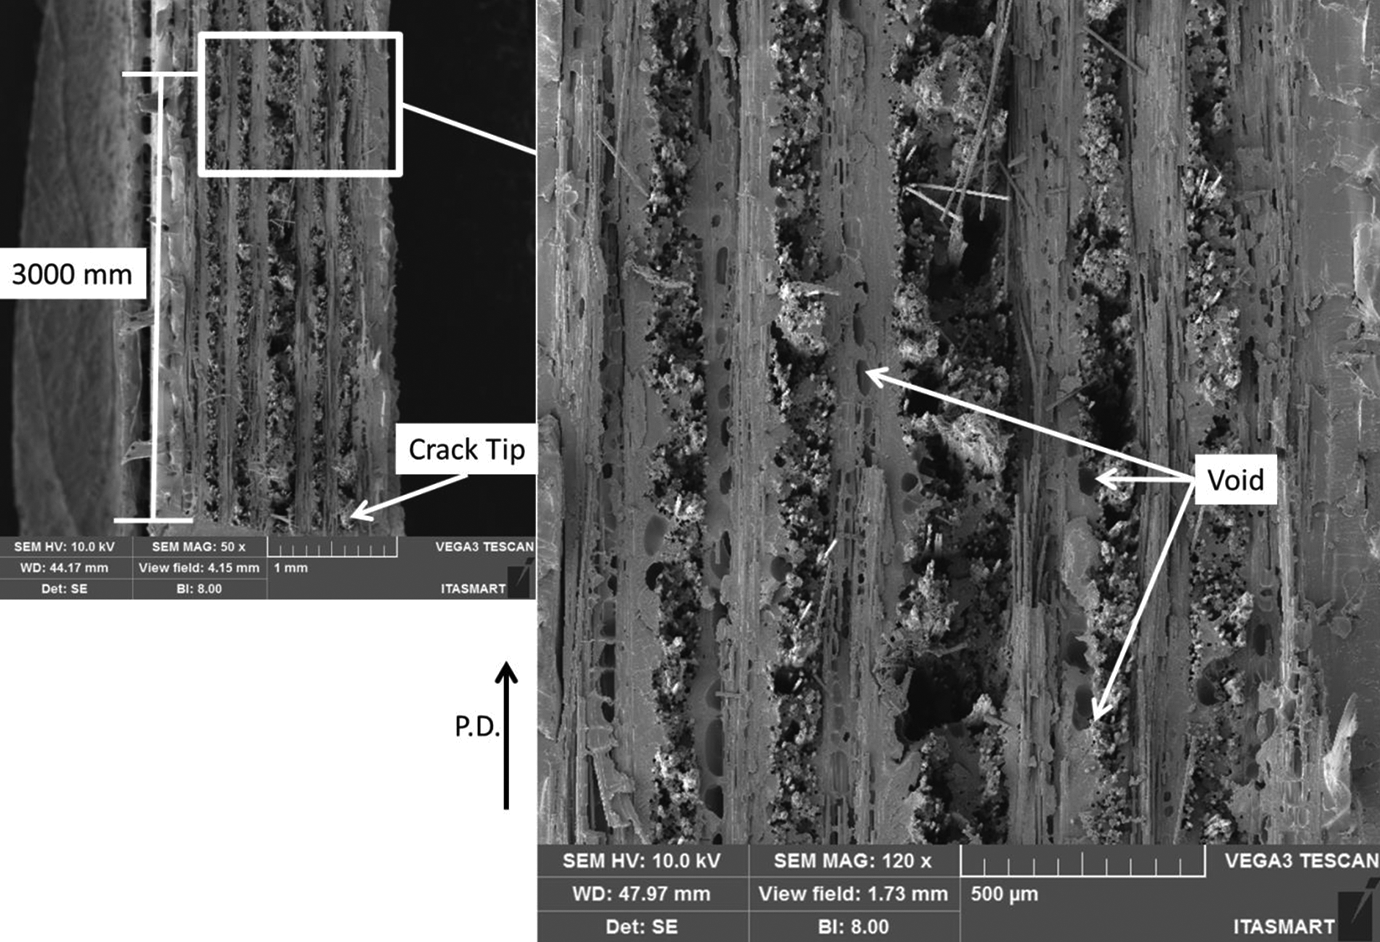
Porosity and voids were noticed as indicated in Figure 16. This figure presents a void pattern with measurement.
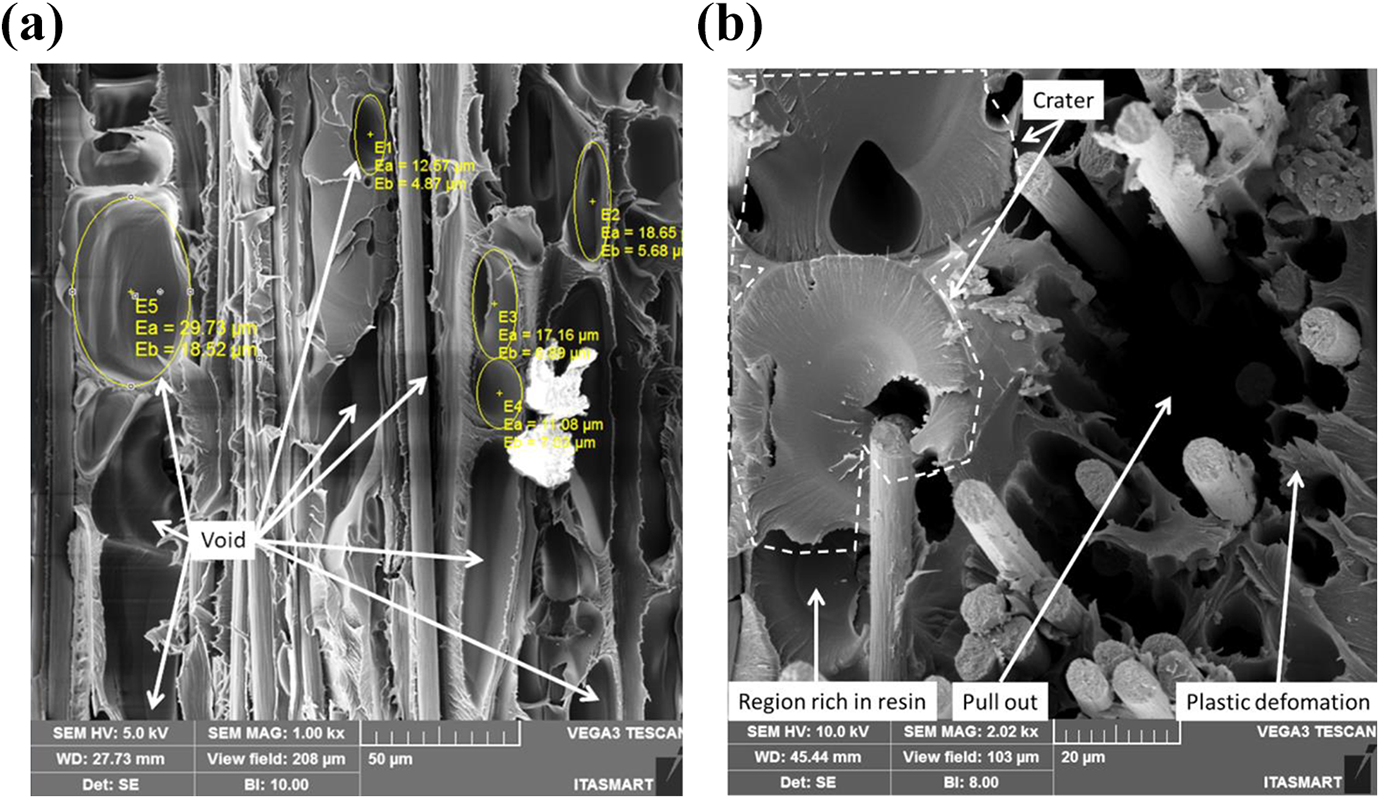
(a) Common void shapes and sizes. (b) Crater feature near crack tip.
As voids volume fraction estimated is 1.92 ± 0.02% (see Section Materials and manufacturing procedure), here it is shown a visual inspection of 2D fracture surfaces, following references.14,23,24 As Der Klift et al., 14 Dutra et al. 23 and Kikuchi et al. 24 demonstrated, there are voids on the transversal section for the CFRTP materials as well as between layers, among filaments and along fracture surfaces. Those voids come from 3D printing defects, material moisture and fracture effects. Each specimen had a visually different porosity disposition. Figure 17 shows a general view of the unidirectional specimens and Figure 18 shows a general view of the cross-ply specimens. The porosity over the matrix material is evident, which suggests stress concentrations points, decreasing the mechanical performance for properties such as delamination resistance, compression strength and transverse tension strength. 56 Besides, both Figure 17 and Figure 18 shows zoom out images of fracture surfaces, where is seen the same crack propagation direction for both unidirectional and cross-ply laminates.
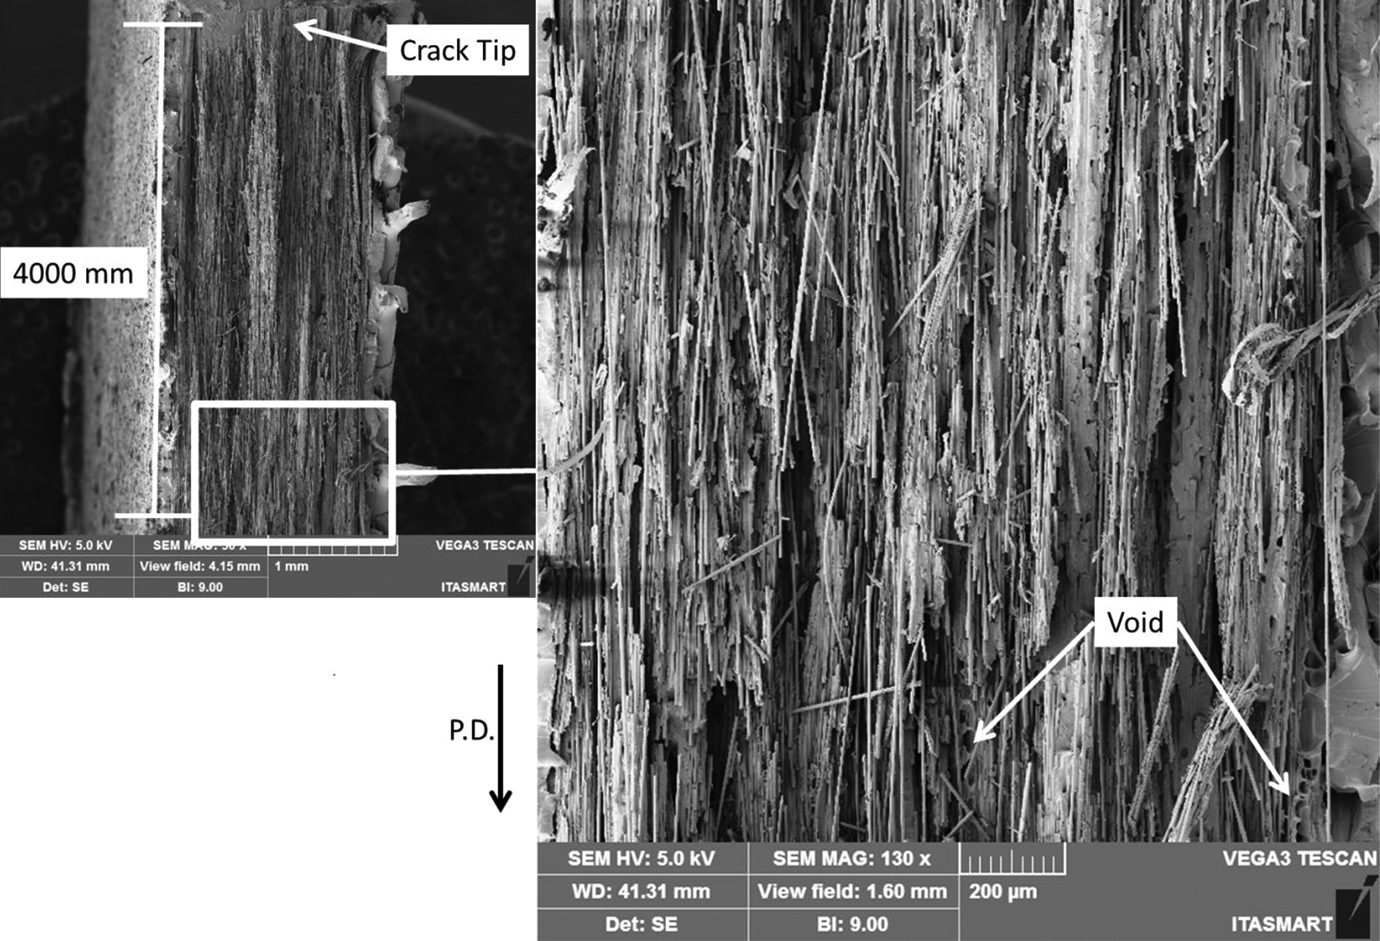
Unidirectional porous region of a coupon. P.D. is the progression direction of the crack, indicated by the arrow.
Cross-ply porous region of a coupon. P.D. is the progression direction of the crack, indicated by the arrow.
These voids are not continuous and their likely cause is the moisture absorbed by nylon matrix, considering nylon as a hygroscopic material, which absorbs humidity from the environment57,24 due to the presence of polar groups at nylon polymer chain structure. The hydrogen and oxygen atoms from the water bonds with the oxygen and hydrogen atom in the nylon polymer chain. This hydrogen bonded water molecule acts as a plasticizer, allowing the polymer chain to slide along one another, 58 promoting stiffness decrease. 59 Kikuchi et al. 24 have studied in more detailed the moisture effects on mechanical properties of the CFRTP.
Although plastic deformation was not considered in the calculated characterization of mode I fracture toughness, it was seen over some failure sections of tested samples. However, it is here considered not preponderant for final fracture toughness results, due to the following considerations: firstly, the stress
Conclusion
Additive manufactured continuous carbon fiber reinforced thermoplastic composites have been experimentally characterized in recent studies for important engineering quantities. The mechanical properties of nylon-carbon fiber composites, in particular that manufactured by Markforged® printer, have been of interest. However, there is a lack in the literature on the critical translaminar fracture toughness in Mode I for this additively manufactured composite material, which was the focus of the present work. The fracture toughness is a property that enables quantifying the resistance of material during a translaminar crack, and it is important for evaluations of fracture design requirements.
In this article, the critical Mode I translaminar fracture toughness KIc of a 3D printed CFRTP was evaluated in a linear elastic fracture mechanics approach. According to the final KIc results, a graph of association between the number of plies at 0° and 90° with the translaminar fracture toughness of the final laminate was estimated. Additionally, fractographic analyses were performed to correlate the results with the Mode I features. The obtained results permit to conclude that a lamina in 90° direction has the Mode I translaminar fracture toughness KIc into the same range as for polymers (about 80
Finally, fractographic analyses support the conclusion where the failure load performances for tested specimens were associated with the porosity of materials. These porosities were provided mainly by the manufacturing process and hygroscopic nylon matrix characteristic. Fractography also brings substantial features of the failure mode proposed and some local plastic deformations, which was disregarded to the results, since there were strong similarities between the linear and experimental DIC stress prediction techniques. Despite that, further works can bring more studies about the plastic deformation effects for this concept of composite material. The application of these results broadens what is known about fracture behavior of 3D printed continuous carbon fiber composites, being a first estimative to potential damage models with cross-ply CFRTP composites.
Footnotes
Acknowledgments
The authors thank the Laboratory of New Concepts in Aeronautics and Laboratory of Materials and Processes of ITA for the partnership in terms of resources and personnel support received during the development of this work.
Funding
The author(s) disclosed receipt of the following financial support for the research, authorship, and/or publication of this article: The research in this article was supported by Coordenação de Aperfeiçoamento de Pessoal de Nível Superior - Brasil (CAPES) - Finance Code 001, the National Council for Scientific and Technological Development (CNPq), process 407754/2018-0 and the SãoPaulo Research Foundation (FAPESP), process 2015/00159-5.