
Abstract
In the injection-molded parts, prediction of accurate warpage at initial level becomes mandatory to avoid iterative work of mold modifications. Simulation teams of many organizations are using existing commercial programs for process simulations. Material models in existing simulation technologies are having certain limitations and assumptions, which can regularly result in up to 50% variation of warpage results as compared to the actual physical warpage measurement. The commonly used Moldflow simulation model, for example, ignores temperature-dependent mechanical properties and the stress relaxation spectrum for viscoelastic materials. These assumptions affect the accuracy of the warpage prediction results significantly. To decrease these kinds of variations, BASF extended its Ultrasim® tool which is based on integrative simulation technology. Recently, a newly developed thermomechanical material model with temperature-dependent nonlinear mechanical properties and stress relaxation behavior was added in the Ultrasim. This model has been used in this work to consider the complete transient description of the warpage, which starts at packing phase of the part inside the mold, followed by actual cooling and ejection. In this article, unreinforced semicrystalline polybutylene terephthalate polymer material (Ultradur® B4520) is considered for warpage correlational study. The accuracy of the warpage prediction is compared between the integrative simulation approach, existing warpage simulation method, and the actual experimental inspection results. The result exhibits that the accuracy of the integrative simulation (Ultrasim)-based warpage simulation is relatively better than existing simulation technologies and closer to the actual measurement.
Introduction
In the injection molding process, warpage is a major problem, affecting the part quality of injection-molded parts. Because the exact amount of shrinkage and warpage is not known, at the beginning of the tool development, customers need several mold trials, which increases the time and cost to manufacture their parts. Warpage depends on the material, part geometry, and processing conditions. To make a good warpage prediction, all these effects need to be taken into consideration. If a reliable simulation model would be available, virtual mold modifications could be performed, reducing the time to production and saving costs.
In this subject or area, many research studies have been conducted to identify the factors that directly affect warpage behavior. While many effects have already been considered in existing material models, used by commercial software, such as Autodesk Moldflow, or Moldex3D, other factors haven’t been considered yet, which could be one of the reasons why warpage simulations sometimes can differ significantly to the observed warpage of molded parts. The effects that are not readily covered by most commercial injection molding programs are the effect of cooling rate on the pressure–volume–temperature (PVT) behavior and the viscoelastic behavior of the thermoplastic material, which causes stress relaxation. Also, fiber orientation has a big influence on the warpage of the parts made of fiber-reinforced materials and is still a topic of active research.
Important factors that influence warpage results are normally not considered, such as the effects of residual stress and viscoelastic behavior. Beomkeun and Juwon 1 studied the post-manufacturing thermal deformation of injection-molded parts. The authors used a simple stress lattice part and performed injection molding experiments to find out the deformation in post-manufacturing thermal cycling. Process analysis and finite element analysis (FEA) were performed to describe the deformation in the thermal cycle. The results of these analyses were close to the experimental results. He found that the residual stress formed during the injection molding process was one of the causes of the permanent deformation. Chang-Yue Shen and Hai-Mei Li 2 studied correlation of warpage prediction with residual stresses. He considered thermo-viscoelastic behavior neglecting the flow effect. FEA simulation was done with time-dependent domain. The result predicted the significant role of mold cooling, which impacts the warpage results when performed numerically. Fen et al. 3 studied and adopted a thermo-viscoelastic model for stress simulation, which considers packing and cooling stages comprehensively. The authors compared simulation results based on thin shell theory with practical results and found a better prediction through the new method. Kabanemi and Crochet 4 studied and developed a three-dimensional (3D) method for accurate prediction of residual stress calculation in injection molded parts, by considering thermo-viscoelastic stress during cooling. He also identified the limitation in this method and concluded its suitability for small displacement only. Rezayat and Stafford 5 studied transversely isotropic thermo-viscoelastic model, for injection molded thermoplastic parts and briefly discussed measurement techniques and their limitations. The authors found an accurate representation of the state of stress in polymer which requires viscoelastic formulation. One of the assumptions in their work is no-slip condition at the interface between the mold and the part after solidification. Another assumption is the behavior of the part is completely elastic after ejection from the mold. Yuanxian et al. 6 studied numerical simulation with the finite element method (FEM) for the prediction of thermally induced warpage and residual stress of injection molded parts generated during the cooling stage. Simple two-dimensional thermo-viscoelastic material model is used in numerical calculations. Based on the elastic response at every time step, the authors considered full time-dependent algorithm. They compared numerical results with experimental results and found that temperature imbalance is the primary factor for warpage. Zhneg and Kennedy 7 studied detailed thermo-viscoelastic formulation, for the simulation of thermal and pressure-induced residual stresses, in injection molded short fiber-reinforced thermoplastics parts. They also used a rotary diffusion equation for the calculation of flow-induced fiber orientation. The authors validated this theory for three examples and based on the results, they observed that this method can be used for more accurate warpage prediction.
The effect of cooling rate on PVT is another factor for warpage, which is precisely not considered in simulation. In most of the material models, people use low cooling rate-based PVT data, however in reality, during the injection molding process the cooling rate observed is much higher. Due to this difference in the existing material models, it is directly affecting the warpage prediction. To overcome this type of situation, Freytag and Perez 8 measured PVT data using pirouette dilatometer apparatus at a higher cooling rate for polypropylene material. They used high cooling rate PVT data and existing low cooling rate PVT data for the simulation of the part and found significant improvement in the warpage results. Chang et al. 9 studied that the cooling rate effect with the modified Tait equation plays an important role for the warpage prediction. Their study showed that nonequilibrium PVT model is closely correlated with the experimental results. Sanchez et al. 10 focused on warpage results by iterating cooling parameters and using the noncontact technique. Result shows significant warpage changes by varying cooling condition. Thomas et al. 11 showed the effect of transition temperature on warpage results. Transition temperature for amorphous and semicrystalline polymers using differential scanning calorimetry at different cooling rates was determined. Transition temperature was used in the injection molding simulation software to calculate warpage. Simulation results were compared with the experimental results and found that higher cooling rate base transition temperature model gives better results. Xianjun et al. 12 used the modified PVT curve for polypropylene material, which is based on high cooling rate and prepared a new model used for warpage simulation in Abaqus. The authors compared these results with the actual coordinate measuring machine-based measurement results. It is found that high cooling rate-based PVT data give better warpage as compared to low cooling rate-based PVT data. Also, in another article 13 they investigated inconsistency in warpage results for semicrystalline material. The authors also found that residual stress calculation is also another factor, along with high cooling rate-based material model, which plays a significant role for improvement of warpage prediction. Zuidema et al. 14 studied that, in numerical simulation, accurate description of PVT data is important. They studied PVT data at a different cooling rate and found that by increasing the cooling rate, crystallization temperature shifts toward lower temperature.
Based on the above literature, it is observed that still a lot of research and validation is required to improve the warpage prediction with simulation models. In the next chapter, a detailed warpage analysis methodology has been described for existing as well as new integrative simulation technology. The results obtained from the traditional injection molding simulation method (Moldflow) and a new integrative simulation method Ultrasim® have been correlated with the actual experiment/inspection results.
Methodology
Material selection and properties
The accuracy of CAE Simulation depends on many factors such as description of the part geometry, boundary conditions, and the material model used. These factors have drastic influence on the output of the simulation. There are numerous material models available in the modern CAE software tools and all of these can gauge different material characteristics, which will play an important role in the material selection.
The following factors are important to understand the precise behavior of a thermoplastic material, such as nonlinear viscoelastic behavior, strain rate-dependent behavior, stress–strain asymmetry in tension and compression, temperature-dependent behavior, anisotropic or direction-dependent behavior (this property is important when the material type is thermoplastic fiber-reinforced material), and moisture-dependent behavior (is important only when material absorb more moisture, e.g. polyamide material). Last two factors such as anisotropic and moisture-dependent behavior is not important for this study as we are considering unreinforced polybutylene terephthalate (PBT) material. The following Figures 1 to 3 are useful to understand the general behavior of a thermoplastic material, these are not limited to the material considered for this study (Ultradur® B4520).
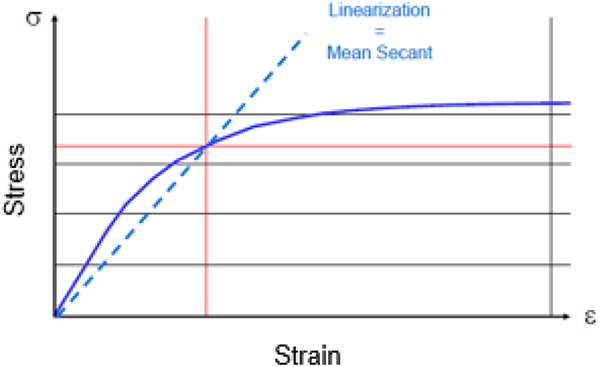
Nonlinear viscoelastic stress–strain.
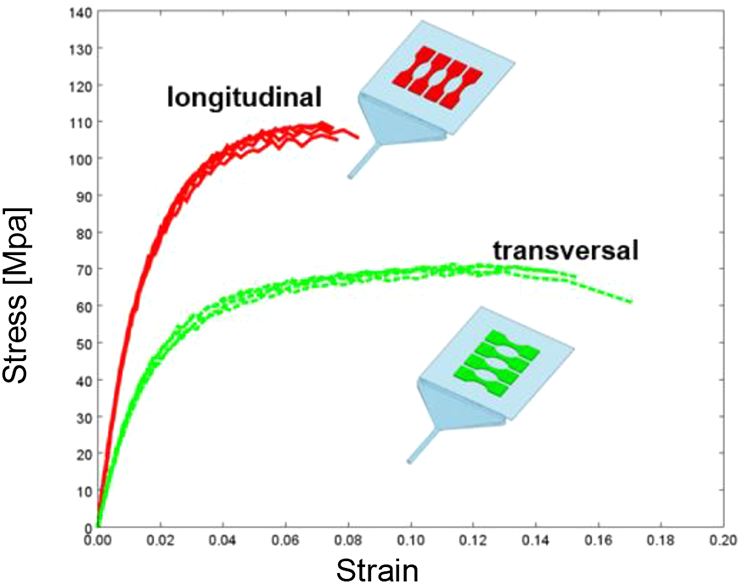
Stress–strain curves of plastic material showing anisotropy.
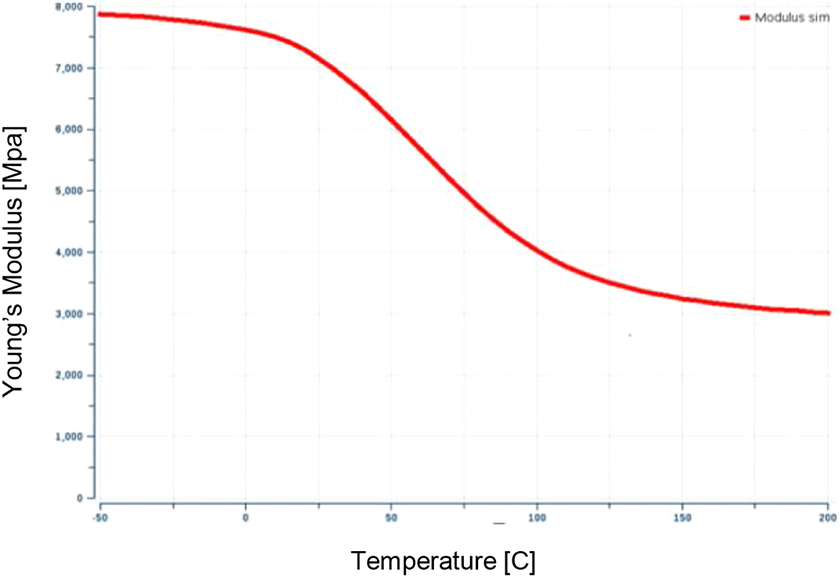
Young’s modulus as a function of temperature.
Figure 1 shows that the behavior of a thermoplastic material is highly nonlinear, with a limited portion being elastic in nature. Figure 4 shows that strain rate-dependent behavior for thermoplastic material at different loading speed is different. It is very important, especially during a crash or explicit simulation. Figure 2 shows that for glass-filled material, tensile strength in the longitudinal directional is higher than the tensile strength in transverse direction. This is called anisotropic behavior, which is mainly due to the fiber orientation. Figure 3 shows variation of Young’s modulus with respect to temperature. Using BASF’s Ultrasim tool through integrative simulation approach, we can cover all these factors simultaneously to get more accurate warpage prediction.15–20
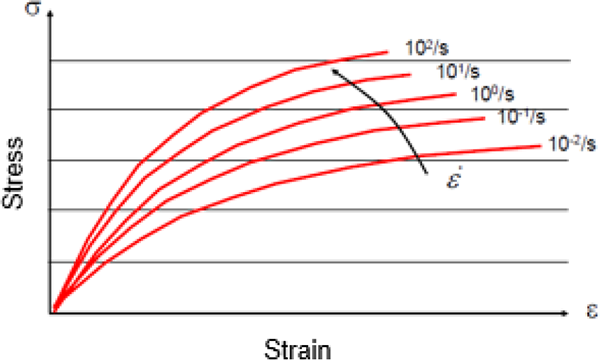
Strain rate-dependent stress–strain.
In this study, BASF Ultradur B4520 material is considered. This unreinforced semicrystalline PBT material has been selected to avoid the predominant anisotropic shrinkage caused due to fiber orientation. Thus, our focus is only on the isotropic shrinkage caused due to pressure and temperature history of the material during the molding process. However, anisotropic shrinkage can be also caused in unreinforced semicrystalline polymers because of the structure development (crystallinity) as the melt solidifies. However, measurements have shown that this effect is negligible for the chosen material. Ultradur B4520 is also nonsensitive to moisture absorption and hence the properties of the dry state have been considered for simulation. Data for Ultradur B4520 were developed at BASF Laboratories, followed by preparation of the new material model. The correlation between the experimental or measured data and the characterized data from the new material model has been carried out. The material data correlation results have been discussed in the next chapter.
Material model validation on tensile bar
For calibration and validation, the material model measurements have been performed on specimens taken from the injection-molded plaque. Tensile bars have been cut out from the plaque and measured in a high-speed tensile test machine. 17 It is observed that the stresses can be predicted well for the measured strain rates between 0.1 s−1 and 100 s−1 for an experiment performed at room temperature (Figure 5). It is also observed that the material tends to be more brittle with the increase in strain rate and vice versa. This phenomenon is very important during the exposure of this material to impact or dynamic loading.
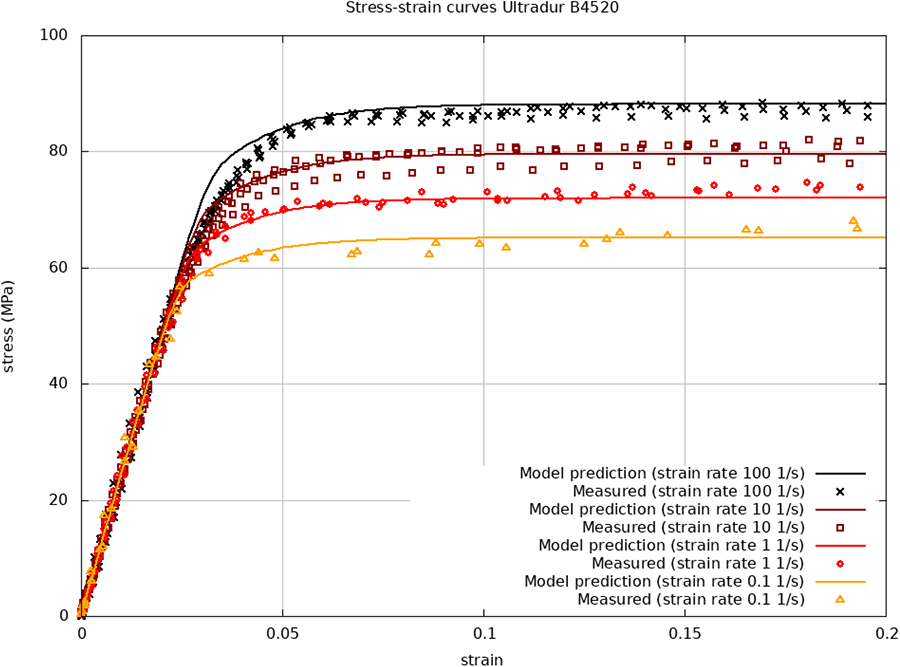
Stress–strain versus experiment (measured).
From the same plaque geometry, additional specimen has been cut out to measure the thermal behavior. Using the thermomechanical analysis device, the specimen was heated from room temperature up to 180°C. The resulting strains were found to be an isotropic and the total strain compared to the model prediction (Figure 6). It is observed that both the mechanical and the thermal behavior of the material can be reproduced well by the model. Additionally, the model enables to extrapolate the data for different strain rates and temperatures. It is also observed that with the increase in temperature strain also increases. This phenomenon is important to capture the degradation of material due to change in temperature.
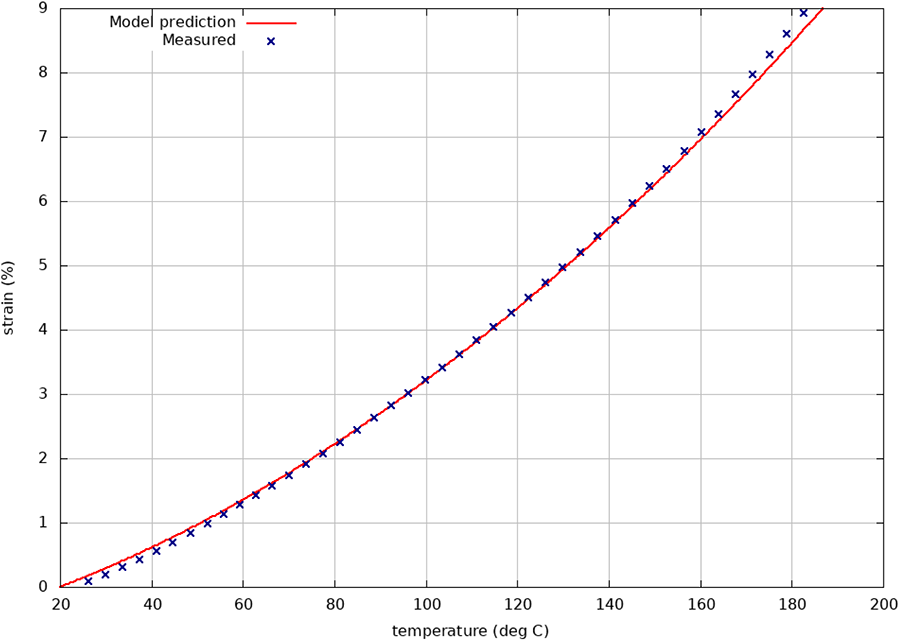
Total thermal strain versus experiment (measured).
PVT diagram describes the dependence of specific volume on melt temperature and pressure. Figure 7 shows three variations or zones in the PVT curve. First zone is called as the melting zone; in this zone, above the crystallization temperature the material is in melting condition. The second zone is called as crystallization zone; in this zone, there is a sharp volume change with decrease in temperature. In the crystallizing zone, the volume change of the polymer not only depends on the temperature but also on the crystallization of the polymer. The third zone is called as solid zone; in this zone, the material is in solid condition and the change in specific volume is relatively lower.
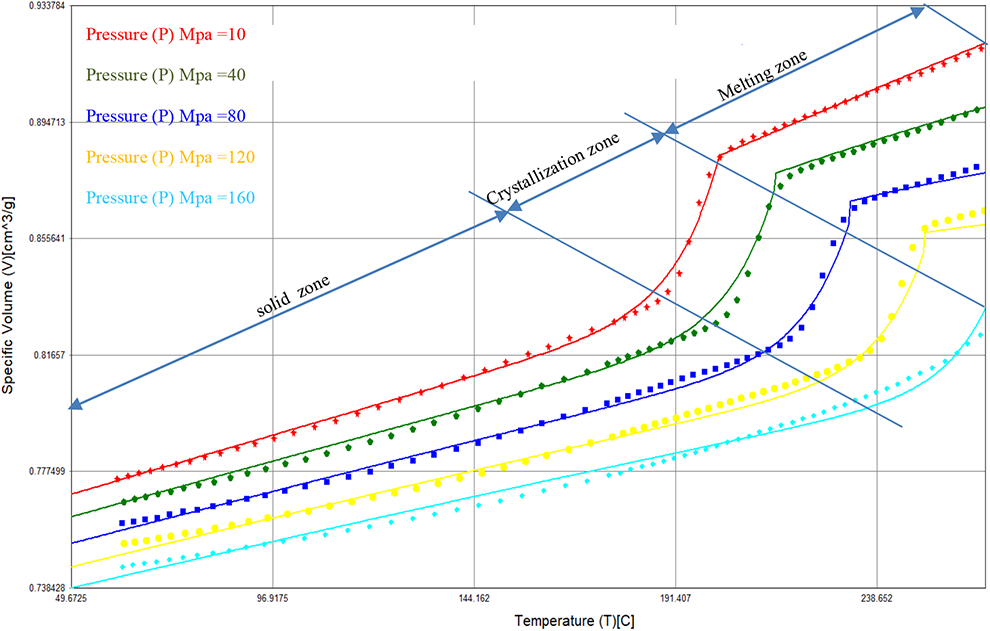
Pressure–volume–temperature versus experiment (measured).
The integrative approach requires the use of shrinkage data from the injection molding simulation to predict the final deformations. A PVT model is required to predict shrinkage after filling and packing. Figure 7 shows PVT properties of the Ultradur B4520 material. In this study, it is observed that the measured data (dotted points) can be reproduced well by the Tait model (continuous line) for pressure levels up to 160 MPa.
The subsequent chapters explain details about correlation study carried out for two industrial components using this upgraded BASF Ultrasim model.
Components selection
For further validation of this approach on actual parts, two components have been selected, namely an electrical motor fan and a covering box, provided by “Max Enterprises” Plastic Processing Unit located at Pune (Maharashtra, India). The selected components are geometries with medium geometric complexities, which includes flatness, curvature, circularity, ribs, uniform and nonuniform thickness variation, and so on. The reason for choosing these components is to find the impact of the geometric shape on warpage results prediction by a new material model.
Figure 8 shows a sample computer-aided drafting (CAD) model of the motor fan and the covering box with its overall dimensions and cross-sectional view.
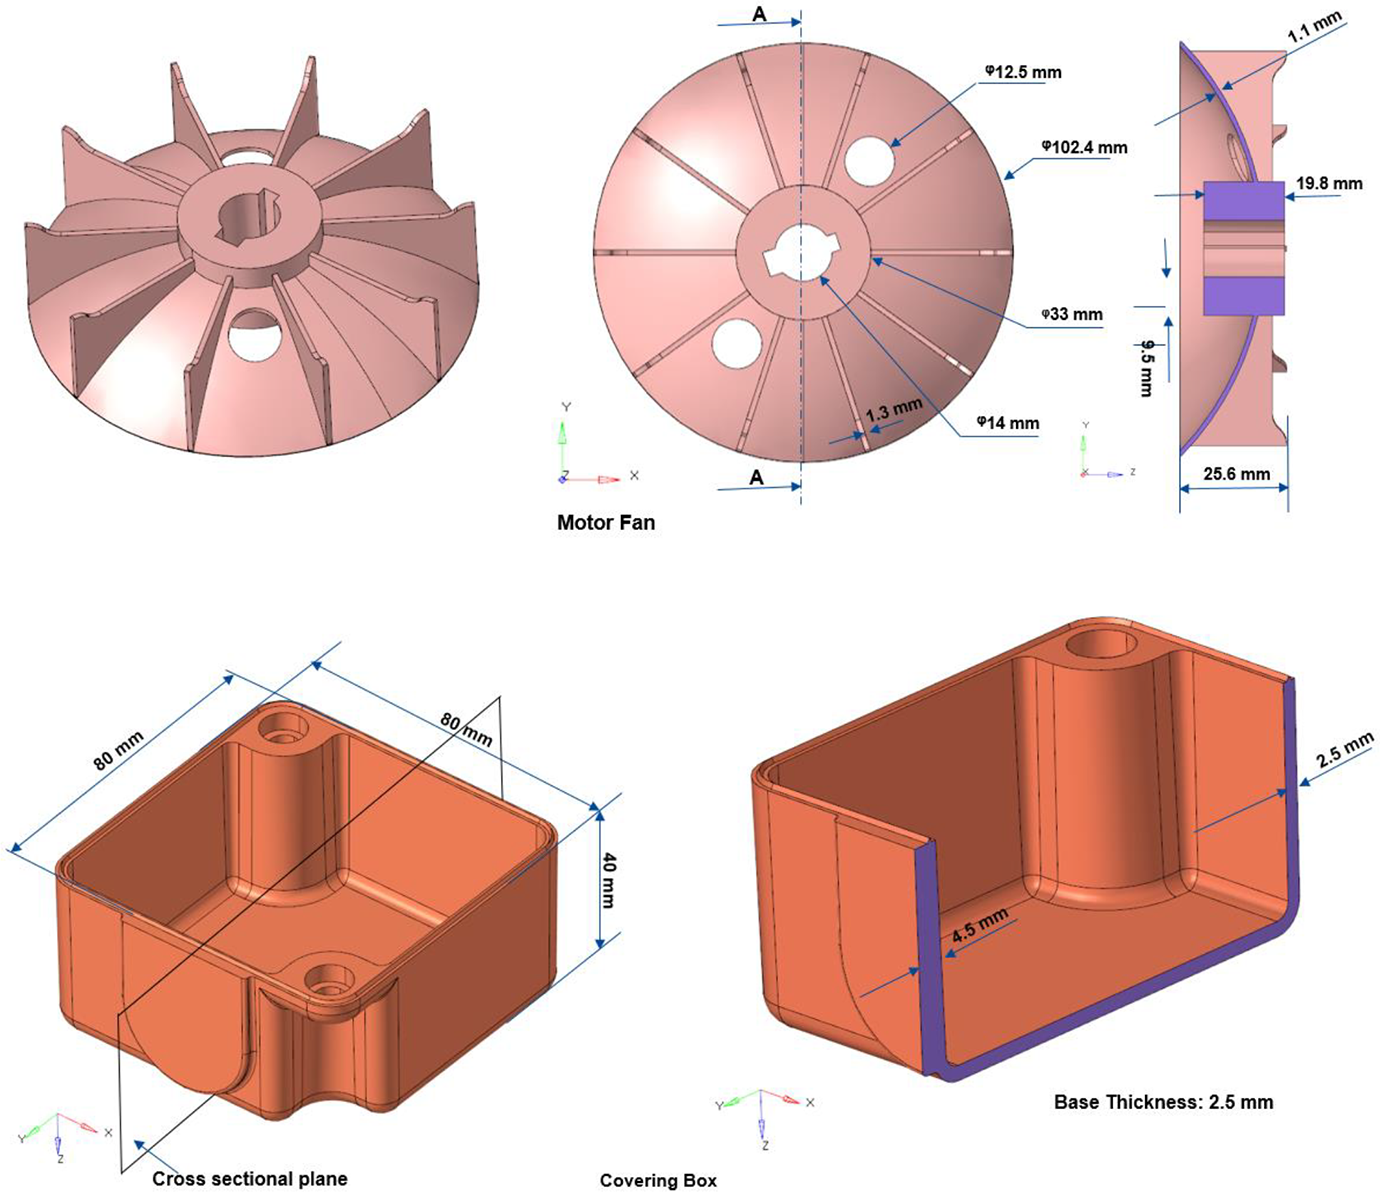
CAD model of the motor fan (top) and the cross-sectional view of the covering box with its dimensions (bottom).
Manufacturing parts by injection molding
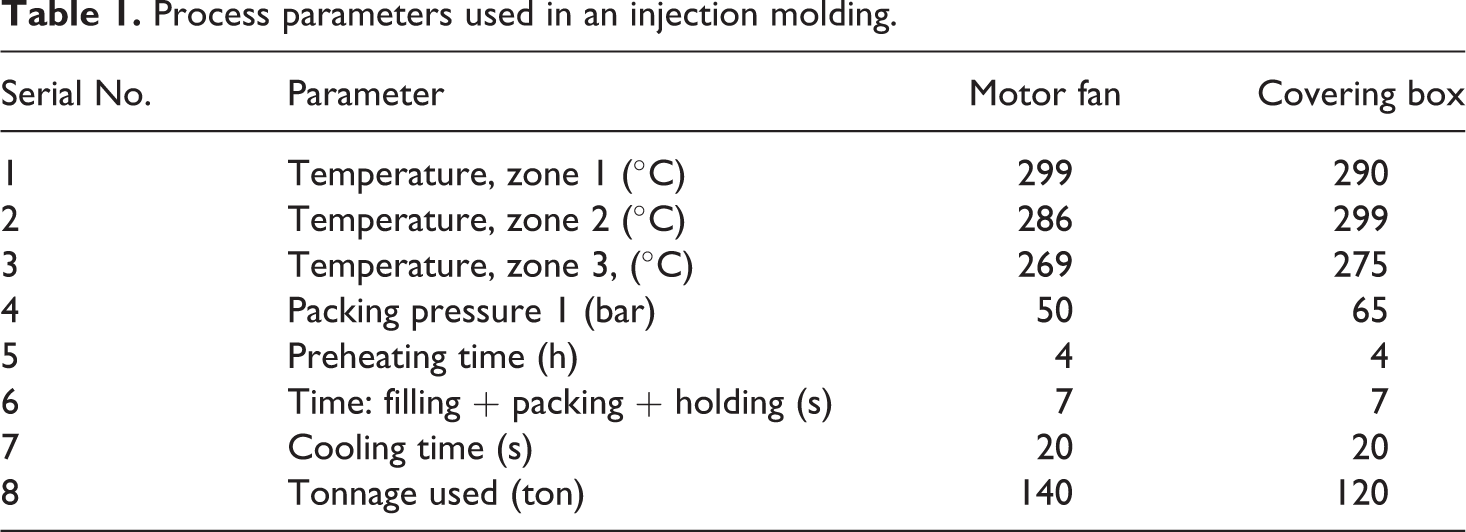
The component has been manufactured with the injection molding machine of 150-ton capacity. The process parameters are mentioned in Table 1 for both the components.
Process parameters used in an injection molding.
The edge gate and submarine gate is used for filling material in the cavity for motor fan and covering box, respectively. Figure 9 shows the actual physical components with the gating system.
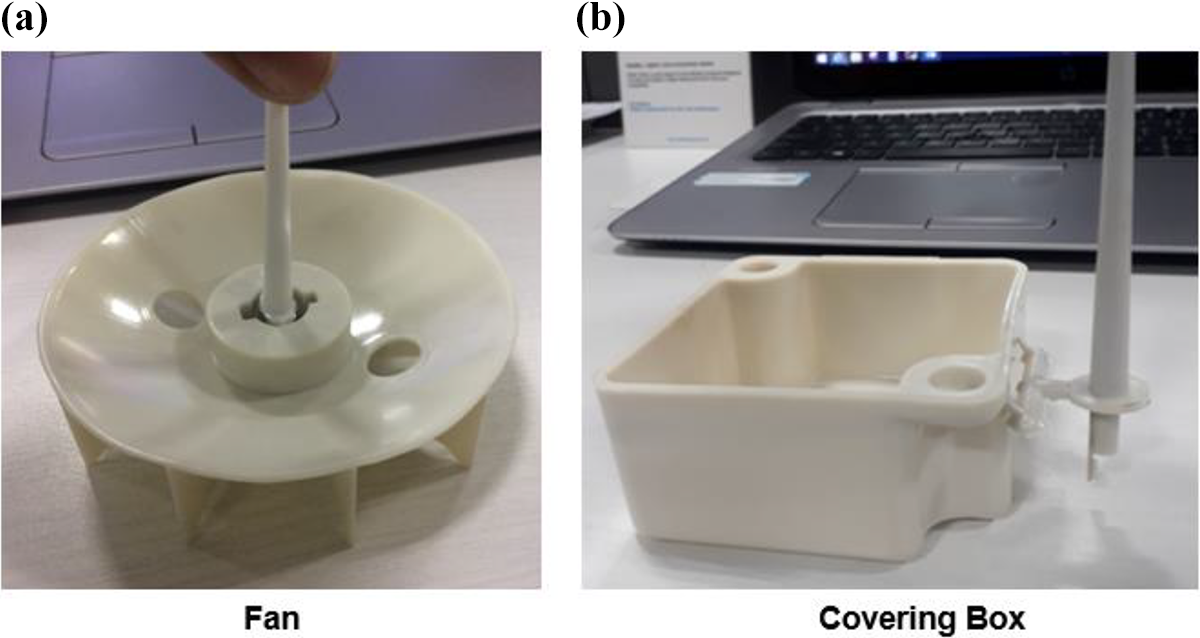
Actual physical components manufactured by injection molding: (a) fan and (b) covering box.
Injection molding simulation: Existing simulation method
The commercial injection molding package by Autodesk Moldflow is used to perform the injection molding simulation. The analysis sequence is chosen as fill + pack + warp for warpage evaluation.
The outer surface of the CAD model has been discretized with Altair HyperMesh pre-processor software. The average element size is kept 2.0 mm on the outer surfaces. The internal volume mesh for the subsequent mechanical analysis with Abaqus is generated by an auto mesh generator, with at least two rows of element across the thickness of the component. The Moldflow mesh uses 10 layers and is meshed directly within Moldflow. The gate system is modeled with 1D structural beam elements and assigned to appropriate cross-sections per the physical system. Figure 10 shows the process simulation model and the gate system with dimensions. The injection location and the process parameters, namely temperature, pressure and injection time, packing time, and cooling time are defined per the actual injection molding process parameters, as mentioned in Table 1.
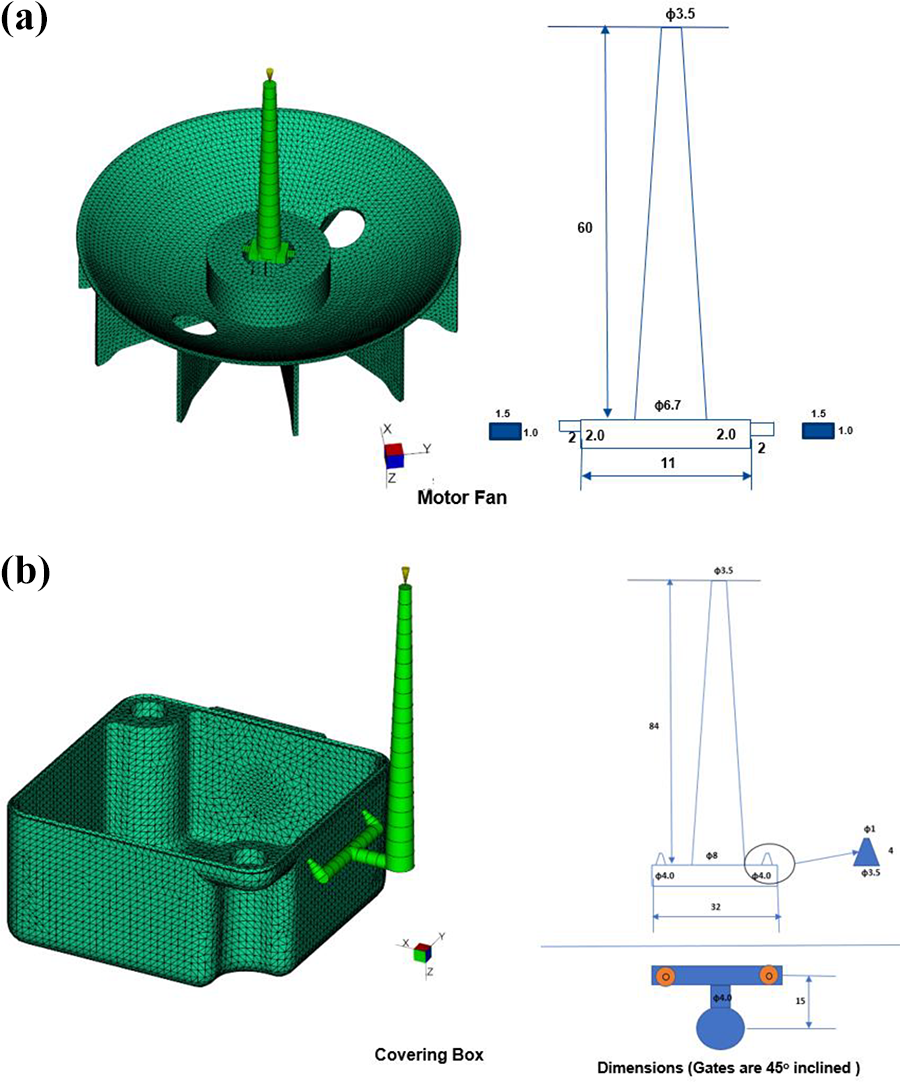
Process simulation model, gate system, and its dimensions: (a) motor fan and (b) covering box.
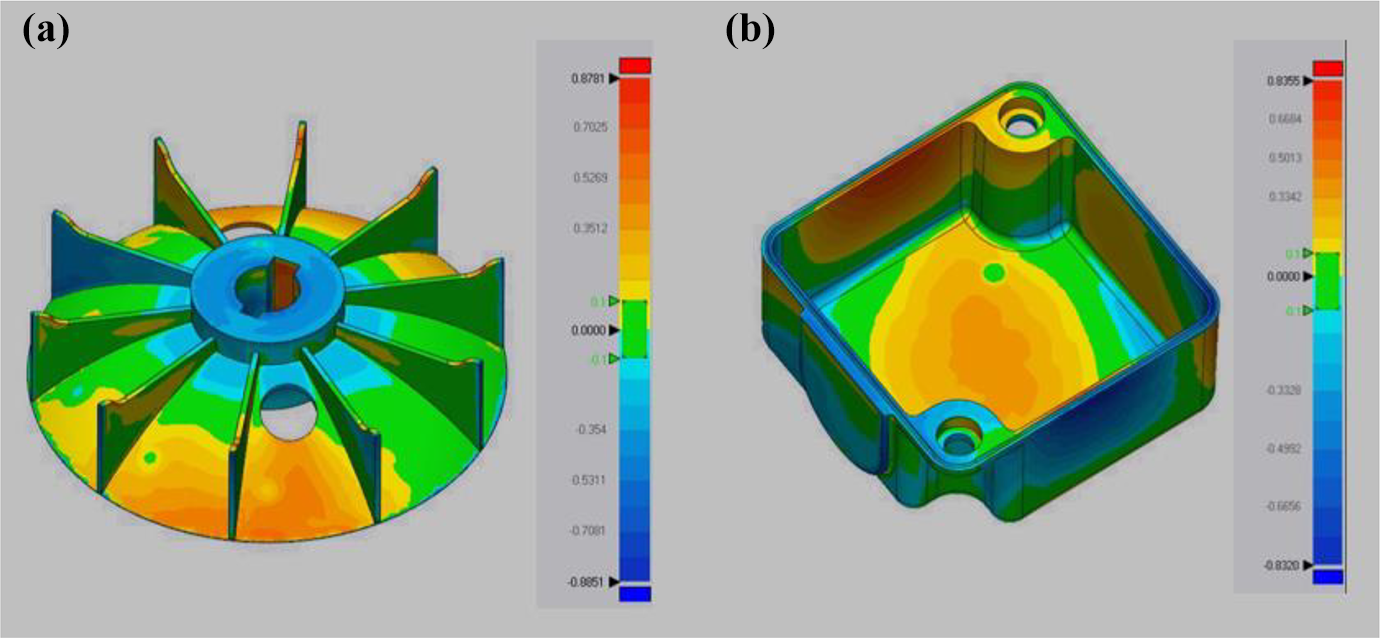
The process simulation results such as fill pattern, temperature at flow front, temperature, share rate, volumetric shrinkage, and warpage have been post-processed with Autodesk Moldflow viewer. The time required for filling, packing, and cooling is also verified with respect to the actual molding process. The warpage deformations are extracted for predefined points as shown in Figure 13. These results are used for correlation study with the actual inspection test results. Figure 11 shows a typical mold filling and warpage results.
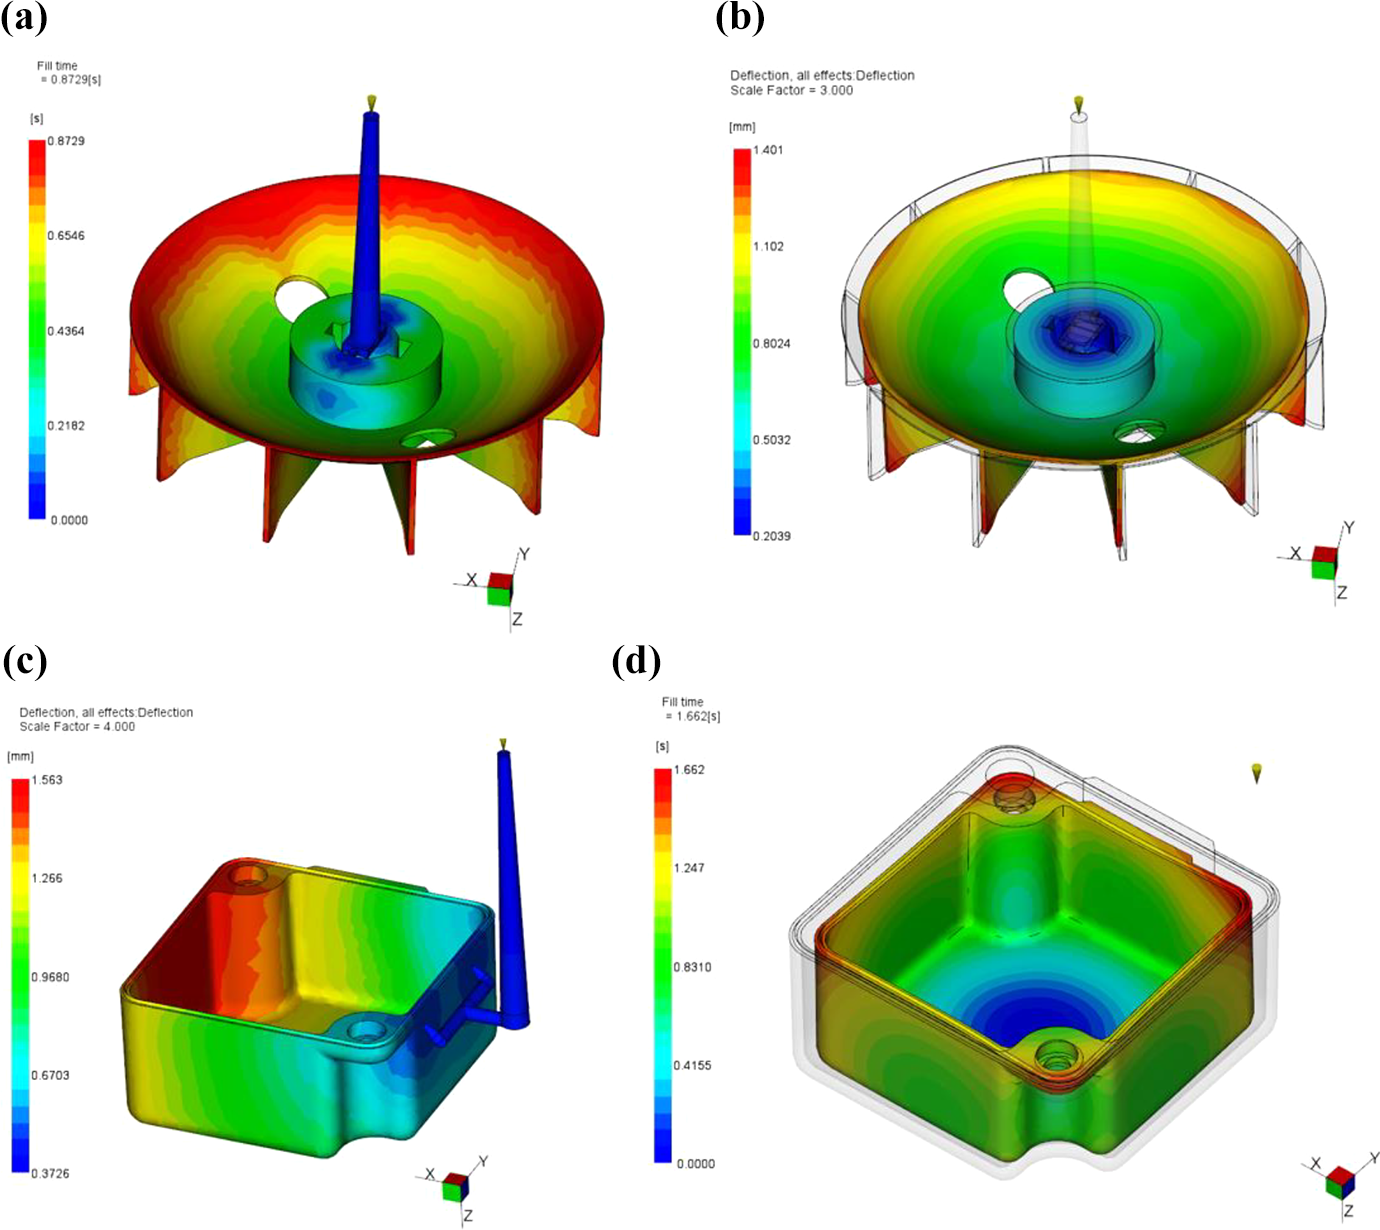
(a to d) A typical filling and overall warpage plot of process simulations.
New integrative warpage simulation approach
The new integrative simulation approach uses BASF proprietary Ultrasim software to simulate the warpage behavior. It considers the output from the process simulations to build a new mapped model for the warpage simulation. This new model is used to run FEM simulation through Abaqus solver for simulating the whole injection molding process again, followed by evaluating the results such as deformation and temperature. This new approach has been developed by considering the following points which are not considered in the traditional process simulation. Nonlinear thermomechanical behavior which is closer to real condition. Factors such as variable temperature, stress relaxation, and transient cooling. It also considers warpage/deformation after ejection with transient cooling to room temperature. The effect of mold constraints on shrinkage and warpage.
The finite element model is used as a base model for the mapping process. The components are modeled with second-order tetrahedron elements with an average element size of 2.0 mm. The output results from process simulation (e.g. temperature, pressure, density, and volumetric shrinkage), the temperature-dependent material properties and corresponding rheological properties are used as input for mapping process. Mapping has been done with the help of BASF-developed Ultrasim software. Appropriate loading and boundary conditions are applied to solve the finite element matrix equation. A newly mapped file from this integrative approach is solved with commercially available finite element solver, for example, Abaqus solver.
The simulation starts with the first increment, at the start of mold filling, that is, melt temperature for material and ends at normal ambient temperature (23°C). The solver automatically takes in-between increments per the convergence requirement.
Results of the solved files are post-processed with Altair HyperView. The results of predefined points as shown in Figure 13 are considered for co-relation study. The next chapter includes the scanning results and the methodology.
Inspection: 3D scanning
After warpage simulations, the physical components have been inspected at Solid Vision laboratory, Mumbai, Maharashtra, India, using Einscan Pro Plus 3D Scanner and Geomagic Control X for the inspection report. The component is physically scanned, and the 3D data have been generated, which is used for evaluating deviation with respect to the original CAD model. Figure 12 shows a typical 3D scanning result.
(a and b) Typical 3D scanning results.
Inspection results are reported based on the predefined points as shown in Figure 13 which are further used for co-relation as base results, as explained in the next chapter.
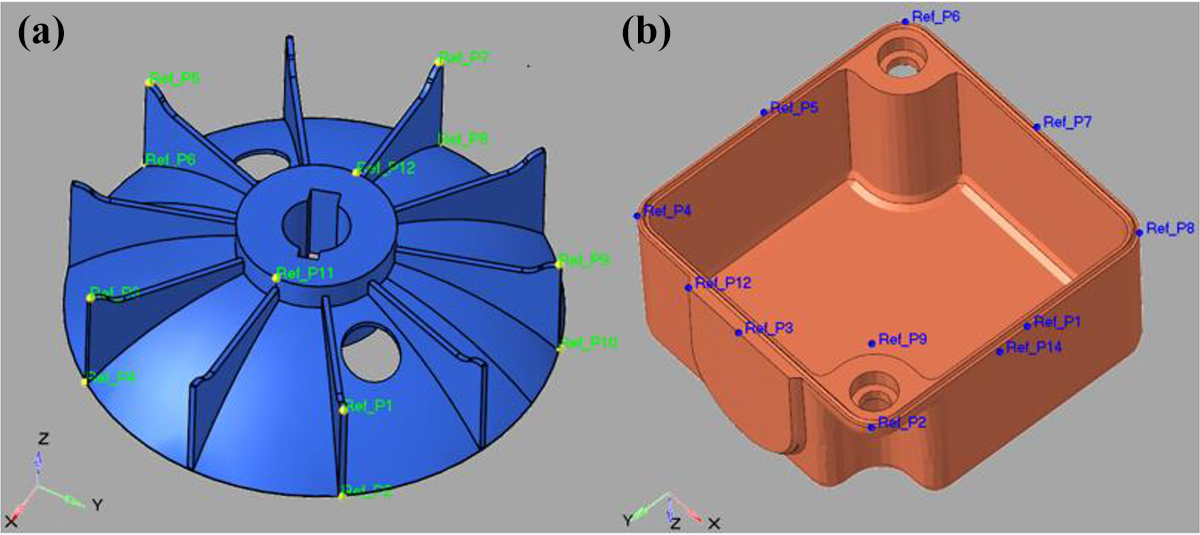
Reference points on the (a) motor fan and (b) the covering box CAD model.
Results of co-relation study: Existing, integrative, and experiment inspection
The co-relation study has been carried out for the results of existing Moldflow process simulation, integrative simulation approach, and actual experimental inspection. The reference points are defined on the CAD model. The results pertaining to those reference points as shown in Figure 13 are taken from simulation and inspection for comparison purpose.
The reference points are selected on the edges and the bottom surfaces of the model. While selecting the reference points, maximum deflection locations from simulation results and visual inspection are also considered. A typical warpage plot of the existing process simulation, integrative simulation method, and 3D scanning results are shown in Figure 14. From the warpage results, it is observed that the pattern of deformation is similar for all three approaches.
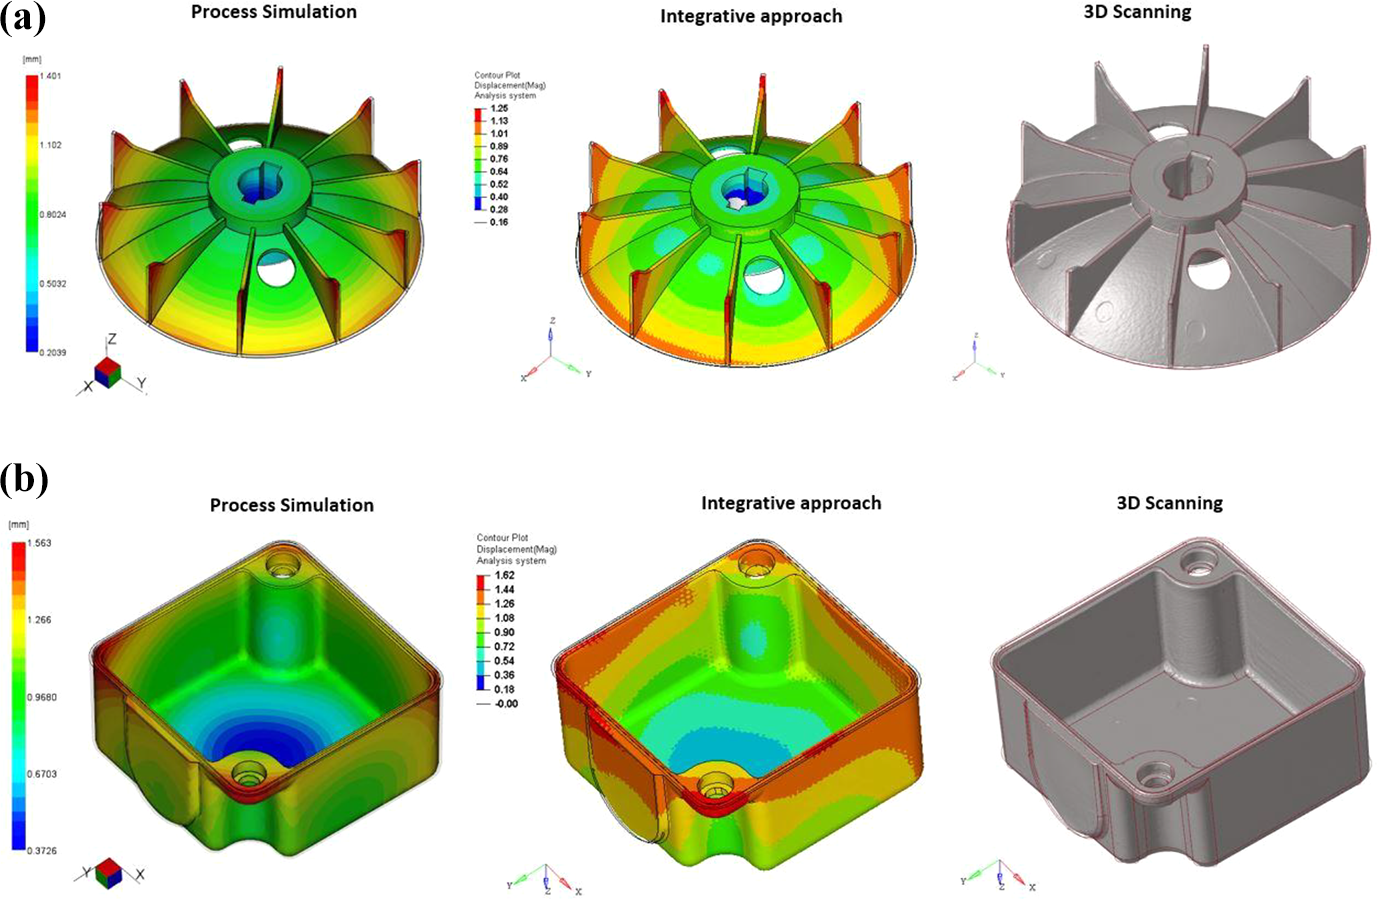
A typical warpage results comparison plot of process simulation, integrative approach, and 3D scanning points: (a) motor fan and (b) covering box.
The deformations measured at the reference points are plotted on the Y-axis and the point numbers are plotted on the X-axis. Figure 15 shows comparison results for motor fan component, and Figure 16 shows comparison results for covering box component.
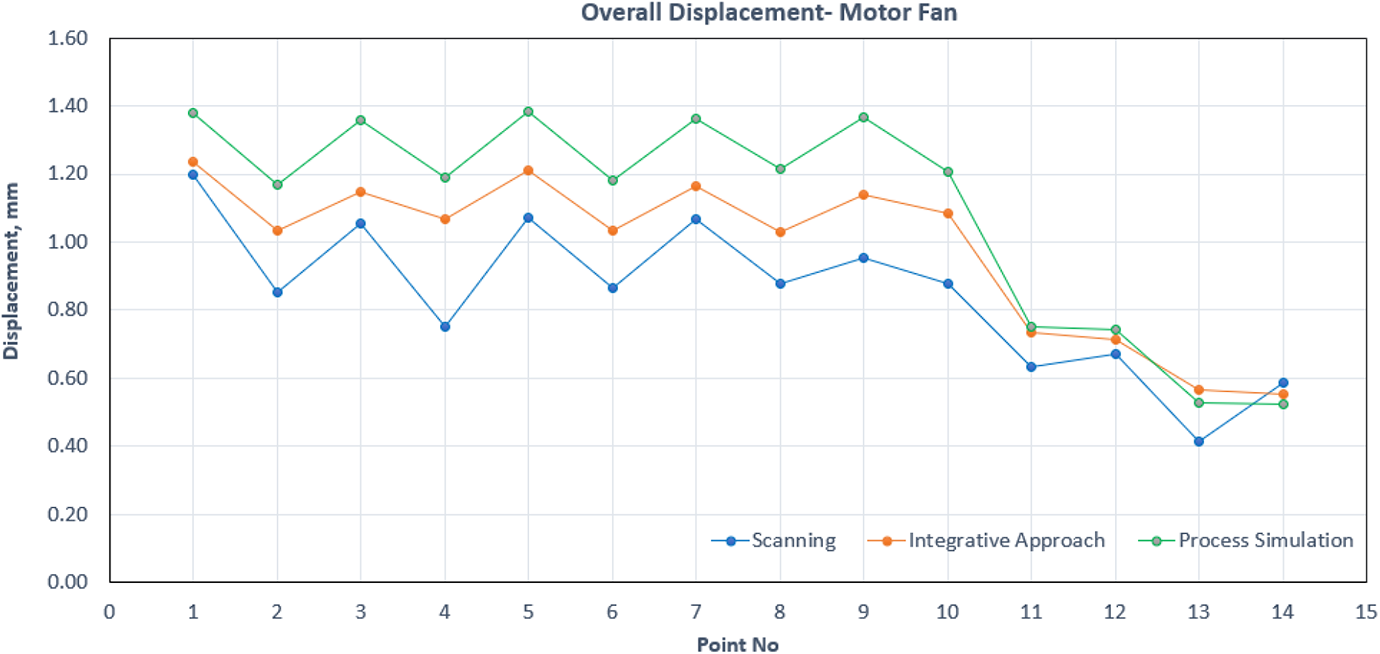
Warpage on reference points for scanning, process simulation, and integrative approach for motor fan.
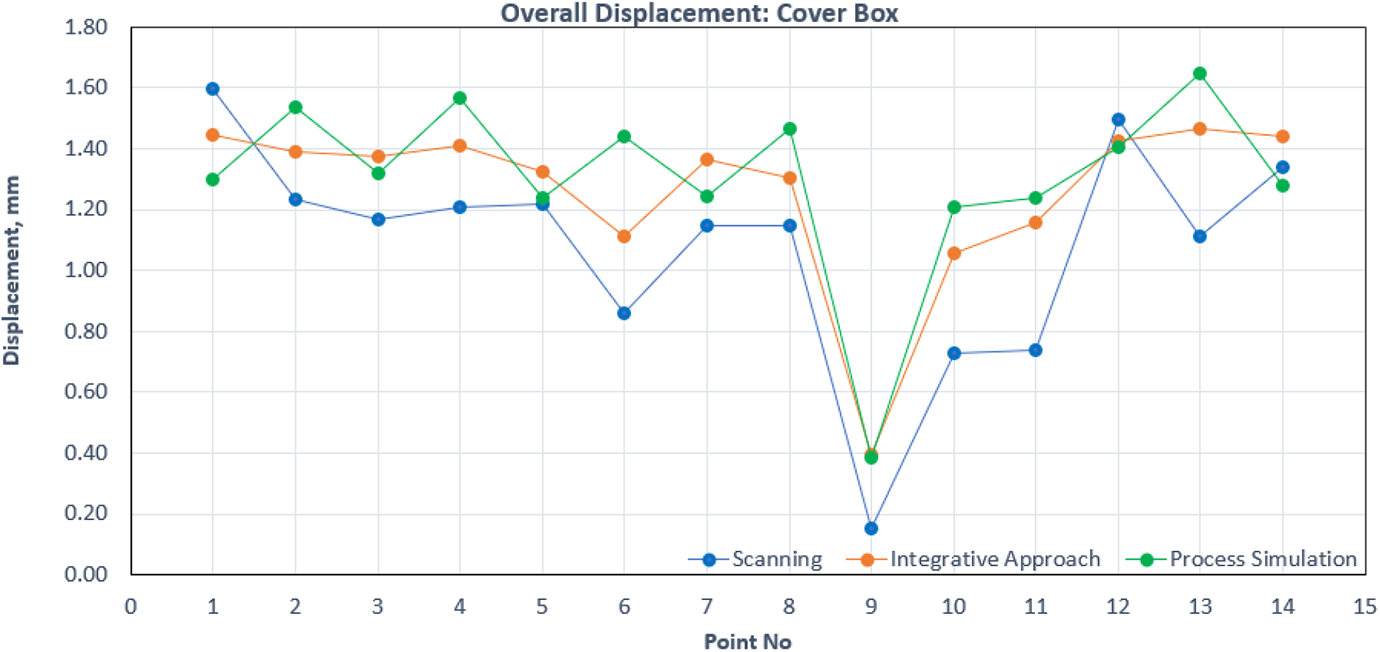
Warpage on reference points for scanning, process simulation, and integrative approach for covering box.
Figures 15 and 16 show the graphical results comparison per the reference points plotted in Figure 13 for motor fan and covering box, respectively. For motor fan component, it is observed that all the three method results show a similar pattern. However, for magnitude point of view, the integrative simulation results are closer to the actual inspection results (which are 12% better than the process simulation results, refer Figure 17). In the case of covering box component, it is observed that at few points, existing process simulation results are closer to the scanning results and at the remaining points integrative simulation approach is closer to the scanning results (which are 6% better than process simulation results, see Figure 18). Reference points 6, 8, and 13 show the existing process simulation results display opposite behavior as compared to scanning results. At the same points, the integrative simulation results follow the same pattern as the scanning results. Overall, the trend shows that integrative simulation results are closer to the scanning results and better than the existing process simulation results.
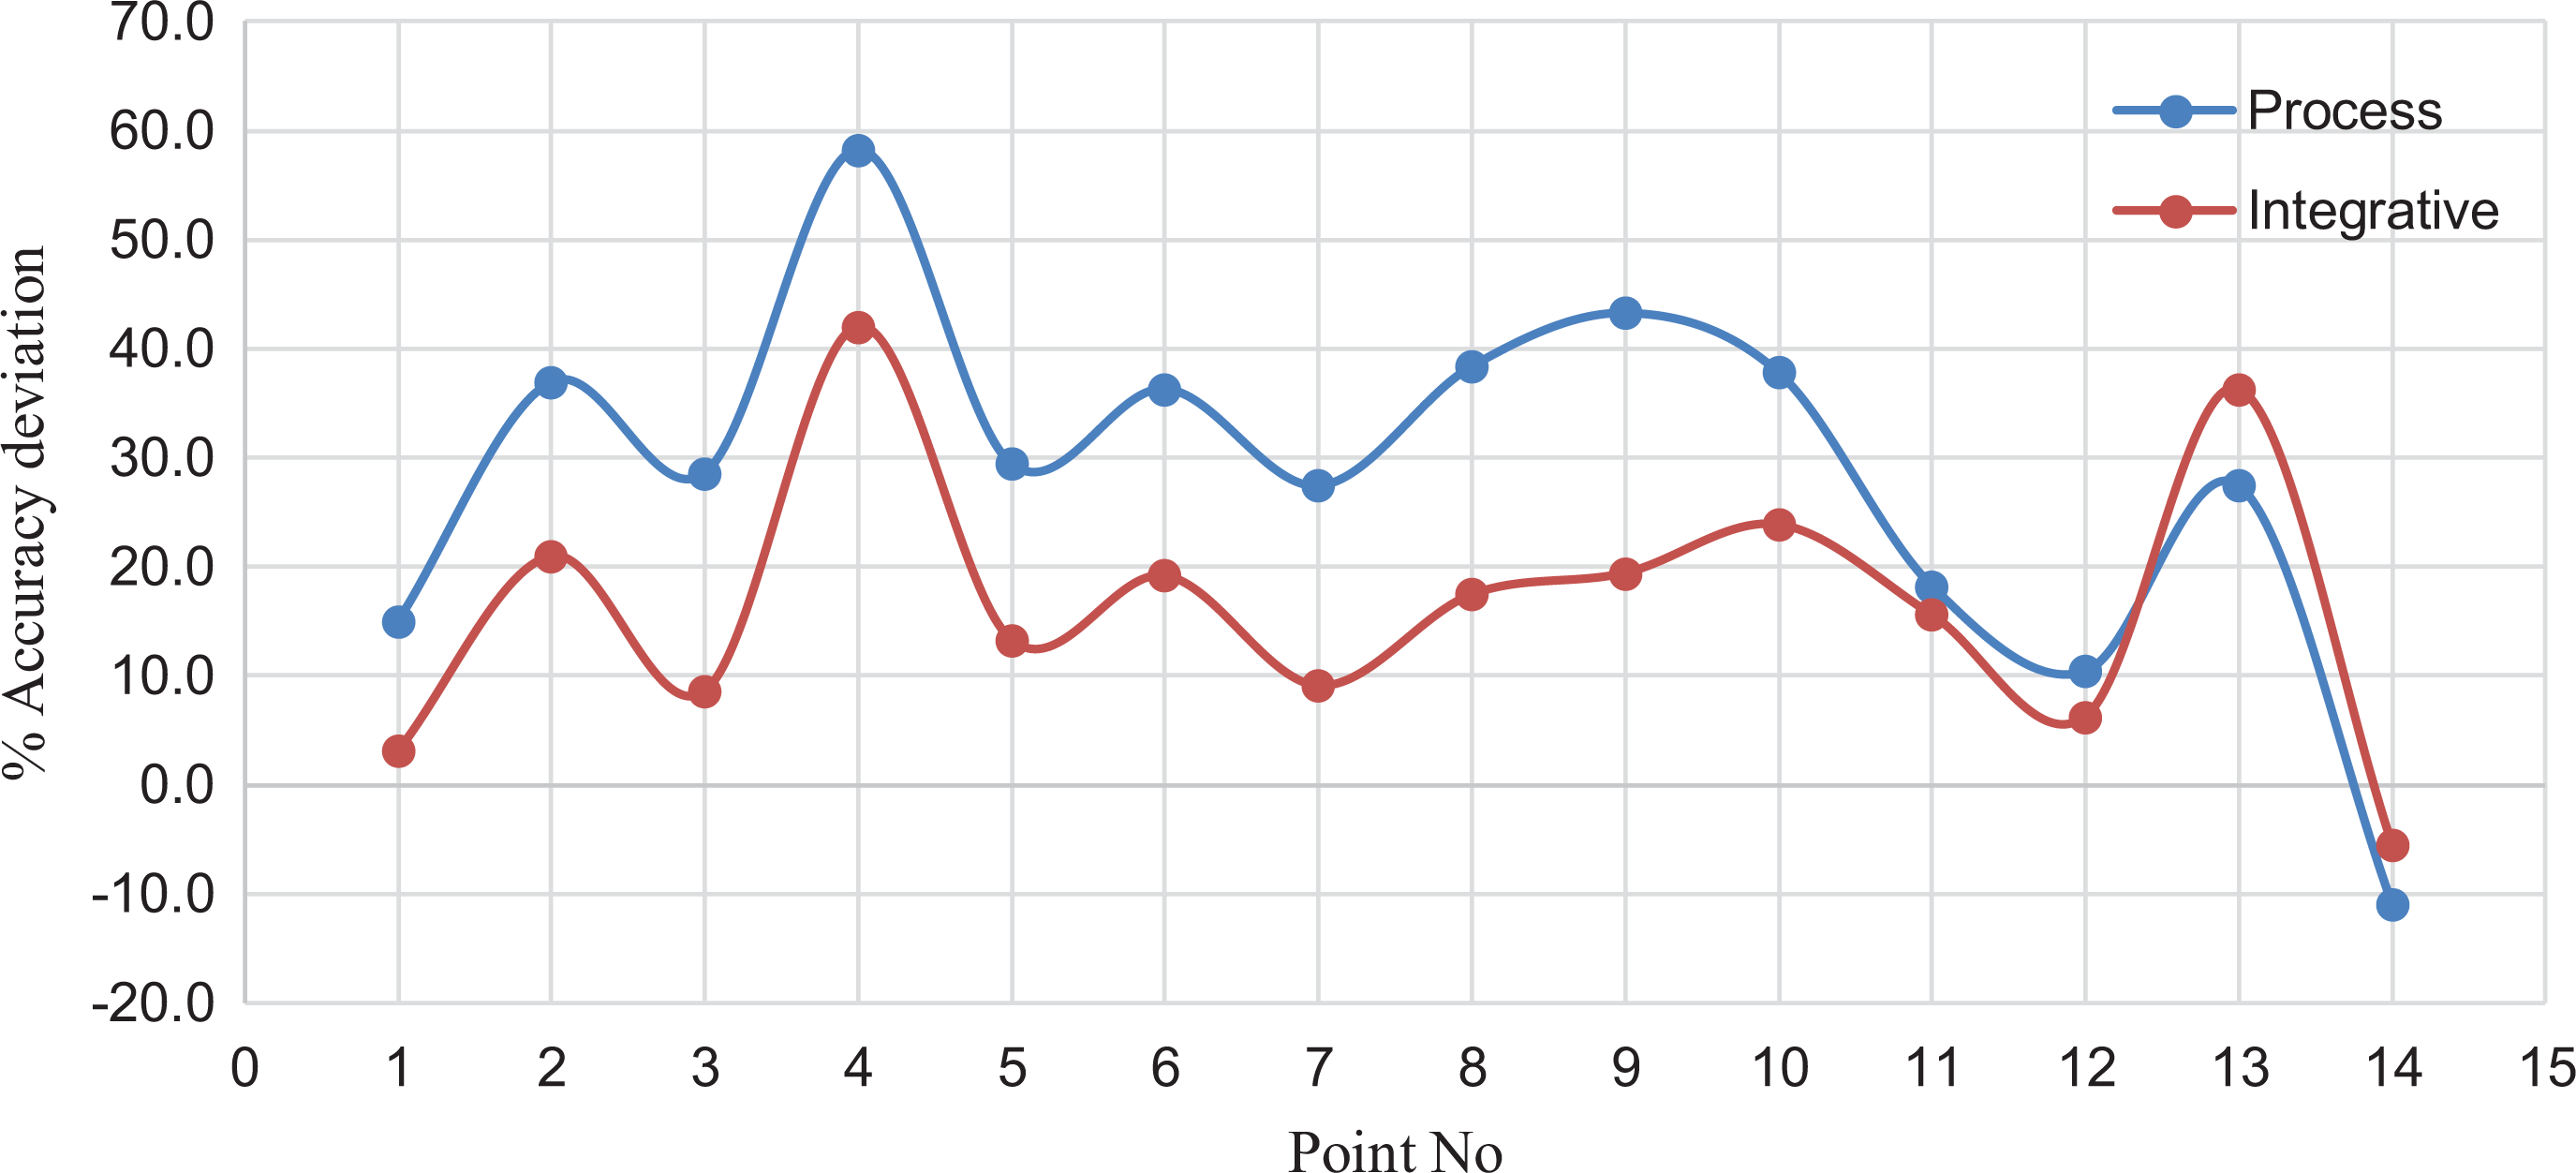
%Accuracy deviation with respect to scanning results for motor fan.
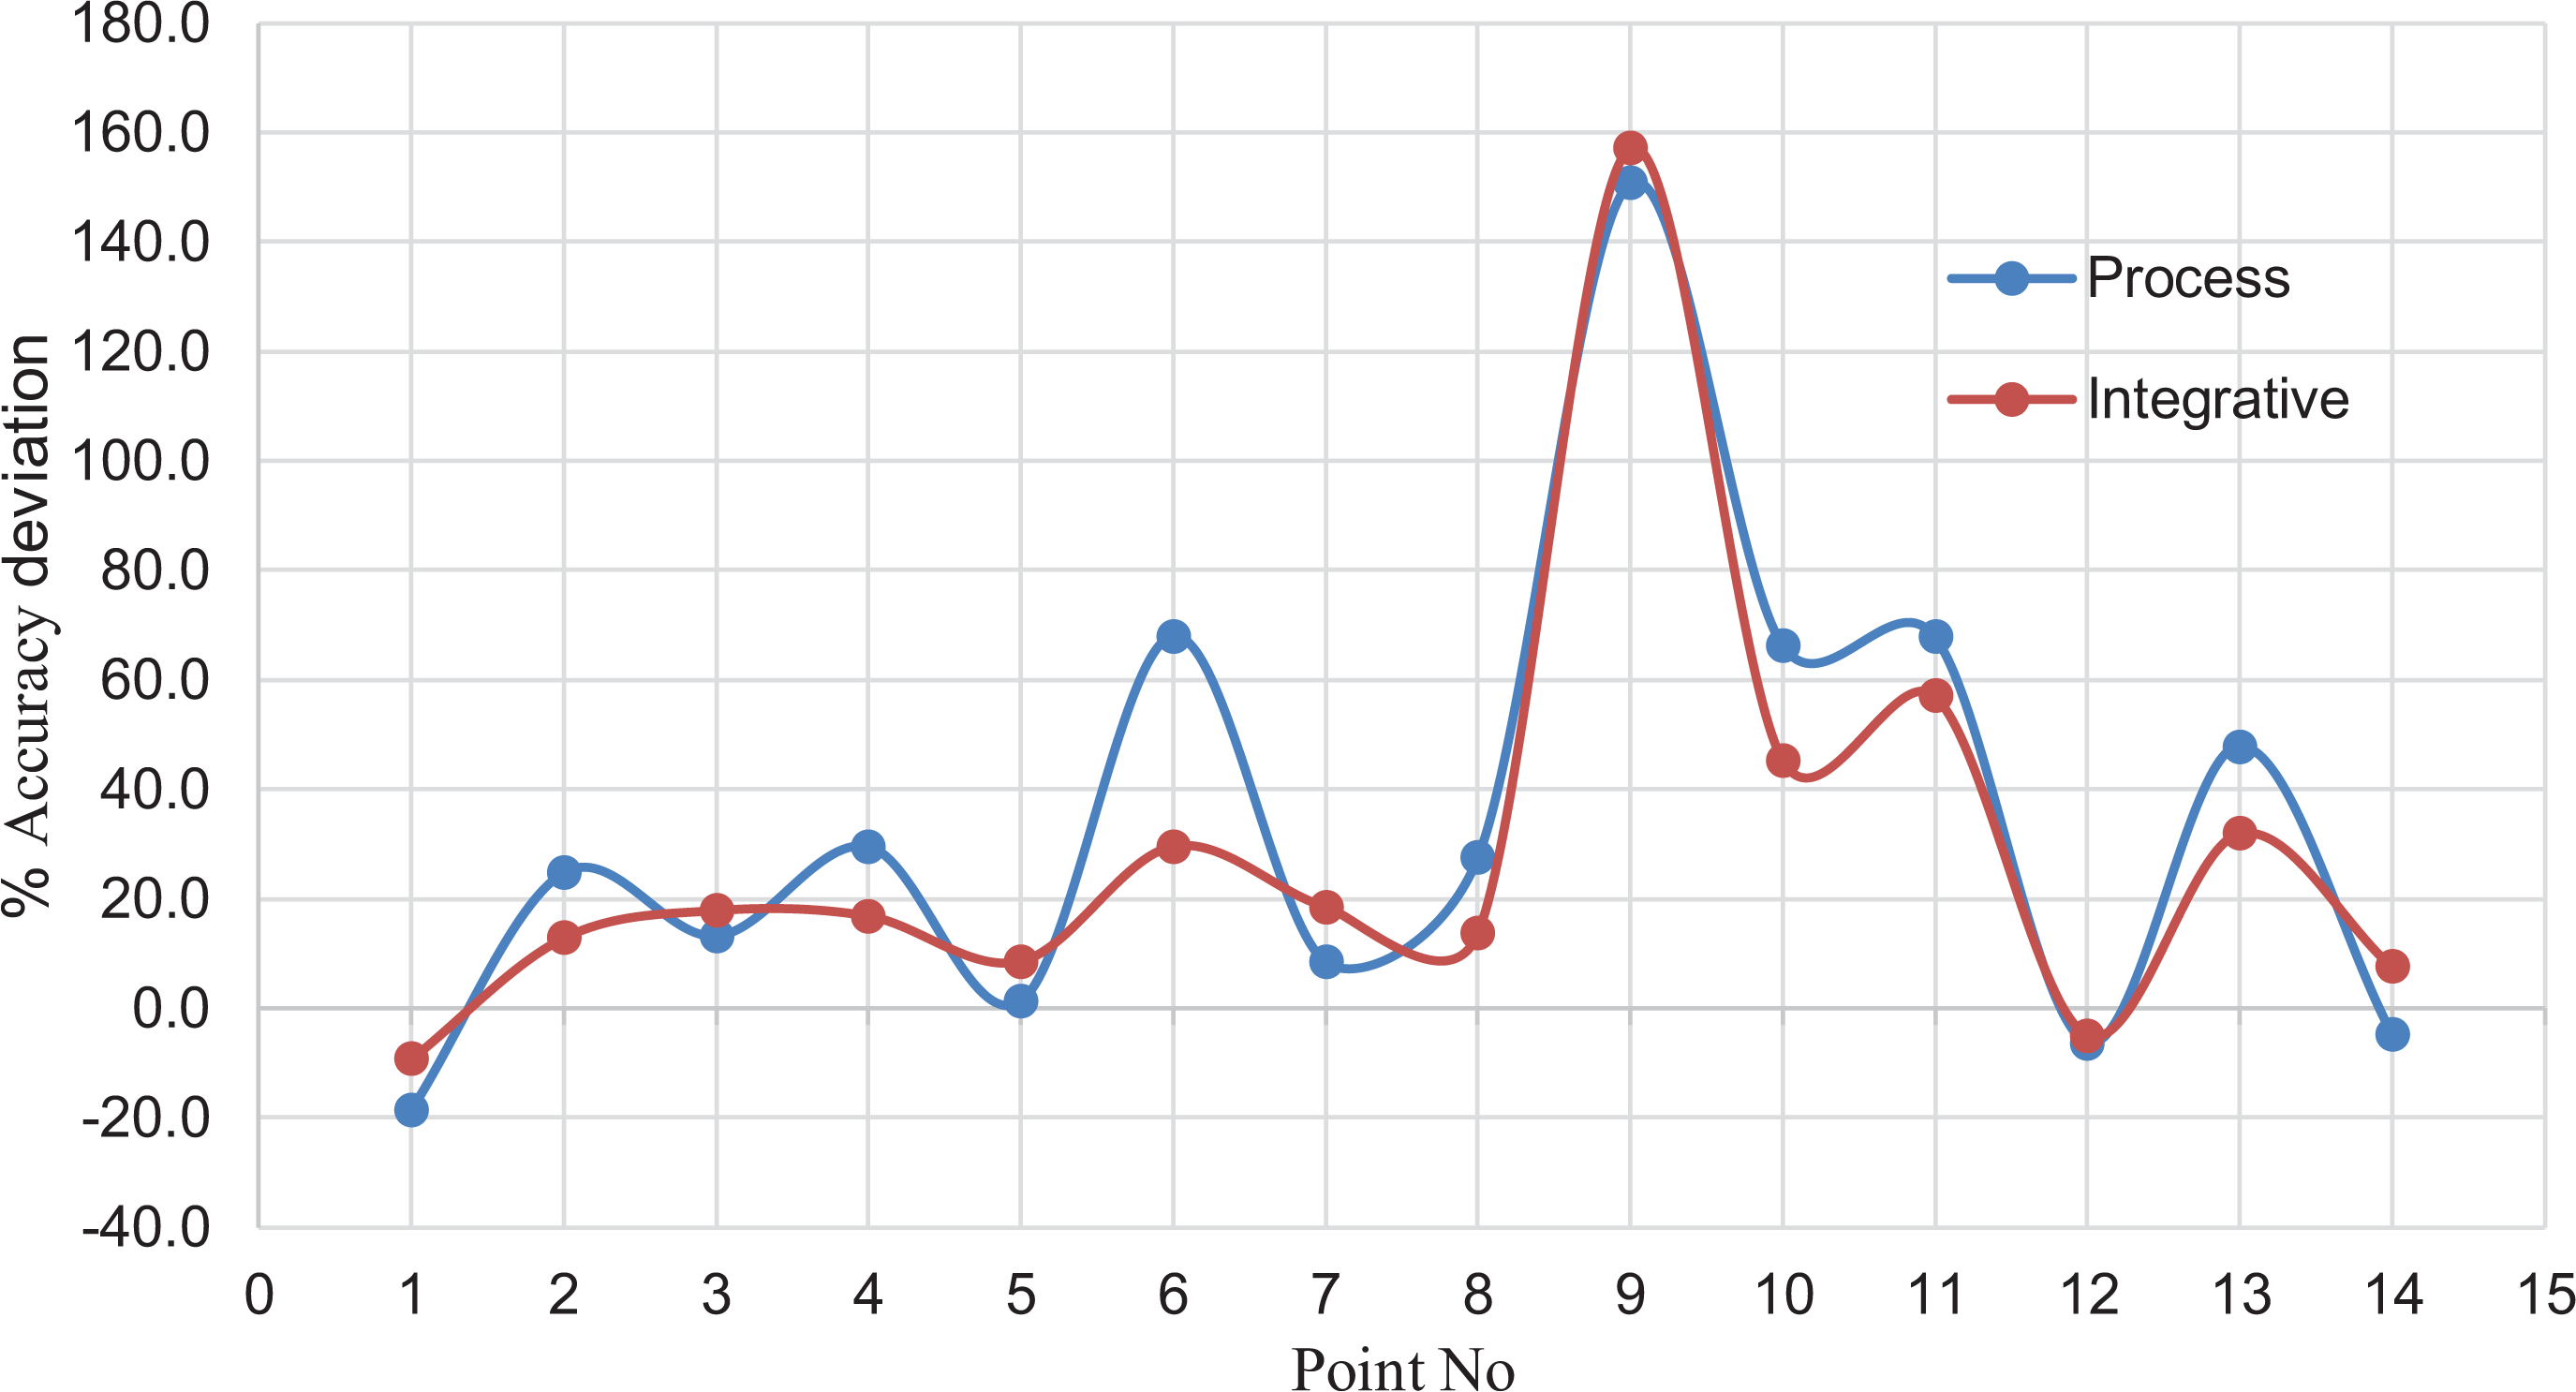
%Accuracy deviation with respect to the scanning results for covering box.
Summary and conclusion
Comparison study of warpage has been carried out using the existing process simulation method, new integrative simulation approach, and 3D scanning results. The effects of the volumetric shrinkage, temperature, density, pressure, and so on, are considered in the nonlinear and transient domain for an integrative approach. From this study, it is observed that the results of an integrative simulation approach are closer to the actual scanning results and hence it is concluded that an integrative approach provides better results prediction over the traditional process simulation technology. However, it has been observed that there are still some deviations even with the newly developed integrative simulation approach, which shall be covered in future work.
Future scope
Based on the above summary and conclusion, it is observed that the new integrative simulation approach requires more validation for considering the effect of glass–fiber orientation and moisture absorption as this study have been done for unreinforced thermoplastic material.
The future scope of work will include the following: Consideration of alternative material, polyamide, which has a natural tendency to absorb more moisture as compared to PBT. Consideration of glass-filled material, which has high impact on warpage results. Consideration of complicated or complex geometry, as geometry variation will also be playing an important role for warpage results.