
Abstract
This study reveals the enhancement of mechanical and thermal properties of maleic anhydride-grafted polypropylene (PP-g-MA) with the addition of nanocrystalline cellulose (NCC). A nanocomposite was manufactured by blending various percentages of PP, MA, and NCC nanoparticles by means of a twin-screw extruder. The influence of varying the percentages of NCC on the mechanical and thermal behavior of the nanocomposite was studied by performing three-point bending, nanoindentation, differential scanning calorimetry (DSC), thermogravimetric analysis (TGA), scanning electron microscopy (SEM), and Fourier-transform infrared (FTIR) spectroscopy tests. The novelty of this study stems on the NCC nanoparticles and their ability to enhance the mechanical and thermal properties of PP. Three-point bending and nanoindentation tests revealed improvement in the mechanical properties in terms of strength, modulus, and hardness of the PP-g-MA nanocomposites as the addition of NCC increased. SEM showed homogeneity between the mixtures which proved the presence of interfacial adhesion between the PP-g-MA incorporated with NCC nanoparticles that was confirmed by the FTIR results. DSC and TGA measurements showed that the thermal stability of the nanocomposites was not compromised due to the addition of the coupling agent and reinforced nanoparticles.
Keywords
Introduction
Enhancing the physical properties of polymers by means of grafting has significantly attracted researchers’ interest in the past decade. Grafting polymers such as polypropylene (PP) via maleic anhydride (MA) ultimately alters the physical properties of PP when mixed with various nanofillers. Nanofillers, such as carbon nanotubes, graphene, clay, 1 nanocellulose, 2 as well as metallic nanoparticles,3–6 are distributed in the matrix of fiber composites or polymeric material to enhance their physical properties, most specifically their mechanical and thermal properties. Recent studies found that sugarcane bagasse nanocellulose are also used to prepare fiber-reinforced composites. Doing so showed improvement in their physical properties using chemical treatment through coupling agents7,8 such as MA. The homogeneity of the nanofiller dispersion in the polymeric matrix is important in the case of functional gradient materials. Most polymer composite failures occur due to the weak interfacial interaction/adhesion between the nanofillers and the polymeric matrix. Therefore, obtaining homogeneous mixture between the matrix and nanofillers is essential and thus improves the properties of the nanocomposite.
The role of nanofillers on the mechanical behavior is different from that of the fiber–fillers. The increase in strength on fiber–filler composite is due to high load-carrying capacity primarily by the filler. However, nanofillers, due to their large surface area, provide wider interaction with polymer matrix and as a result, the composite’s mechanical properties are enhanced, specifically the modulus of elasticity. It interferes with the movement of the polymer chain that decreases the molecular mobility leading to increasing the composite strength. It has been found that nanofillers, such as nanocrystalline cellulose (NCC), when mixed with PP showed dense composite structure and lower crystallinity which lead to better tensile as well as flexural strength. 9 Additional functionalities are added to PP to enhance their thermomechanical properties. The addition of a compatibilizer, such as MA-grafted PP (PP-g-MA), is widely used to enhance the mechanical and thermal properties.10–13
NCC, nano-sized natural-based fibers, display good mechanical, electrical, and other physical properties and thus are used as reinforcing agents.14,15 Cellulose crystals are reported to have a Young’s modulus of 134 GPa. 16 These nanofillers when cross-linked with polypropylene significantly alter the mechanical properties of PPs. Previous work (Al-Haik and colleagues) showed that the tensile strength and yield stress for pure PP was 31.8 and 25.5 MPa, respectively. However, when mixed with various weight percentages (1–5 wt%) of NCC nanoparticles, the mechanical properties were enhanced by 6.5% and 8%, respectively. It was concluded that NCC enhanced the material properties at lower filler concentrations (2 wt% NCC) compared to unfilled polymer matrices and their composite counterparts. Moreover, the tensile strength and flexural strength of PP-NCC nanocomposite is further increased by modifying the PP with MA. 17 The mixing process of NCC as fillers suggested enhancement of PP. Previous studies reported that at higher concentrations of NCC produces rod-like structure particle agglomeration that were evident through SEM images.
This study investigated the improvement of the mechanical and thermal properties of PP-g-MA reinforced with nanocrystalline nanoparticles. PP mixed with benzoyl peroxide (BP), used as an initiator, provides unsaturation in PP by introducing double bonds. 18 The unsaturated PP is blended with MA (PP-g-MA) which is used as a compatibilizer. The process involved grafting the thermoplastic polymer using MA to enhance the dispersion of NCC in the thermoplastic. The PP-g-MA were dry mixed with NCC particles to form (PP-g-MA)/NCC nanocomposite by injection molding at 190°C for 15 min. The (PP-g-MA)/NCC nanocomposite was then grinded to form pellets and mixed with various percentages of PP to form the modified (PP-g-MA)/NCC/PP nanocomposites tested which will be referred to as the B samples in the following sections. Three-point bending test, nanohardness (nanoindentation), differential scanning calorimetry (DSC), thermogravimetric analysis (TGA), Fourier transform infrared (FTIR) spectroscopy, and scanning electron microscopy (SEM) measurements were used to analyze the mechanical, thermal, chemical, and morphology of the (PP-g-MA)/NCC/PP nanocomposites.
Materials and sample preparation
PP was purchased from Exeed EFF Co. (Oman). It had an melt flow index (MFI) of 1.59 g min−1 (230°C) and a density of 0.91 g cm−3. NCC was purchased from CelluForce Co. (Canada). It had average dimensions of 100 nm length and 5 nm diameter and a measured surface area of ∼500 m2 g−1. Previous work (Al-Haik and colleagues) was performed on the mechanical properties of PP with various weight percentages (wt%) of NCC; the addition of NCC at 0%, 1%, 2%, 3%, 4%, and 5% concentrations. From that, the 2% of PP-NCC sample showed optimum results in terms of tensile (peak stress and modulus) and hardness. The results showed that the tensile strength (peak stress) and yield stress values of pure PP was found to be 31.8 and 25.5 MPa, respectively. The addition of NCC (2 wt%) on PP (PP-2 wt% NCC) lead to a slight increase in the values of both peak and yield stresses, of 33.83 and 27.5 MPa, respectively. Therefore, the 2% of NCC nanoparticles was used for this study alongside the functionalized PP-grafted MA nanocomposite.
In this study, PP-g-MA, used as a compatibilizer, was prepared as follows: First, 2 wt% NCC, 2 wt% MA, and 0.3 wt% BP mixed with 95.7 wt% PP pellets were dry-mixed and poured into the injection-molding machine (Norwood Instrument Ltd, Honlet, England, UK) to form a nanocomposite plate which will be referred to as the X sample and denoted as NCC PP-g-MA/NCC. After that the prepared X sample plate was converted into pellets by a pelletizer. The X pellets were then poured into the injection-molding machine with different percentages of PP to form a new nanocomposite referred to as the B samples and are tabulated in Table 1. The purpose of preparing the B samples is to analyze the mechanical and thermal properties of functionalized (PP-g-MA)/NCC (X sample) by varying percentages of PP ((PP-g-MA)/NCC/PP). Four different samples were made B1, B2, B3, and B4 by mixing various weight percentages of the X sample with pure PP. The cylinder temperature of the machine was 190°C for 15 min, and the mold temperature was 50°C.
Sample description.
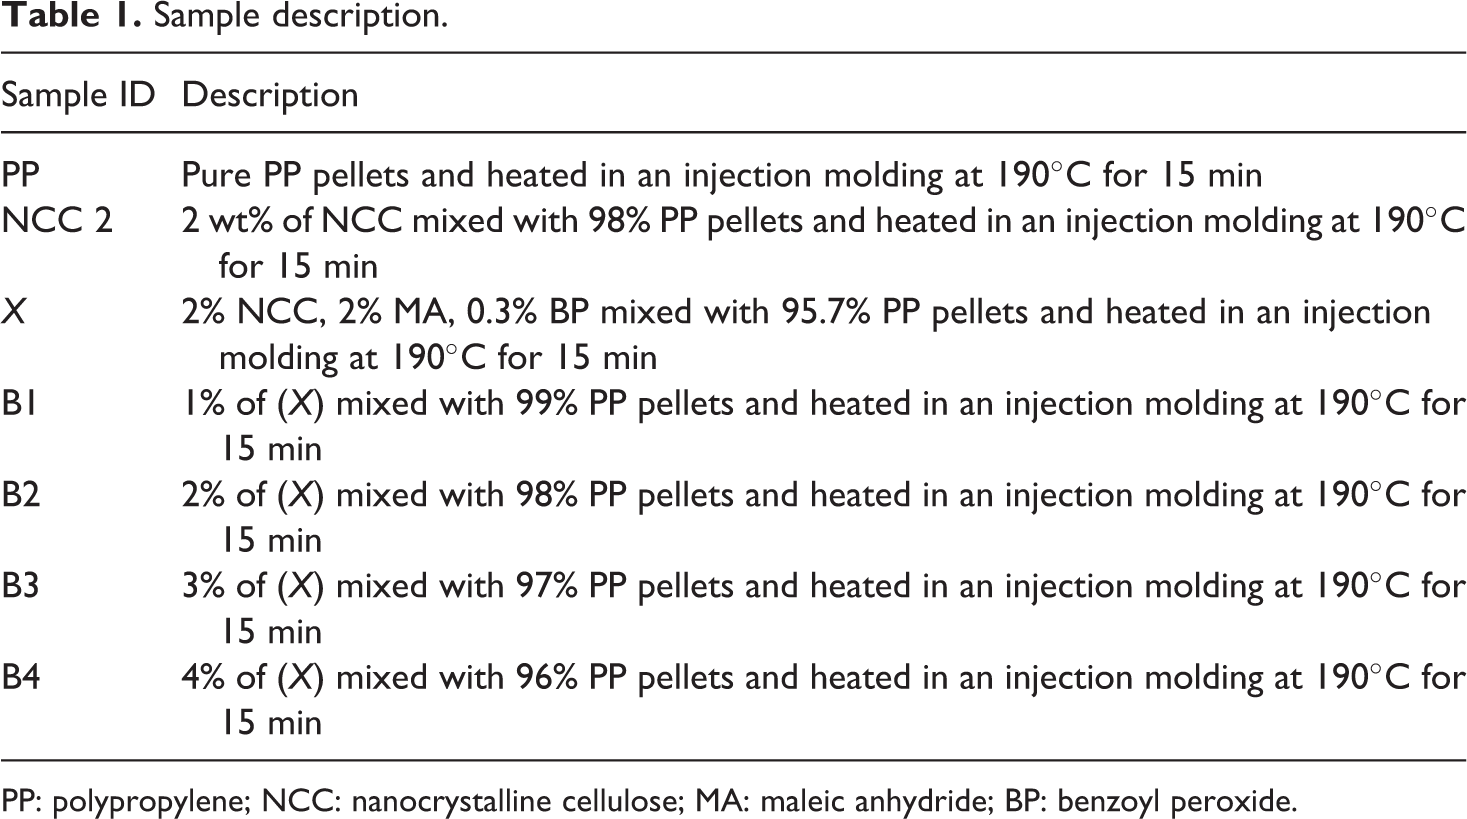
PP: polypropylene; NCC: nanocrystalline cellulose; MA: maleic anhydride; BP: benzoyl peroxide.
Experimental setup
Three-point bending test
Three-point bending test according to ASTM D790 was carried out for all composite samples. The mid-span deflection was determined using an extensometer at a crosshead speed of 10 mm min−1. The dimensions of each sample are 100 × 12 × 3 mm3 that represents the length × width × and thickness.
Nanoindentation
The nanoindentations were carried out at a constant displacement rate of 0.0167 nm s−1 to avoid strain hardening effect on the measurements until a maximum depth of 1827 nm was reached using a NanoTest (Micro Materials Ltd, Wrexham, Wales, UK) nanoindenter. The load 1 mN was held constant for 30 s to avoid creep that may affect the unloading behavior.
Differential scanning calorimetry
DSC analysis of polymeric membranes were carried out using a differential scanning calorimeter DSC Q200 V24.4 Build 116 Model (TA Instruments, Water LLC, New Castle, Delaware, USA) containing a refrigerator cooling system. Each sample weighing approximately 5–10 mg was placed in a hermetically sealed aluminum pans and were then heated from 40°C to 200°C at a rate of 10°C min−1 under nitrogen atmosphere. Placed inside the furnace next to the filled pan is an empty hermetically sealed aluminum pan as a reference cell. The results were analyzed using TA Universal Analysis 2000 V4.5A Build 4.5.05 (TA Instruments) software.
Thermogravimetric analysis
Weight decomposition percentage was analyzed using the thermogravimetric analyzer TGA (Q50, TA Instruments, Water LLC) that contains a TGA heat exchanger system for analyzing PP and B samples. Each sample weighing approximately 5–8 mg in weight was placed on a ceramic plate inside the tube furnace, which was heated from 25°C to 700°C at a rate of 10°C min−1 under nitrogen atmosphere. The results were analyzed using TA Universal Analysis 2000 V4.5A build 4.5.05 (TA Instruments) software.
Fourier transform infrared spectroscopy
FTIR spectroscopy attenuated total reflectance infrared spectra of the samples were recorded using a 470 FTIR Nexus spectrometer (Thermo Electron Corporation, Madison, Wisconsin, USA). FTIR was used to characterize the presence of specific chemical groups in the materials and to investigate the influence of the compatibilizer, PP-g-MA, on the miscibility of the PP polymer blend. It was also used to analyze the interactions among ions in the polymer matrix. PP and B samples were obtained as 1- to 2–mm-thick films and analyzed by FTIR transmittance mode. The dried films of PP and B samples were peeled off and cut into strips and sandwiched between the potassium bromide powder before placing in the spectrophotometer.
Scanning electron microscopy
SEM was carried out for extensive morphological inspection of cross section in pure PP and B samples nanocomposites. The small portion of samples after mechanical analysis was dried under vacuum for 24 h at 50°C. The coating of samples was carried out by gold sputtering and was further examined with an electron microscope (JEOL JSM-5600, Japan) for morphological changes.
Results and discussion
Mechanical properties
The tensile stress of the pure PP and the addition of reinforced NCC-modified PP-g-MA on PP (B samples) is depicted in Figure 1. The addition of the NCC and grafted MA on PP composite showed an increase in the tensile strength. The B1 sample (which indicates 1% X and 99% PP) showed significant improvement in the mechanical property. It revealed an increase in tensile stress by 22% from pure PP and 14% from NCC 2 sample (reported by Al-Haik and colleagues). It was also found that the highest value in tensile strength was achieved for the case of B2 with a stress value of 41 MPa, indicating a 29% increase of pure PP and 21% increase of NCC 2. Moreover, all the stress values have shown tensile strength enhancements when compared with pure PP as well as the NCC 2 nanocomposite. The gradual increase of MA and NCC in the nanocomposite showed good compatibility and adhesion within the grafted PP (PP-g-MA) matrix.
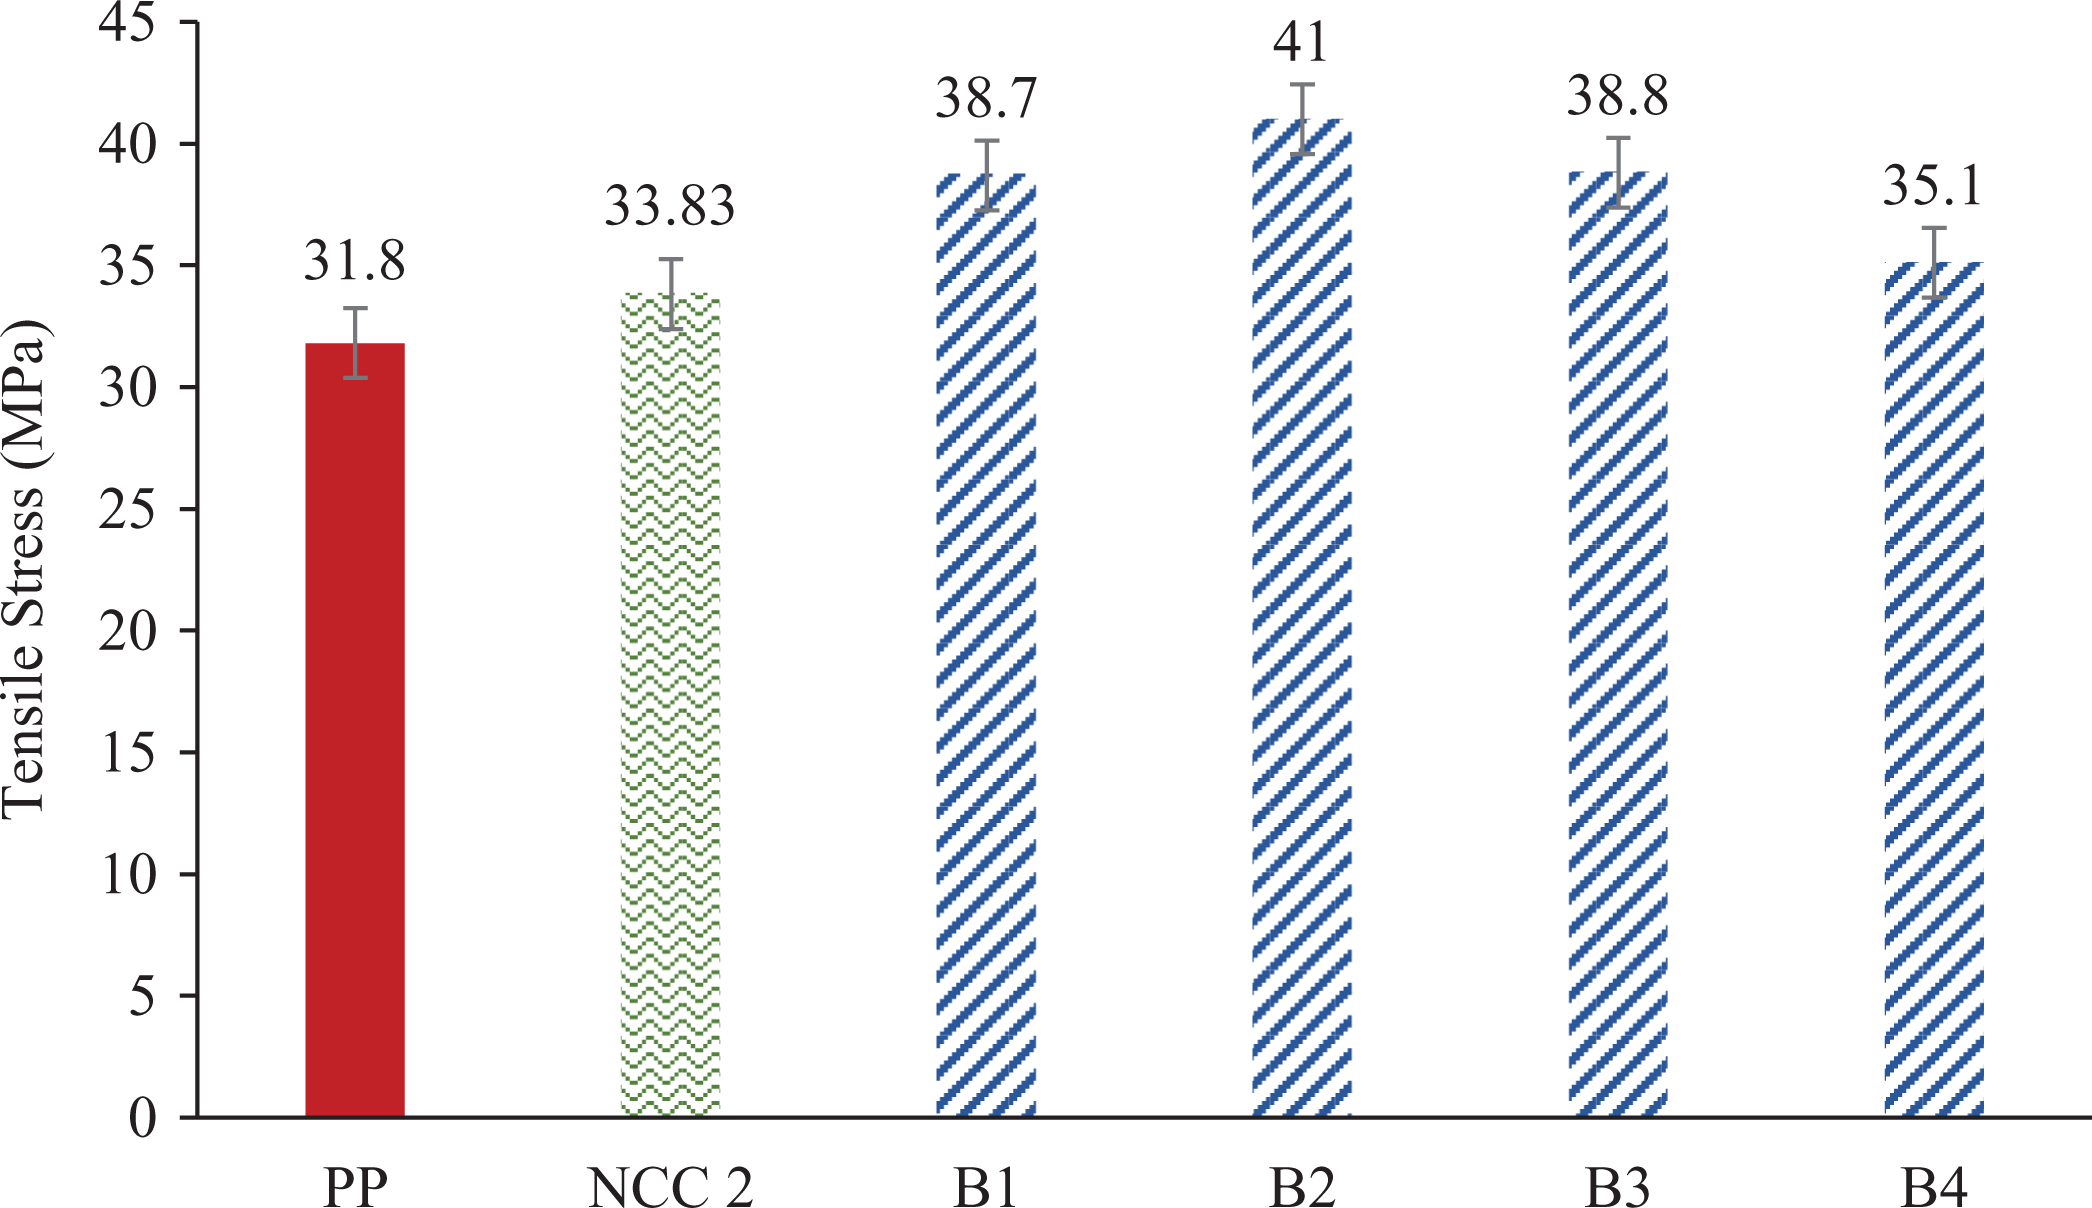
Peak stress values for B samples compared to pure PP and NCC 2.
The effect of adding various percentages of X sample on the tensile modulus of NCC-reinforced PP composite is shown in Figure 2. The modulus of elasticity value of the pure PP and NCC 2 was found to be 684.8 and 772.7 MPa, respectively. Due to the incorporation of 2 wt% of X on PP (B2 sample), the tensile modulus significantly increased to 854.3 MPa which is an improvement of 25% and 10% from pure PP and NCC 2 nanocomposites, respectively. The highest value of tensile modulus was found to be 858.8 MPa for the case of B3. Moreover, the value of elastic modulus increased for all the B samples compared to pure PP and NCC 2. It was noticed that increasing the weight percentage of X sample beyond 3 wt% decreased the elastic modulus for the nanocomposites. The 4 wt% (B4) concentration showed lower modulus value of 794.7 MPa. This is due to the minor clustering of NCC nanoparticles within the nanocomposite and is depicted in the SEM images. Because the texture of the polymer is altered with the addition of MA, more pores were also noticed in the SEM, thus reducing the modulus value with the increased concentration of MA and NCC. Moreover, the increase in the elastic modulus value of PP-NCC (NCC 2) with grafted PP (PP-g-MA) can be attributed due to the increase in the stiffness of the composite after the addition of X percentage.
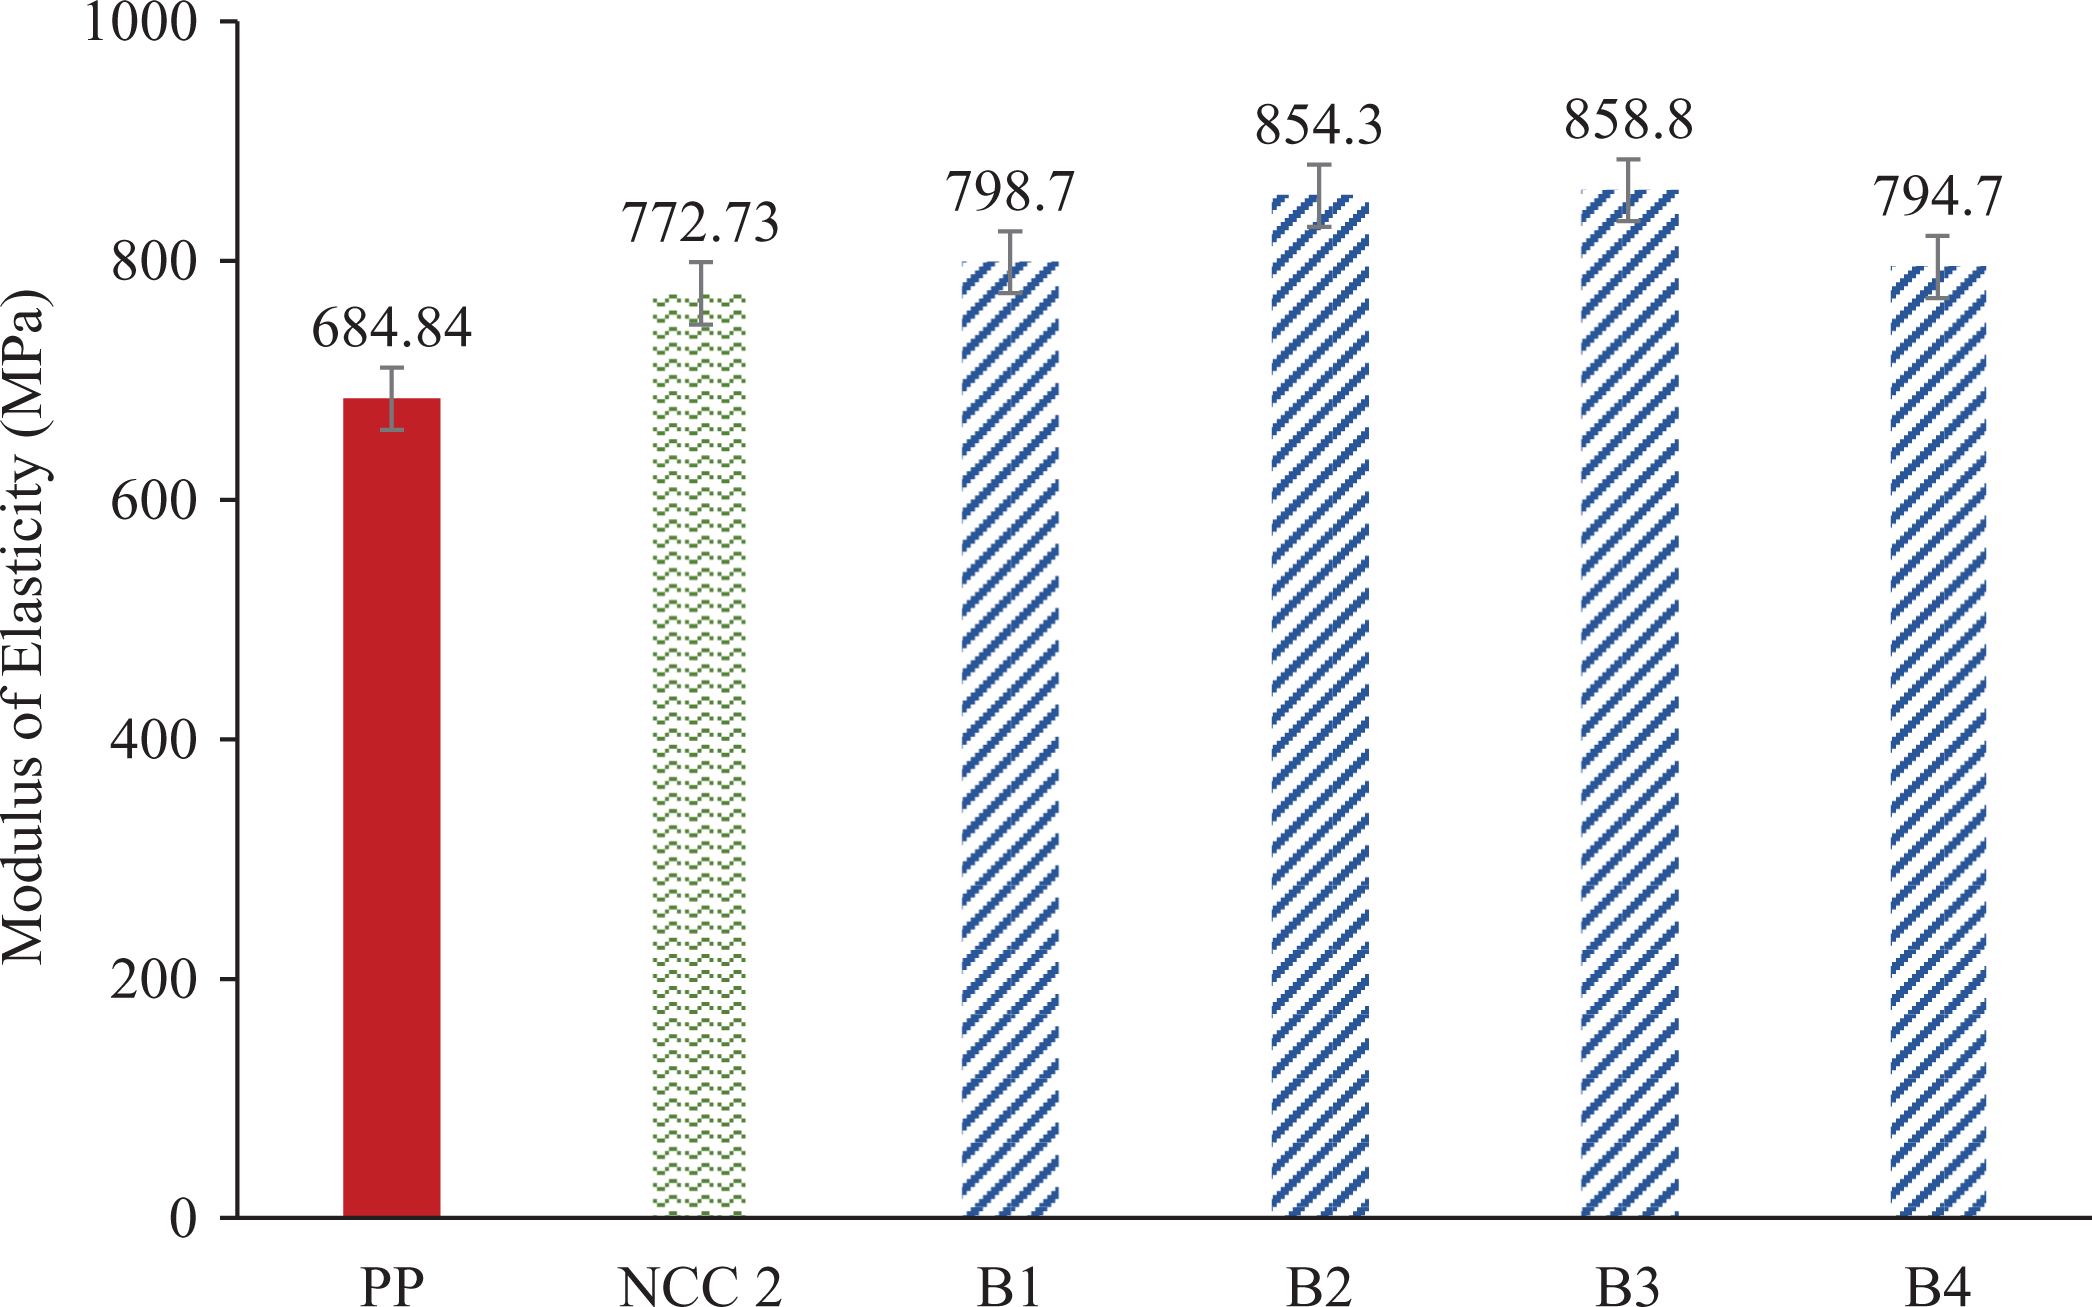
Elastic modulus for B samples compared to PP and NCC 2.
Two possible effects could happen once percentages of the X sample are added to PP. First, increase in micropores may occur. Second, effect in the reinforcing mechanism associated with reducing molecular mobility of the matrix polymer. At lower percentage levels of X sample, the effect of micropores is slightly impacted as compared to the molecular mobility within the matrix, which leads to a higher value of elastic modulus. 15 The elastic modulus increase depended on the amount of filler inside the polymer matrix. The stiffness of the nanocomposites increased with increasing filler content in the matrix for the composites. There was a variation in the increase of the stiffness with increasing the NCC and grafted PP concentrations. The reason for this variation is due to the orientation effects in which reinforcing phases oriented toward the direction of the load and increased stiffness at different rates. It was noticed that the B sample composites became more brittle as the content of NCC increased due to the increase in X percentage, more specifically the MA concentration.
Nanoindentation
Ten indents were performed for each sample. The hardness was calculated from the load displacement data. Figure 3 shows the effect of hardness of B nanocomposite samples compared with pure PP and NCC 2. Each data point was calculated by performing five tests for each sample. All samples showed an increase in the hardness values when compared with pure PP sample.
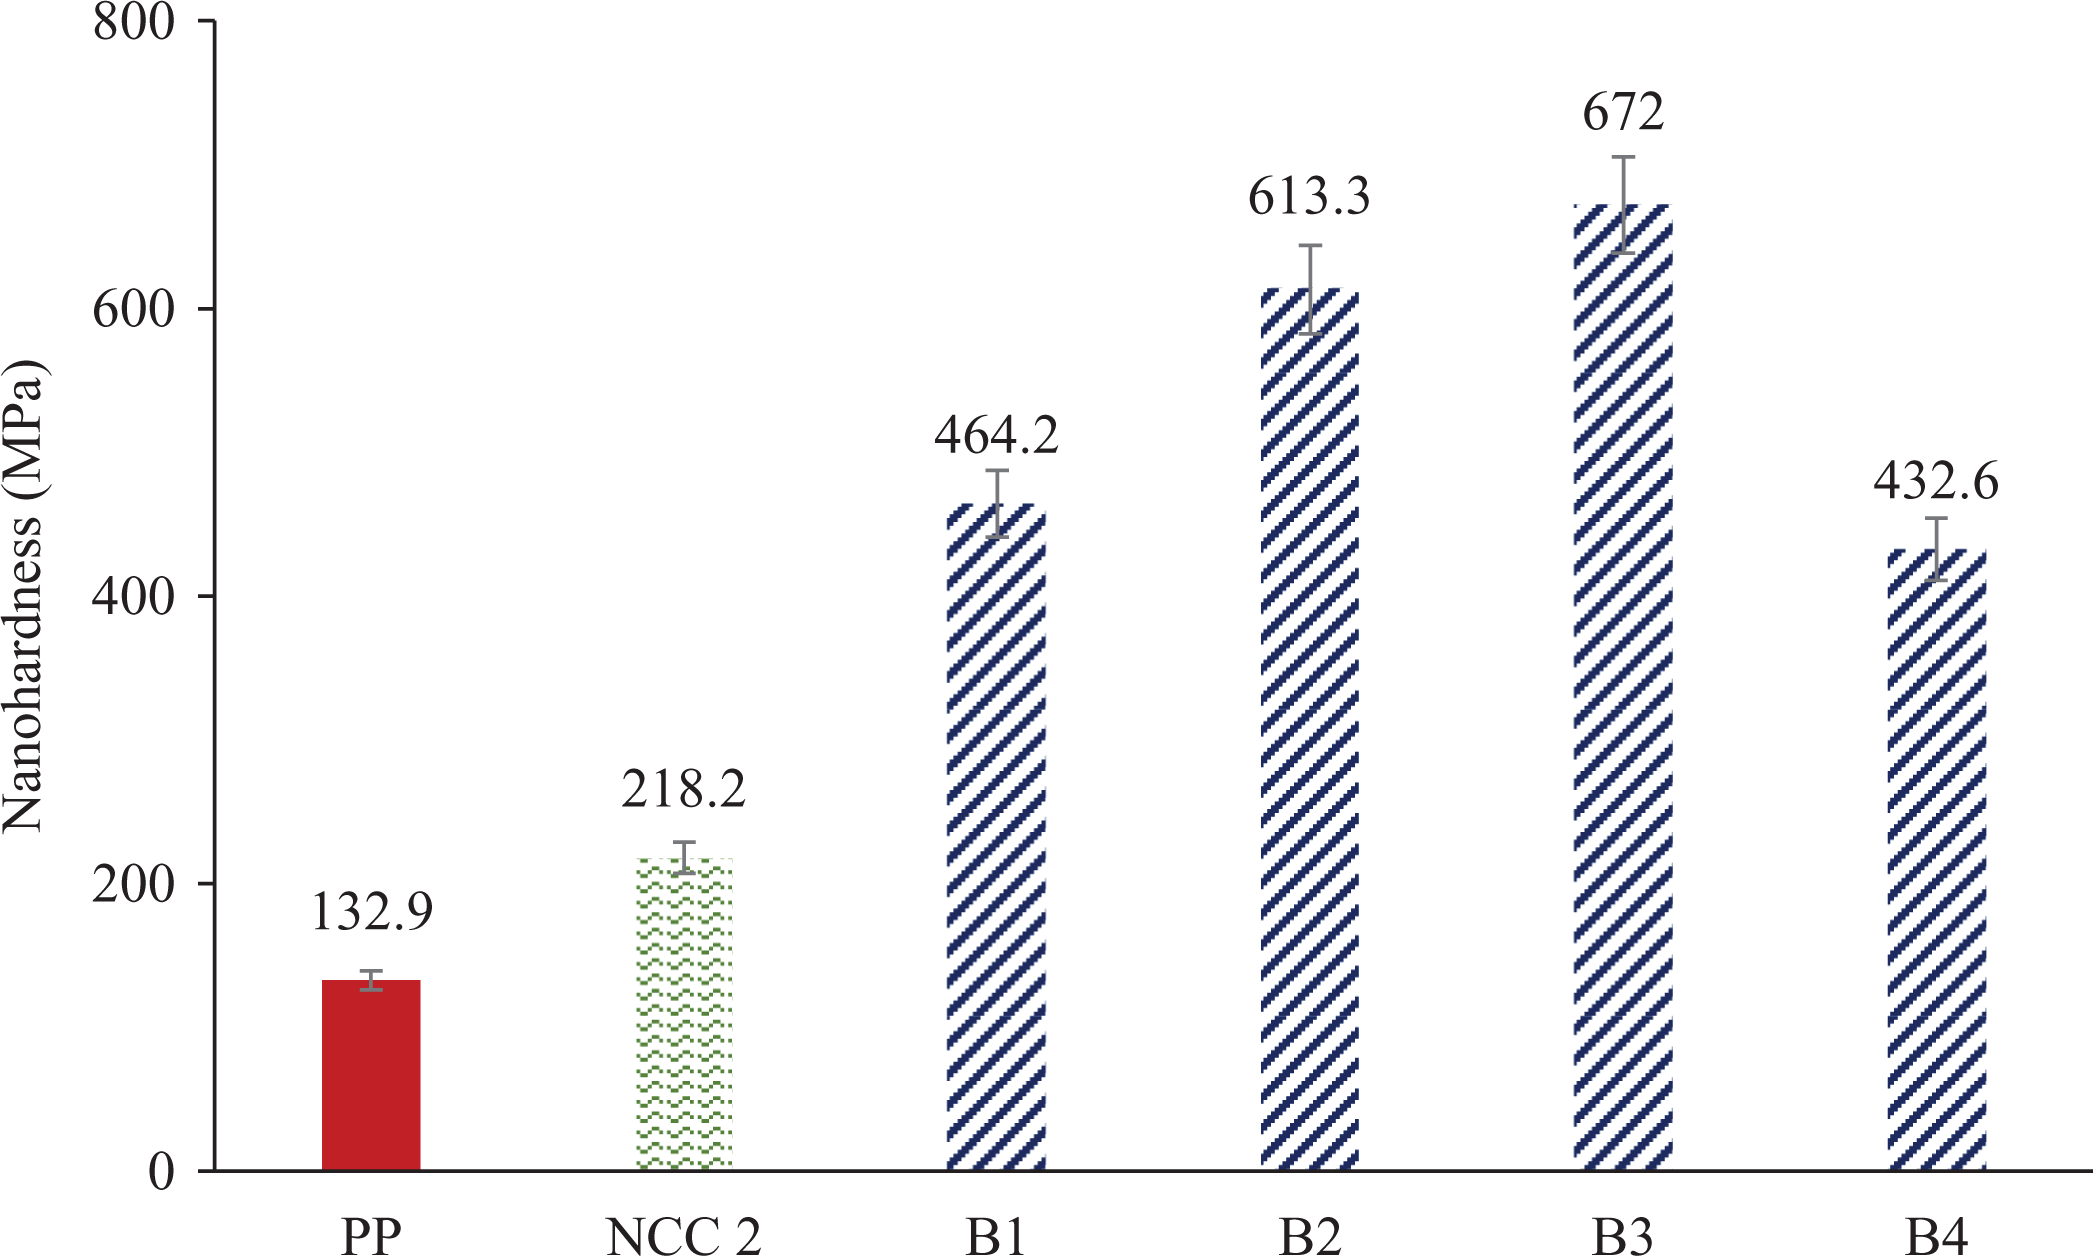
Nanohardness for B samples compared to pure PP and NCC 2.
All B samples showed an increase in the nanohardness values when compared to pure PP and NCC 2 samples as X percentage is increased. For the case of B4, the hardness value is the lowest when compared to the other B nanocomposite samples. However, the B4 sample also showed significant increase when compared to the PP and NCC 2 by 225.5% and 98.3%, respectively. The hardness is decreased due to the increase in the number of voids present as the X percentage is increased from 3% to 4% (as shown in the SEM micrographs, Figure 7(e)). Moreover, the B3 sample showed the highest increase in hardness with a value of 672 MPa. This significantly increased by 405% and 208% from the pure PP and NCC 2, respectively. The variation in the increase of the hardness is attributed to the orientation effects of the NCC nanoparticles. The results showed similar consistency with that of the three-point bending test.
Thermal properties
Differential scanning calorimetry
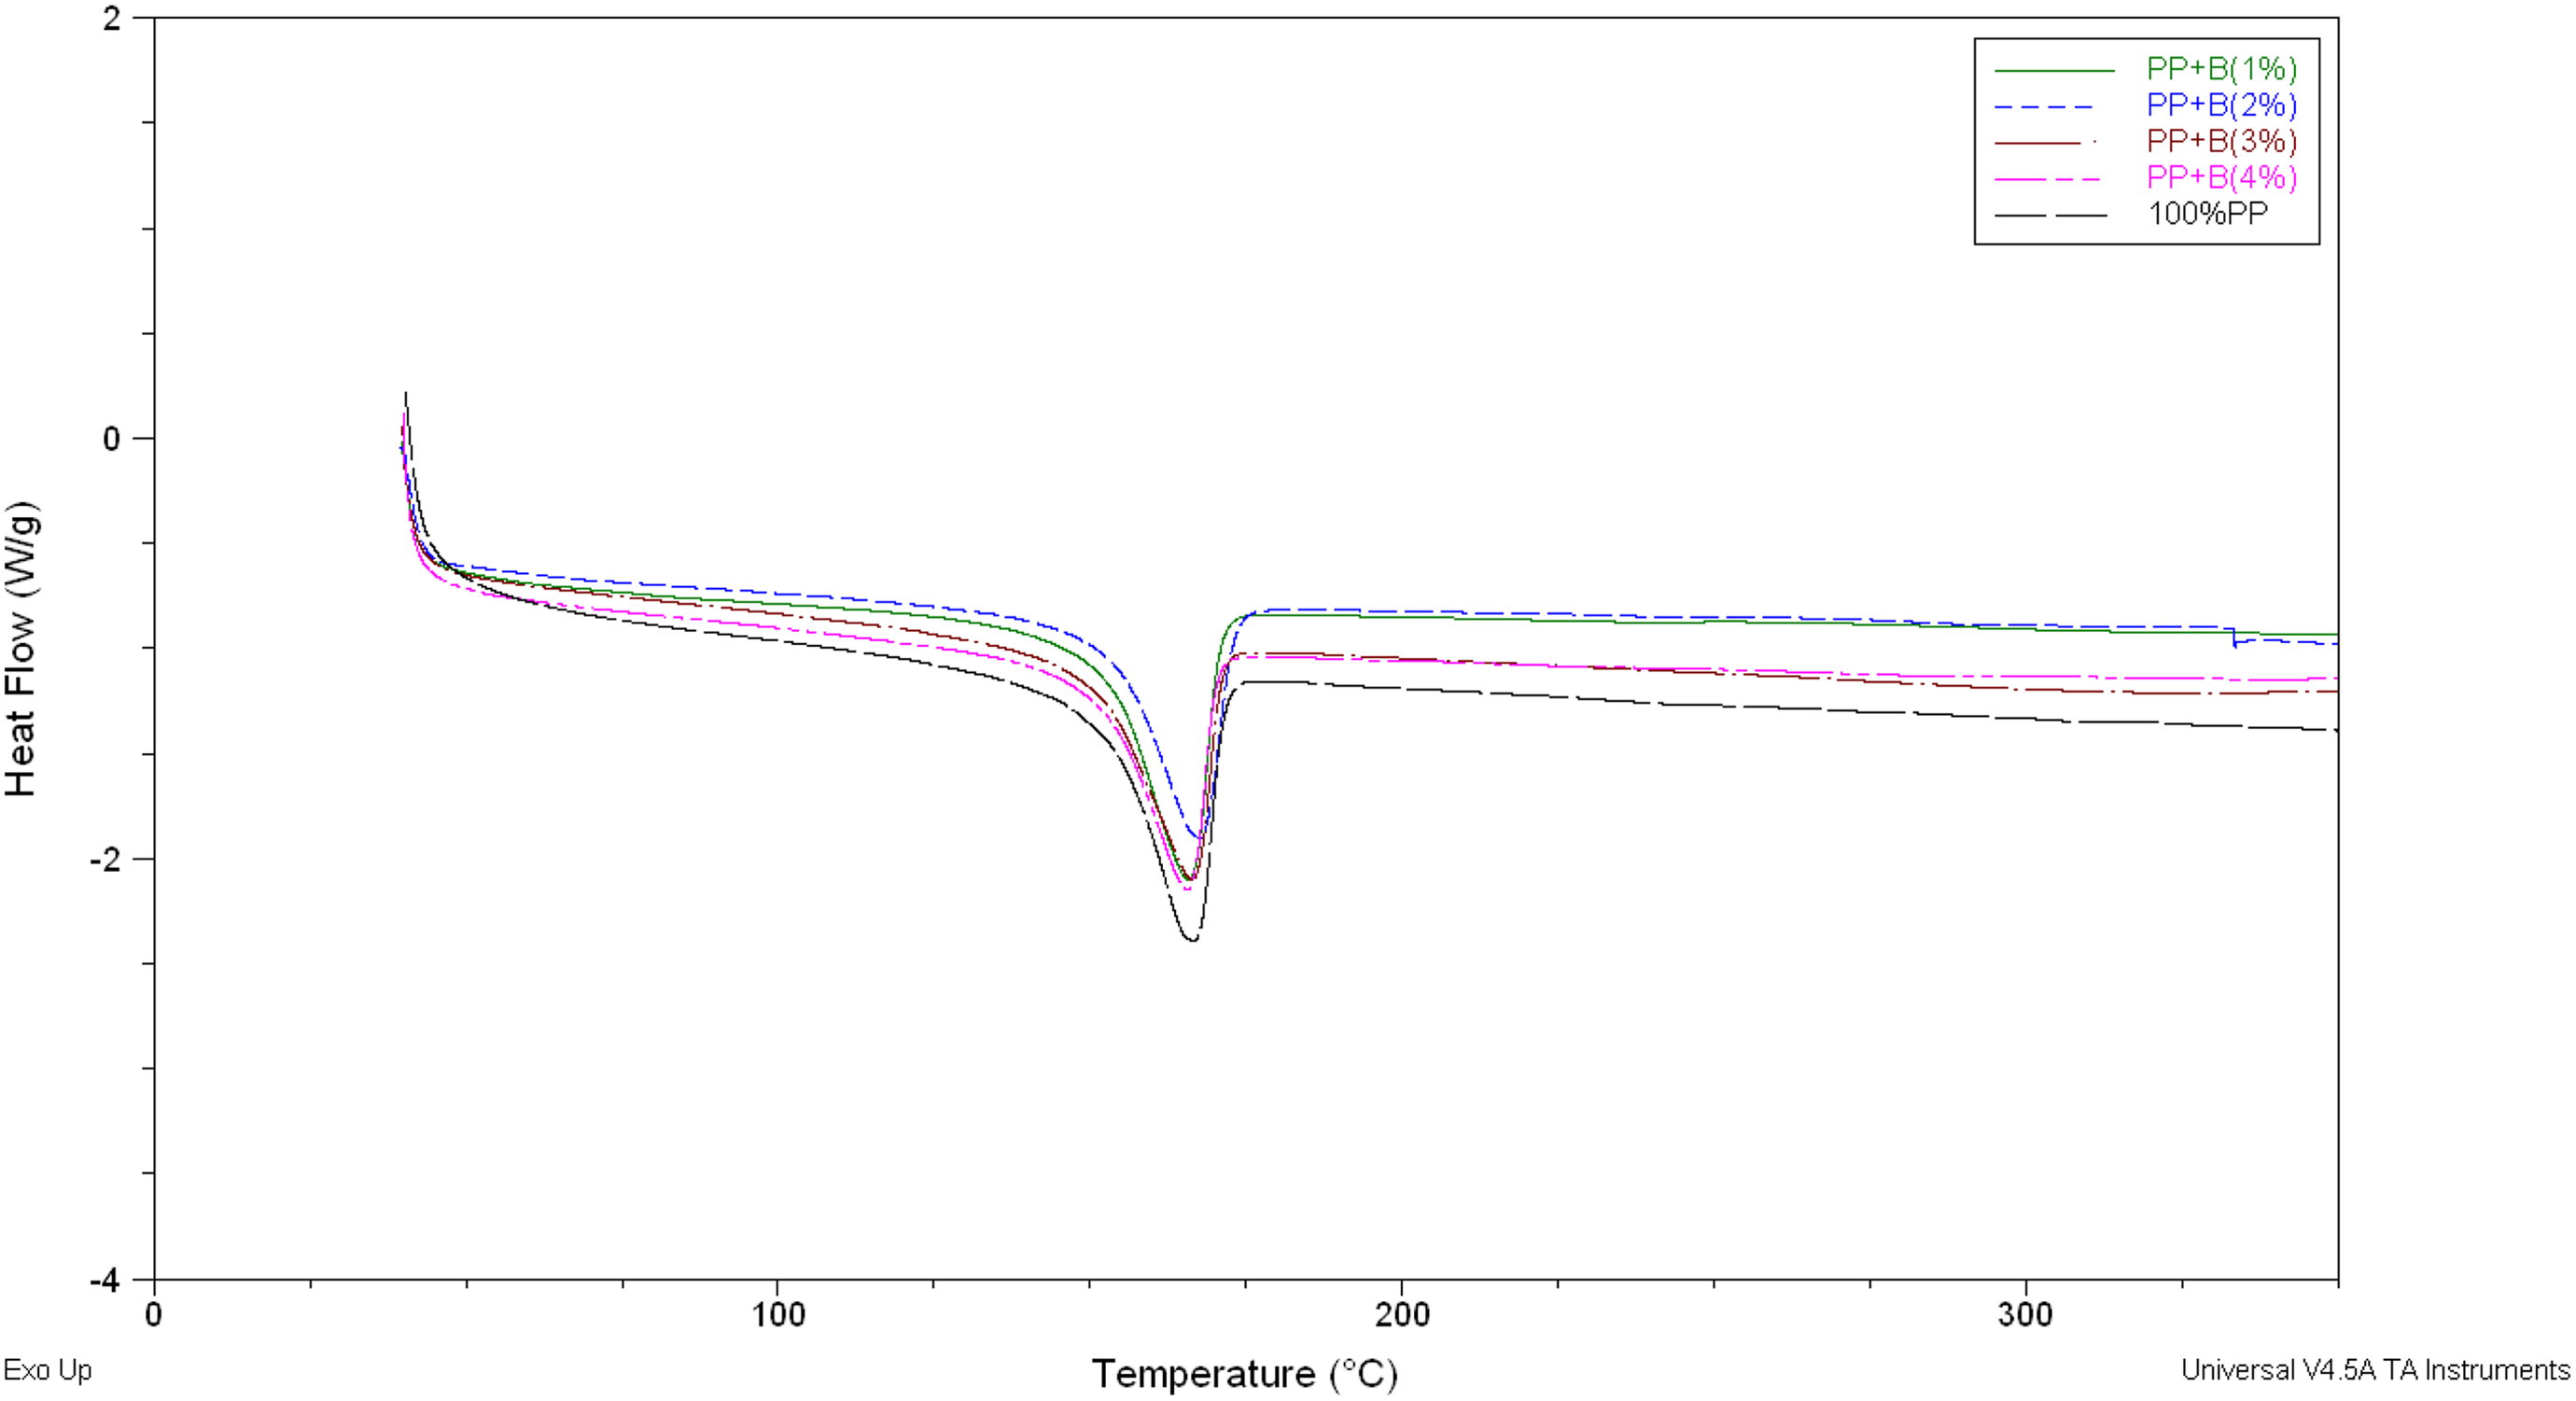
Figure 4 shows the crystallization behavior and endothermic heat flow for the B samples compared to the pure PP. The thermal characteristics of the melting temperature (Tm), heat of fusion (HFus), degree of crystallinity (Dc%), and crystallinity temperature (Tc) of B nanocomposite samples are summarized in Table 2. All samples exhibited a single peak and were consistent with the pure PP trend, where the pure PP had a Tm of 166.11°C. The Tm of the samples was minimally affected by adding the X sample nanocomposites with an average melting temperature of 166.51°C. It was pointed out by Bahar et al. that the addition of NCC on PP had little to no effect on the thermal analysis.
15
Similarly, no noticeable changes in the melting temperature and crystallinity were observed from Figure 4. As observed from Table 2, all B samples exhibited a heat of fusion and degree of crystallinity, with overall values less than the pure PP sample. This is due to the increased concentration of NCC and MA onto PP. The NCC filler acts as a nucleating agent that potentially enhances the crystallization behavior.
15
The degree of crystallinity is calculated using
DSC results of B and PP samples.
Results of DSC analysis.
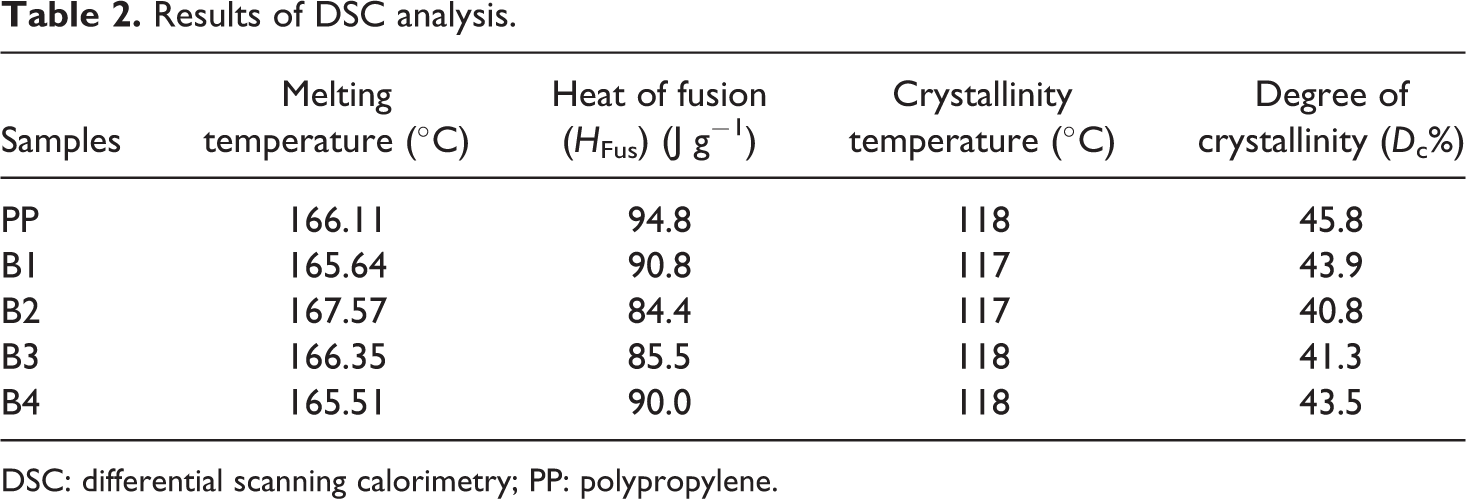
DSC: differential scanning calorimetry; PP: polypropylene.
Thermogravimetric analysis
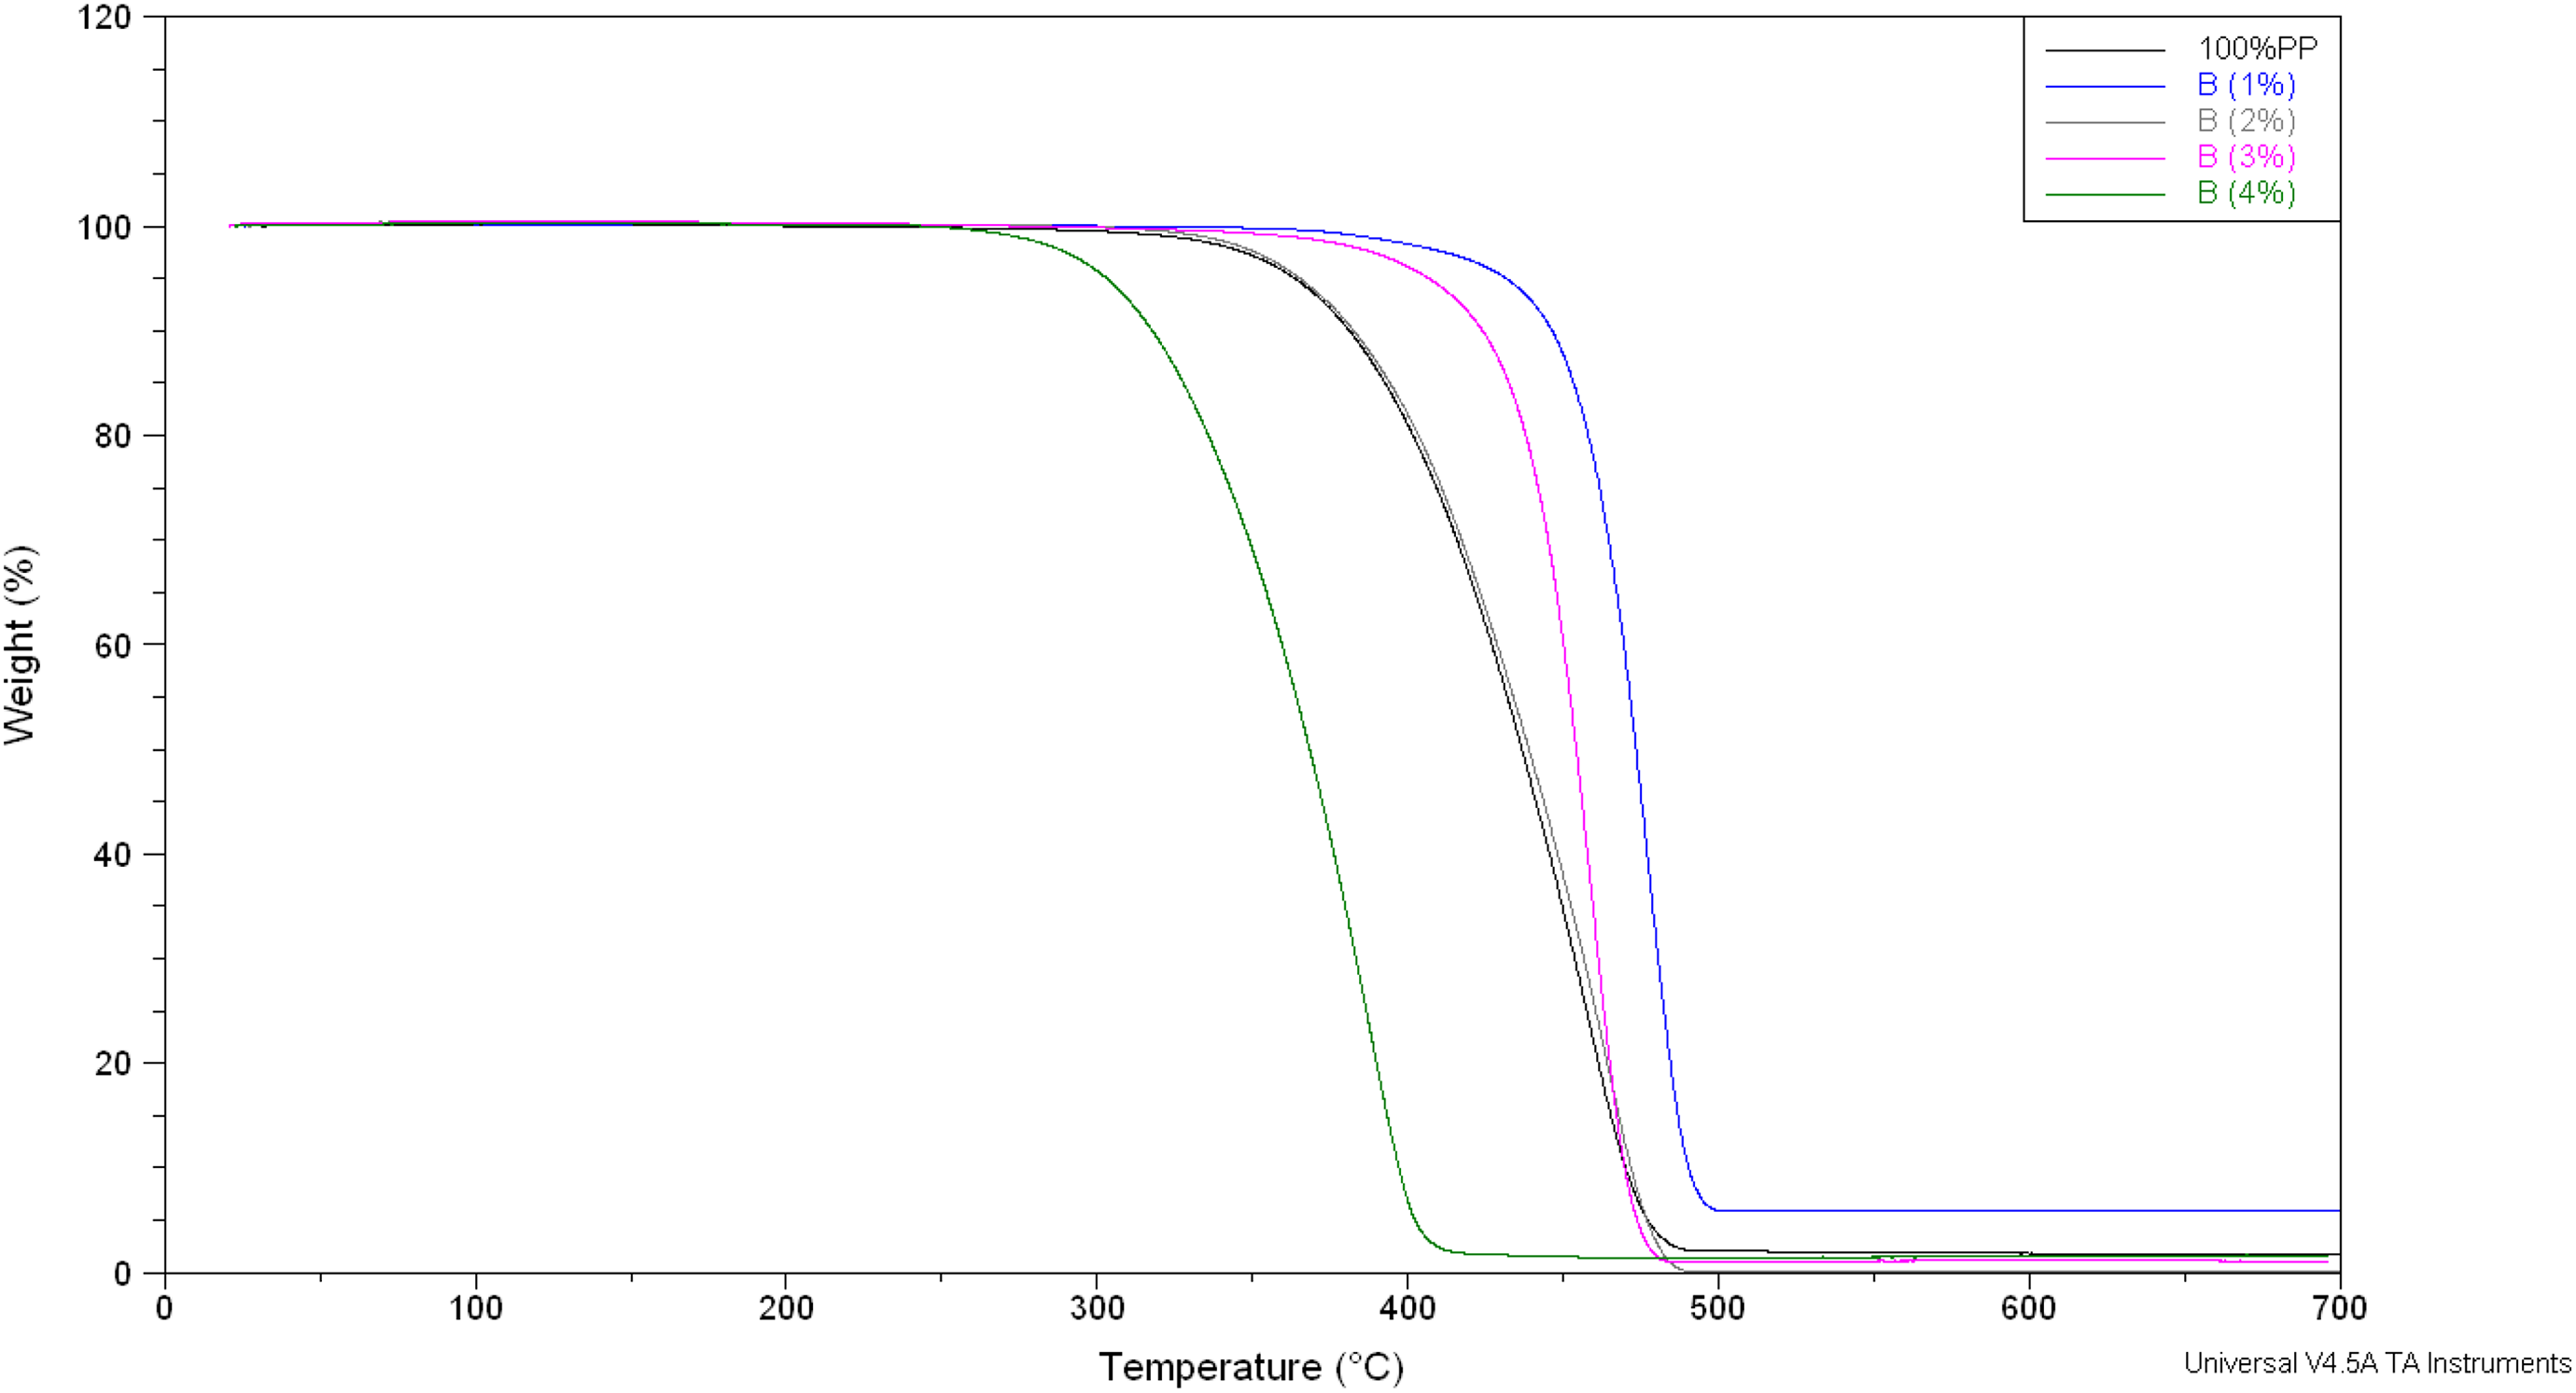
The TGA results for pure PP and B nanocomposite samples are shown in Figure 5 and are tabulated in Table 3. All B samples depicted a single-stage decomposition that is comparable to the pure PP sample.
TGA results for B samples and pure PP.
Results for TGA.
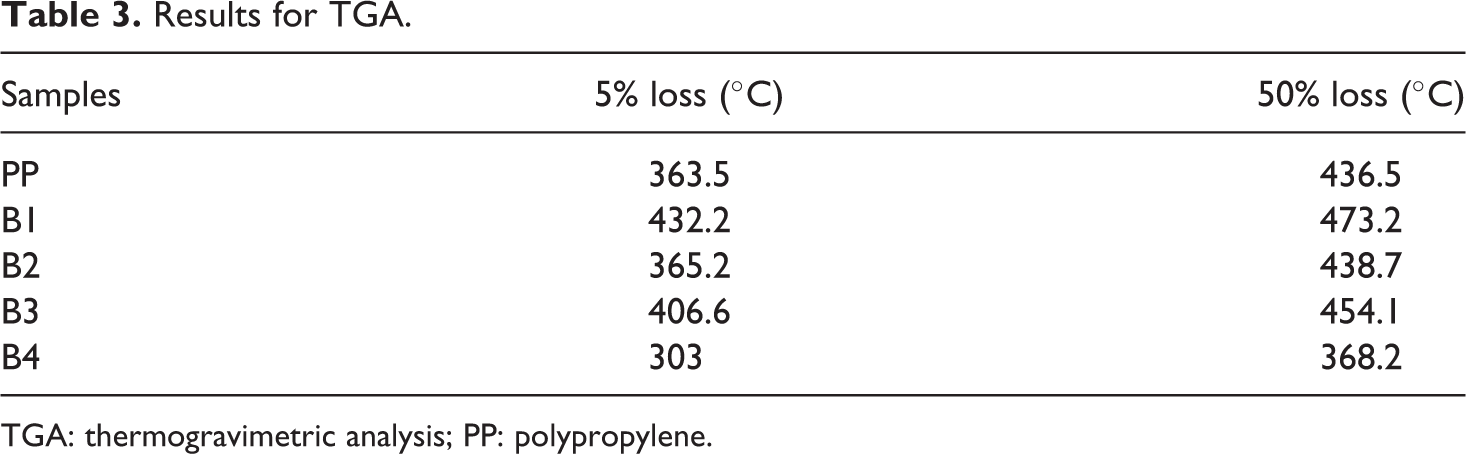
TGA: thermogravimetric analysis; PP: polypropylene.
Figure 5 shows the thermal resistance of the PP and B samples, which was measured under nitrogen gas with increasing temperature. The results were variable showing better thermal resistance for the B1 and B3 samples when compared to the PP sample that can be seen from Table 3. Table 3 also depicts that the 5% weight loss, which indicates the initial stage for decomposition, varies for all B samples. Moreover, B4 sample was noticed to degrade at an earlier temperature when compared to the pure PP sample. The reduced thermal resistance may have been due to the nonuniform dispersion of the X composite sample. Another explanation is that it is attributed to the lower viscous matter for the B4 sample. Moreover, it is also noticed that none of the samples showed an initial decomposition.
Characterization techniques (chemical bonding)
Figure 6 shows an absorption band near wave number 1160 and 1055 cm−1. For the grafting mechanism to be successful, PP must have many unsaturated bonds. The unsaturated PP is grafted with MA with ene reaction. That is the reason that BP was used with PP to have β-scission. Unsaturated bonds are almost exclusively available at the end of the chain by the reaction. 18
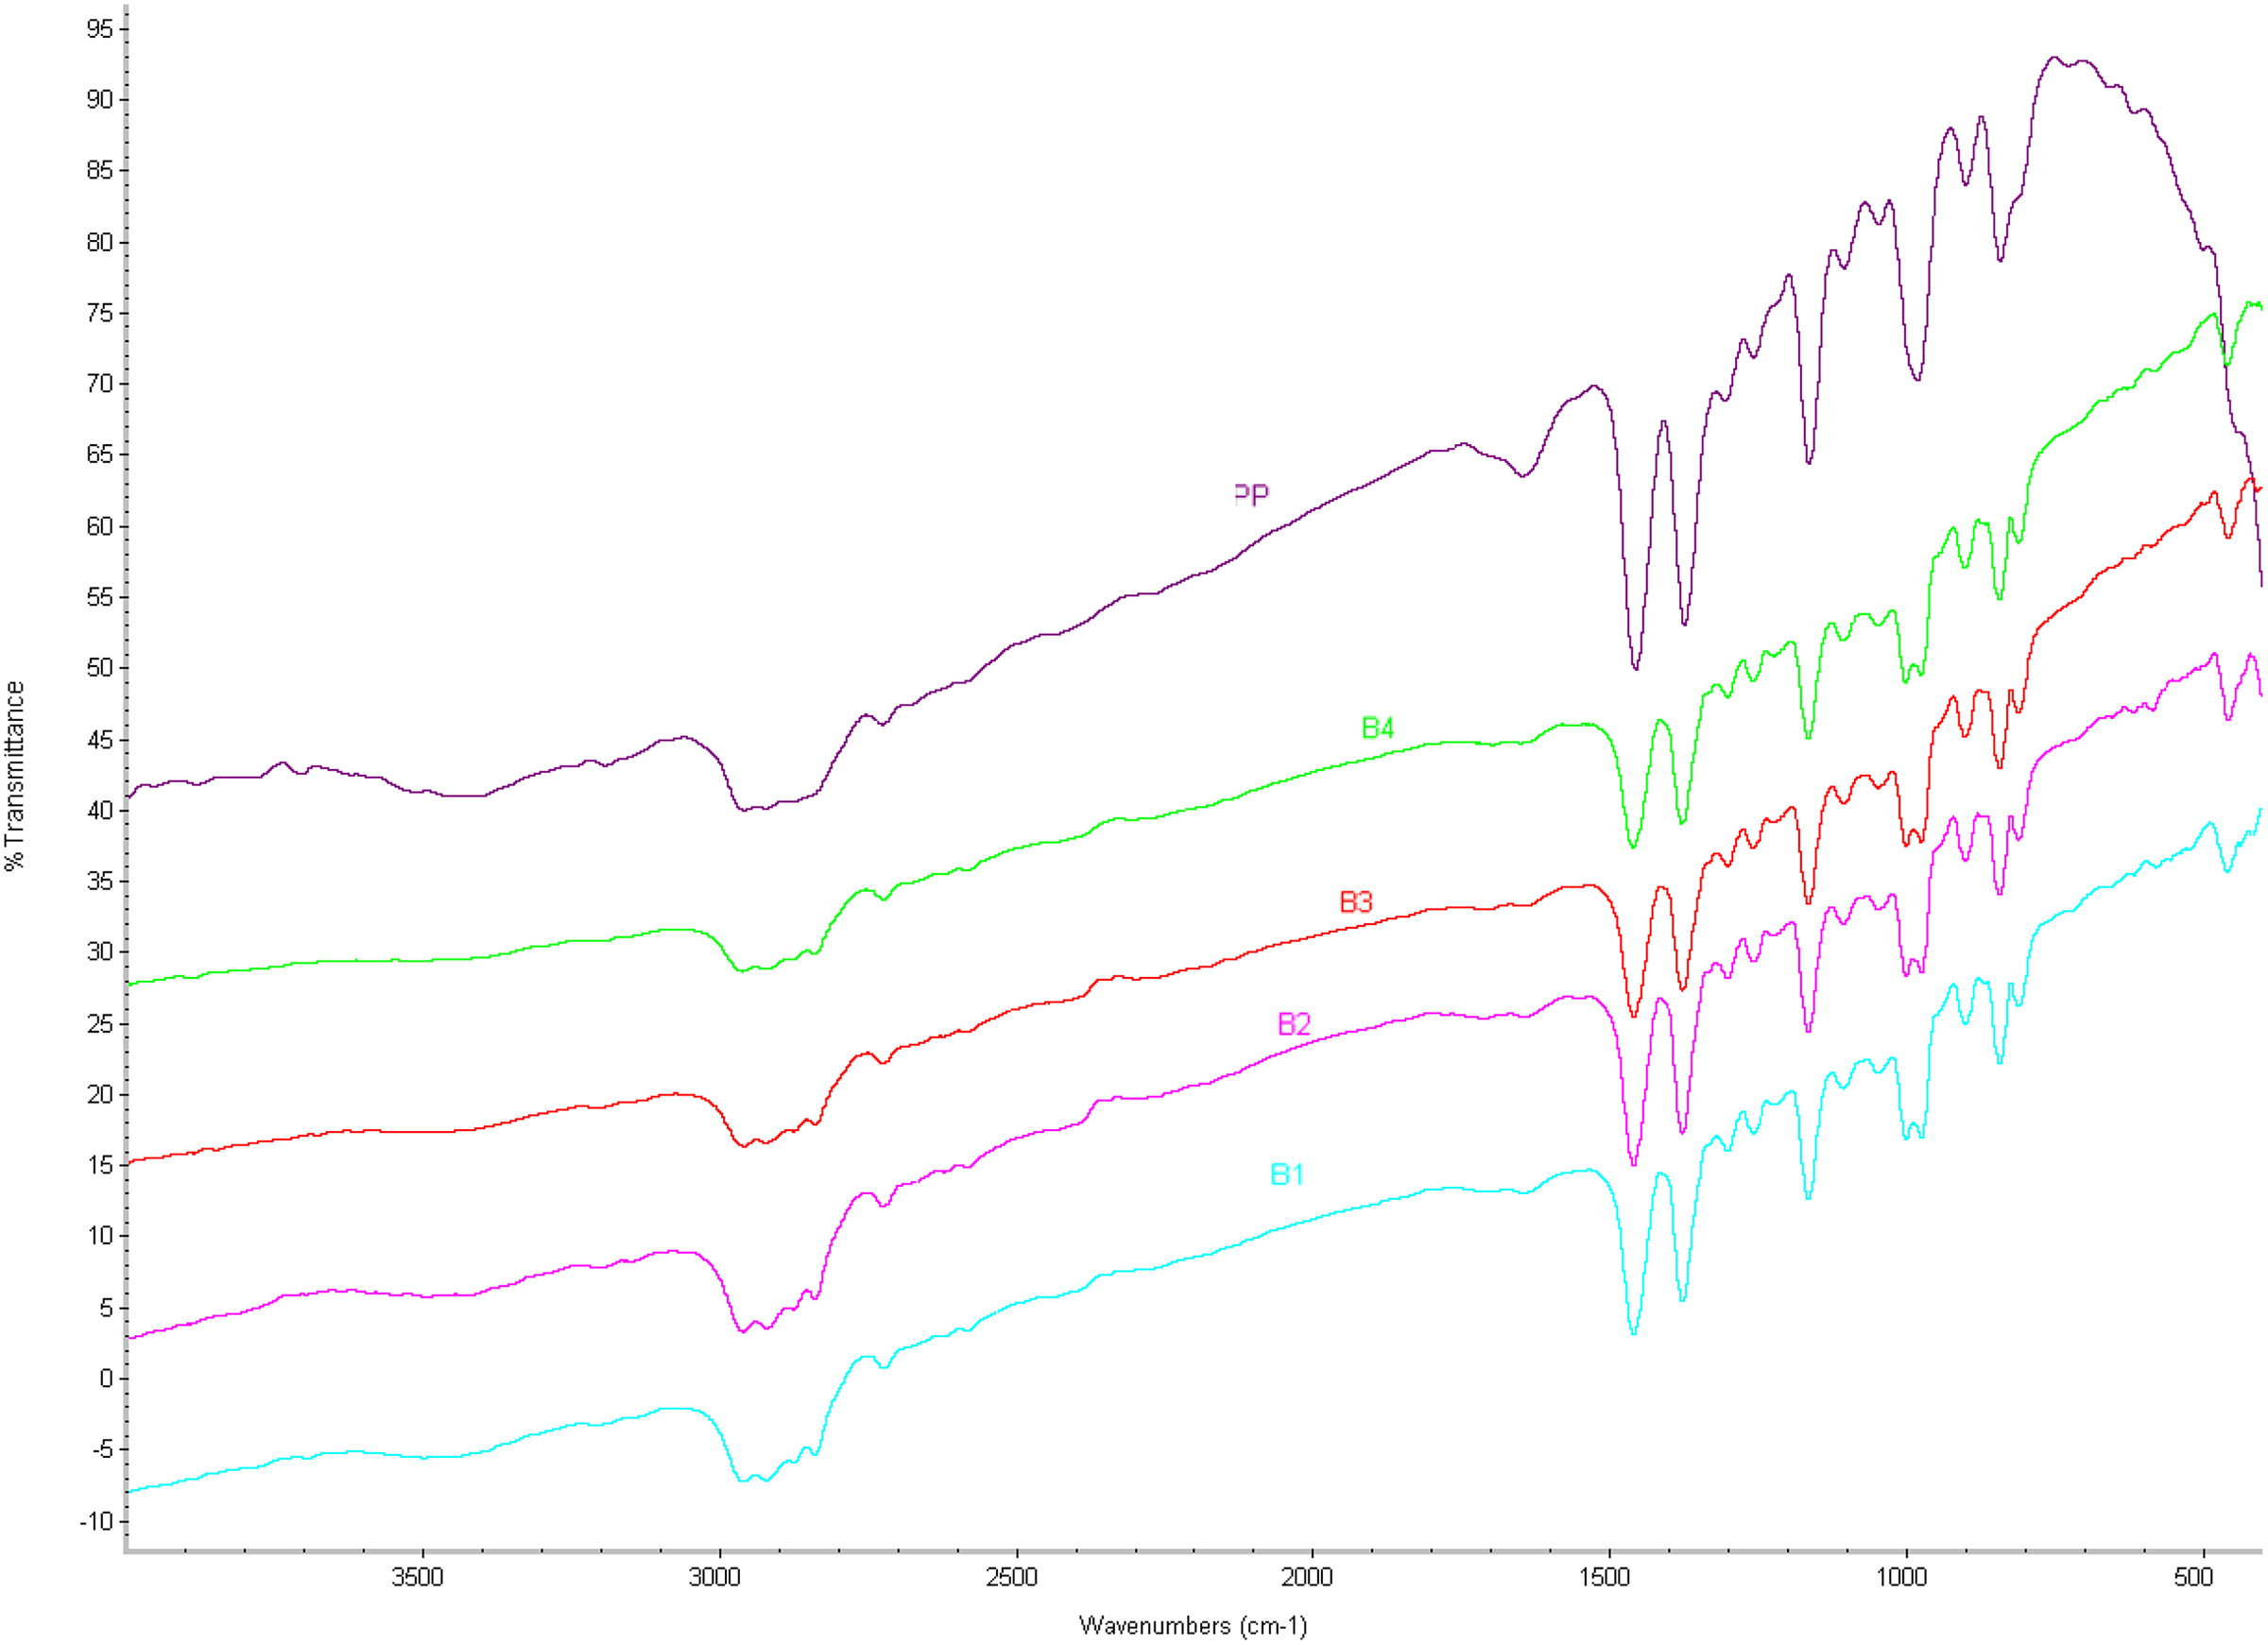
FTIR spectroscopy of the B samples and pure PP.
It can also be shown from the FTIR spectroscopy that there was an absorption band at wave number approximately 900 cm−1 which is assigned to vinylidene. 15 Moreover, it was also noticed that low absorption at wave number ∼1650 cm−1, which is assigned to symmetric C=O stretching of anhydride function grafted on PP. The low intensity of the band at ∼900 and at 1650 cm−1 indicates low yield in MA grafted with PP.
Scanning electron microscopy
Figure 7(a) to (e) shows the cross-sectional image of the pure PP and B samples, respectively.
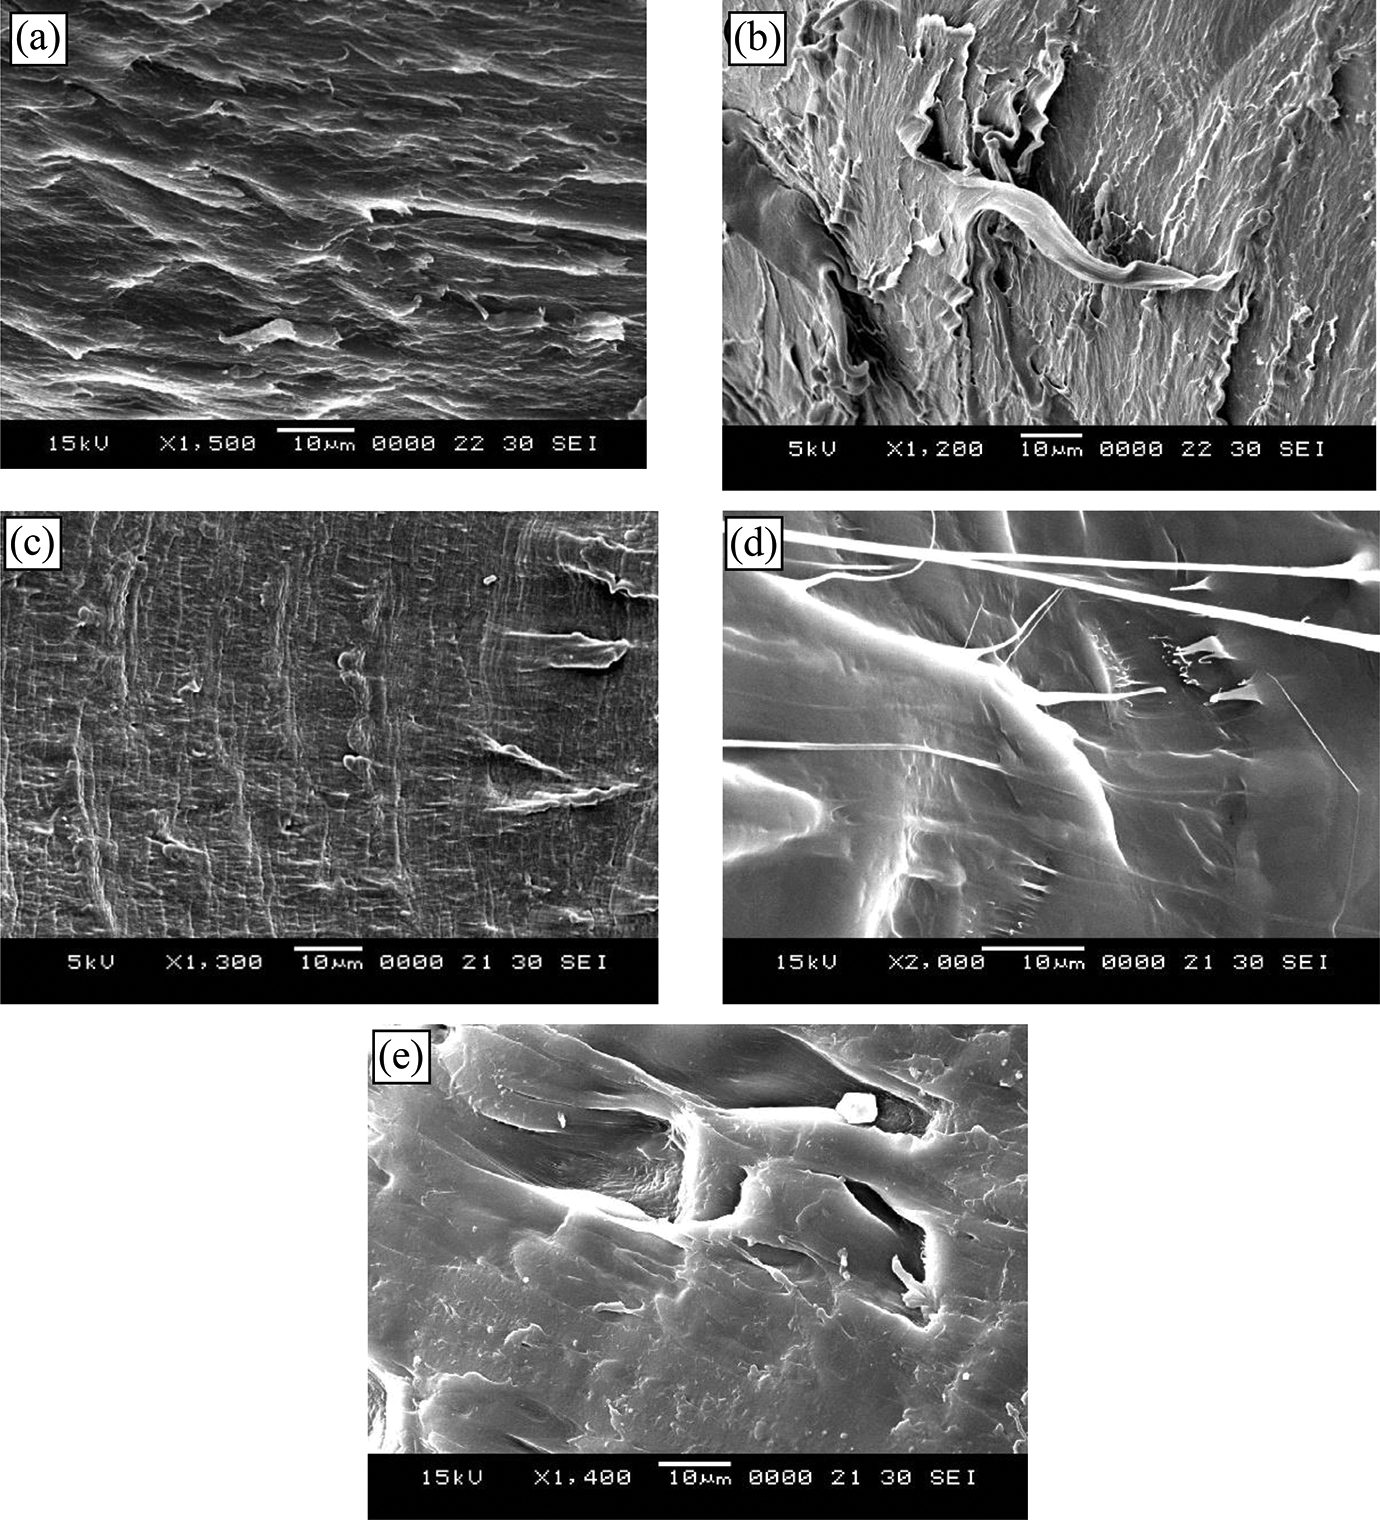
SEM images of (a) pure PP, (b) B1, (c) B2, (d) B3, and (e) B4 samples.
Figure 7(a) to (e) indicating that all B samples nanocomposite samples have good transparency with no visible opacity, highlighting that there is no noticeable agglomeration. However, some micropores are found in the case of 4 wt% (B4 sample) representing the NCC domain. Therefore, slight agglomeration may be found in the micropores’ region.
B1 and B2 samples developed fibrillar structures along the tensile direction and are visibly clear in Figure 7(b) and (c). This implies that significant plastic deformation occurred in the polymer layer during fracture for B1 and B2 samples. However, as X percentage is increased, the plastic deformation is reduced hence the morphological texture alteration in Figure 7(d) and (e). Figure 7(c) shows the image of B2 sample, and it was found that the structure of PP is of interlayer organization, suggesting filamentous (fibrillous) aspect and no susceptibility. The structure of B2 sample was similar to control, however, the interlayers were arranged more closely with a finer filamentous aspect. Moreover, the filling structure looked more compact in the presence of NCC. The improved mechanical properties of B2 sample may be attributed to this compact unidirectional interlayer arrangement. Similarly, Azeredo et al. also reported that the incorporation of NCC in mango puree film showed a compact unidirectional arrangement. 20 It was also observed that the texture of the composites become more elastic (Figures 7(d) and (e) as opposed to Figure 7(b) and (c) and hence, the mechanical properties were degraded as reported in Figures 1–3.
Conclusions
PP-g-MA with the incorporation of NCC nanoparticles was utilized in the construction of nanocomposites to investigate their mechanical, thermal, chemical, and surface morphological properties. It was shown that the mechanical properties significantly improved the tensile strength when PP was grafted with a coupling agent (MA) and NCC (reinforcing agent). The incorporation of (PP-g-MA)/NCC in the composites formulation also led to better dispersion of NCC particles in the PP matrix as revealed from the results of tensile strength, Young’s modulus, hardness, and from SEM observations. FTIR results showed evidence that grafting occurred between MA and PP. Enhancements of the mechanical properties were achieved by incorporation of NCC nanoparticles on PP-g-MA. Thermal analysis showed stable thermal behavior for all B samples compared to pure PP sample. The Tm from DSC were within the same range for all samples. Overall, the incorporation of PP-g-MA with NCC-reinforced particles enhanced the mechanical properties and showed thermal stability.