
Abstract
During the production of unidirectional fibre-reinforced thermoplastic semi-finished products (UD-tapes) in melt-impregnation processes, parameters such as melt viscosity, production speed and impregnation die setup have a significant influence on the quality of the produced UD-tapes. These influences are investigated in this article by producing UD-tapes in an extrusion-based melt-impregnation process with varying impregnation parameters. To quantify the homogeneity of the fibre distribution, a method is presented and applied, in which microscopic cross-sectional images of the UD-tapes are analysed and a homogeneity coefficient is calculated. The porosity is also determined by analysing microscopic cross-sectional images of the UD-tapes. The results show that a decreased melt viscosity and a high number of redirection elements in the die have a positive influence on the homogeneity of the fibre distribution. Furthermore, a significant influence of the melt viscosity, the production speed and the die setup on the porosity was proved.
Introduction
Thermoplastic fibre-reinforced plastics (TP-FRPs) have gained increasing industrial importance in recent years. 1,2 On the one hand, this trend can be attributed to the advantages of the TP matrix, for example, in terms of material recyclability, crash behaviour and shelf life of the semi-finished products. Above all, however, this positive development is due to the economic advantages of processing TP-FRP semi-finished products. These economic advantages result from a high degree of automation in the manufacturing and processing of TP semi-finished products. For example, pre-impregnated sheets can be formed and functionalized in the injection moulding process, which is why they are increasingly being used in automotive series. 3,4 In the past, not only pre-impregnated sheets have gained increasing interest but also unidirectional fibre-reinforced semi-finished products (UD-tapes). Compared to pre-impregnated sheets, UD-tapes have further economic and ecological advantages. Because of their application, on the one hand, the material can be saved and waste reduced, and on the other hand, they can be produced and post-processed in automated processes. For example, with the help of highly productive and automated tape laying systems, laminates can be produced from UD-tapes in which the fibre orientation or the laminate thickness is locally adapted to the later loading of the component. Due to advanced material efficiency and waste reduction, the possibility of an application-optimized laminate setup results in economic and ecological advantages in the manufacture of TP fibre-reinforced components. 5 –8
In the past, many different processes have been developed for the production of TP UD-tapes. These manufacturing processes can be categorized as process groups of film-, powder-, solvent-, polymer–fibre- and melt impregnation. Whereas in film-, powder-, solvent- and polymer–fibre impregnation, the matrix material has to be pre-treated first prior to the actual UD-tape production process, and in melt impregnation, the matrix material can be processed as untreated commercially available granulates. 9 –14
Focusing on the production of the UD-tapes in the melt-impregnation process, the influencing variables can be classified into the material influences and process influences. While the material influences depend on the properties of the matrix (e.g. viscosity and melt temperature) and fibre (e.g. roving titer, sizing, and fibre brittleness) used, the process influences are affected by the setup and settings of each individual process components. The impregnation unit is the component, which has the most significant influence on the resulting quality during the production of UD-tapes in the melt-impregnation process. 9 In the impregnation unit, the reinforcing fibres are dragged through a die and continuously are impregnated with the matrix. The fibres are impregnated by a melt flow parallel and perpendicular to the fibre orientation, with the perpendicular part dominating. Therefore, the impregnation process can be approximated by the Darcy law (equation (1)), which generally describes the flow of a fluid through a porous medium. 9,10,12,13,15
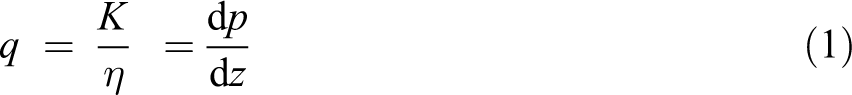
where q is the area-related flow rate, K is the permeability of the fibre bundle, η is the dynamic viscosity of the matrix material and dp/dz is the pressure gradient perpendicular to the fibre direction. By integrating this equation, the impregnation time Δt can be approximated as shown in equation (2) (assuming a pressure-independent permeability) 9,12:
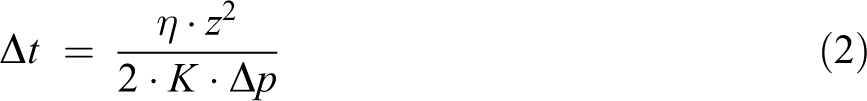
where Δp corresponds to the pressure difference between the beginning and the end of the impregnation path z (perpendicular to the fibre direction). From equation (2), it can be deduced that for an acceleration of the impregnation process, a reduction of the dynamic viscosity and the impregnation path, as well as an increase of the pressure gradient and the permeability, is necessary. By use of the Darcy equation, it is possible to make qualitative estimations about the impregnation behaviour with regard to porosity respectively the void content of the produced UD-tape. 9,12,16
In addition to porosity, the quality of UD-tapes is mainly determined by morphological parameters, such as fibre volume content (FVC), fibre orientation, thickness of the matrix border area, fibre ondulations, crystallinity and homogeneity of the fibre distribution. 17 –19 The homogeneity of the fibre distribution in particular is of great importance. On the one hand, an inhomogeneous fibre distribution in the UD-tape cannot be compensated in downstream processes and is also reducing mechanical properties perpendicular to the fibre direction. On the other hand, the homogeneity of the fibre distribution also influences the impregnation process itself, since an inhomogeneity can cause local variations in permeability along the width. Thus, a homogeneous distribution of the fibres over the width is important even before it enters the die, which can be optimized by an upstream spreading process or the processing of pre-spread fibres. 17,20 –22 While the determination of porosity by means of ashing, chemical extraction or the evaluation of microscopic cross-sectional images is already state of the art, no suitable method exists for quantifying the homogeneity of the fibre distribution. 23 –25 Therefore, it is currently common to evaluate the homogeneity of the fibre distribution on the basis of microscopic cross-sectional images subjectively.
In the present study, TP UD-tapes are produced in an extrusion-based melt-impregnation process and the influence of the production speed, die temperature and die setup on the porosity and homogeneity of the fibre distribution is investigated. For this purpose, the melt-impregnation process parameters will be varied with reference to the influencing variables on the impregnation process derived from the Darcy law as described above. Furthermore, a method for quantifying the homogeneity of fibre distribution based on microscopic cross-sectional images is presented and applied.
Experiments
Production of UD-tape samples
To investigate the influence of melt-impregnation parameters during UD-tape production on the fibre distribution homogeneity and the porosity, UD-tape samples with varying quality have been produced. For this purpose, a melt-impregnation–based UD-tape production line was used. The schematic setup of the production line is displayed in Figure 1.
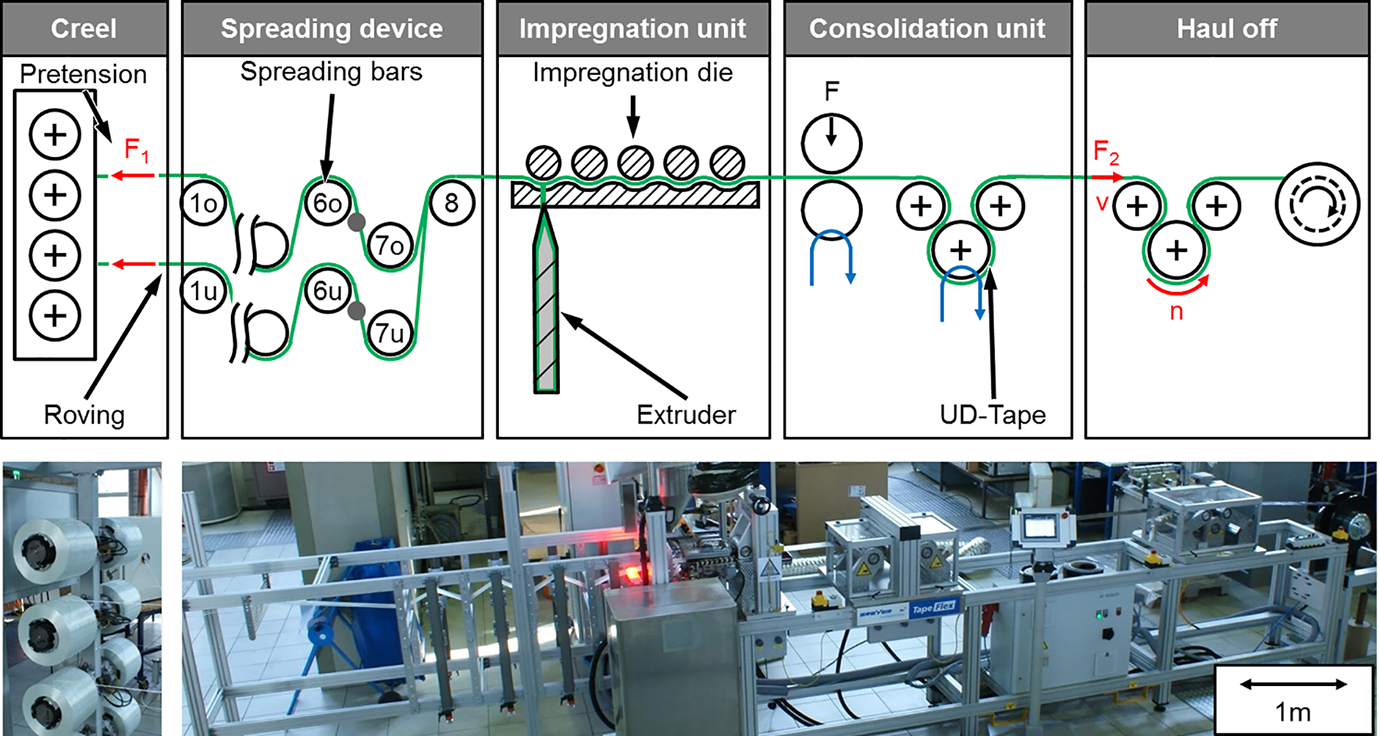
Melt-impregnation-based UD-tape production line (a to g).
The UD-tape line can be divided into five components: creel, spreading device, melt-impregnation unit (extruder and impregnation die), consolidation unit and haul off. By use of the creel of the TEXMER GmbH, Petersberg-Bockels, Germany, a defined pretension can be generated during the unwinding of the rovings. Thus, on the one hand, the spreading quality can be influenced and, on the other hand, an even and twist-free unwinding of the rovings can be ensured. The spreading of the rovings is realized by a spreading device. By use of the spreading device, the oval cross-sectional shape of the rovings is transferred to a homogeneously spread shape. The rovings can be spread via eight chromium-coated spreading bars and then merged to a broad fibre bundle. The spread fibre bundle is then impregnated with the TP matrix material. The used melt-impregnation unit consists of an extruder and an impregnation die, both produced by the Breyer GmbH Maschinenfabrik (Singen, Germany). The extruder is fed with the standard TP granulate and conveys the molten matrix material into the heated impregnation die. The spread fibres are dragged through the die and impregnated with the matrix material. While the fibres are pulled through the impregnation die, the fibres are deflected by means of fixed rolls. Due to the modular design of the die, the number and diameter of the redirection rolls can be varied. After impregnation, the impregnated fibre bundle is dragged through a consolidation unit, which consists of a calendar and chill rolls. In the calendar, the final tape geometry and surface quality are set under a defined pressure. Finally, the UD-tape is hauled off and coiled. The production speed of the tape line and the required dragging force is generated by the omega haul off.
As the aim of the present study is the investigation of the influence of the melt-impregnation parameters on the porosity and the homogeneity of the fibre distribution of the UD-tape, the setup and parameters of the creel and the consolidation unit were kept constant. Therefore, the roving pretension was set to 10 N. Furthermore, eight glass fibre (GF) rovings of the type TufRov 4599 (2400tex) produced by the PPG Industries Inc. (Pittsburgh, PA, USA) were mounted on the creel. Moreover, a matrix material, a polypropylene (PP) of the type FPC 100 produced by the Saudi Basic Industries Corporation, Riad, Saudi Arabia, was used. To improve the contrast of the cross-sectional micrographs, 2.5% of a carbon black masterbatch was added to the PP granulates.
As described in the introduction, the major melt-impregnation parameters that influence the porosity of the final UD-tape are the melt viscosity, the impregnation distance, the impregnation pressure and the impregnation time. Furthermore, those parameters have an influence on the fibre distribution homogeneity. 9,12,16 Both the impregnation distance and the pressure are influenced by the setup of the impregnation die (number and diameter of redirection rolls). The impregnation time is influenced by the production speed. TP melts generally show a decrease in viscosity with increasing melt temperatures. Due to this correlation between viscosity and temperature, the melt viscosity can be influenced by the heating temperature of the extruder and the impregnation die. In previous investigations, rheological measurements have been carried out for the matrix material used here (Sabic FPC 100). The viscosity curves shown in Figure 2 (left) were obtained by the use of a high-pressure capillary rheometer and show the temperature dependence of the viscosity of the matrix material used in the presented experiments. It can be seen that the viscosity decreases with increasing temperatures. This is further illustrated by the comparison of the zero viscosities at investigated temperatures (Figure 2, right). The die temperature indicated in the following was measured directly at the melt input of the impregnation die and thus corresponds very closely to the melt temperature at the input. In combination with the previously described relationship between melt temperature and viscosity, it is thus possible to achieve a viscosity reduction in the melt by increasing the temperature in the die.
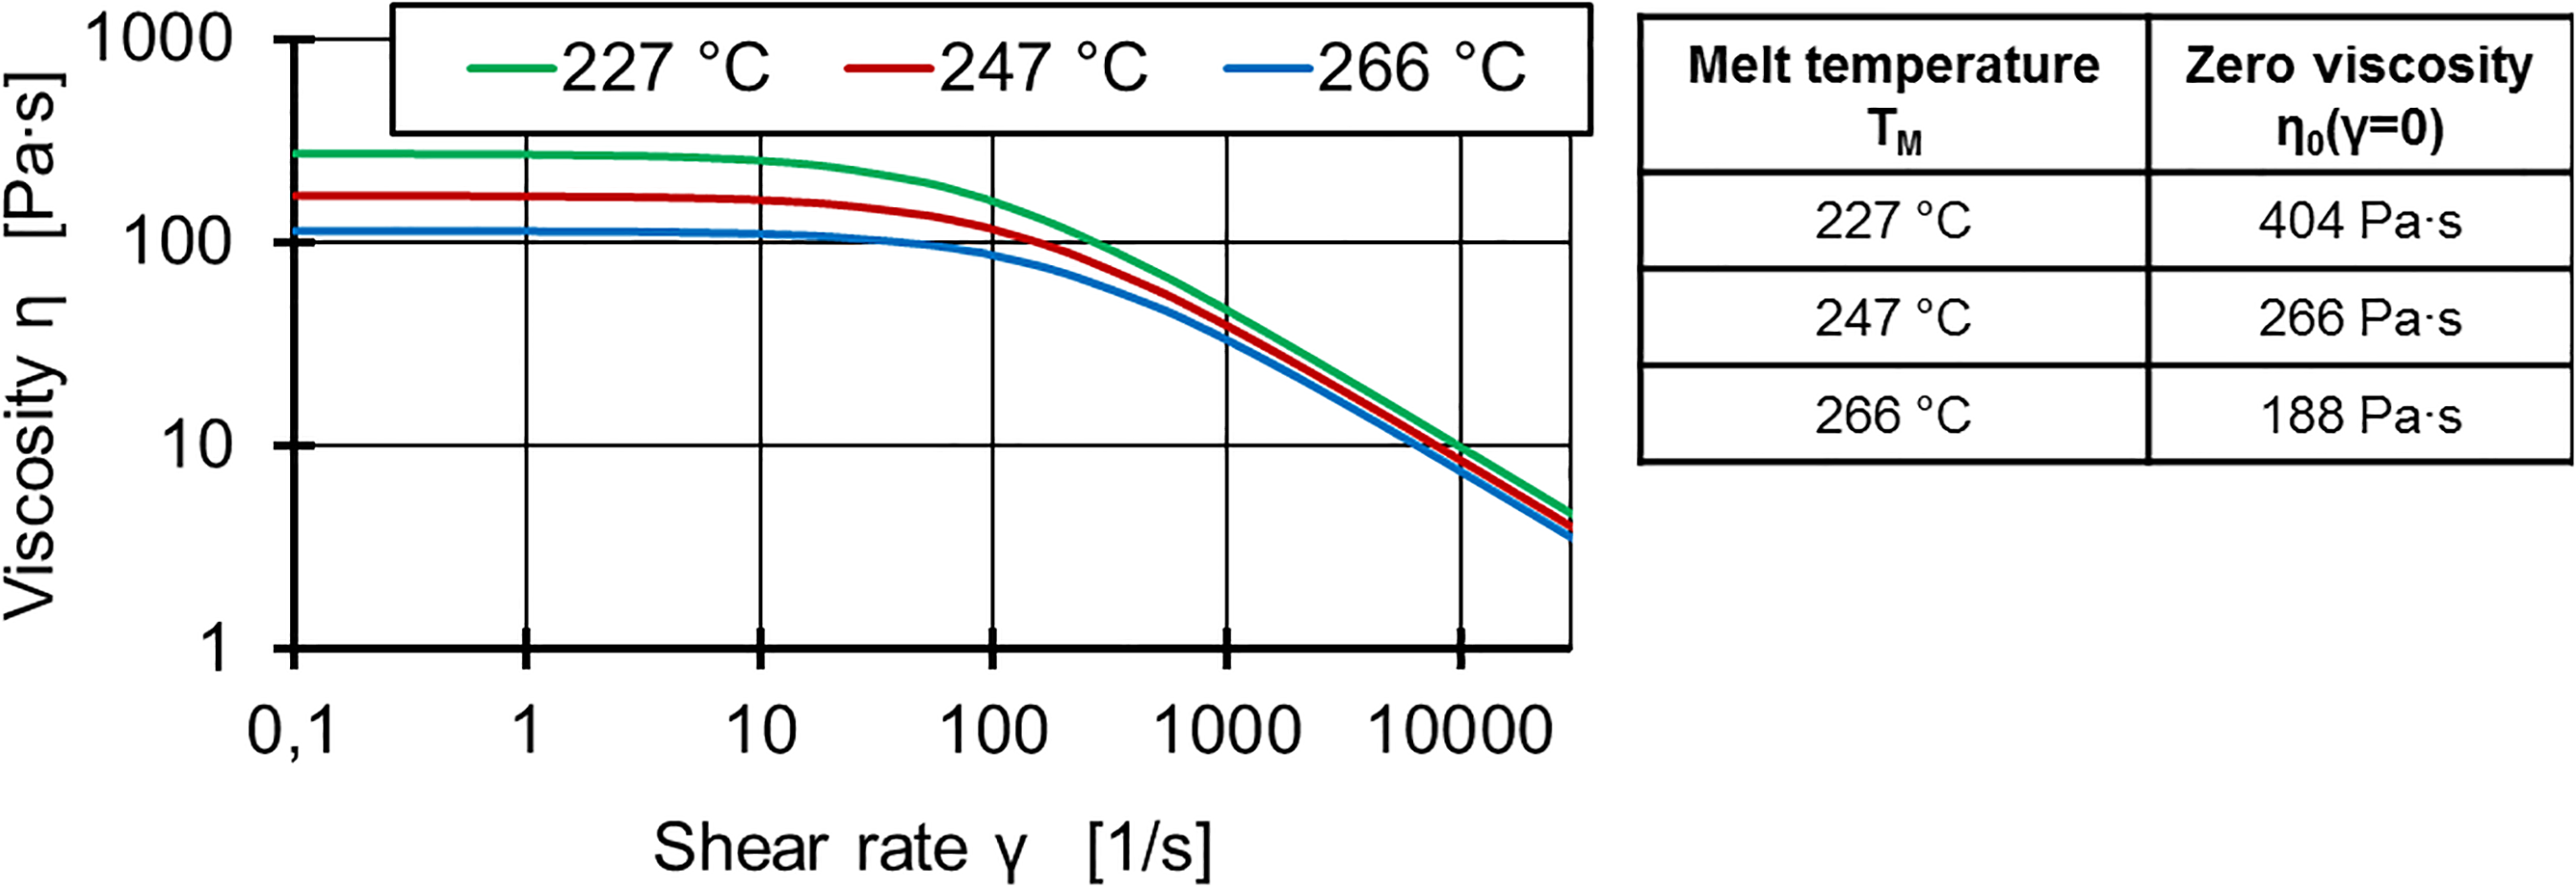
Viscosity curves of Sabic FPC 100.
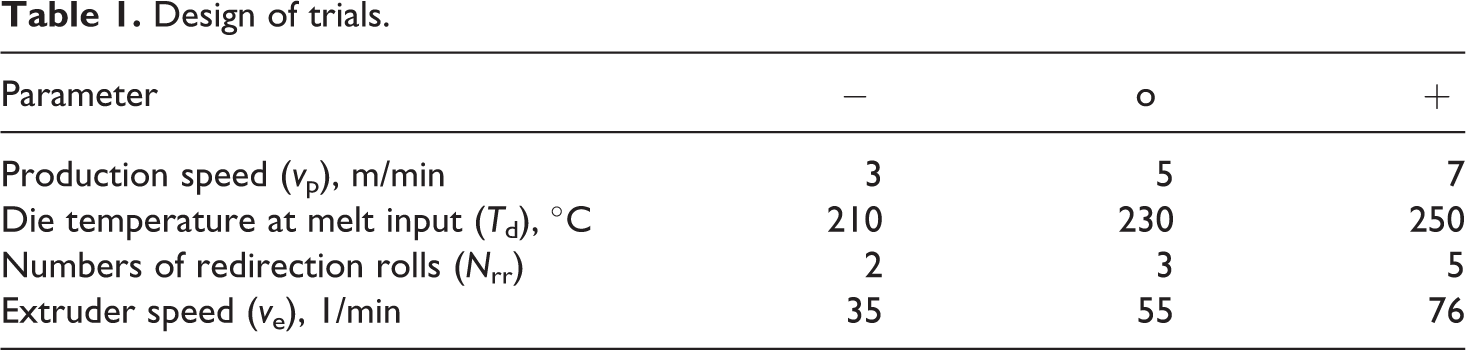
The experimental plan listed in Table 1 is derived from the interrelations described above. The diameter of the redirection rolls is 17.5 mm for all trials. As the production speed is also influencing the FVC of the produced UD-tape, the extruder speed was varied in correlation with the production speed to achieve an FVC of 45 ± 2 vol%.
Design of trials.
Preparation of micrographs
In the present study, the applied methods for the quantification of the fibre distribution homogeneity and the porosity of the produced UD-tapes are based on an analysis of micrographic cross sections. For the required micrographs, two samples with a width of 20 mm and a depth of 10 mm were extracted perpendicular to the fibre direction from the middle of the UD-tapes at two positions in distances of 10 m (Figure 3). Overall, six samples were extracted from the UD-tape per trial. Those were then embedded in an epoxy resin and polished to produce microscopic images of the cross sections. The micrographs were taken with a digital reflected light microscope VHX600 of the Keyence Corporation (Osaka, Japan). For the quantification of the fibre distribution, homogeneity micrographs with a magnification of 200× and for porosity with a magnification of 400× were taken.
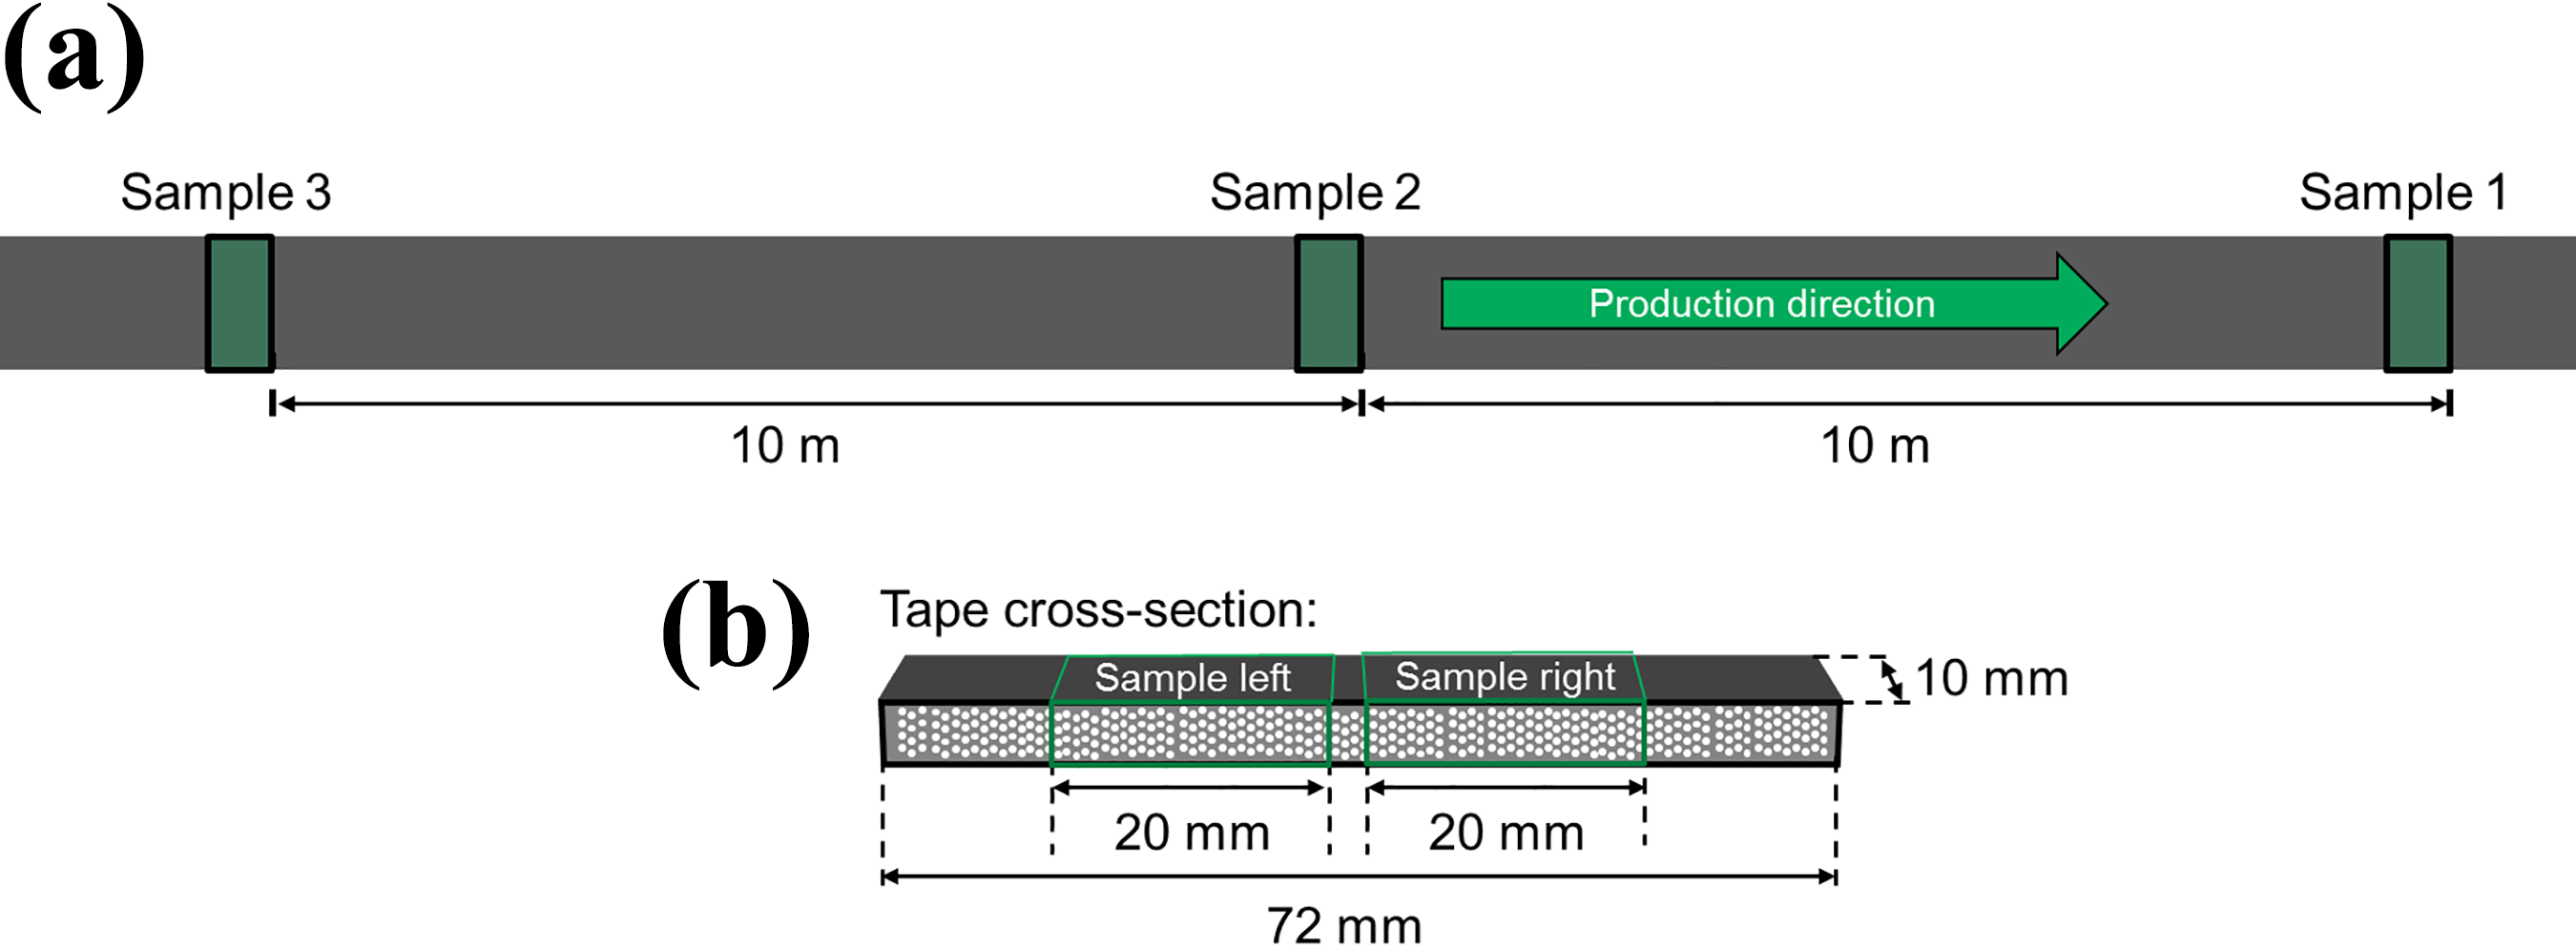
Positions of the samples for the microscopic analysis (a and b).
Quantification of the porosity
For the quantification of porosity, the micrographs were analysed by use of the open-source software ImageJ. Pores can be identified in the micrographs as black areas. However, the evaluation is limited by the fact that tape edges, fibre edges and fibre breakouts also form black areas. Therefore, after the micrographs were converted to greyscale images, black areas, which are obviously no pores, were manually coloured in white. Subsequently, the actual analysis of the micrograph was done by defining a greyscale threshold, so that all pores in the image are marked blue by the analysis software. Finally, the porosity is calculated from the quotient of the blue-coloured area (pores) and the total area of the analysed UD-tape cross section. It must be mentioned that only blue areas with a size of more than 15 pixels were rated as pore. Overall, 12 micrographs per trial were analysed to determine porosity. A representative evaluation of an UD-tape cross section is shown in Figure 4.
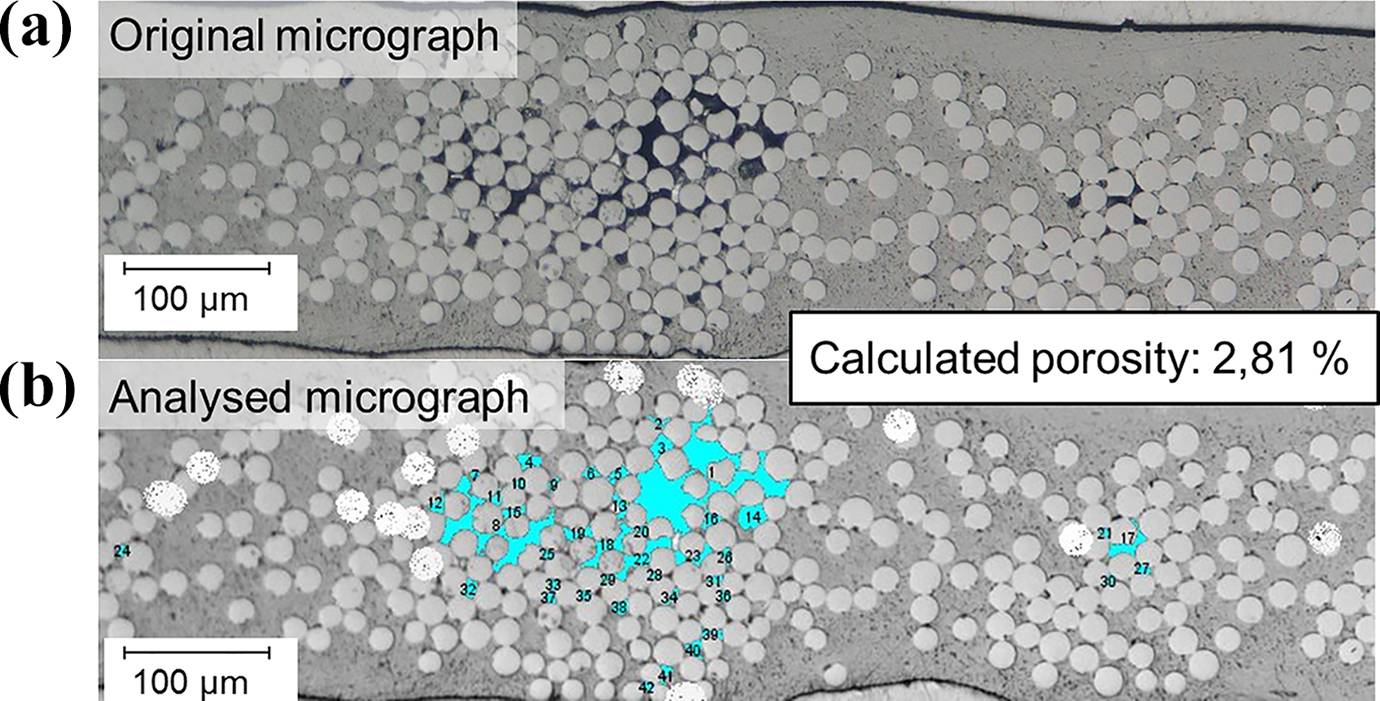
Representative porosity analysis of an UD-tape cross-section: (a) original micrograph and (b) analysed micrograph.
Quantification of the fibre distribution homogeneity
The method presented in this study to quantify the fibre distribution homogeneity was set up at the IKV – Institute for Plastics Processing in Industry and Craft at RWTH Aachen in cooperation with the Aachen Center for Integrative Lightweight Production. The method is based on an automated image evaluation algorithm in combination with the Voronoi tessellation. Using this method, not only the relationship of the fibres to each other but also their relationship to the entire observed cross section is examined. This allows the fibre distribution homogeneity of a UD-tape to be quantified locally. To apply the Voronoi method, microscopic cross-sectional images are analysed. In a pre-processing step, the images are binarized and the centres of each filament are determined. Subsequently, the Voronoi tessellation algorithm is applied to the pre-processed micrograph. Voronoi cells are formed around each fibre centre. With respect to the Euclidean metric, each image pixel within a cell has a shorter distance to the fibre centre of the cell than to any other fibre centre. The cell boundaries that are formed consist of those points that have the same Euclidean distance to two or more fibre centres. 26 The process of the methodology described is shown in Figure 5 using a representative UD-tape cross section.
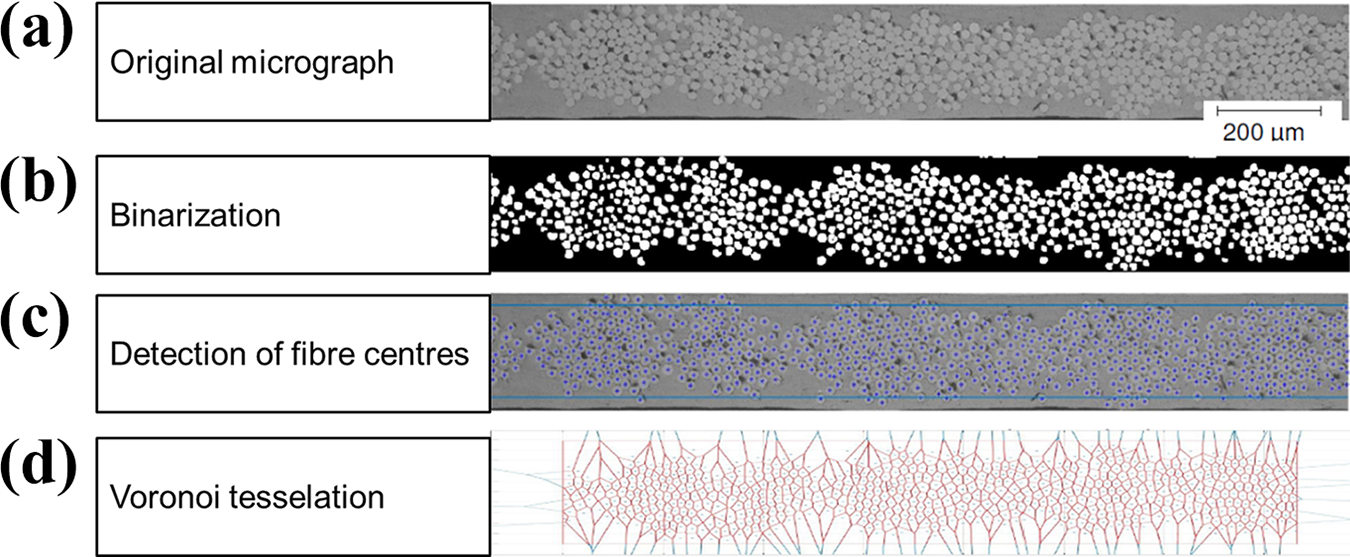
Image evaluation algorithm (a to c) and Voronoi tessellation (d).
After building the Voronoi cells, the size of each cell is determined, and the arithmetical average of the cell size as well as the standard deviation (SD) of the cell sizes along the cross section is calculated. Furthermore, the homogeneity coefficient H is defined for the quantification of the homogeneity of fibre distribution, which is calculated from the quotient of the SD and average of the cell sizes. This means that a homogeneous cell size distribution results in a low homogeneity coefficient and thus in a homogeneous fibre distribution. The theoretical extremum of an ideal hexagonal arrangement of the fibres results in a coefficient of H = 0, since all cells have the same sizes, and the SD is therefore equal to 0. However, the other extremum of an extremely grouped distribution results in a high homogeneity coefficient (H > 1), since the cell sizes deviate strongly and thus the SD is correspondingly high. For evaluation, the SD s and mean values of the Voronoi cells of multiple UD-tape cross sections are displayed in Figure 6. The homogeneity of the measured fibre distribution is classified in Figure 6 in three areas. Fibre distributions with a homogeneity coefficient greater than one have a strongly grouped fibre orientation and low homogeneity and are plotted in the red area of the diagram. The fibre distributions in the grey area of the diagram have a medium homogeneity or rather a random distribution and a homogeneity coefficient between 1 and 0.3. The distinction between the medium (red area) and the high (green area) homogeneity is made by means of the gamma distribution function. Fibre distributions that are classified as high, thus, have a homogeneity coefficient less than or equal to 0.3 and are plotted in the green area of the diagram. In the presented studies, overall per trial, at least 12 micrographs were analysed to determine the fibre distribution homogeneity.
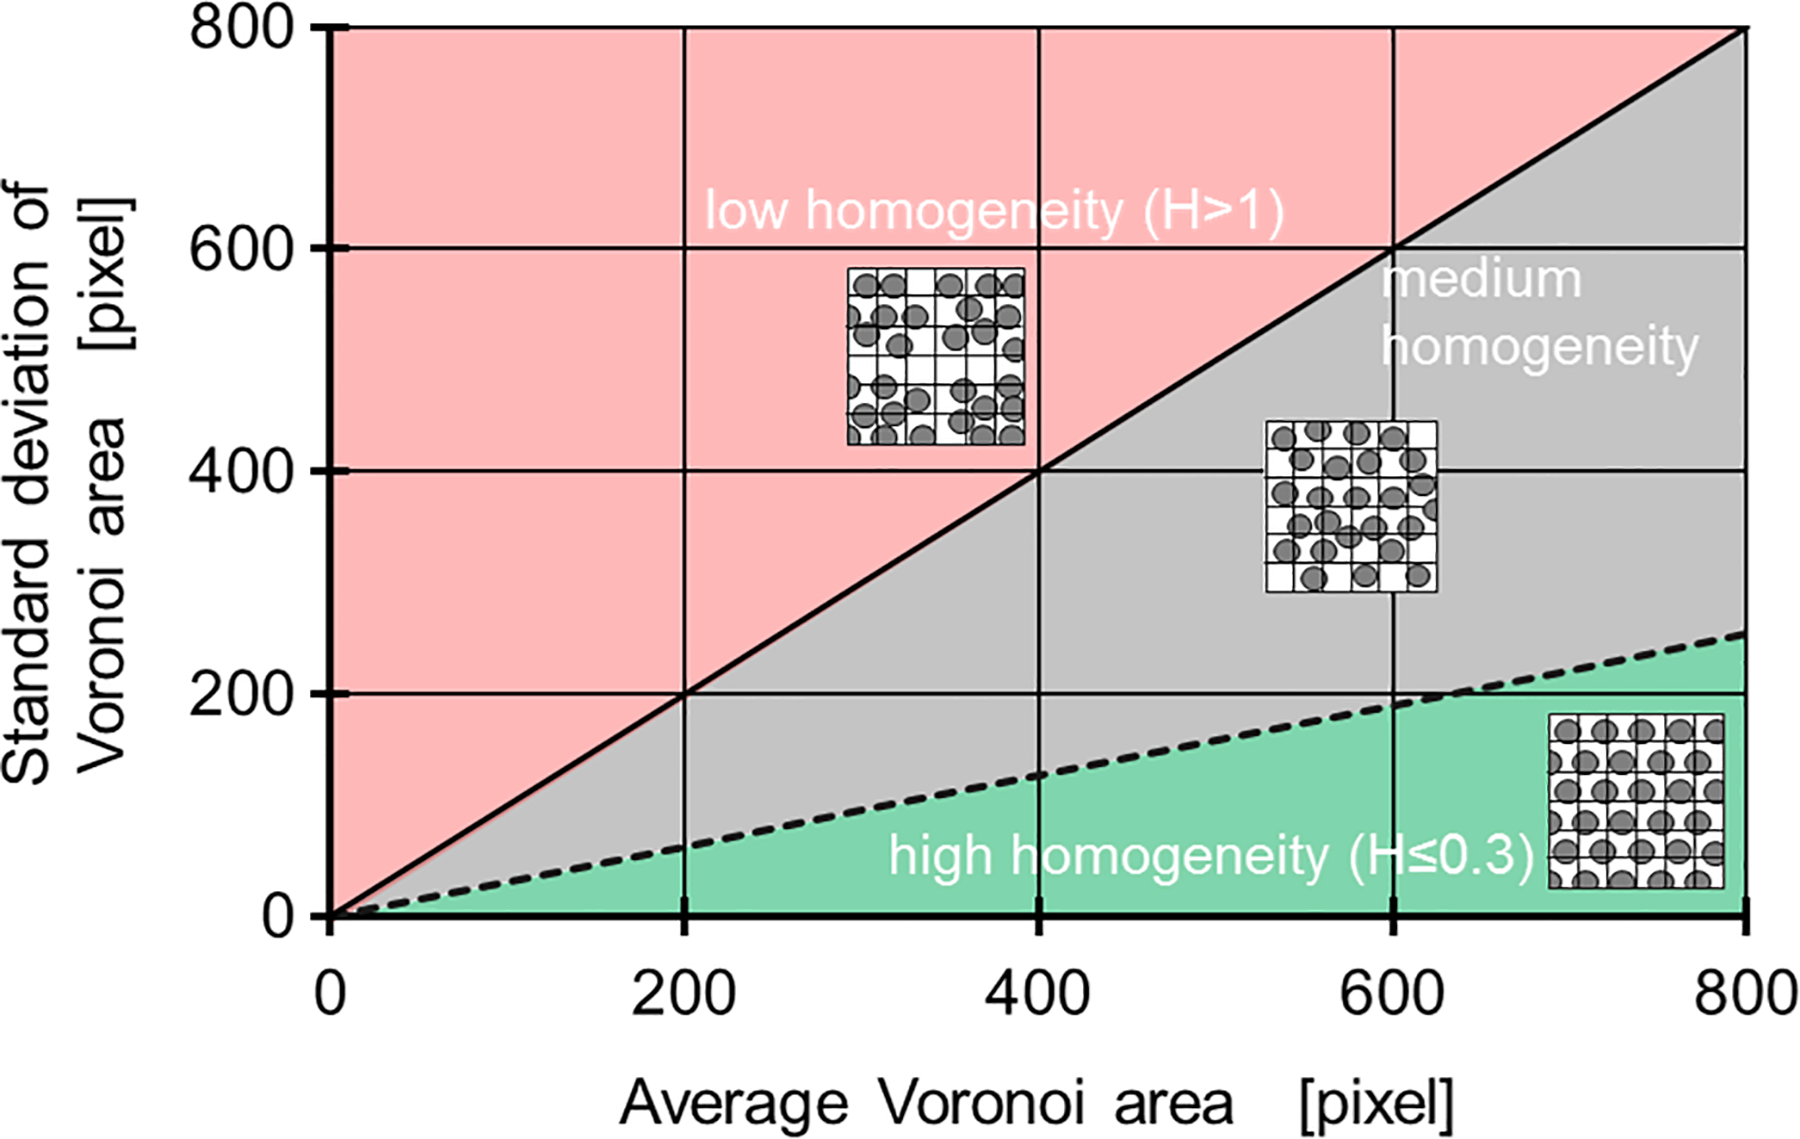
Classification diagram for the fibre distribution homogeneity.
Results and discussion
Analysis of porosity
The results of the porosity measurement by microscopic analysis of UD-tape cross sections are shown in the box plot diagrams of Figure 7. The left diagram shows the measured porosity P of the UD-tapes produced with N rr = 5 redirection rolls. As expected for all applied die temperatures T d, an increasing speed v p results in an increase of the porosity P. This effect can be explained by the interrelation between production speed v p and impregnation time. With increasing production speed v p, the impregnation time decreases and consequently the porosity increases. Moreover, it can be seen that regardless of the die temperature T d, a very low porosity (average P ≤ 0.18%) was achieved at a production speed of v p = 3 m/min. However, a distinctive influence of the die temperature T d on the porosity P can be overserved by comparing the porosities of the trials done at v p = 7 m/min production speed. Here, an increase of the die temperature T d results in a decrease of the porosity P. Due to the increased production speed v p, the impregnation time is comparatively low. This can be compensated by increasing the die temperature T d and consequently reducing the melt viscosity η m.
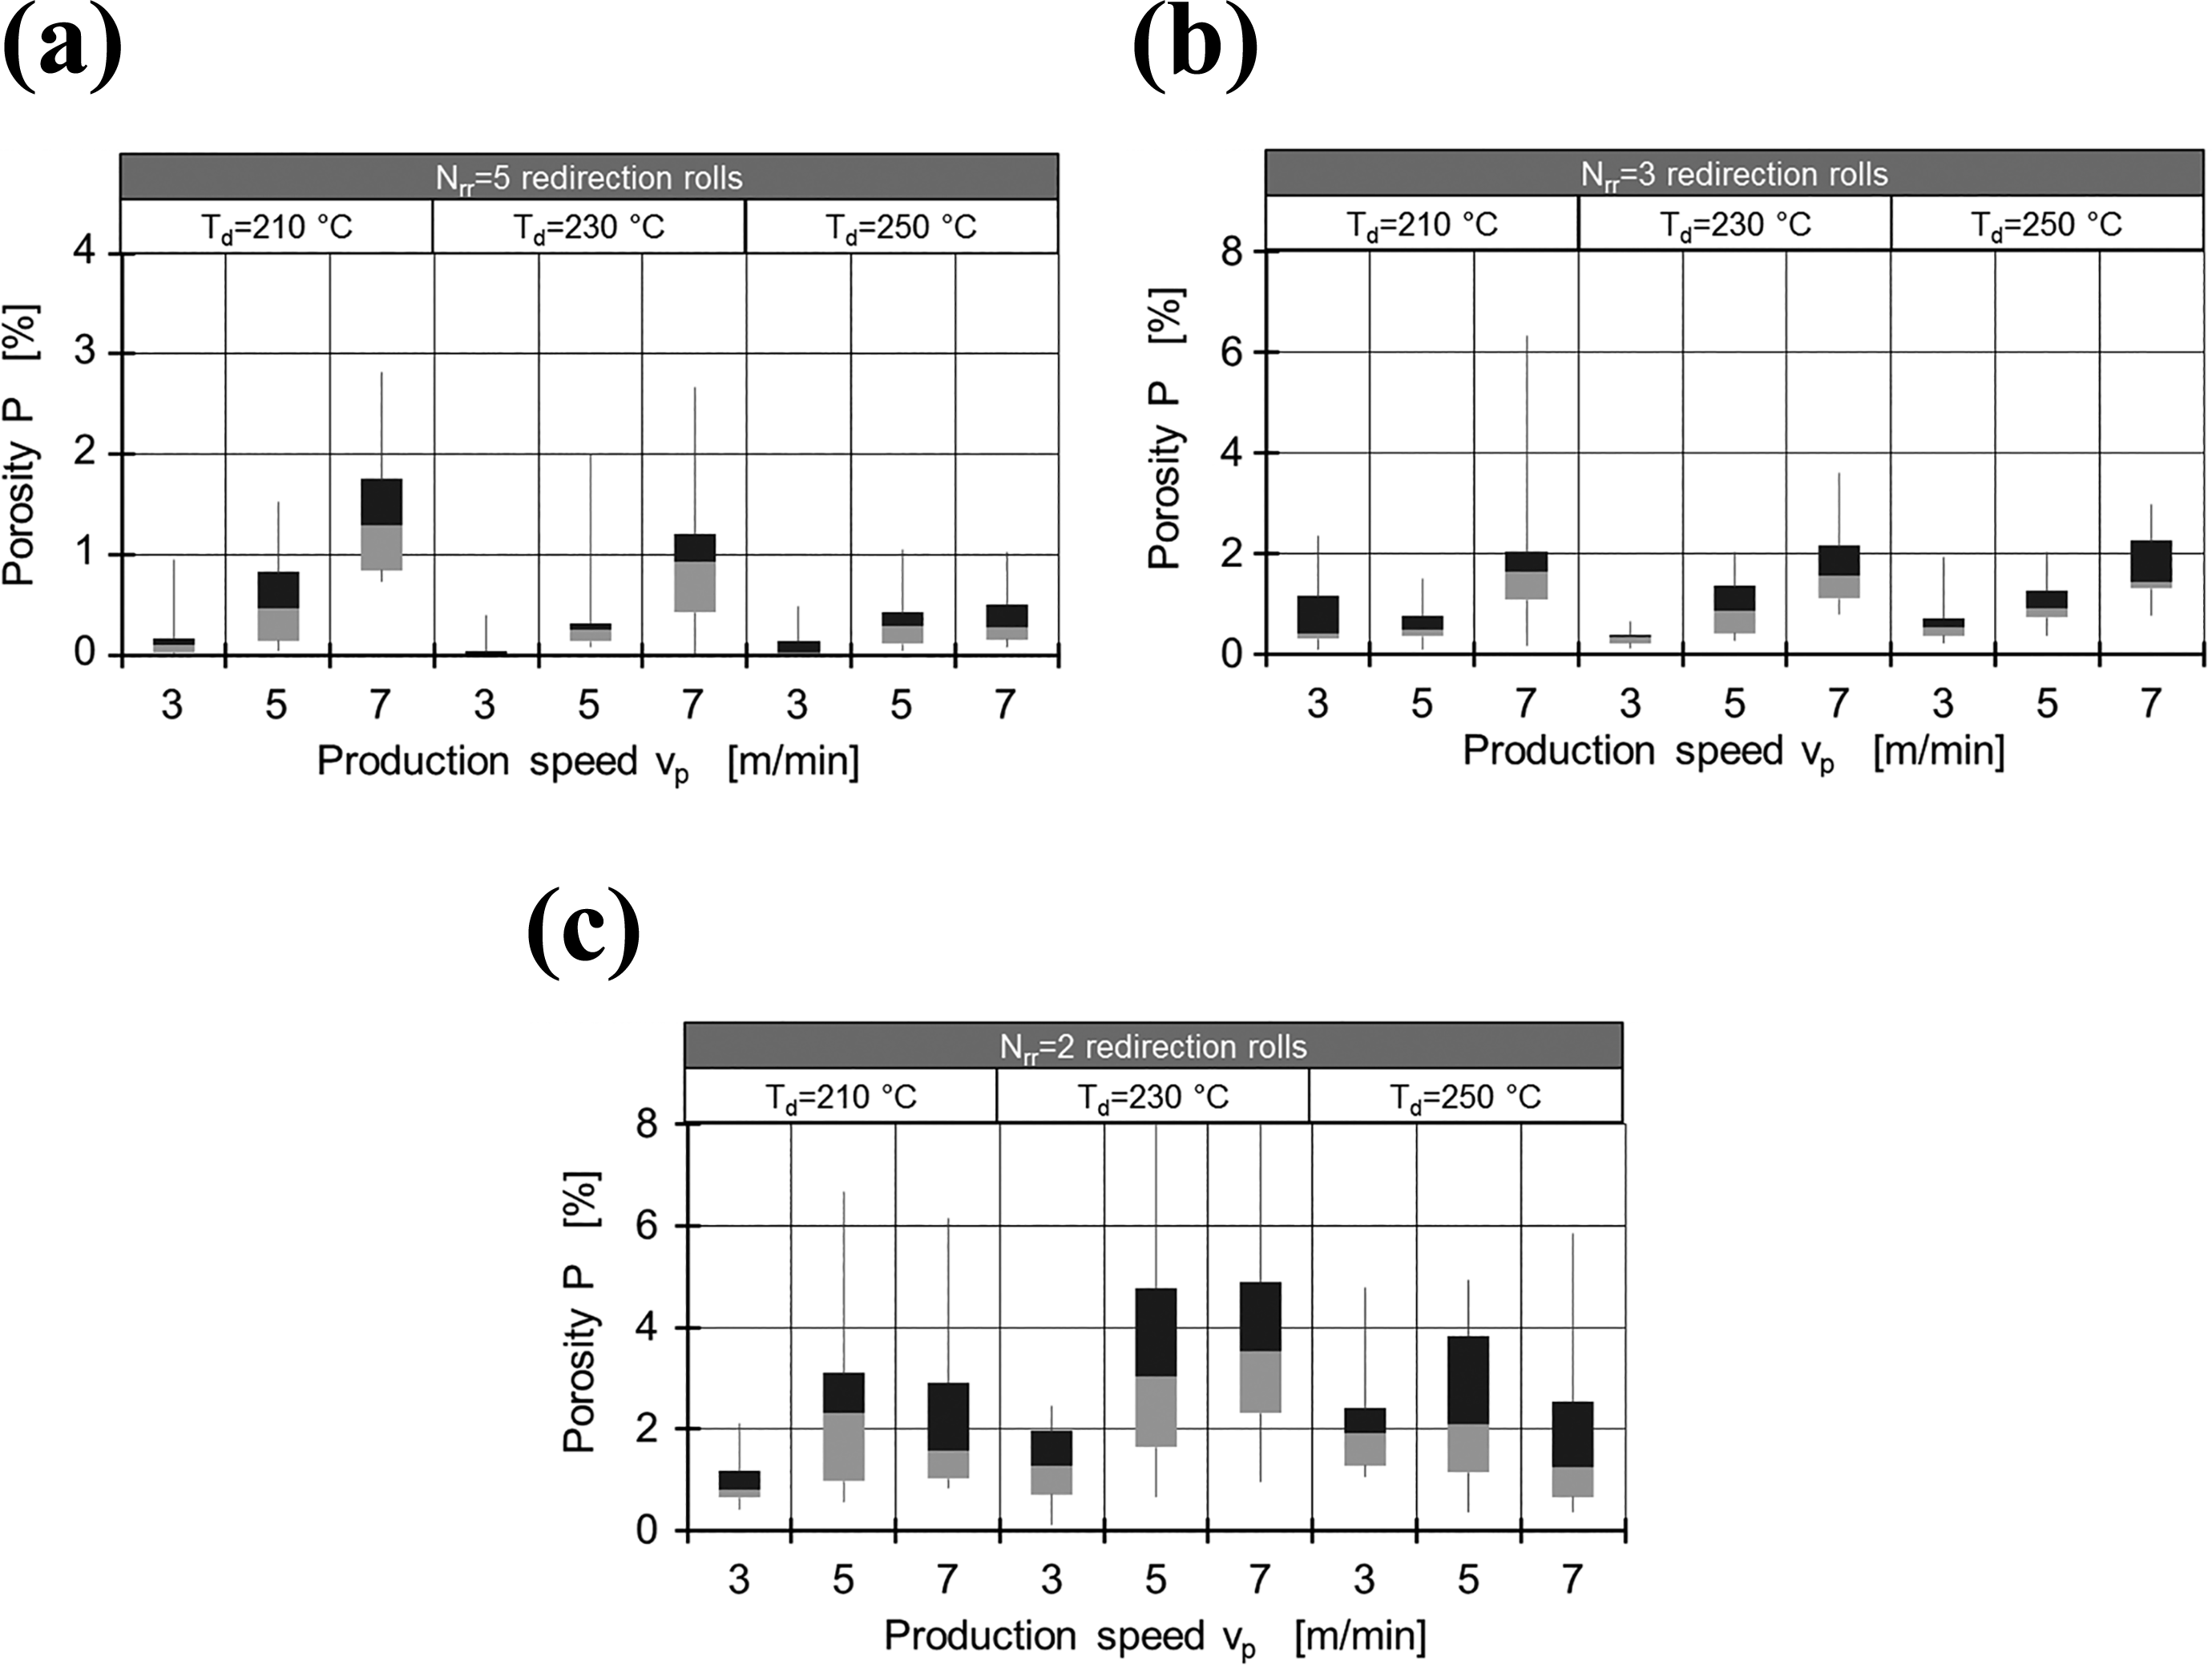
Results of porosity measurement (a to c).
By comparing the porosity P achieved with N rr = 3 redirection rolls (Figure 7, middle diagram) and N rr = 2 redirection rolls (Figure 7, right diagram) with the achieved porosity P with N rr = 5 redirection rolls (Figure 7, left diagram), a significant porosity increase can be observed with decreasing number of redirection rolls N rr. This behaviour is related to the interdependency of generated impregnation pressure and the number of redirection rolls N rr. Each redirection in the die causes a local pressure increase and thus a higher number of redirection rolls N rr results in an increased impregnating pressure p i and lower porosity P. In addition, the total redirection angle is increased with each redirection element, thus inducing an increased spreading effect in the die. This homogenizes the fibre distribution, which might result in a more homogeneous permeability and finally in a lower porosity P.
The measured porosity P values of the trials with N rr = 3 and N rr = 2 redirection rolls show a very high scattering. This effect results from local fluctuations of the porosity P along the UD-tape width, which is most likely connected with an increase in homogeneity in the fibre distribution and the resulting local deviations in the FVC or rather the local permeability. This assumption is consistent with the observations described, followed by the investigation of the homogeneity of the fibre distribution. Furthermore, due to the high scattering of the measured porosity values, no statement about the influence of the die temperature T d with N rr = 3 and N rr = 2 redirection rolls can be made. Nevertheless, in general, the correlation between production speed v p and porosity P described above for a setup with N rr = 5 redirection rolls can be confirmed for a setup with N rr = 2 and N rr = 3 redirection rolls.
Analysis of fibre distribution homogeneity
The results of the fibre distribution homogeneity measurement by microscopic analysis of UD-tape cross sections are displayed in the diagrams of Figure 8. It can be seen that all examined samples show a medium homogeneity of the fibre distribution. The left diagram in Figure 8 shows the representative influence of the production speed v p on the homogeneity of the fibre distribution (at T d = 250°C die temperature and N rr = 5 redirection rolls). Moreover, the average homogeneity coefficients H calculated for these trials are listed in Table 2 (top).
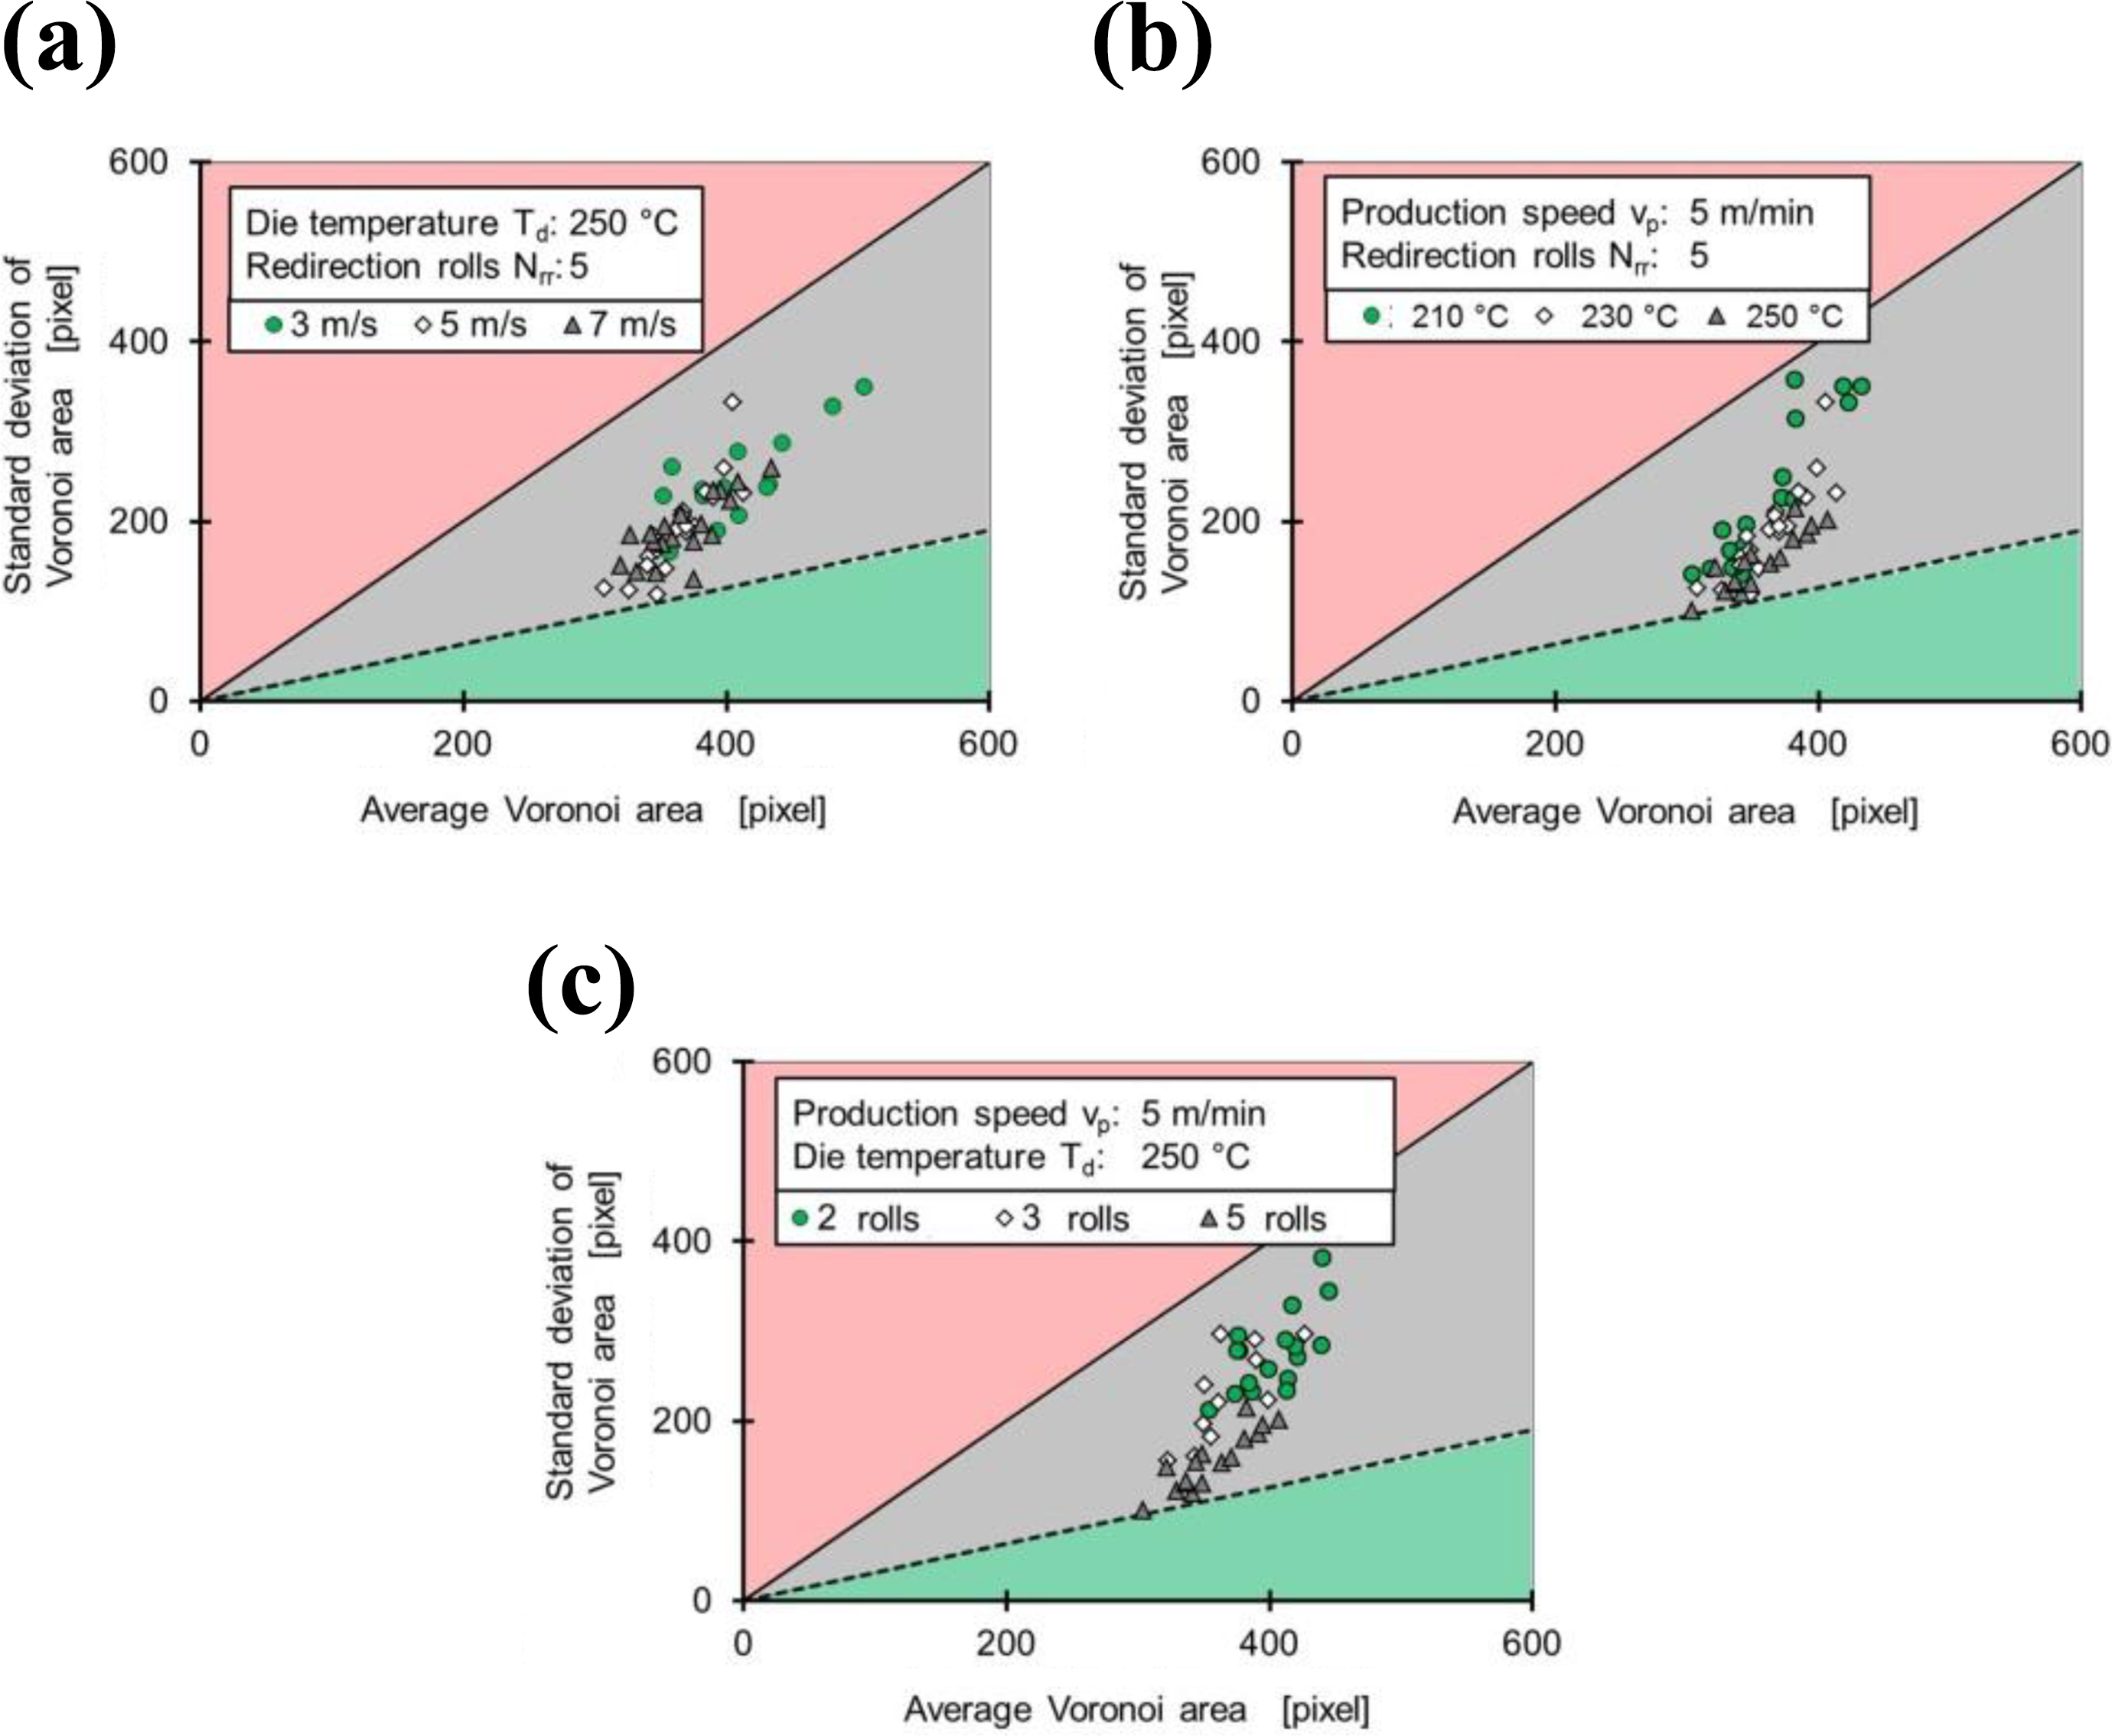
Results of fibre distribution homogeneity measurement (a to c).
Results of the fibre distribution measurement.
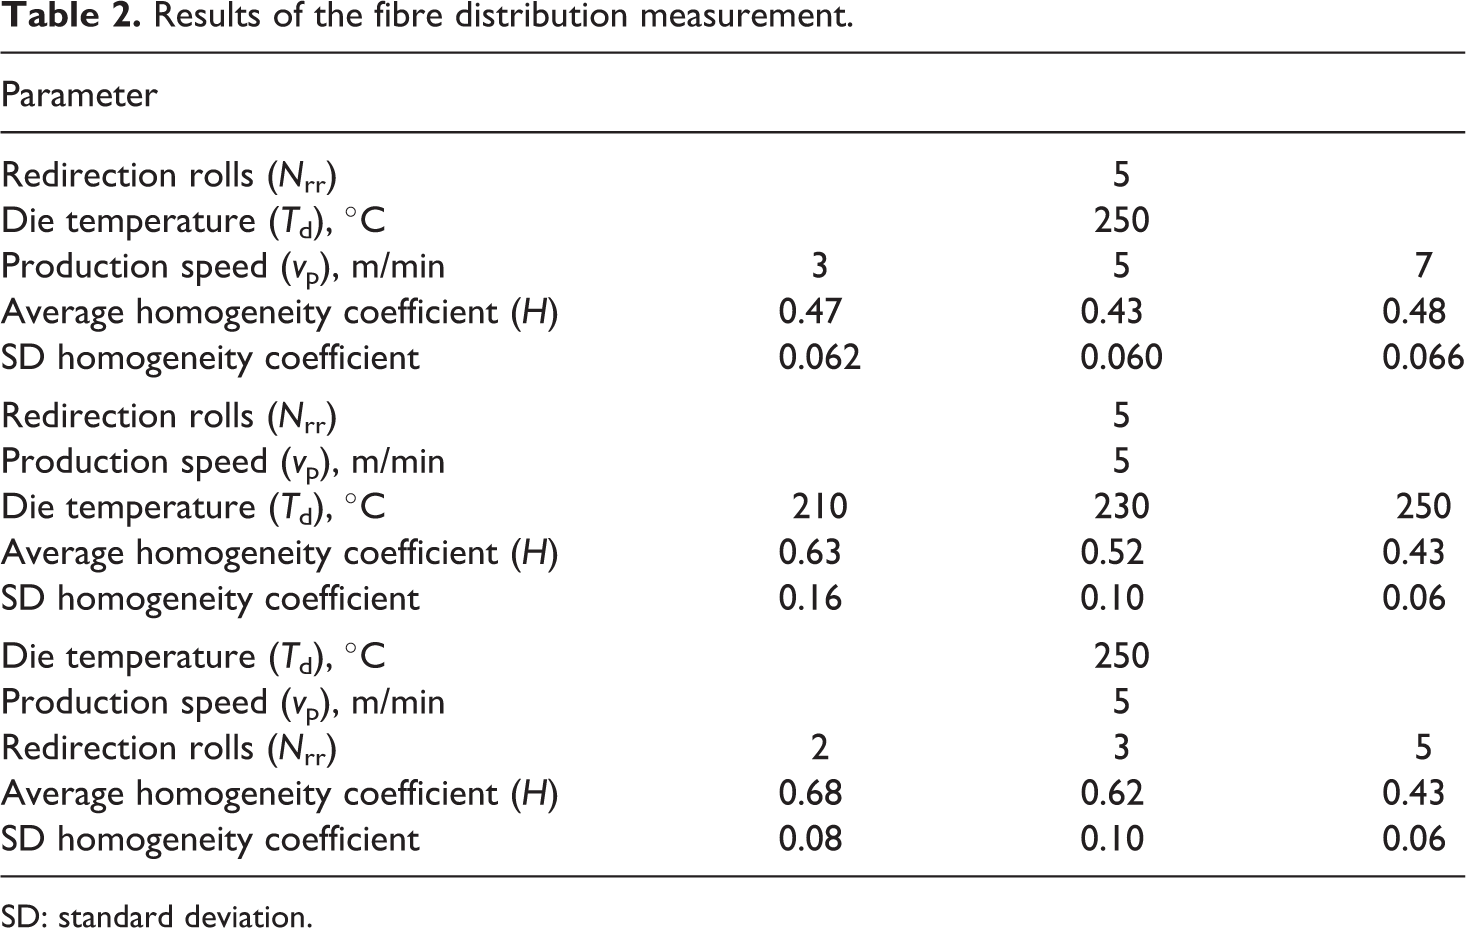
SD: standard deviation.
The results show no influence of the production speed v p on the homogeneity of the fibre distribution, since the differences of the mean homogeneity coefficient H are in the range of the SD. However, an improvement in homogeneity is to be expected with increasing production speed v p up to a certain level. On the one hand, an increased production speed v p during the spreading process can cause a widening of the fibre bundle as well as a reduction in the extent of gaps in between the fibres, which improves the homogeneity. 27,28 On the other hand, an increased production speed v p in the impregnation die is generating a higher fibre tension. 9 The higher yarn tension opposes a higher packing density of the fibres induced by flow processes of the melt. 29 However, these hypotheses cannot be proved with the present investigations.
The middle diagram in Figure 8 shows the representative influence of the die temperature T d on the homogeneity of the fibre distribution (at v p = 5 m/min production speed and N rr = 5 redirection rolls). Looking at the diagram, it can be seen that an increase in the die temperature T d leads to an improvement in the homogeneity of the fibre distribution. This observation is confirmed by the average homogeneity coefficients H calculated for these trials, which are listed in Table 2 (middle). This behaviour can be explained by the increased melt viscosity η m correlated with the lowered die temperature T d. A high melt viscosity η m causes a more distinct grouping of the fibres by flow processes in the die. Therefore, the homogeneity of the fibre distribution H is reduced at lower die temperature T d.
The right diagram in Figure 8 shows the representative influence of the number of redirection rolls N rr on the homogeneity of the fibre distribution (at v p = 5 m/min production speed and T d = 250°C die temperature). It can be seen that with an increase in the number of redirection rolls N rr, a significant increase in the homogeneity of the fibre distribution can be achieved. This behaviour is underlined by the homogeneity coefficients H listed in Table 2 (bottom). The increase in homogeneity correlated with the number of redirection rolls N rr can be attributed to two effects. Firstly, an increase in the number of redirections N rr increases the spread effect induced in the die during impregnation. Each redirection in the die increases the total spreading angle and thus leads to more homogenous distribution of the fibres. Secondly, an increased higher number of redirection N rr generates an increased tension in the fibres, thus again reducing the melt flow-induced fibre grouping.
Conclusion
In the present study, the influence of the impregnation parameters in a melt-impregnation-based UD-tape production process (die temperature T d, production speed v p and a number of redirection rolls N rr of the impregnation die) on the resulting porosity P and homogeneity of the fibre distribution have been analysed. The results confirm that porosity P is strongly influenced by the melt viscosity η m, the production speed v p and the number of redirection rolls N rr and the die setup. Thus, the porosity P increases with increasing production speed v p. Furthermore, an increase in the number of redirection rolls N rr and the die temperature T d results in a reduction of the porosity P. From these results, it can be concluded that the correlations of the impregnation process described in the Darcy equation can be applied to the present melt-impregnation process. Furthermore, a method for quantification of the homogeneity of the fibre distribution based on microscopic cross-sectional images for UD-tapes has been applied. The investigations succeeded in quantifying the homogeneity of the fibre distribution and in deriving influencing variables from it. The results have shown that, besides a reduced melt viscosity η m, especially an increased number of redirection rolls N rr in the die result in an improved homogeneity. In conclusion, it can be stated that on the basis of the results the applied method is suitable for quantifying the homogeneity of the fibre distribution.