
Abstract
Carbon fiber–reinforced thermoplastic composites are gaining increasing interest in various applications thanks to their combined properties of high specific stiffness, high specific strength, and superior toughness. Their mechanical properties are highly dependent on the carbon fiber content. In this study, the carbonization-in-nitrogen method (CIN) developed in previous work is used to measure the fiber content of carbon fiber thermoplastic composites. Three types of carbon fiber thermoplastic composite samples were prepared using hot-melt impregnation. The carbon fiber thermoplastic composite sample is carbonized in a nitrogen environment alongside a neat resin sample that is used for calibrating the resin carbonization percentage. A good agreement is achieved between the nominal carbon fiber content and the carbon fiber content measured using the CIN method. It is concluded that the CIN method is an accurate and efficient way to characterize the carbon fiber content for carbon fiber thermoplastic composites. This work completes the verification of the CIN method, which enables extended application to thermoplastic composites. Moreover, it has its unique merits on evaluating the carbon fiber content for high-temperature and solvent-resistant thermoplastic composites that would encounter challenges using other methods.
Introduction
Thermoplastic composites are attractive for their excellent properties such as high specific stiffness, high specific strength, superior toughness, recyclability, and indefinite shelf life, and, therefore, they have been widely used in applications such as aerospace and automobile industries. There are different kinds of reinforcements (glass fiber, carbon fiber, Kevlar, etc.) that have been added into the thermoplastic to suit specific requirements. Although the majority of fiber-reinforced thermoplastics contain glass fibers, the attractive properties of carbon fibers (CFs) have made them materials of choice in various high-end applications. CFs have high stiffness and strength, excellent electrical and thermal conductivity, and high resistance to fatigue and creep in comparison with the glass fibers. These properties have led to a tremendous increase of its use in the aeronautic, automotive, and energy applications, replacing traditional materials such as steel and aluminum, among others. Thermoplastic resins offer some advantages over thermosetting resins, namely improved chemical and impact resistance as well as a wider application-temperature range for several high-temperature thermoplastic systems. Moreover, some of the thermoplastics, such as polypropylene (PP) and poly phenylene sulfide (PPS), have a very low level of moisture absorption; hence, their mechanical properties are retained under harsh environmental conditions. Another key aspect is shelf life; unlike thermosets, thermoplastic can be easily stored for long periods of time without a loss of performance or the ability to process. The thermoplastic composites can be manufactured through injection molding or compression molding process and offer the possibility to be remelted, providing recycling opportunities. 1 –4
A carbonization-in-nitrogen (CIN) method has been developed for measuring the fiber content of carbon fiber thermoset composites in previous work conducted by Wang et al. 5 A reference neat resin sample was carbonized along with the composites sample with the same resin matrix. The residue from the reference neat resin was used to calibrate the carbonization rate of the resin that was used to calculate the amount of the resin matrix in the composites. In the nitrogen environment, carbon fibers are protected from oxidizing at elevated temperature. There was minimum mass loss (1 wt%) when carbon fibers were held at 600°C for 1 h under nitrogen environment. 5 The accuracy and repeatability of this method have been verified using thermoset resin systems such as vinyl ester and epoxy resins. 5 However, only thermoset matrix composites have been used to verify this method. Thermoplastics are a very different type of resin/polymer to thermosets in mechanical properties, thermal behavior, and processing/manufacturing. Thermoplastics have linear chains, and they behave like a fluid above a certain temperature level. Thermosets are cross-linked polymers without melting during heating. The heating of thermoset leads to its degradation without going through a fluid state. 6 In order to extend the application of this method that was developed for the first time to the thermoplastic composites as a generalized method, it is indispensable that the method is verified in the thermoplastic resin category.
In this study, the CIN method is used to determine the carbon fiber content of carbon fiber thermoplastic composites for the first time. Three types of carbon fiber–reinforced thermoplastic systems, such as PP, polyamide 66 (PA66), and PPS, are used, and their nominal fiber content and the fiber content from the CIN method are compared. These three thermoplastic resins have different melting temperatures and represent the thermoplastic resins that have low, medium, and high-temperature application, respectively.
Experiment
Materials and equipment
Pyrofil X 0327 carbon fiber with a 24 K tow size from Mitsubishi Rayon was used. The information of the carbon fiber and the resins used is listed in Table 1. The furnace that was used to carbonize samples was Lindberg Blue M55367 (Lindberg/MPH, Riverside, Michigan). The mass was measured on a Mettler Delta range AT 261 balance (Mettler Toledo, Columbus, Ohio). Thermogravimetry analysis was done on a Dupont TGA 2850 analyzer (Dupont, Wilmington, Delaware).
Materials manufacturer’s information.
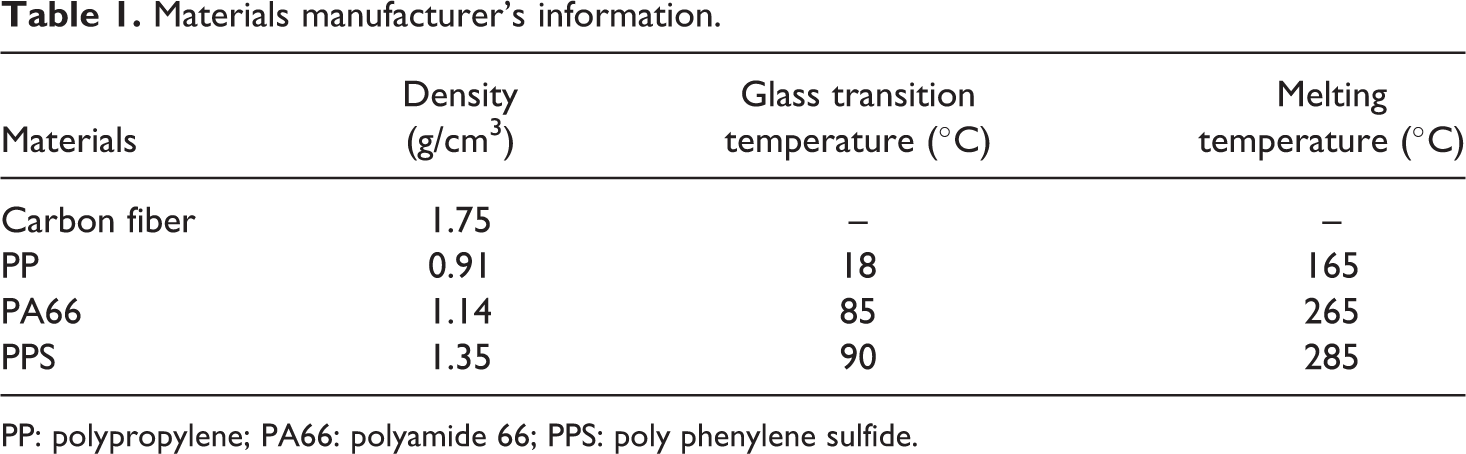
PP: polypropylene; PA66: polyamide 66; PPS: poly phenylene sulfide.
Sample preparation
Composite samples with different carbon fiber contents were prepared using hot-melt impregnation process at University of Alabama at Birmingham Materials Processing and Applications Development Center. In the hot-melt impregnation process, the actual carbon fiber content in the composite can be well controlled. The sketch of the hot-melt impregnation process is shown in Figure 1. It consists of a single screw extruder, a puller, several hot rollers, and fiber creels. During the processing, carbon fiber tow was pulled from a creel and preheated. The heated tow was impregnated in the impregnation die by the melted resin supplied from the single screw extruder. The impregnated fiber tow then passed through a series of hot rollers, which scraped excess polymer off the tow to produce an impregnated tape after cooling. The tape was then cut into 1 in. pellet for the subsequent carbonization procedure. Table 2 lists the temperatures of different components of the hot-melt impregnation setup for each resin system. The nominal fiber content was obtained using the mass of 5 in. dry carbon fiber over the mass of 5 in. carbon fiber thermoplastic tape.
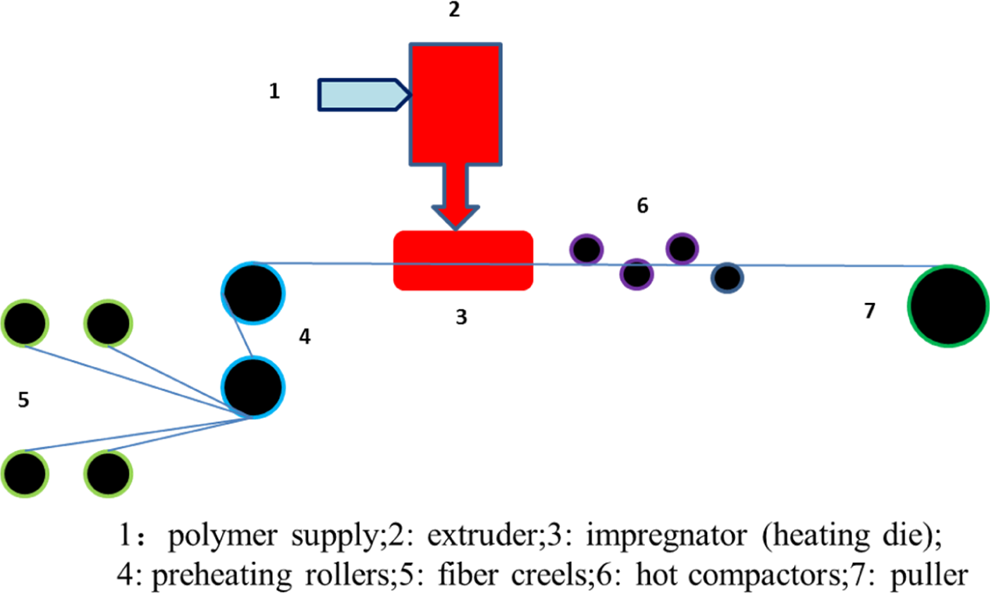
The hot-melt impregnation process used to prepare carbon fiber thermoplastic samples.
Processing temperature for the hot-melt impregnation process.
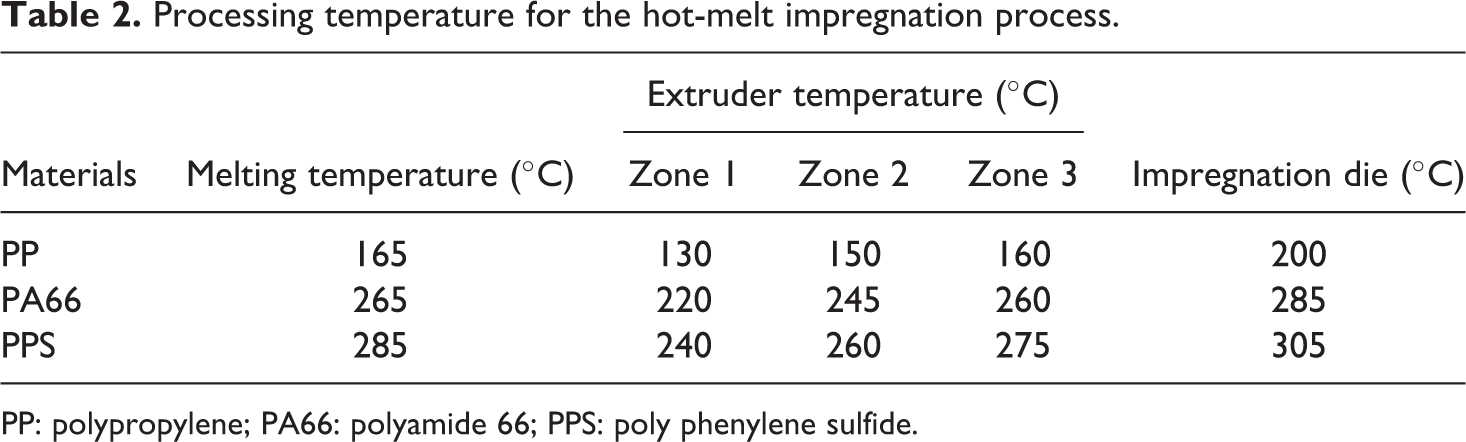
PP: polypropylene; PA66: polyamide 66; PPS: poly phenylene sulfide.
Determination of carbonization temperature
Thermo-gravimetric analysis (TGA) was conducted on the thermoplastic composite samples to determine an optimized temperature to carbonize the samples under nitrogen. Figure 2 illustrates the TGA results for the PP, PA66, and PPS resin used in this study. All the specimens were dried at 80°C for 24 h before the TGA analysis. A heating rate was 20°C min−1, and the sample was held at 800°C under nitrogen atmosphere for 120 min for all the resins. The nearly flat line at the late stage of the TGA curves indicates that there is no noticeable mass change after a 100-min dwell at 600°C. The carbonized residue percentage of PP, PA66, and PPS is 9.8, 10.2, and 35.7 wt%, respectively. It is seen that PPS has the highest residue percentage among all. PPS has highly stable chemical bonds of its molecular structure, which imparts a high degree of molecular stability toward both thermal degradation and chemical reactivity. 7 In addition, at least one-third of sulfur still remains in the final residue, which contributes to the high residue content for PPS. 8 The residue percentage obtained from carbonizing PPS under nitrogen environment is consistent to the carbonization result from the previous study. 9
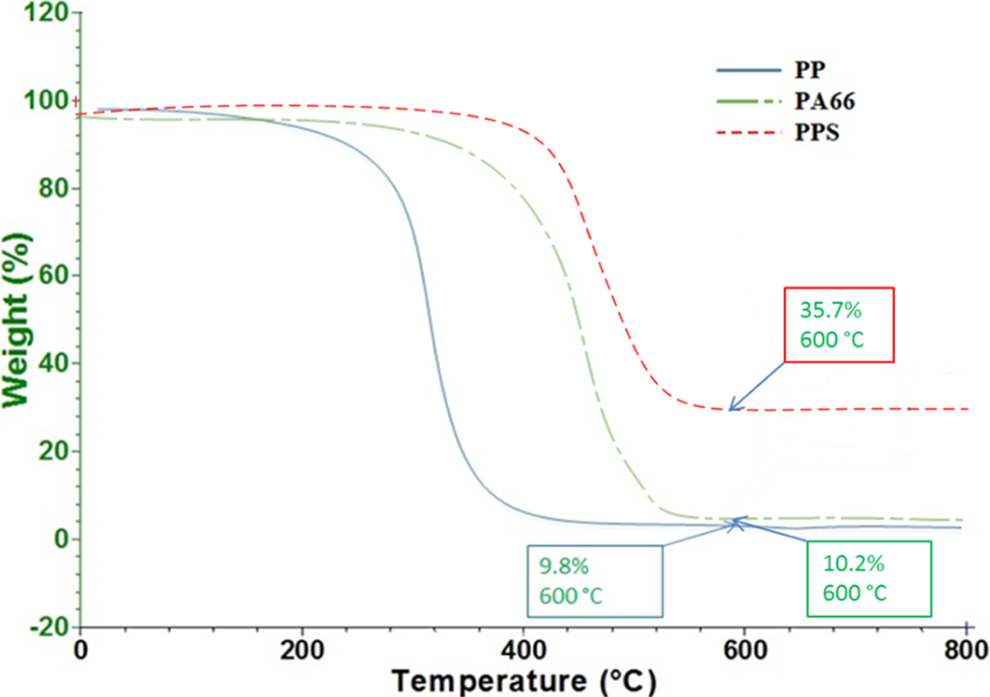
TGA plot of the mass loss of PP, PA66, and PPS resins heated up to 800°C. Note that all of the resins still have residue at 600°C under nitrogen. TGA: thermo-gravimetric analysis; PP: polypropylene; PA66: polyamide 66; PPS:poly phenylene sulfide.
Previous research 5 indicates that the carbon fibers lose minimum 1.2% mass after being held for 60 min at 600°C under nitrogen environment. The mass loss is attributed to possible moisture and the degradation of the fiber sizing, which is normally around 1 wt% of the carbon fiber mass. 10 –12 It is indicated that the carbon fiber does not degrade after being held under nitrogen for 60 min at 600°C. Based on the TGA results, the temperature for the CIN is determined to range from 400°C to 600°C. In this temperature range, carbon fiber shows no degradation, while the resin shows a stable carbonization rate, which is defined as the ratio of the residue mass after carbonization to the initial resin mass.
Figure 2 shows that polypropylene started to show obvious mass loss at around 240°C. The mass loss dramatically increases at around 300°C caused by significant volatilization, which is agreement with the previous observation.
13
PA66 has a much delayed degradation than PP. Its onset temperature of degradation is about 360°C. The TGA curve for PPS shows that the PPS is stable to around 360°C. The mass loss dramatically increases when the temperature reaches to 420°C. Perng
14
has found that the major pyrolysates of PPS were benzenethiol and H2S. The major mechanisms included depolymerization, main chain random scission, and carbonization. The initial scission of PPS was depolymerization and main chain random scission. Depolymerization was dominated in lower temperature pyrolysis, and main chain random scission was dominated in higher temperature pyrolysis. The residual mass fraction of the PPS under nitrogen, M, could be described in the following equation:
CIN
The same procedure as described in previously developed CIN method was used for measuring the fiber content in the carbon fiber–reinforced thermoplastic composites. The composite samples and the reference neat resin samples were weighed and placed in a nitrogen-purging tube furnace after drying. The samples were heated to at least 400°C and held at that temperature for 60 min. The resin in the composite samples and reference neat resin samples were carbonized under identical thermal conditions. The sample residue was weighed after cooling to room temperature. Figure 3(a) shows the carbon fiber thermoplastic composite sample with known nominal fiber content before carbonization; Figure 3(b) shows residue from that sample after carbonization; and Figure 3(c) shows the residue from the reference neat resin after carbonization. The residue from the reference neat resin was used to calibrate the percentage of matrix residue from the carbon fiber thermoplastic composite sample. The carbon fiber content, Wf, in the composite sample can be calculated using the following equations 5 :
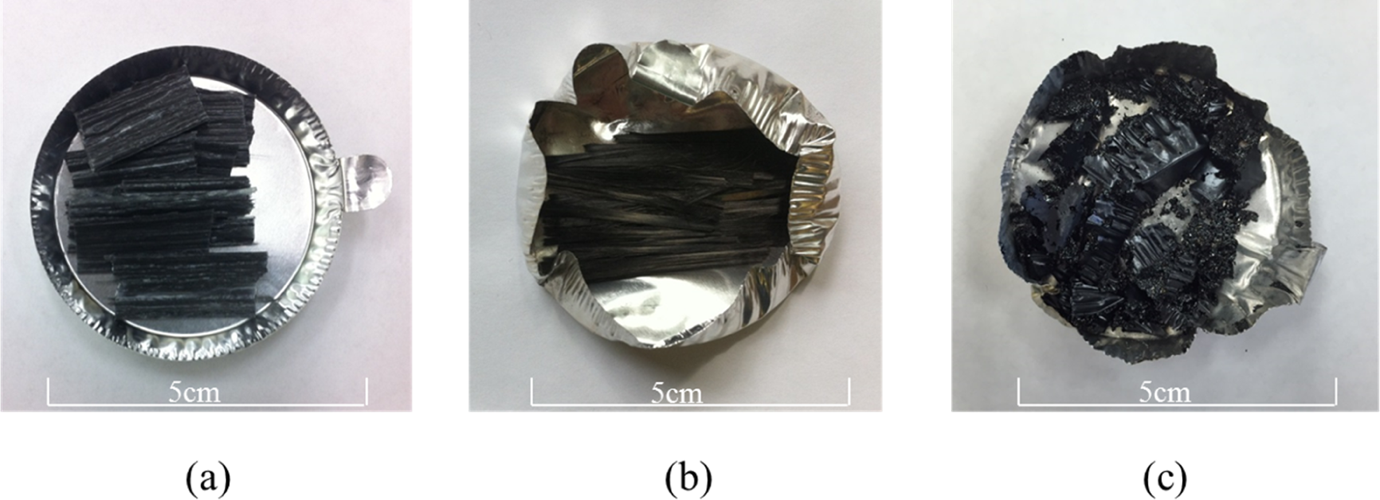
(a) Carbon fiber thermoplastic composite sample with known nominal fiber content before carbonization, (b) residue from composite sample after carbonization, and (c) residue from the reference neat resin after carbonization.

where CR is the carbonization rate of the reference neat resin, mr is the residue mass from the reference neat resin, and mi is the reference neat resin sample mass

where Mm is the mass of the matrix in the composite sample, Mi is the initial mass of the composite sample, and Mr is the residue mass of the composite sample.
The carbon fiber content (weight fraction), Wf, in the composite sample could be calculated in accordance with equations (1) and (2):
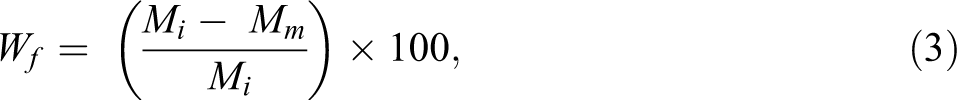

where Wf is the carbon fiber content in composite sample, in weight percentage.
Nitrogen is used for protecting carbon fibers from oxidizing at elevated temperature in the CIN method. 5 Work is also conducted to investigate the degradation temperature for carbon fibers in a normal atmosphere with oxygen. Four aluminum pans with carbon fibers (PYROFILTM, Mitsubishi Rayon Co., Tokyo, Japan) were heated in a regular box furnace (Thermolyne 48000). Steel mesh was used on the top to prevent the carbon fibers from floating as shown in Figure 4(a). The mass was recorded at room temperature, 100, 200, 300, 400, 500, 550, and 600°C, respectively, and the mass loss for each temperature was calculated. The mass loss percentage is summarized in Table 3, and Figure 4(b) shows the mass loss trend with temperature. It is seen that at temperatures less than 500°C, there is minimum mass loss (<2 wt%). That minimum mass loss is probably caused by moisture evaporation and sizing degradation. However, at 550°C, the mass loss increases significantly due to carbon fiber degradation. This trend has also been observed in the previous study. 15
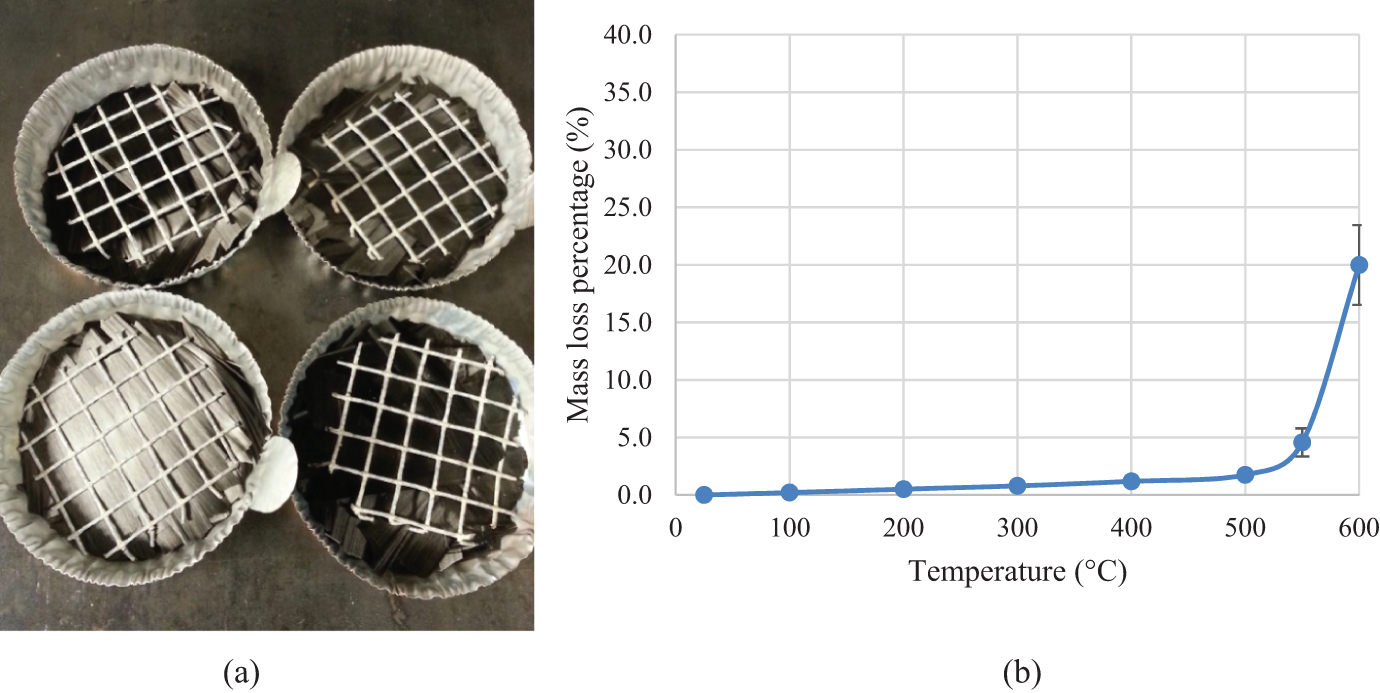
(a) Carbon fiber samples that were heated in normal atmosphere with oxygen; (b) mass loss percentage in weight percentage with temperature for these carbon fiber samples.
Carbon fiber mass and mass loss percentage at different temperatures.
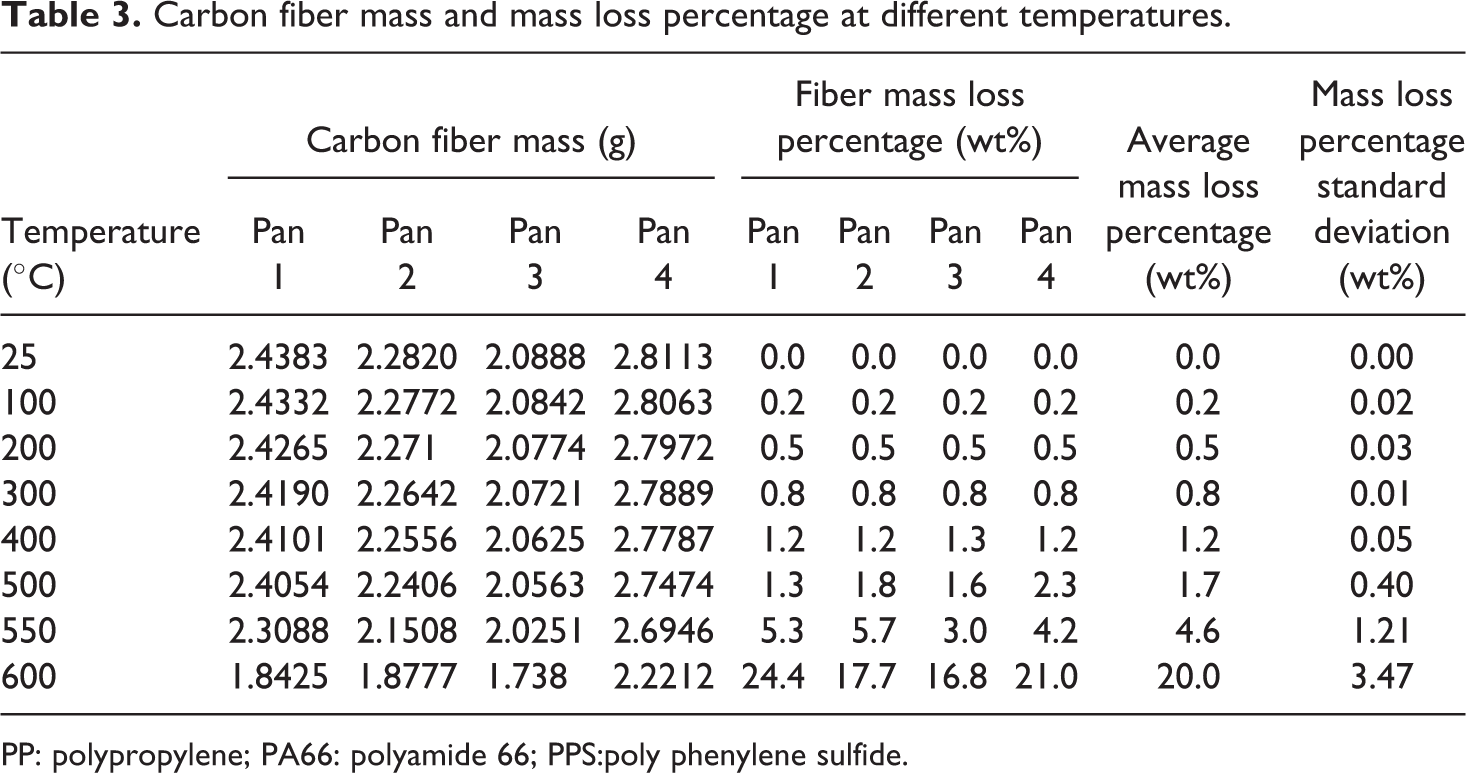
PP: polypropylene; PA66: polyamide 66; PPS:poly phenylene sulfide.
Results and discussion
Carbon fiber polypropylene
The CIN method was used to measure the fiber content of carbon fiber–reinforced polypropylene (C/PP). The nominal fiber content of the C/PP samples is known from the hot-melt impregnation process. The carbon fiber content from the carbonization was calculated from equation (1). The values of the terms in the equation, such as Mcr, Mc, M, mr, and mi, were measured from the carbonization experiment. Table 4 compares the nominal fiber content and measured fiber contents from the CIN method. Figure 5 shows that the deviation between the nominal carbon fiber content and measured fiber contents from the CIN method is minimal. The small deviation indicates the CIN method could be used to measure the carbon fiber content in C/PP composite.
The fiber content results for carbon fiber PP samples from CIN method.
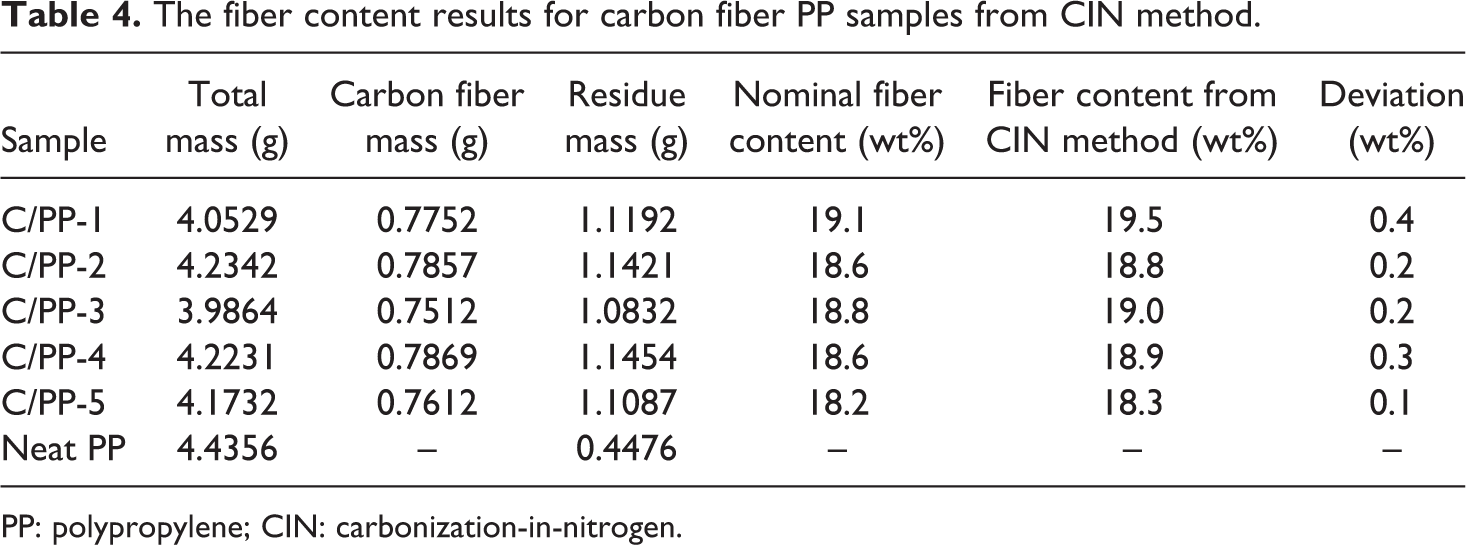
PP: polypropylene; CIN: carbonization-in-nitrogen.
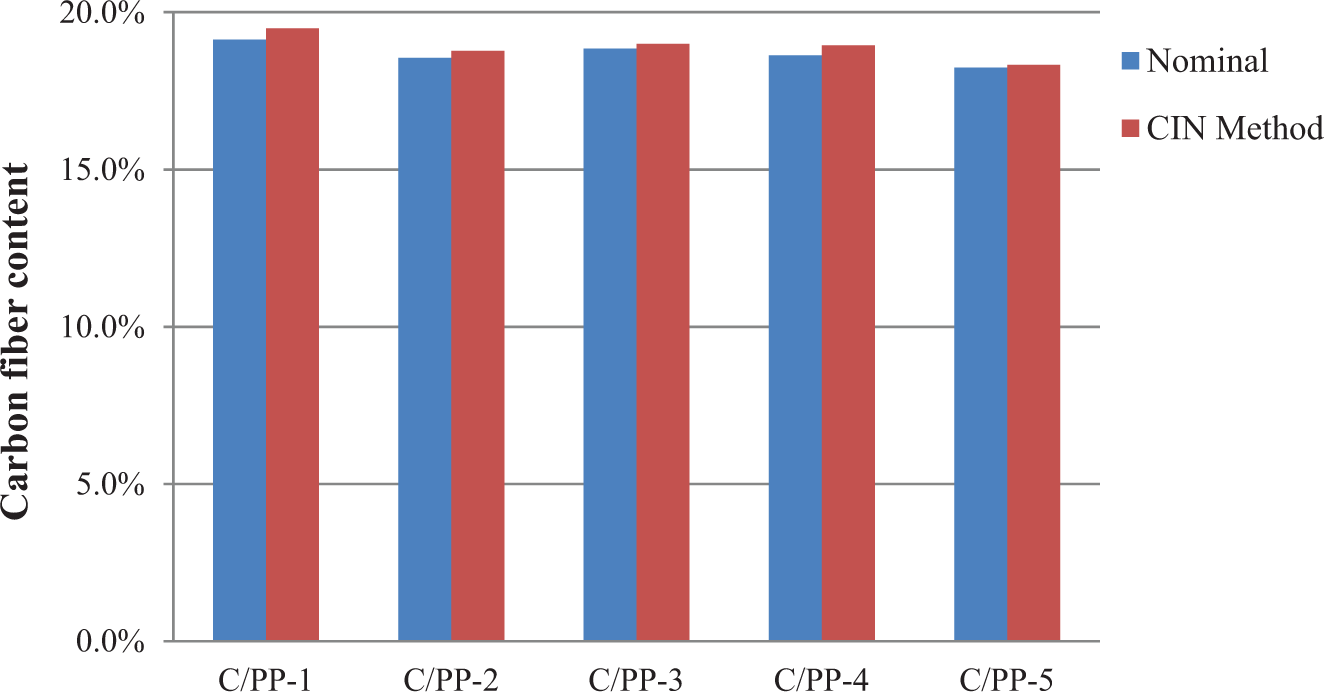
Comparison between fiber content from CIN and nominal fiber content (in weight percentage) in a batch of five carbon fiber PP samples. CIN: carbonization-in-nitrogen; PP: polypropylene.
Carbon fiber polyamide
Table 4 lists the fiber content measured from the CIN method for a set of carbon fiber–reinforced PA66 (C/PA66) samples. The deviation between the actual nominal fiber content and the fiber content from the developed CIN method is minimal as illustrated in Table 5. It indicates the developed CIN method could be used to calculate the carbon fiber weight fraction in the carbon fiber polyamide composites. Figure 6 shows the comparison between the calculated results and the nominal results for carbon fiber–reinforced PA66 samples for a batch of five samples. The small deviations illustrate that the CIN method could be applied to the PA66 system.
The fiber content results for carbon fiber PA66 samples from CIN method.
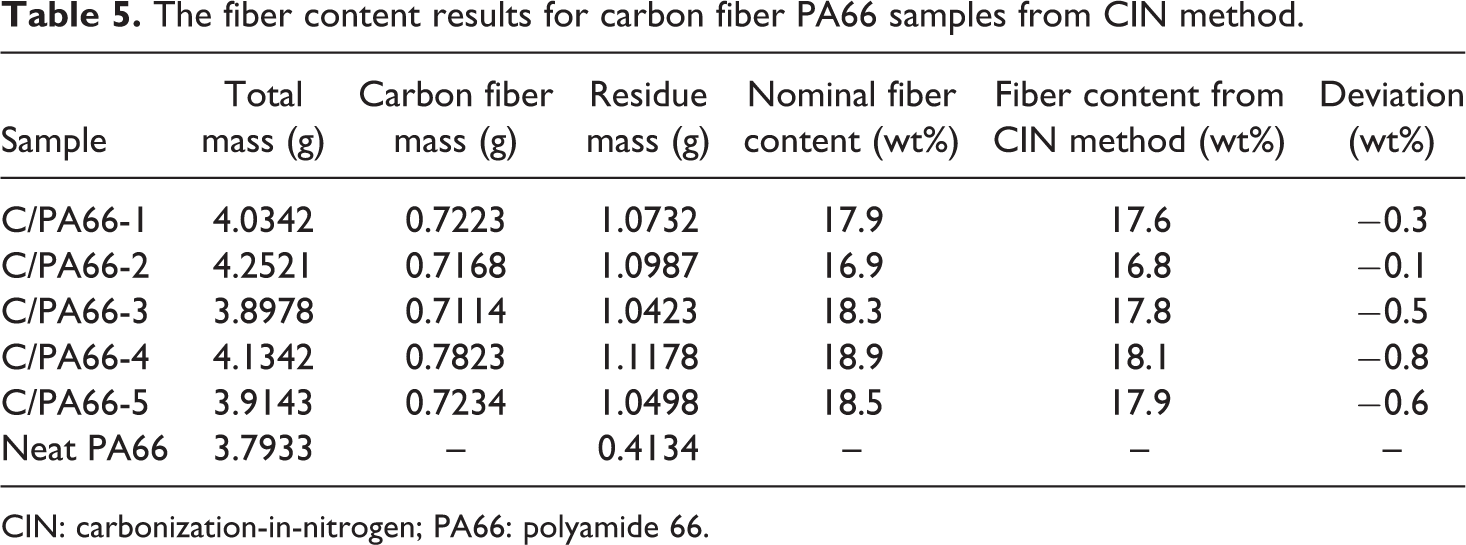
CIN: carbonization-in-nitrogen; PA66: polyamide 66.
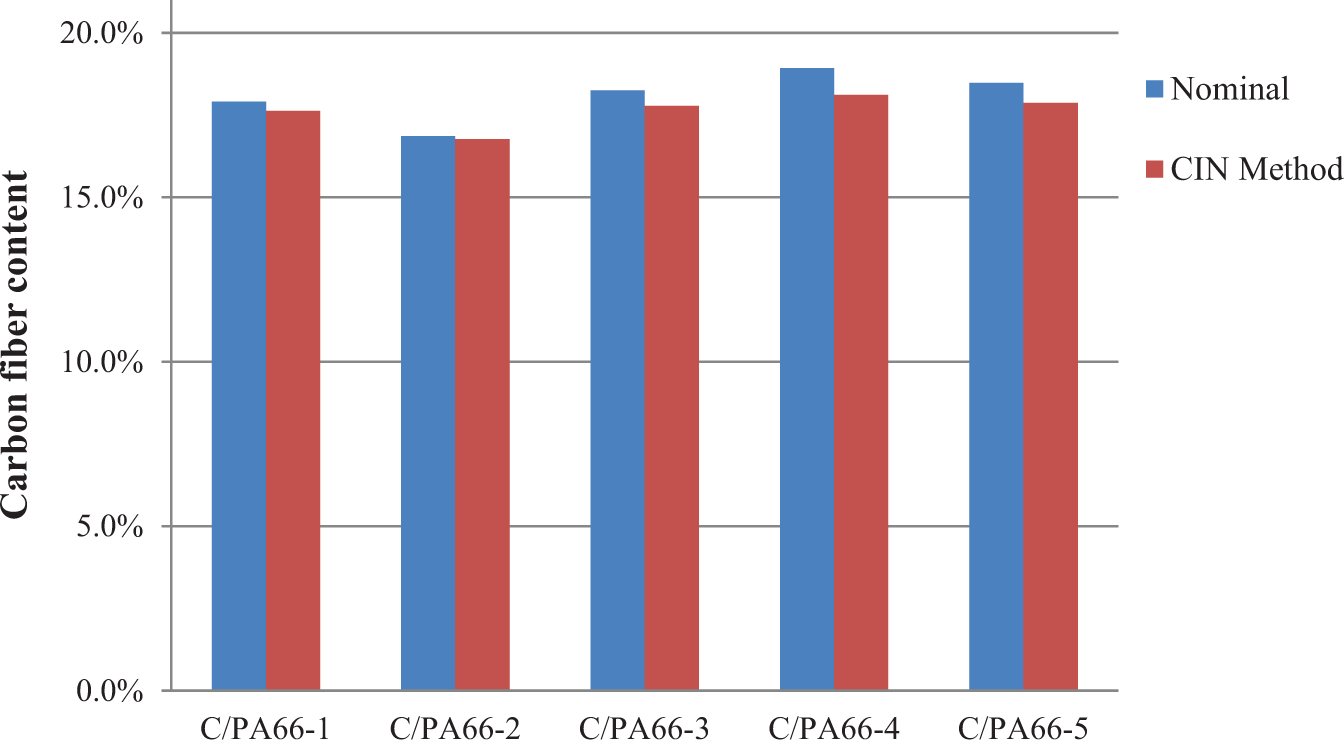
Comparison between fiber content from CIN and nominal fiber content (in weight percentage) in a batch of five carbon fiber PA66 samples. CIN: carbonization-in-nitrogen; PA66: polyamide 66.
Carbon fiber polyphenylene sulfide
PPS is a highly chemical resistant and high-temperature thermoplastic polymer. There have been challenges to measure the fiber content in carbon fiber PPS matrix composite (C/PPS) using acid digestion method and regular burn-off-in-air procedure. The acid temperature generally in excess of about 240°C is necessary to achieve any significant dissolution of PPS. 16 Burn-off-in-air procedure does not totally burn off the PPS matrix without degrading the carbon fibers, which resulted in a large deviation as listed in Table 6. In this work, the carbon fiber content of C/PPS samples was measured using the CIN method for the first time. The comparison of fiber content between the nominal and the CIN method for a batch of C/PPS samples is listed in Table 7. Figure 7 demonstrates the deviation between the nominal carbon fiber content and the carbon fiber content measured from the CIN method. The small deviation indicates that the measured fiber content result from the CIN method has a good agreement with the nominal fiber content, and therefore, the CIN method could be applied to measure the carbon fiber content of the C/PPS composite.
The carbon fiber content results for carbon fiber PPS samples from burn-off-in-air method (note the large deviation).
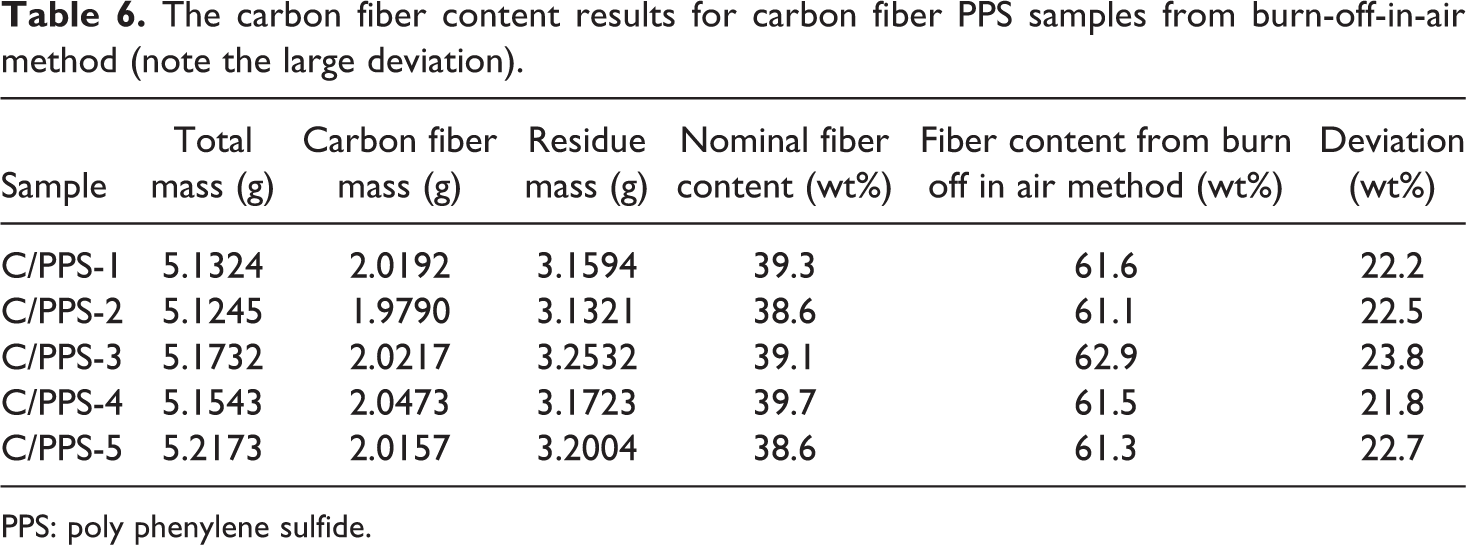
PPS: poly phenylene sulfide.
The fiber content results for carbon fiber PPS samples from CIN method.
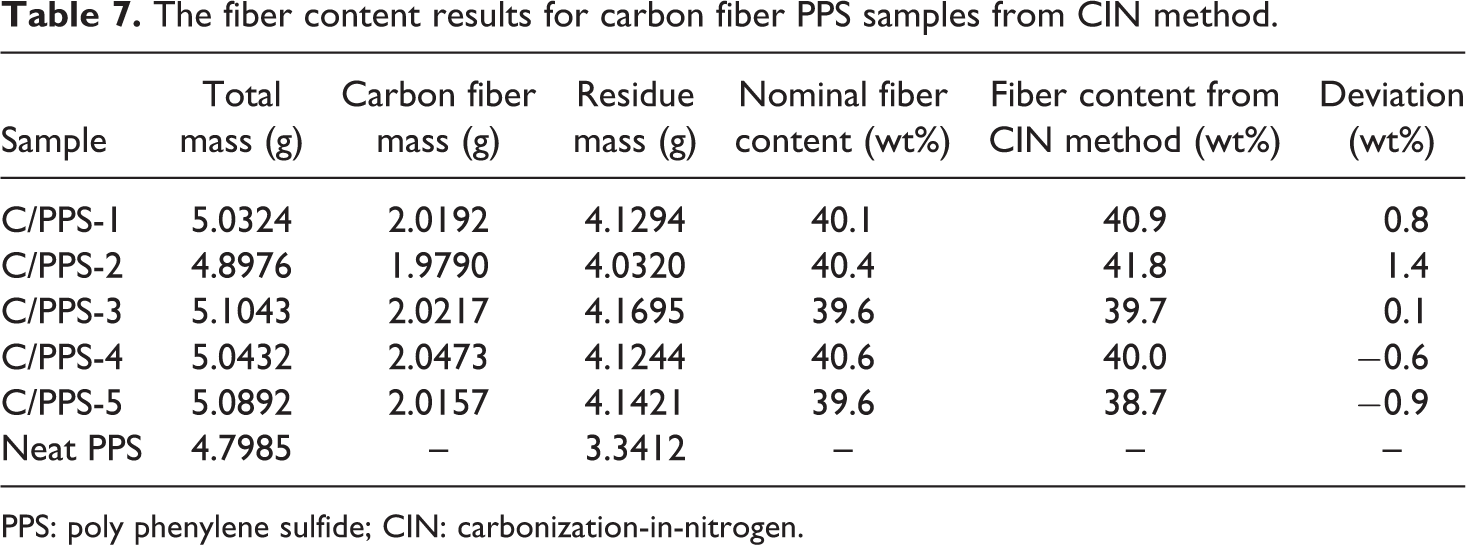
PPS: poly phenylene sulfide; CIN: carbonization-in-nitrogen.
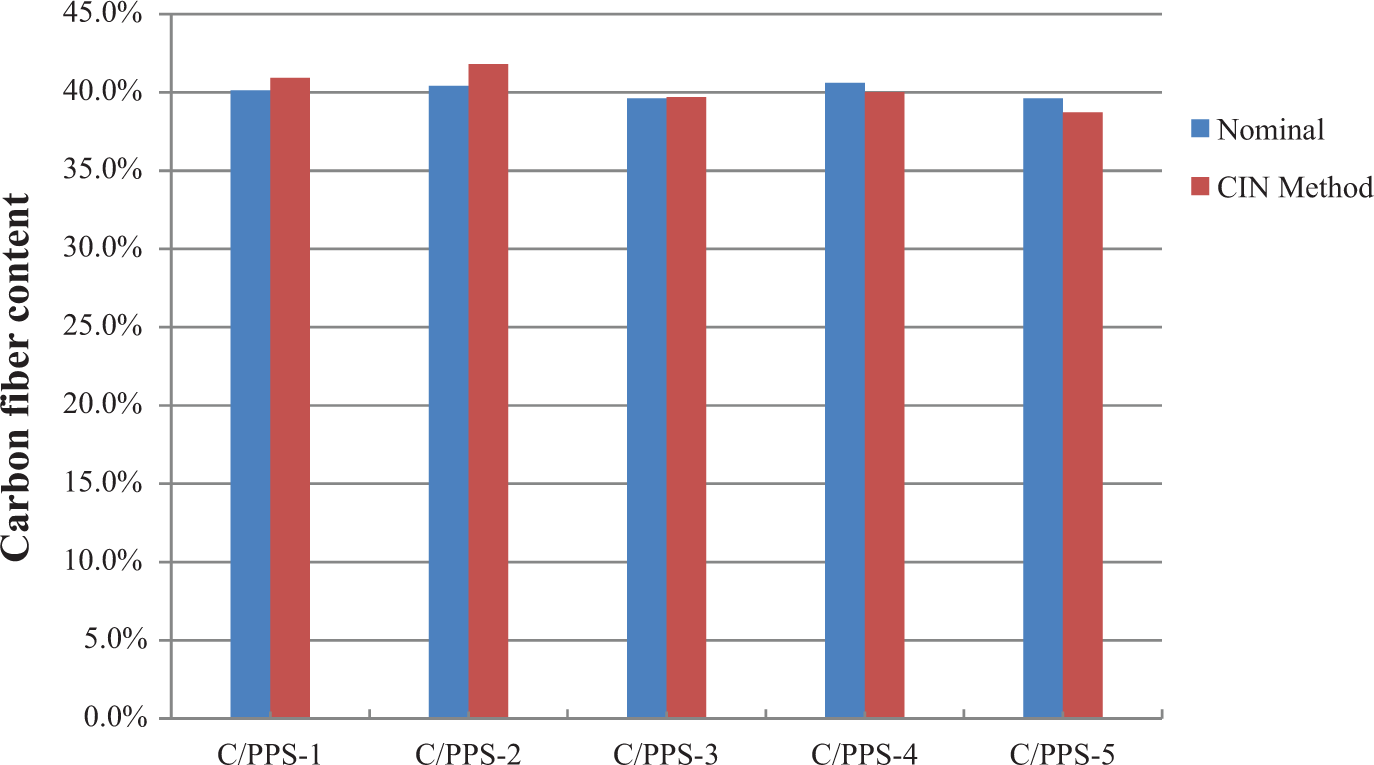
Comparison between fiber content from CIN and nominal fiber content (in weight percentage) in a batch of five carbon fiber PPS samples. CIN: carbonization-in-nitrogen; PPS: poly phenylene sulfide.
Conclusion
This study completes the verification of the carbonization-in-nitrogen method using thermoplastic matrix composites. The accuracy and reliability of the CIN method for measuring the carbon fiber content in the thermoplastics resin systems were studied. A reference neat resin sample was carbonized with a carbon fiber thermoplastic composite sample under nitrogen environment at a temperature ranging from 400°C to 600°C. The carbonization rate of the reference neat resin sample was used to calculate the amount of the resin matrix in the composite sample. The low deviations between nominal and experimental fiber contents for all of the three thermoplastic systems, C/PP, C/PA66, and C/PPS, indicate that the CIN method could be extended to measure the fiber content of carbon fiber thermoplastic composites. This study proves that the CIN method may be used as a generalized method to measure the carbon fiber content on composites with any resin matrix in an efficient, safe, and accurate way. The merits of this method could be further amplified when applying it to the high-temperature and solvent-resistant semicrystalline thermoplastic systems such as carbon fiber PPS composite that the other measurement methods have challenges with.
Footnotes
Declaration of conflicting interests
The author(s) declared no potential conflicts of interest with respect to the research, authorship, and/or publication of this article.
Funding
The author(s) disclosed receipt of the following financial support for the research, authorship, and/or publication of this article: The authors would like to acknowledge U.S. Department of Energy Graduate Automotive Technology Education (GATE) program for funding this work.