
Abstract
The 3D printing of thermoplastic polymers (both virgin and reinforced with metal/ceramic particles) has been widely explored in recent past with fused deposition modelling (FDM) process. But hitherto very little has been reported on 3D printing of thermoplastics polymers with reinforcement of thermosetting polymers and ceramic particles. This article is an extension of work reported on thermo-mechanical investigations on waste thermosetting polymer bakelite and ceramic (silicon carbide and aluminium oxide) as reinforcement in recycled acrylonitrile butadiene styrene (ABS) thermoplastic matrix for sustainability. The study reports the experimental investigations on mechanical (tensile), morphological, surface hardness and thermal stability analysis of 3D printed functional prototype as tensile specimen (as per ASTM D 638). In the present case study, it has been ascertained that composition/proportion of thermoplastic matrix has a significant role in controlling the mechanical properties, whereas other input process parameters of FDM are insignificant. The results of the study suggest that thermosetting and ceramic-reinforced ABS thermoplastic-based 3D printed parts have mechanical properties at par with unreinforced ABS.
Introduction
In modern manufacturing, number of engineering materials (metals, alloys, ceramics, non-metals, thermoplastics, etc.) are being used for 3D printing applications. In the category of thermoplastics, one of the most used materials is acrylonitrile butadiene styrene (ABS). 1 –3 The ABS is having properties of fast solidification, average strength and cheap in price but have inferior mechanical properties. 4 –8 The studies have reported the use of ABS printed parts on fused deposition modelling (FDM) in medical/surgical applications, 9 –11 anatomies models of animals and humans, and so on. 10 –13 As per the technology concern, some important factors responsible for variation of material properties in FDM printed parts are bed temperature, nozzle temperature, degree of crystallinity, molecular structure, neighbouring filament heat, filling speed, printing width and orientation angle in fabrication process. 14 –19 It has been reported that raster angle, addition of additives, layer thickness, complexity in structures, blending of thermoplastics, nozzle conditions, direction of printing, recovery temperature, deformation temperature, shape recovery and shape recovery rate greatly affect the mechanical, morphological, thermal, chemical, tribological and rheological behaviour of FDM printed functional prototypes. 20 –25 The high quality of FDM products in complex shapes can also be obtained by keeping accurate balance of process parameters. 26 –32 Good range of mechanical and wear properties of polymers and biomass alloys increased the area of utilization of FDM parts in electronic, industrial, automobile, architecture engineering, antenna covers, production tooling, electrical housing, aerospace industries, concrete printing, electronic button covers, tooling/fixtures, ecological monitoring vehicles, hydrodynamics and coral reef replica construction. 33,34 In addition, the use of advanced engineering particulates such as graphene, carbon black (CB) and carbon nanotubes provides high thermal and electrical conductivity for prospective use in electronics and electrical engineering fields. 34,35 It has been reported that ABS and CB mixture helps in making concave capacitive sensor with cost-effectiveness. 36
The literature review reveals the use of FDM for recycling of thermoplastics. Some of the studies outlined the use of nano- or micro-sized particulate for reduce/reuse/recycle (3R’s concept of waste management) prospective by FDM. 2,37 But hitherto very little has been reported on the recycling of thermosetting waste by using it as filler in thermoplastic matrix along with ceramic particulates. The present study is an extension of work reported by Singh et al. 37 in which the study was limited to the preparation of innovative feedstock filaments of thermosetting, thermoplastic and ceramics blends. In this study, 3D printed functional prototypes were subjected to mechanical, thermal, morphological and surface characterization for sustainability.
Materials and methods
In this study, primary recycled thermoplastic ABS with melt flow index value 8.76 g/10 min as per ASTM D 1238 has been selected as matrix material. For reinforcement, recycled bakelite (BAK) 10% (by weight) has been used (for recycling purpose) with different proportions of ceramic particles as reported by Singh et al. 37 Table 1 shows the composition/proportions of reinforcement in the ABS matrix.
Selected composition/proportion of reinforcement. 37
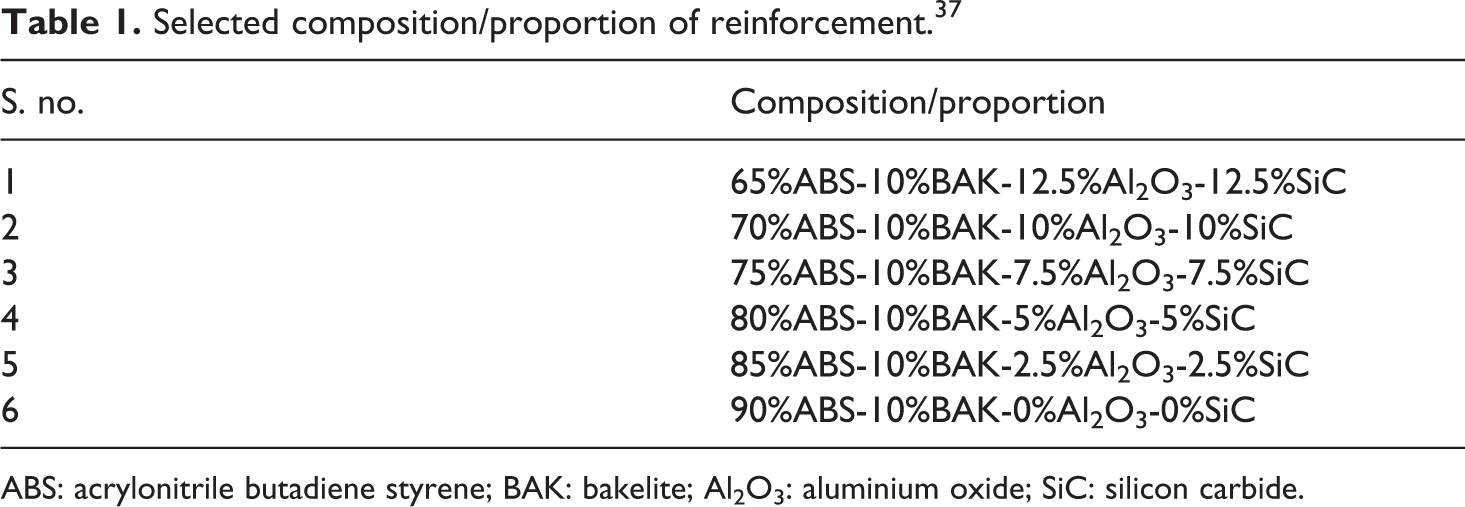
ABS: acrylonitrile butadiene styrene; BAK: bakelite; Al2O3: aluminium oxide; SiC: silicon carbide.
Figure 1 shows the flow chart for the present experimental study. The recycled ABS and BAK have been procured from local market (Batra Polymers, Ludhiana, Punjab, India) and reinforcement from (aluminium oxide (Al2O3) and silicon carbide (SiC)) from Shiva Chemicals, Ludhiana, Punjab, India.
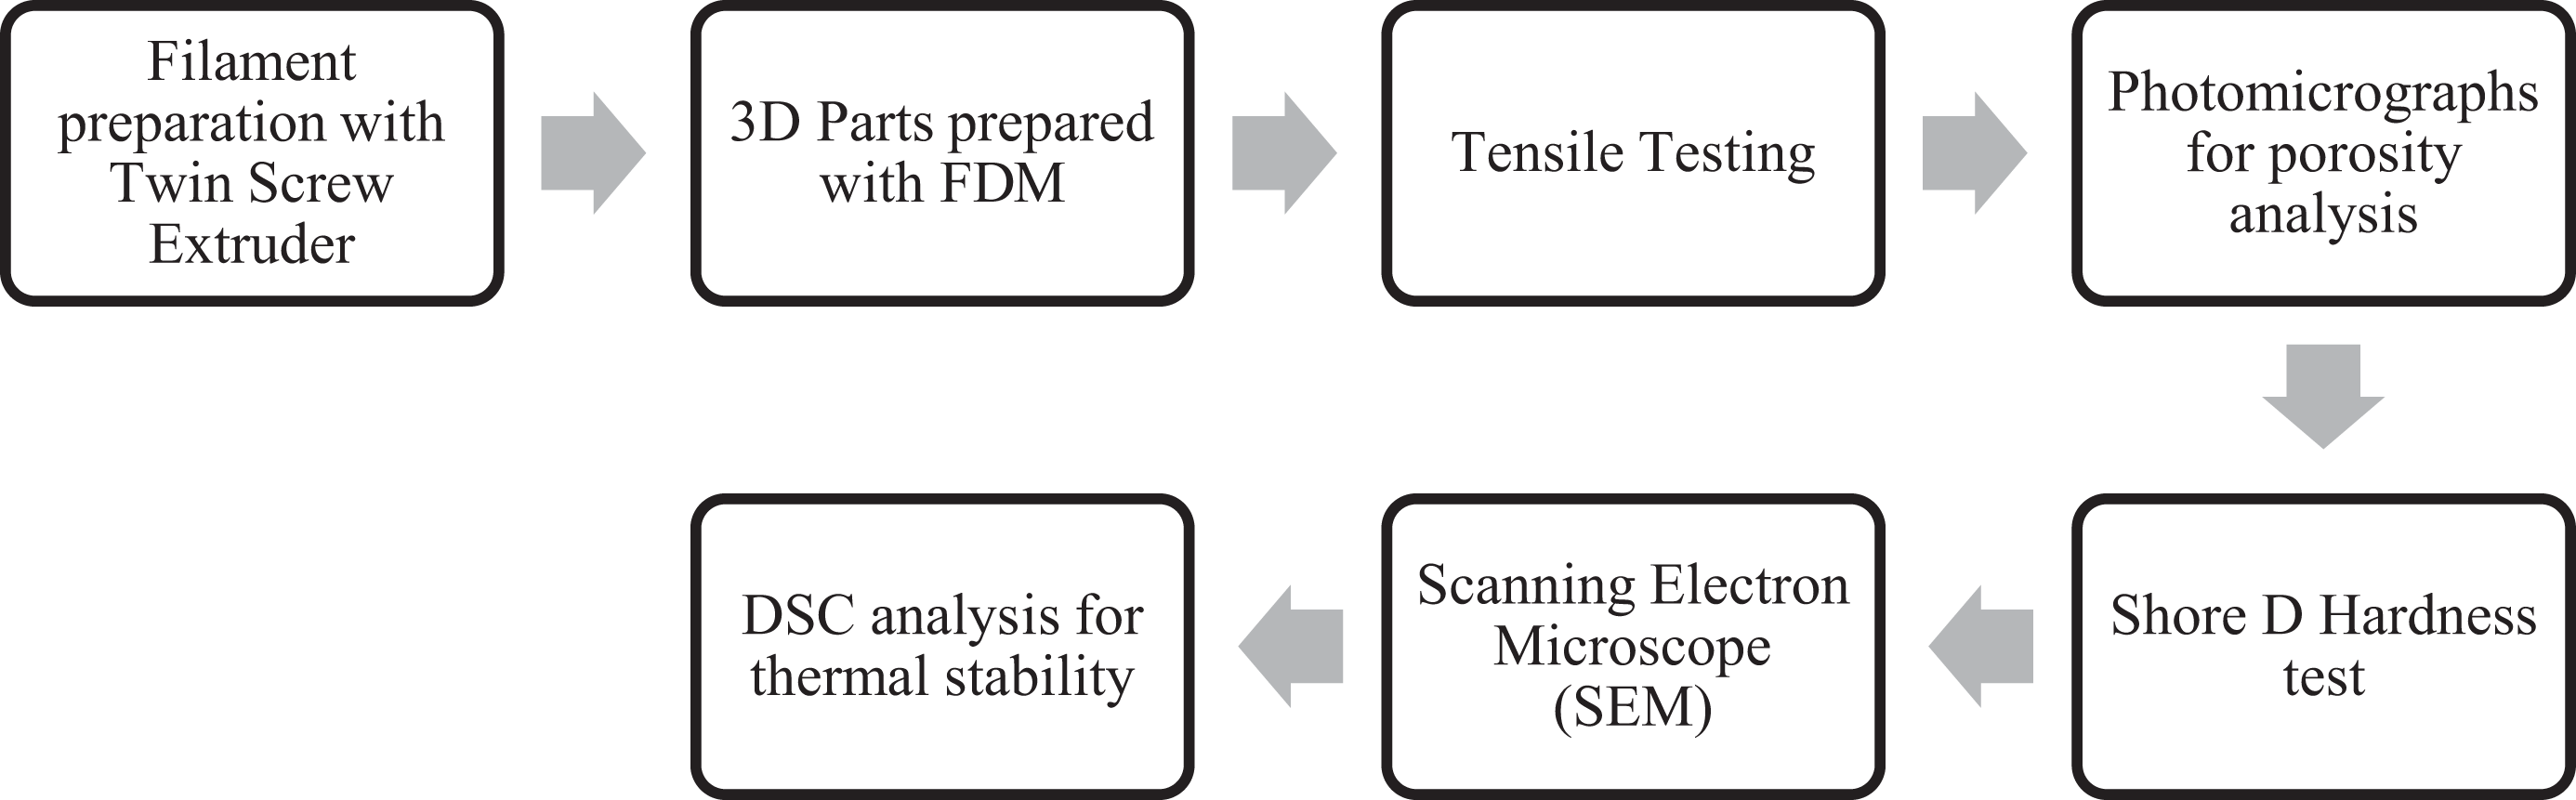
Flow chart for experimentation.
Experimentation
Since the present work is an extension of the study reported by Singh et al., initially a pilot study was conducted for possible 3D printing of functional prototypes. 37 Three compositions/proportions: C1(90%ABS-10%BAK-0%Al2O3-0%SiC), C2(80%ABS-10%BAK-5%Al2O3-5%SiC) and C3(70%ABS-10%BAK-10%Al2O3-10%SiC) were judicially selected to explore the effect of thermosetting polymer (BAK) and ceramic (Al2O3/SiC) as reinforcement. It has been reported that infill ratio/percentage and infill speed while printing with FDM affect the mechanical properties of the thermoplastic. 20 –23 So, based upon pilot study and review of the literature, 20 –29 three levels of composition/proportion (C1, C2 and C3), infill ratio/percentage (60, 80 and 100) and infill speed (50, 60 and 70 mm s−1) have been selected. Table 2 shows input parameters and their levels selected for processing on FDM.
Input parameters and their levels.
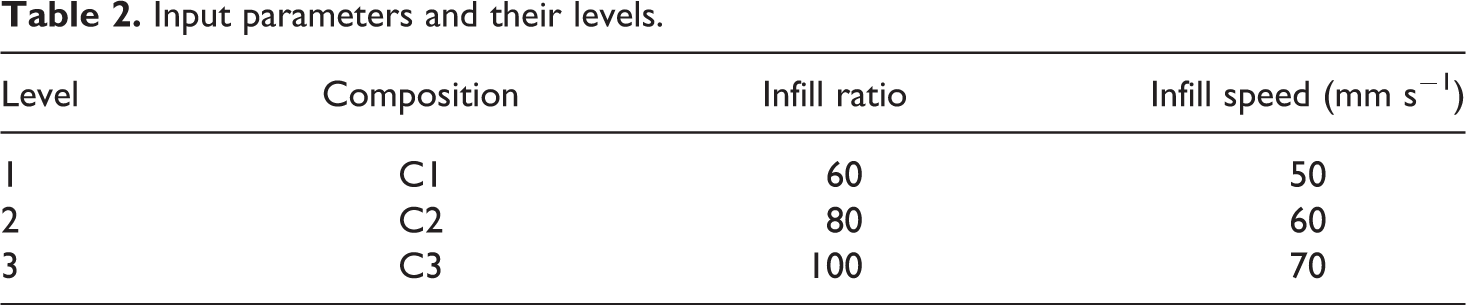
Table 3 shows design of experiment (DOE) selected based upon Taguchi L9 orthogonal array. The other input FDM parameters were kept fixed based upon the literature. 6 –8 It should be noted that with proposed composition/proportion no printing difficulties were encountered as proportion of reinforcement was relatively less.
DOE for final experimentation.
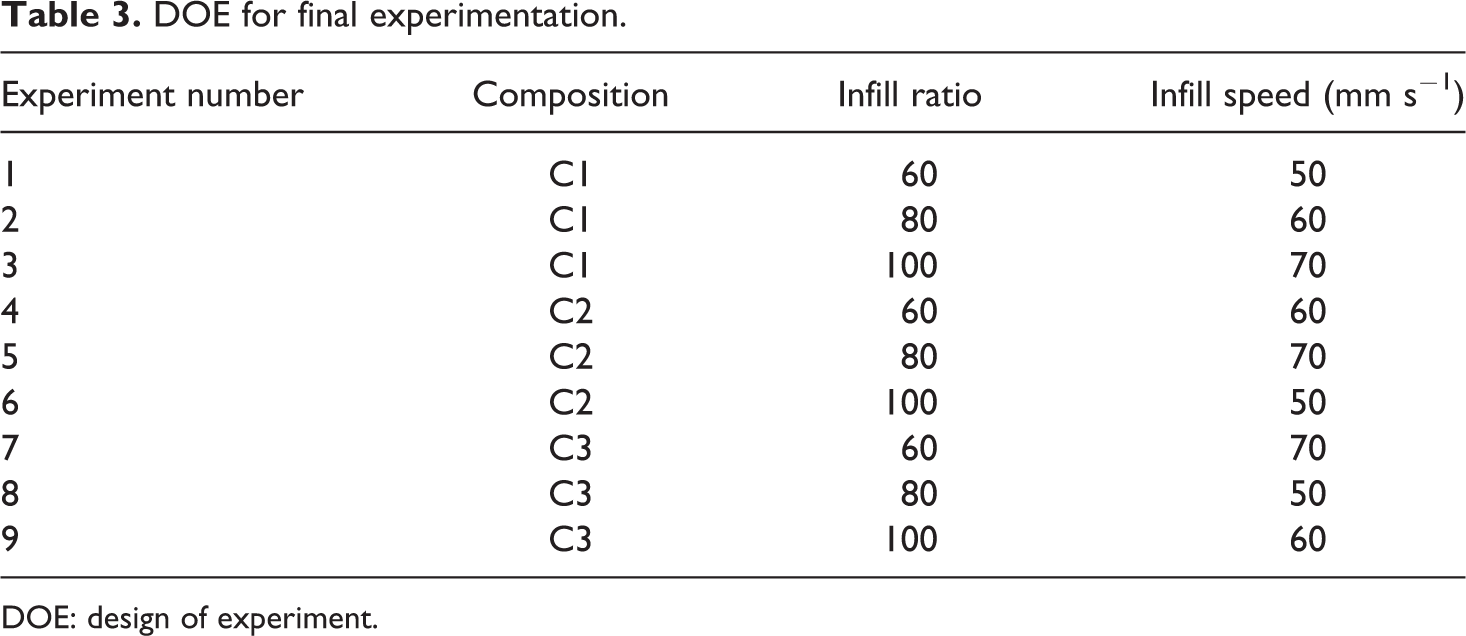
DOE: design of experiment.
Further based upon Table 3, 27 (9 × 3 repetitions) tensile samples as per ASTM D 638 type IV were printed on FDM setup (Figure 2).
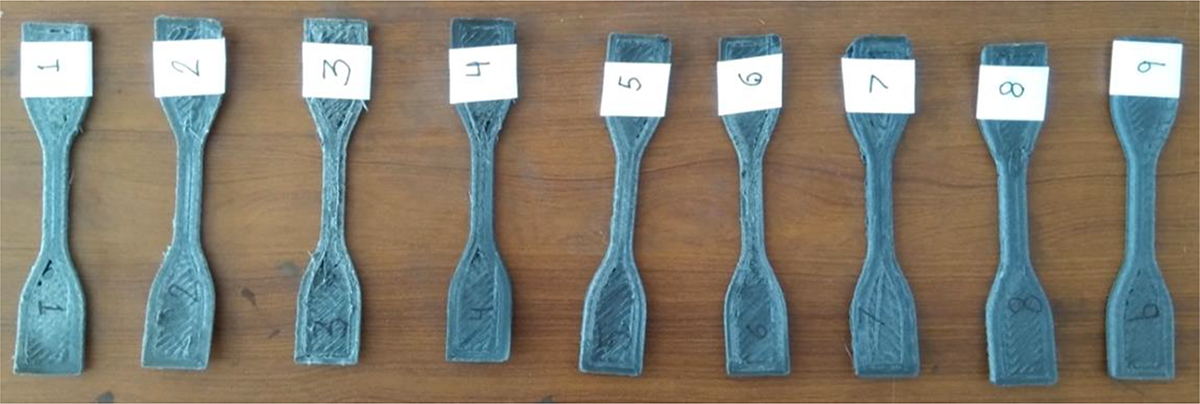
3D printed specimens for tensile testing.
The 3D printed specimens were put on tensile testing at universal tensile testing setup at 50 mm s−1 speed. Figure 3 shows FDM printed samples after tensile testing.
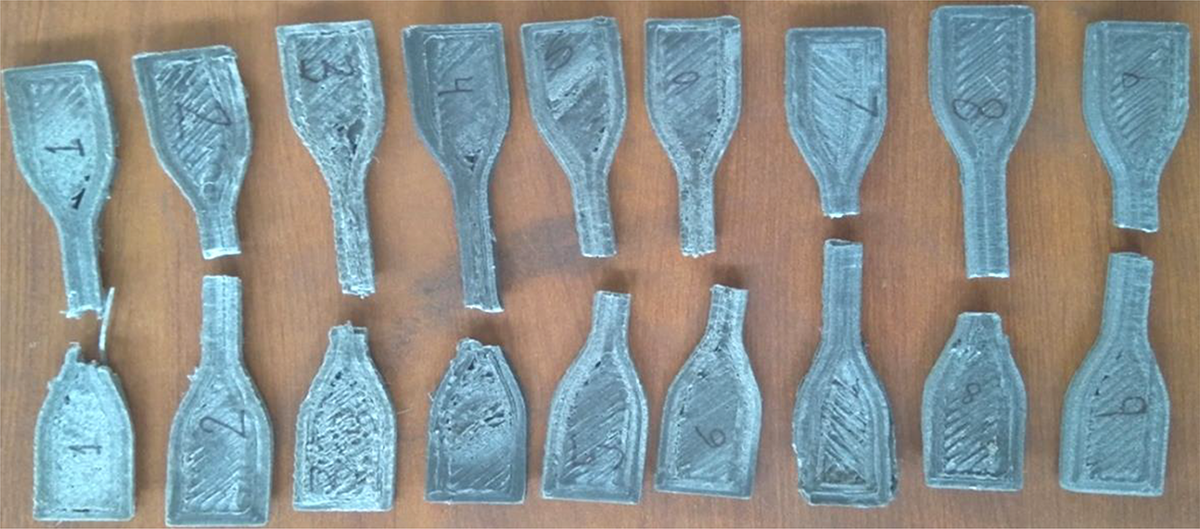
3D printed specimens after testing on UTT.
Now by applying DOE (as per Table 3), Table 4 shows observations for various mechanical/morphological properties. Further, Figures 4 and 5, respectively, show plots for load versus displacement and stress versus strain.
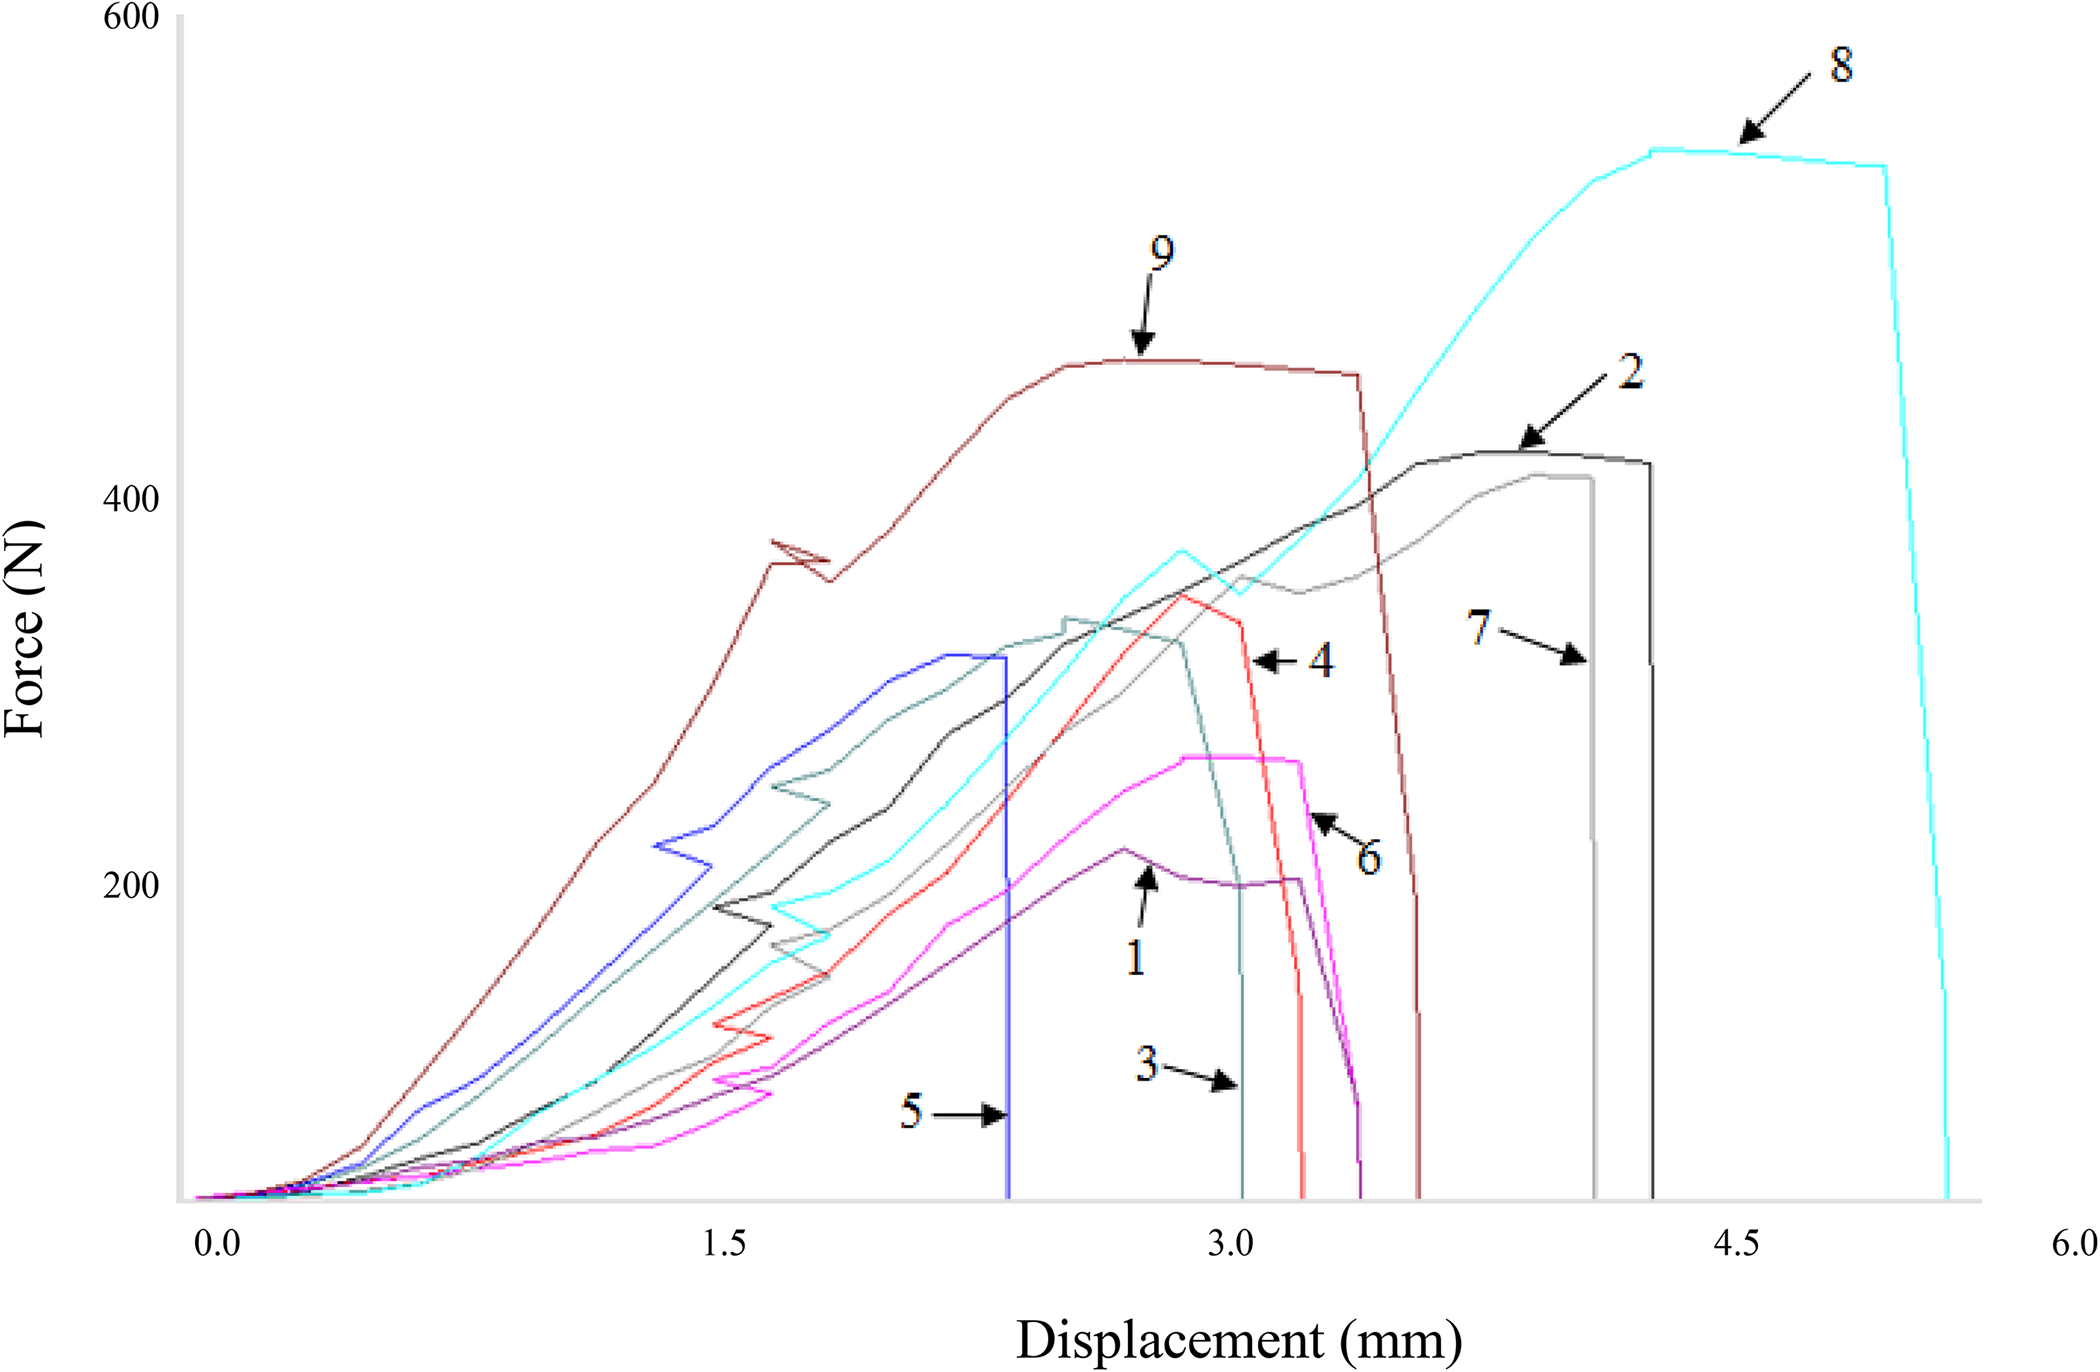
Load versus displacement curve (as per Table 4).
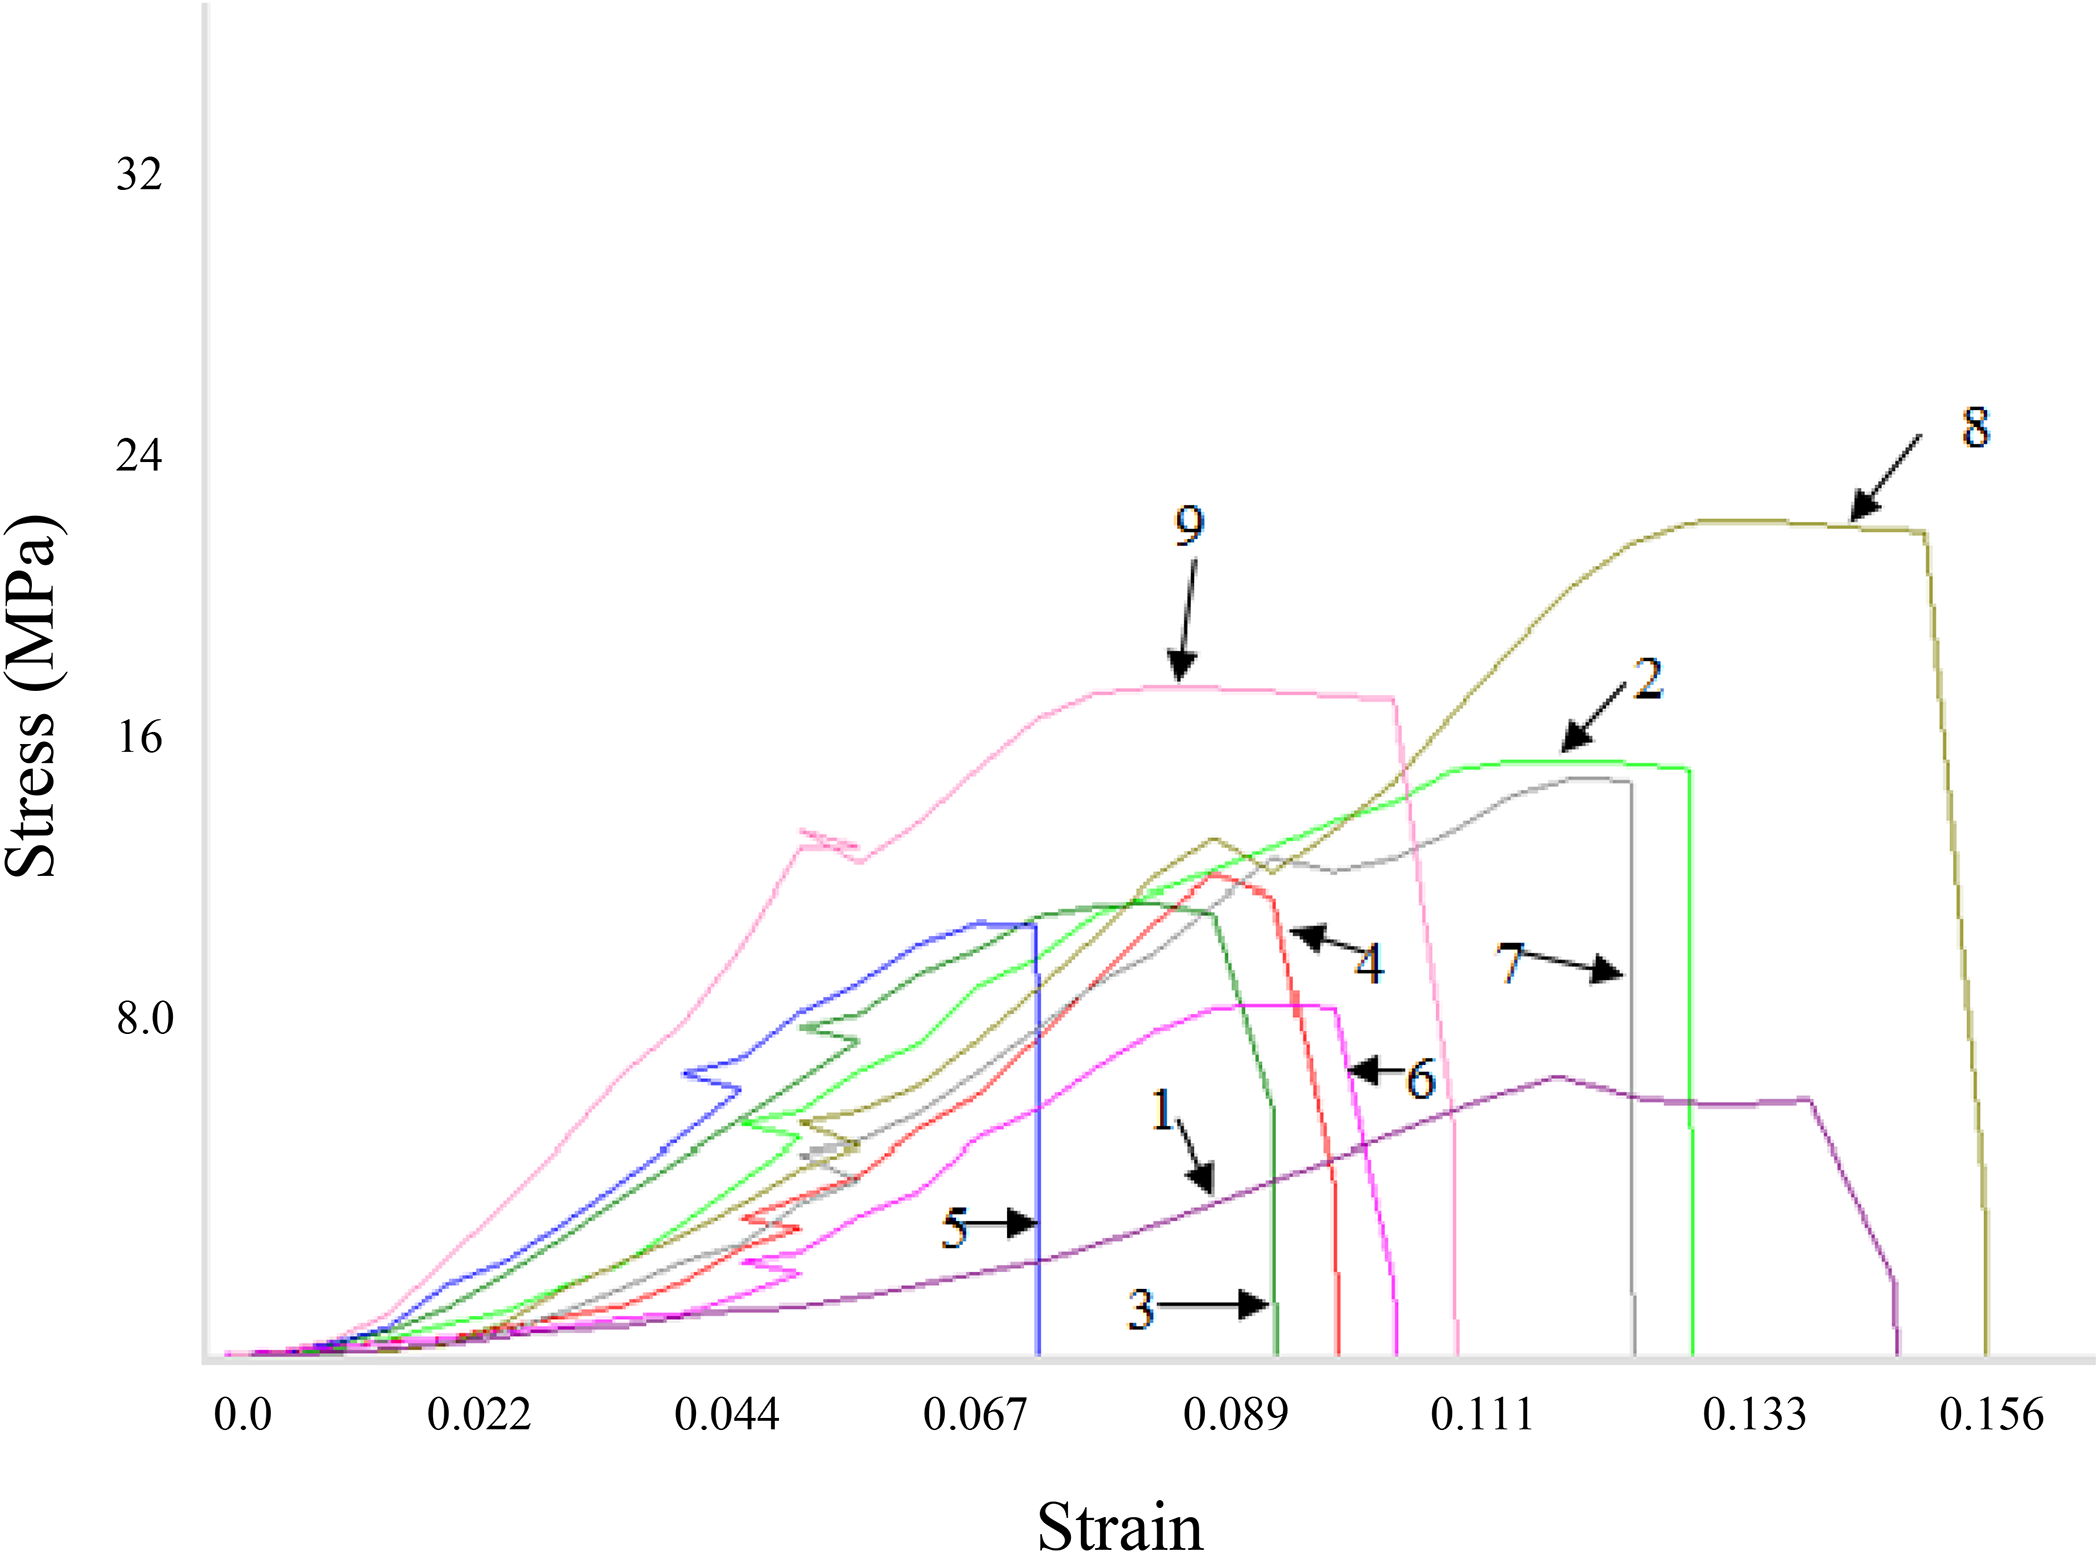
Stress versus strain curve (as per Table 4).
Observations for mechanical and morphological properties.a
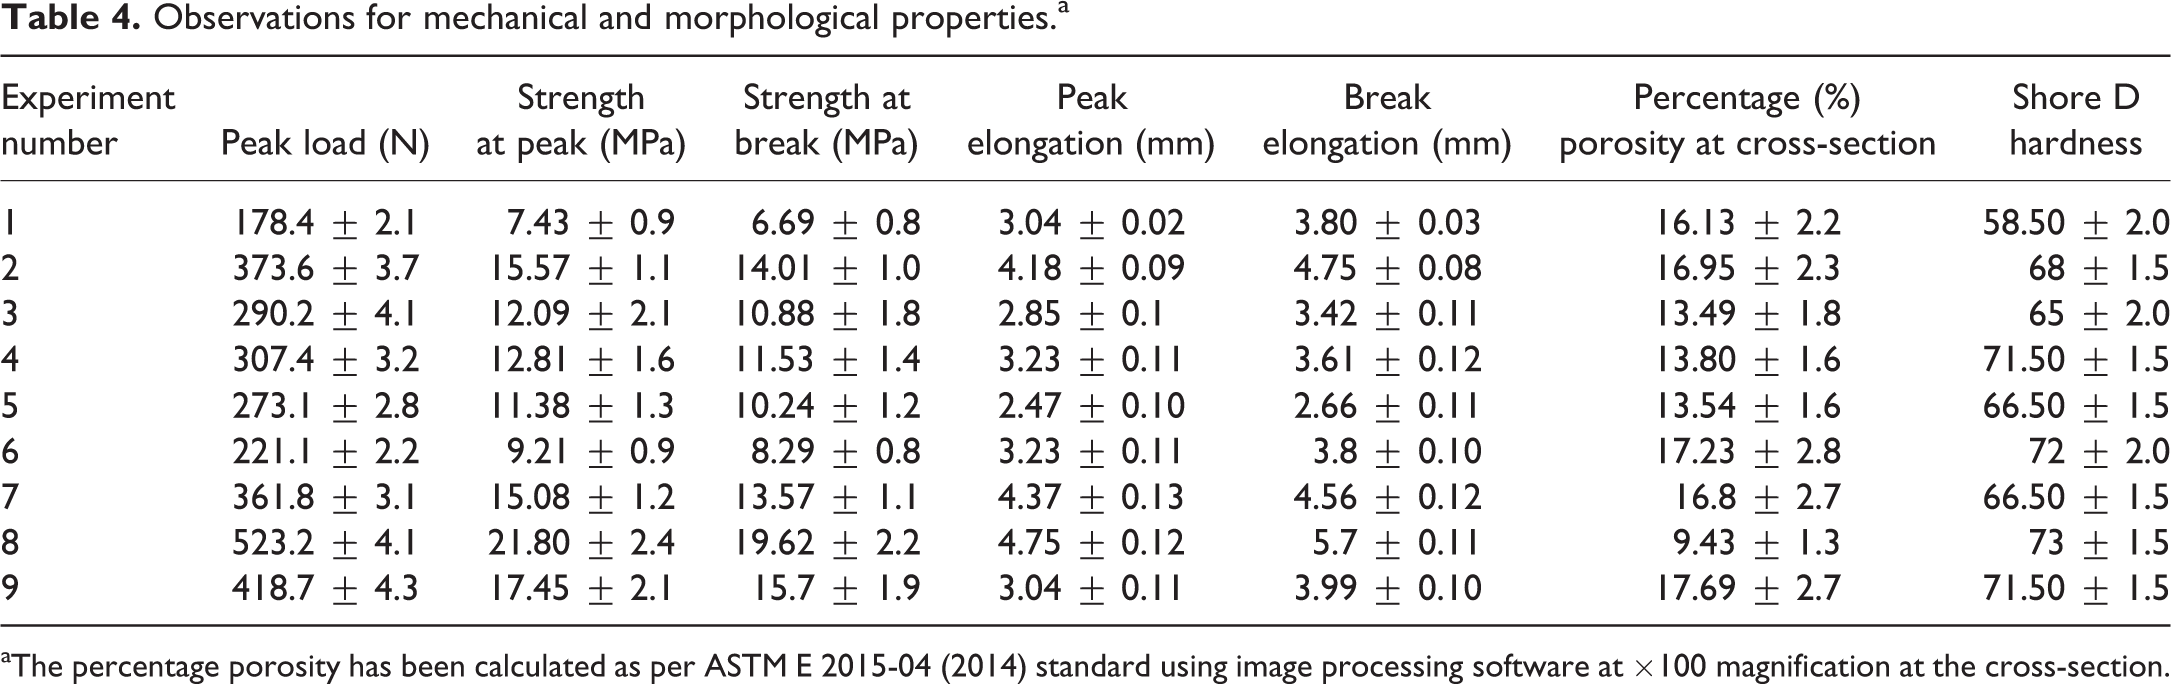
aThe percentage porosity has been calculated as per ASTM E 2015-04 (2014) standard using image processing software at ×100 magnification at the cross-section.
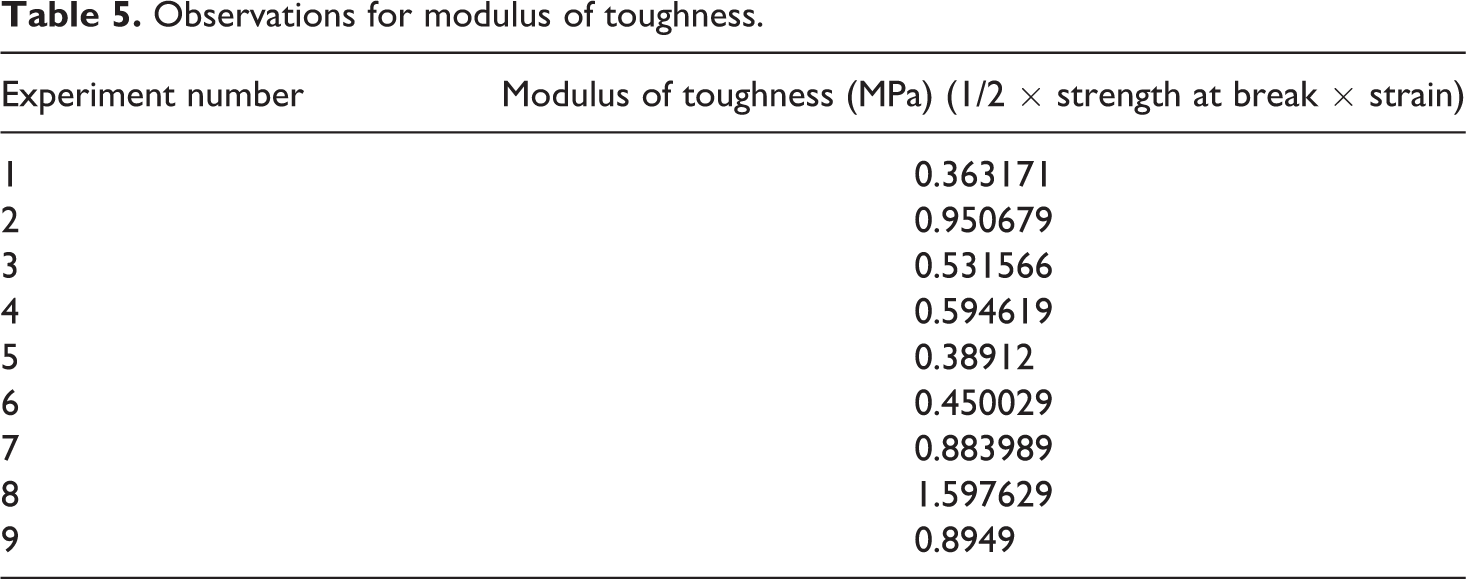
Based upon Table 4 and Figure 5, Table 5 shows observations for modulus of toughness. As observed from Tables 4 and 5, samples prepared in experiment number 8 have maximum strength at peak, strength at break, peak load, peak elongation, break elongation, Shore D hardness, modulus of toughness and lowest percentage porosity. Hence from mechanical, surface properties viewpoint (based upon Table 4) and for crash applications (based upon Table 5), sample prepared in experiment number 8 is recommended.
Observations for modulus of toughness.
Results and discussion
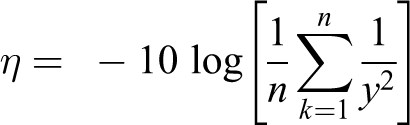
Now based upon Table 4, Table 6 shows signal-to-noise (SN) ratio for maximum the better type case for strength at peak using the following formula
SN ratios for strength at peak.
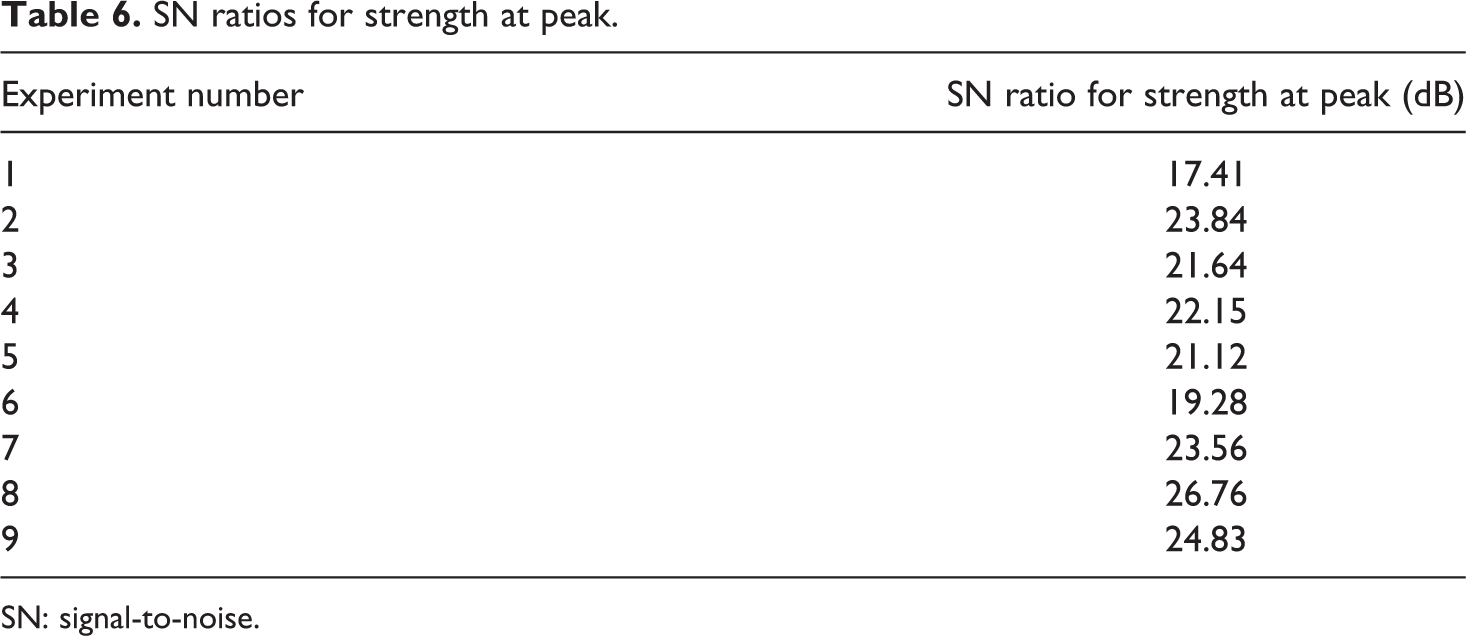
SN: signal-to-noise.
where
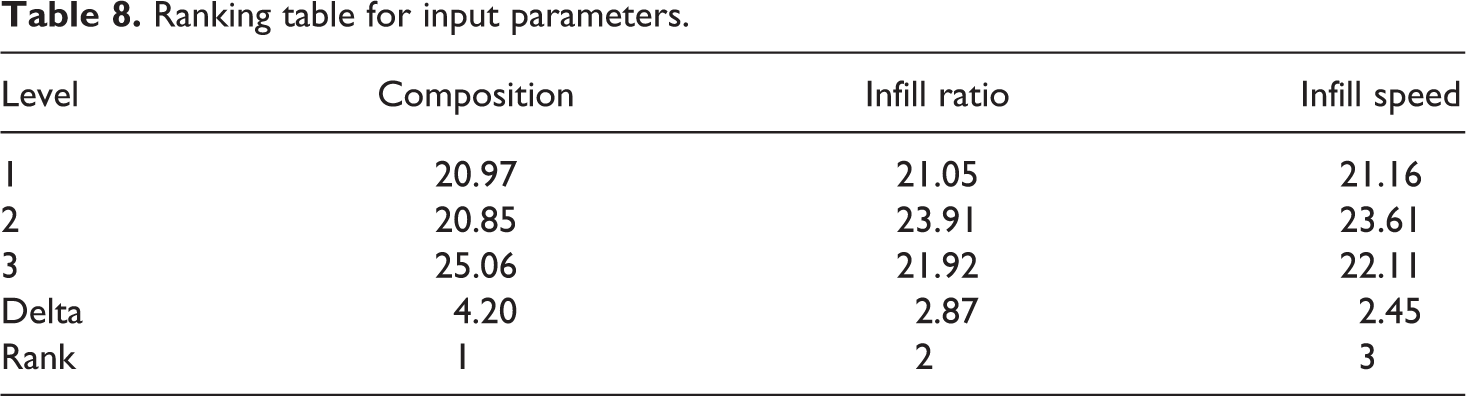
Based upon Tables 4 and 6, analysis of variance and ranking of input parameters have been presented in Tables 7 and 8, respectively. Further, Figure 6 shows mean effect plot for SN ratios. As observed from Figure 6, the best settings for input parameters are composition (C3), infill ratio (80%) and infill speed (60 mm s−1).
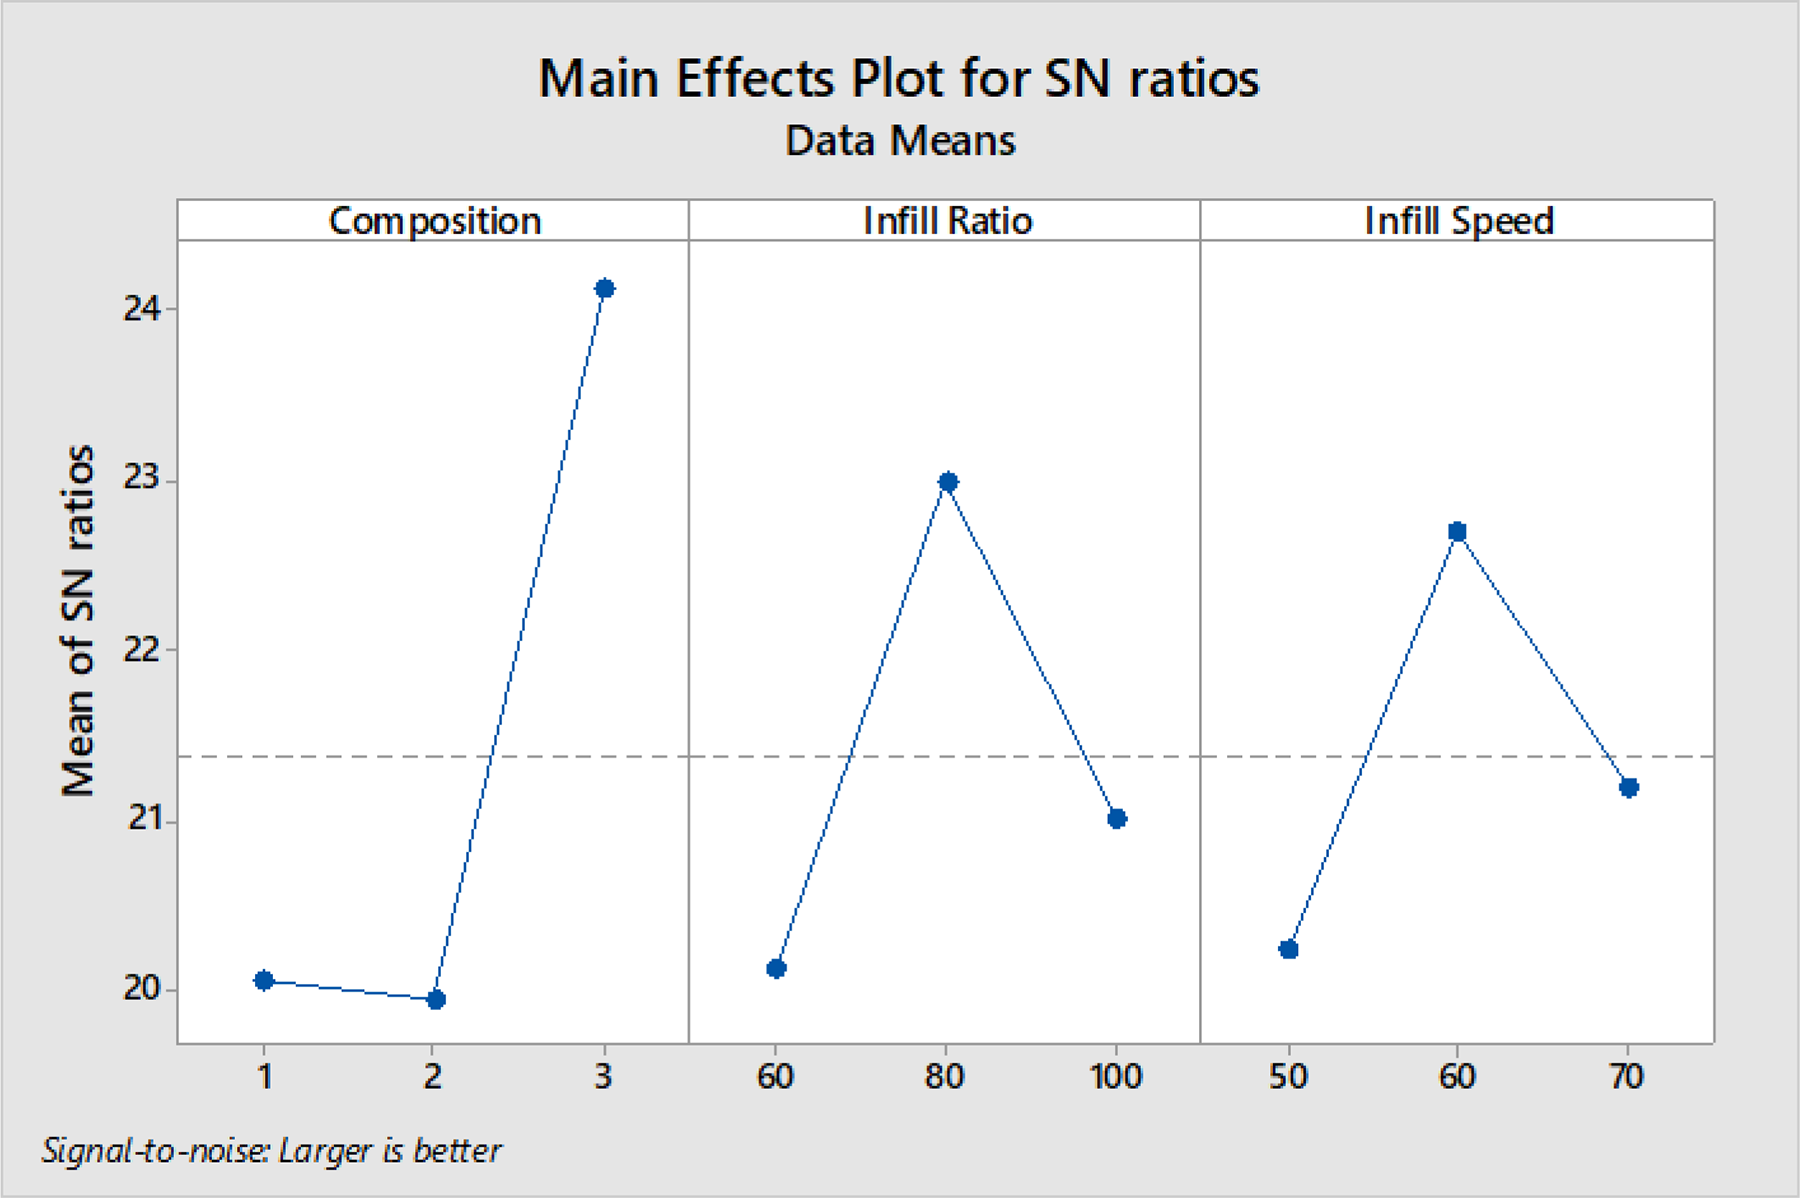
Main effect plot for SN ratios for strength at peak.
ANOVA for strength at peak.
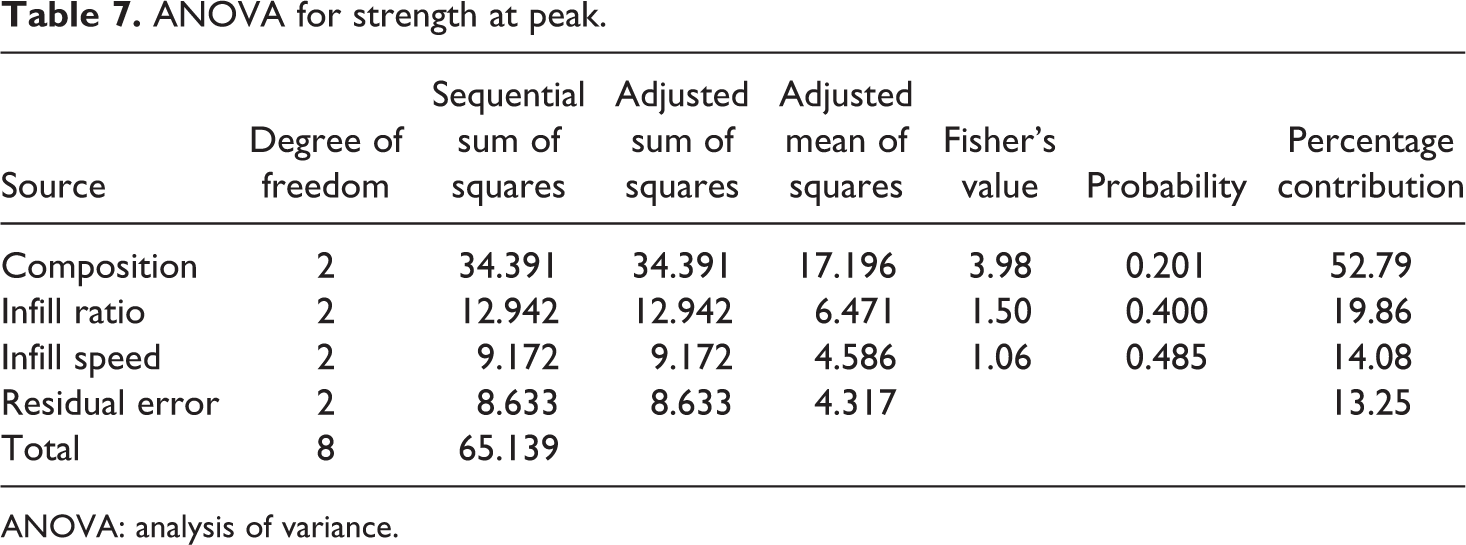
ANOVA: analysis of variance.
Ranking table for input parameters.
As observed from Table 7, the composition has maximum contribution (52.79%) for strength at peak followed by infill ratio (19.86%) and infill speed (14.08 mm s−1). As observed from Figure 6, with increase in ceramic composition/proportion (5% Al2O3/SiC) there was initial dip in peak strength and with further increase up to 10% (Al2O3/SiC) a steep rise in peak strength was observed. This may be due to the fact that 5% Al2O3/SiC proportion in ABS-BAK matrix have non-uniform dispersion (mainly because of processing conditions) resulting into agglomeration. The dispersion of reinforcements may have become better with higher proportion of Al2O3/SiC and processing conditions.
Prediction for peak strength at proposed settings
Following formula has been used for prediction of peak strength at proposed setting:

where Hopt is the SN value at optimum settings, X is the mean of SN values for peak strength at 09 different settings (as per Table 5) = 22.29 dB, XA3 is the SN ratio of composition at level 3, XB2 is the SN ratio of infill ratio at level 2 and XC2 is the SN ratio of infill speed at level 2.
After putting the values of X, XA3, XB2 and XC2 (from Table 8), Hopt = 28.
The optimum value of peak strength can be obtained by using the following formula
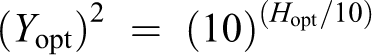
Putting the value of Hopt in the above equation, (Yopt)) 2 = (10)2.8, Yopt = 25.12 MPa.
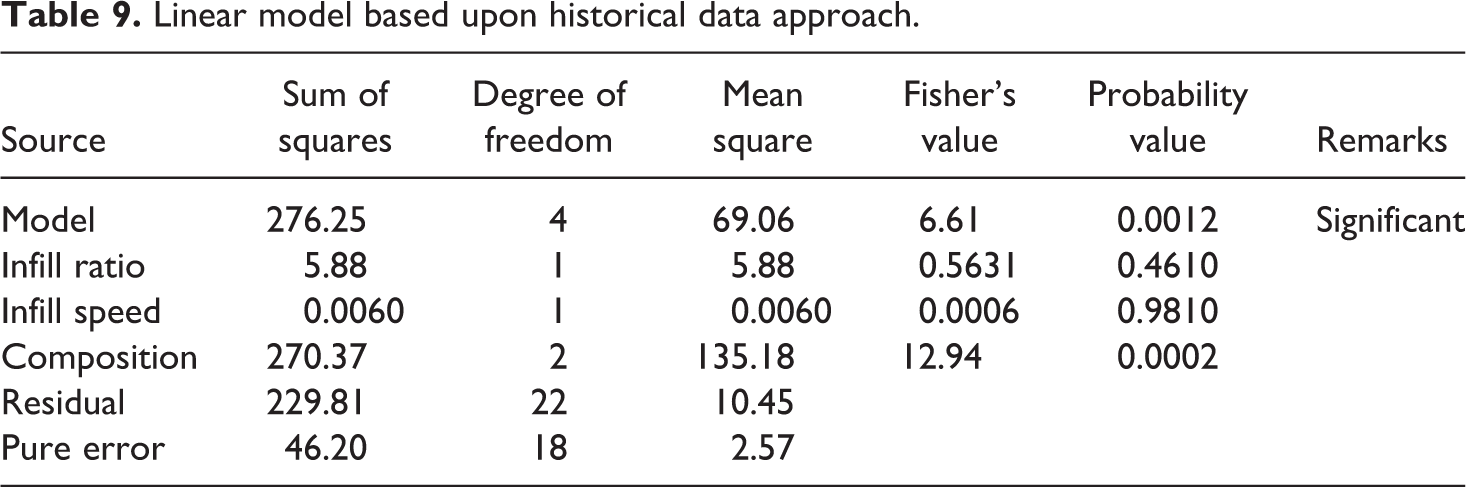
The confirmatory experiment was conducted at proposed settings and observed value for peak strength was 23.21 MPa. It should be noted that the peak strength of 3D printed parts are observed at par with the feedstock filament 37 and with unreinforced ABS (which was 22.4 MPa). Further as observed from Table 7, the residual error was high (13.25%) and no parameter was significant at 95% confidence level. So to ascertain the interaction among input parameters for observed values of strength at peak (Table 4), historical data approach (under response surface methodology) has been used. It has been observed that two-factor interaction, quadratic or higher degree model showed aliased results and therefore discarded and finally linear model has been recommended (see Table 9). The model Fisher’s value of 6.61 implies the model is significant. Further, probability values less than 0.0500 indicate model terms are significant. In this case, composition is a significant model term. Based upon Table 9, Figure 7(a) to (c) shows the 3D model graphs.
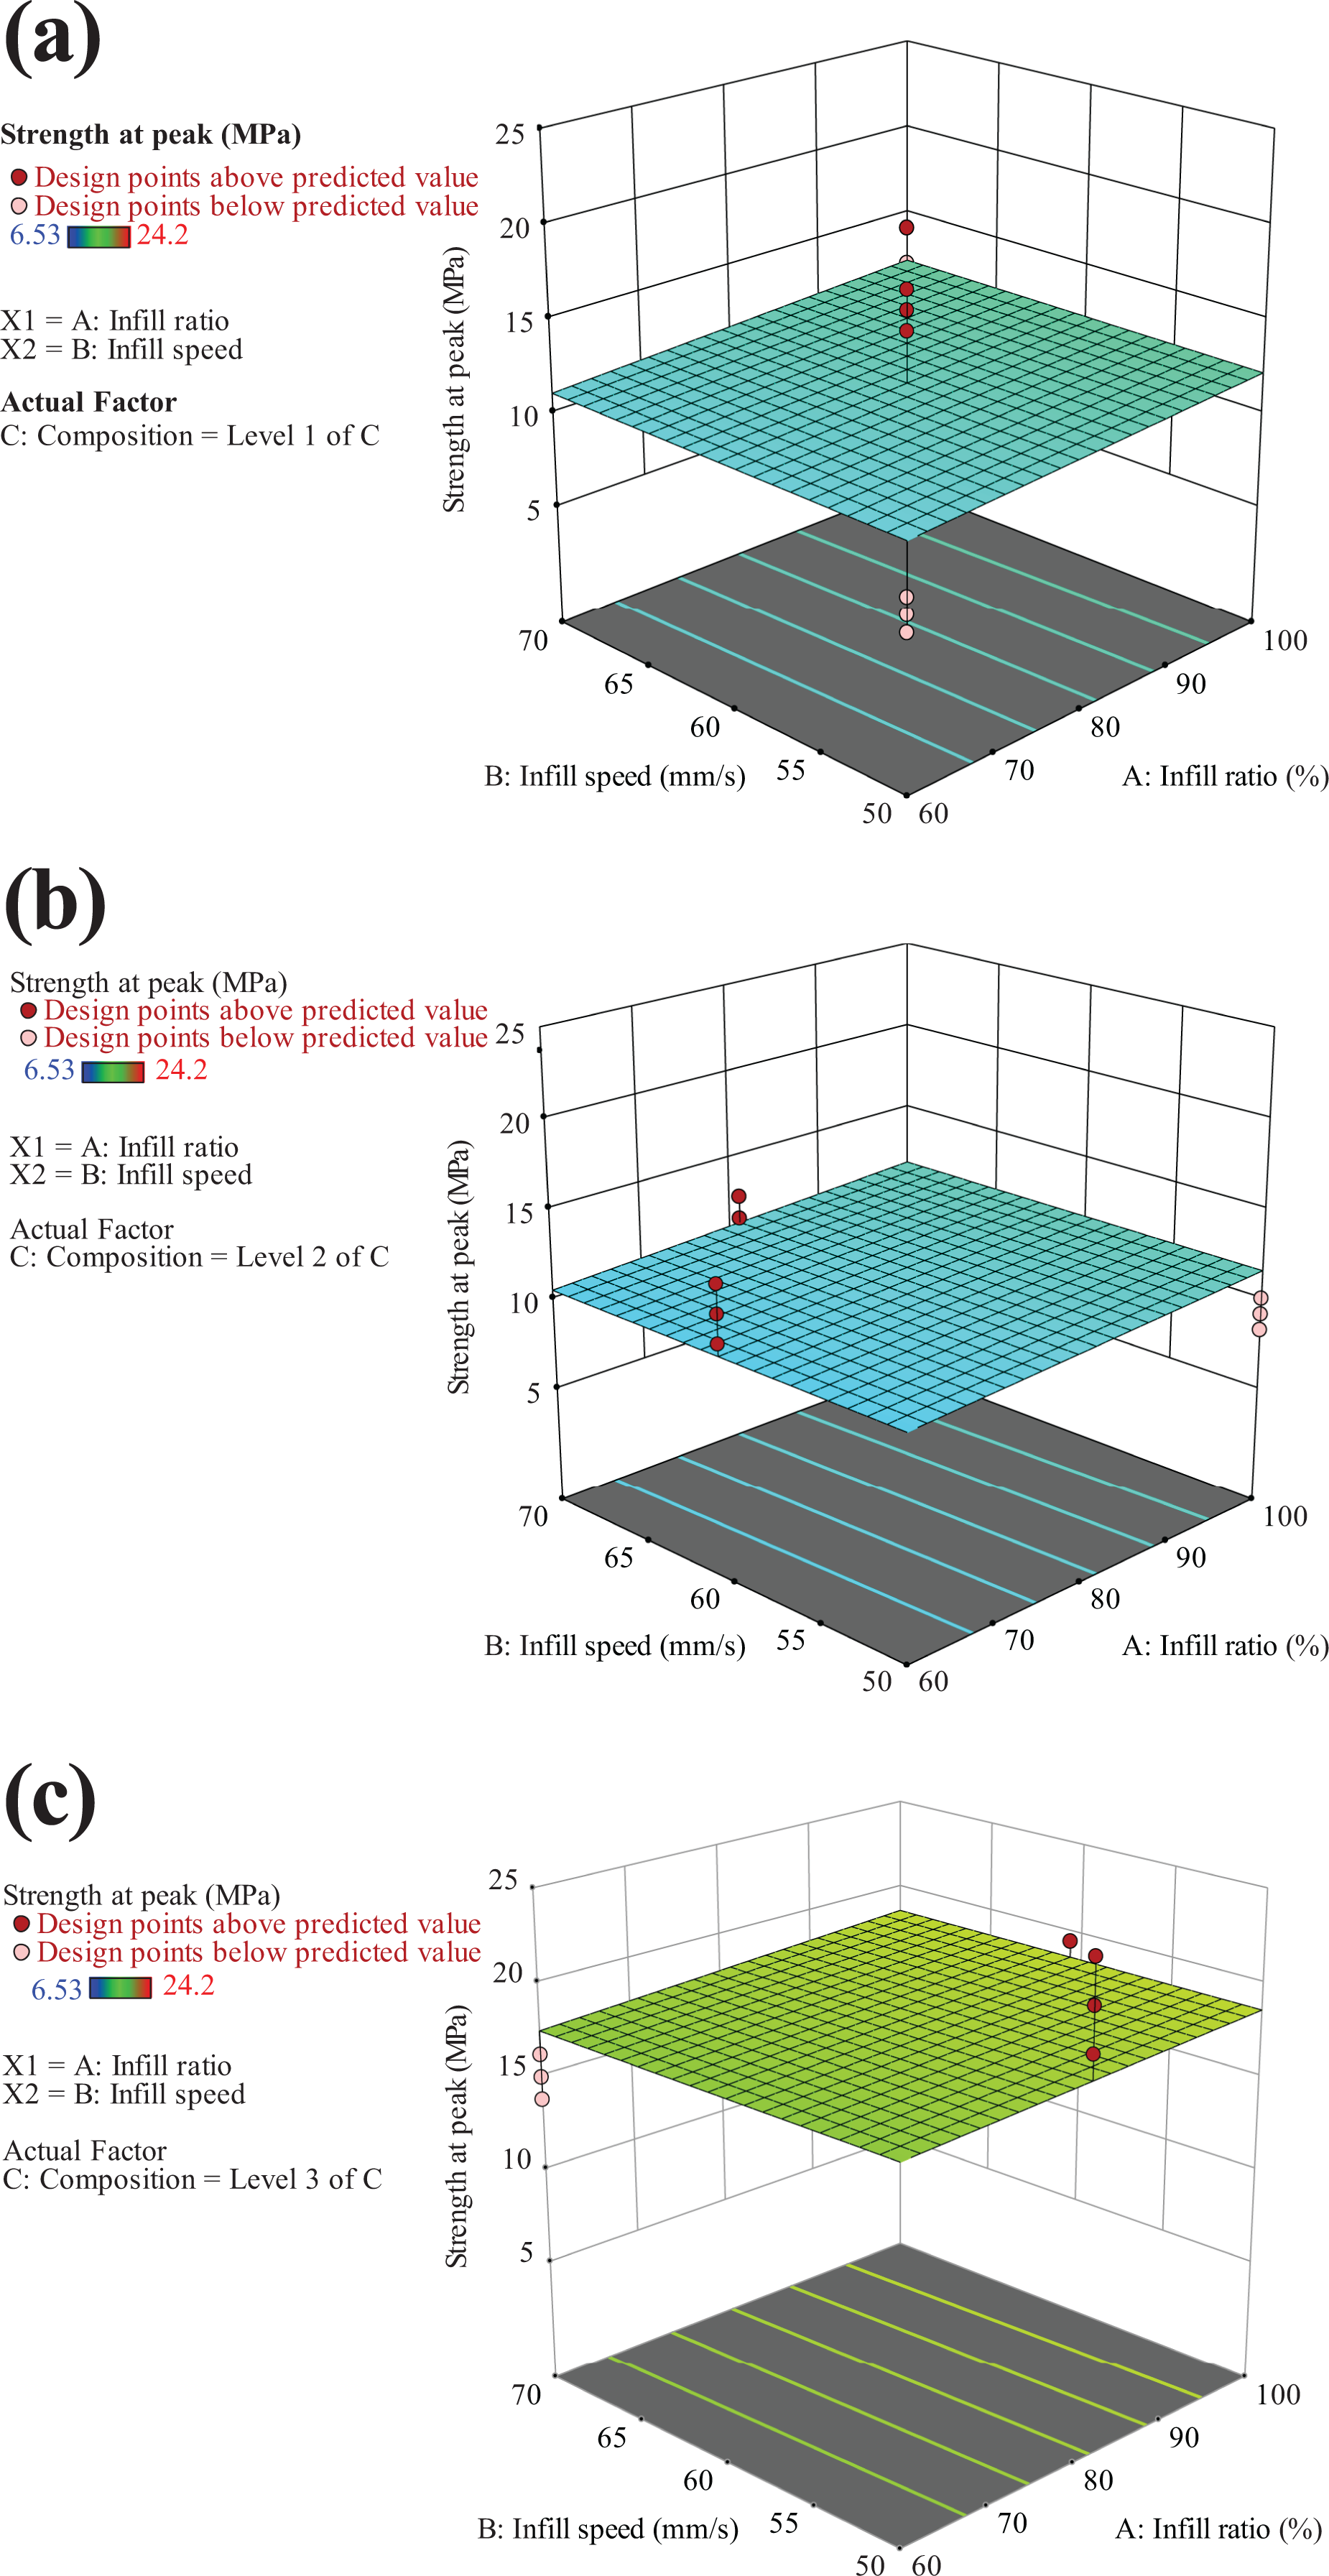
3D model graph (based upon Table 9) for (a) C1, (b) C2 and (c) C3.
Linear model based upon historical data approach.
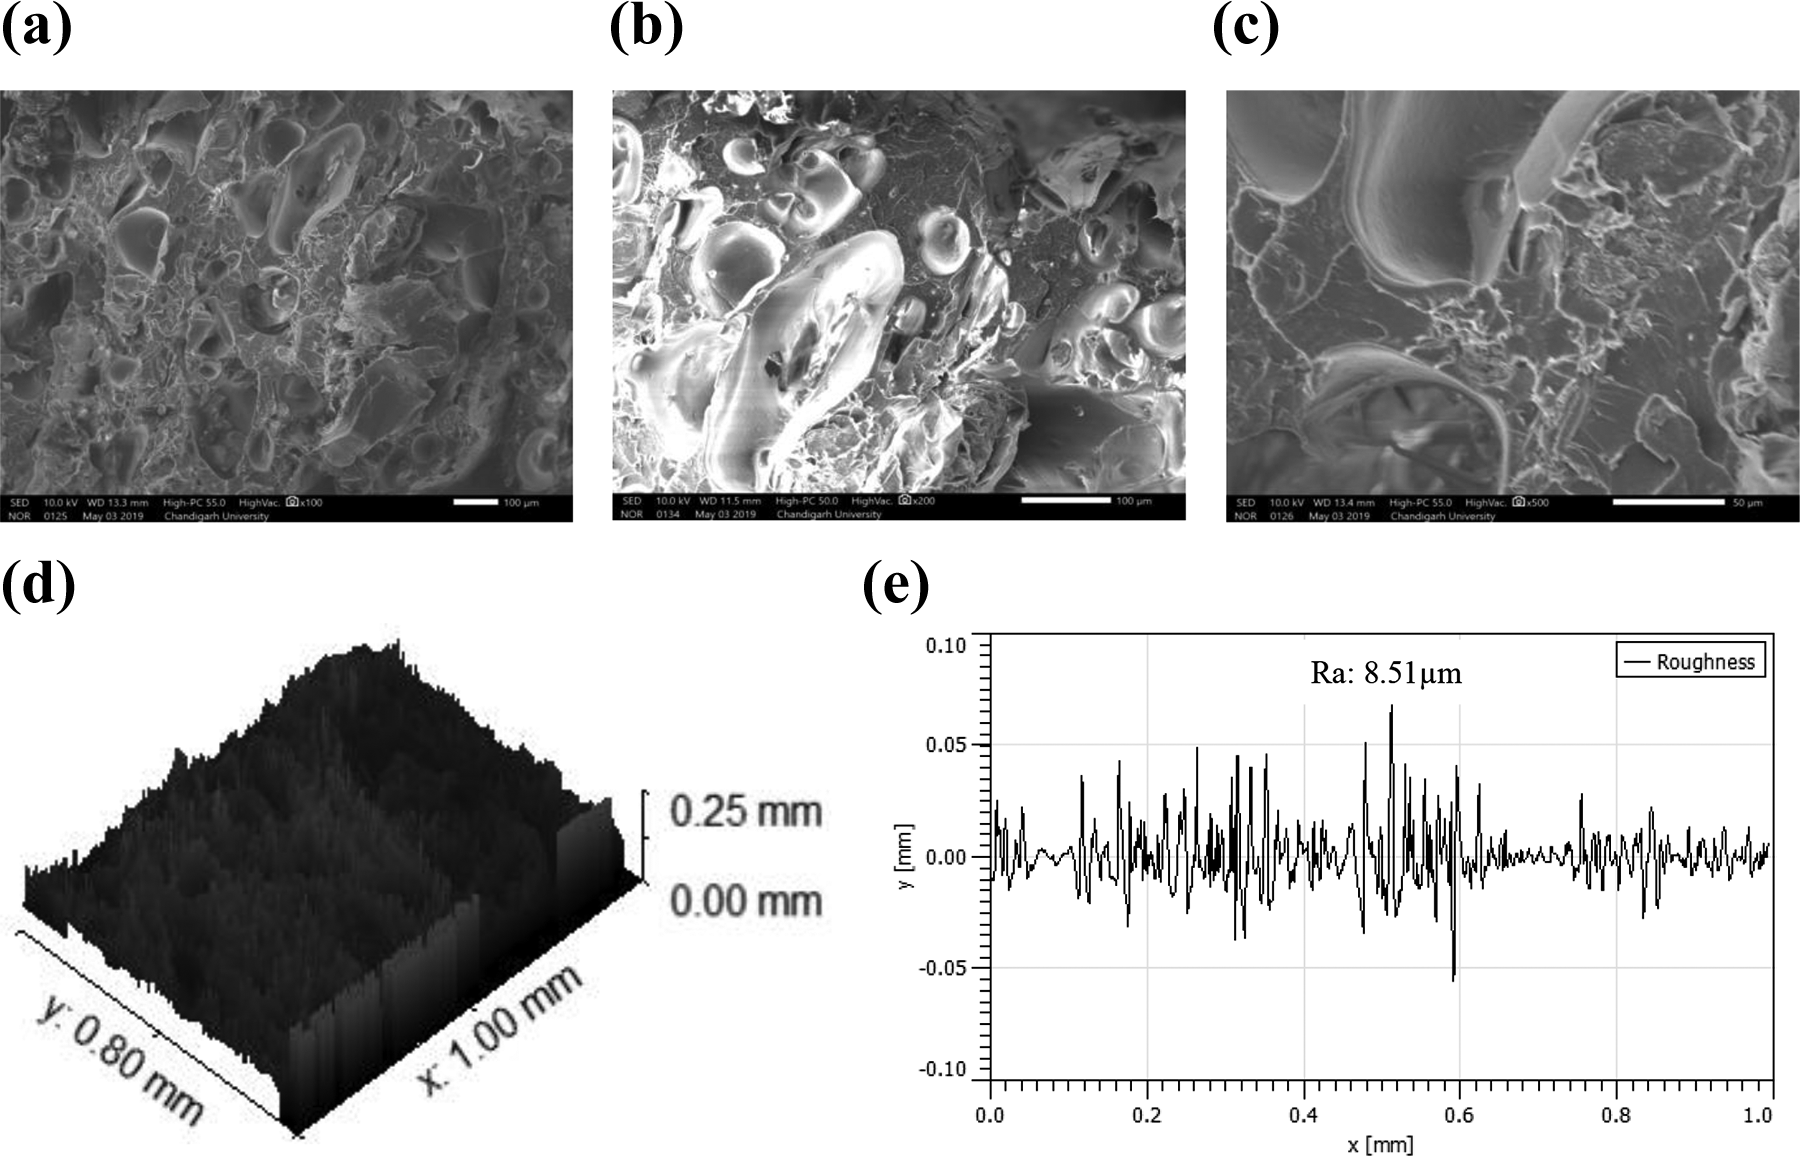
As observed from Figure 7, better results for strength at peak are observed for C3, whereas other two parameters, that is, infill ratio and infill speed, are having no effect. Further based upon Table 3, Figure 8 shows photomicrographs of samples at cross-section (at 30×) after tensile testing. It has been observed that sample number 8 with best mechanical properties has relatively less porosity and highest surface hardness (see Table 4). On the other hand, for sample number 1 with poor mechanical properties, the porosity value is relatively high with low value of surface hardness. For better understanding of failure mechanism, the scanning electron microscopy (SEM)-based images were captured at different magnifications (Figures 9 and 10) for sample number 8 (with better mechanical properties) and sample number 1(with poor mechanical properties). In sample 8, it has been observed (through the rendered SEM images and surface roughness (Ra) profile) that more uniform grains with less Ra value are major reason for better mechanical properties in comparison to sample number 1.
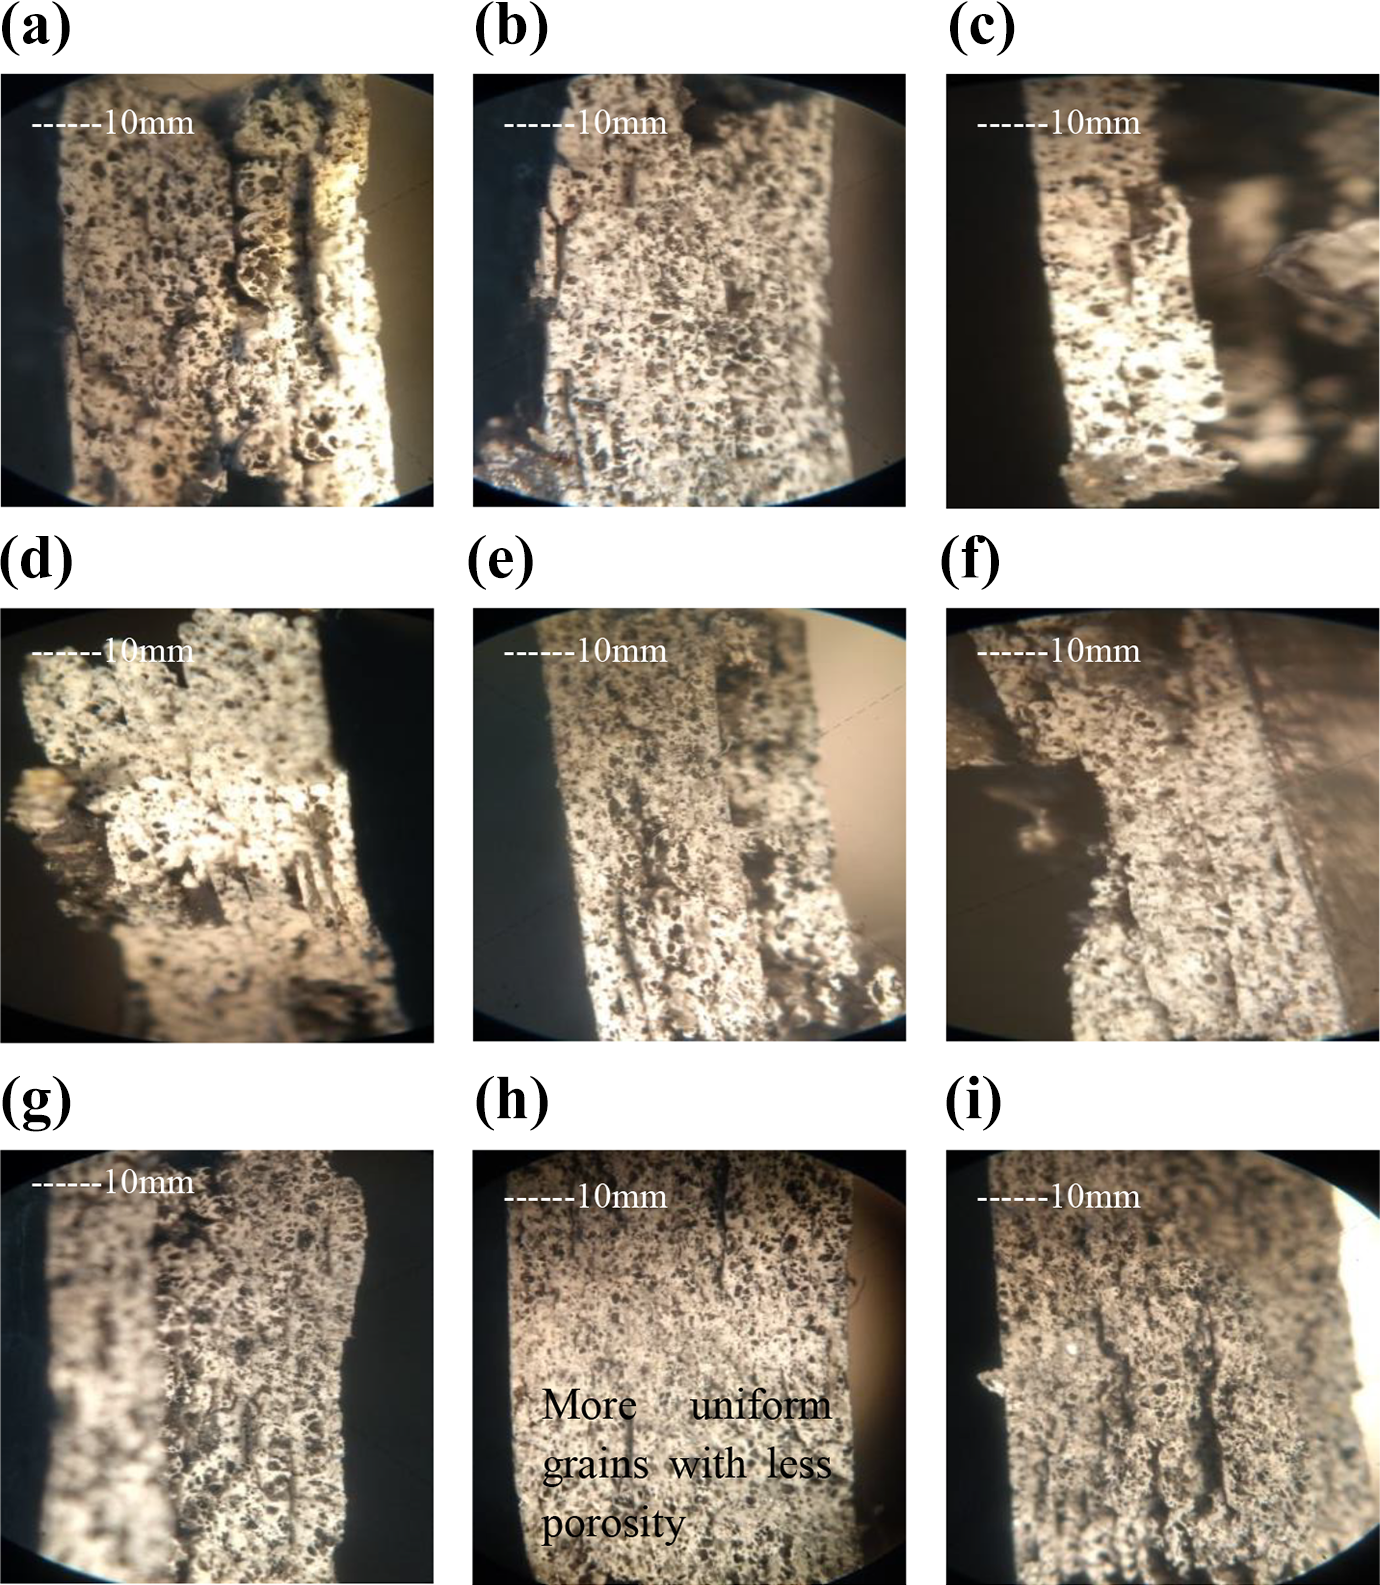
Photomicrographs ((a) to (i)) for 3D printed samples after tensile testing at cross-section (at ×30).
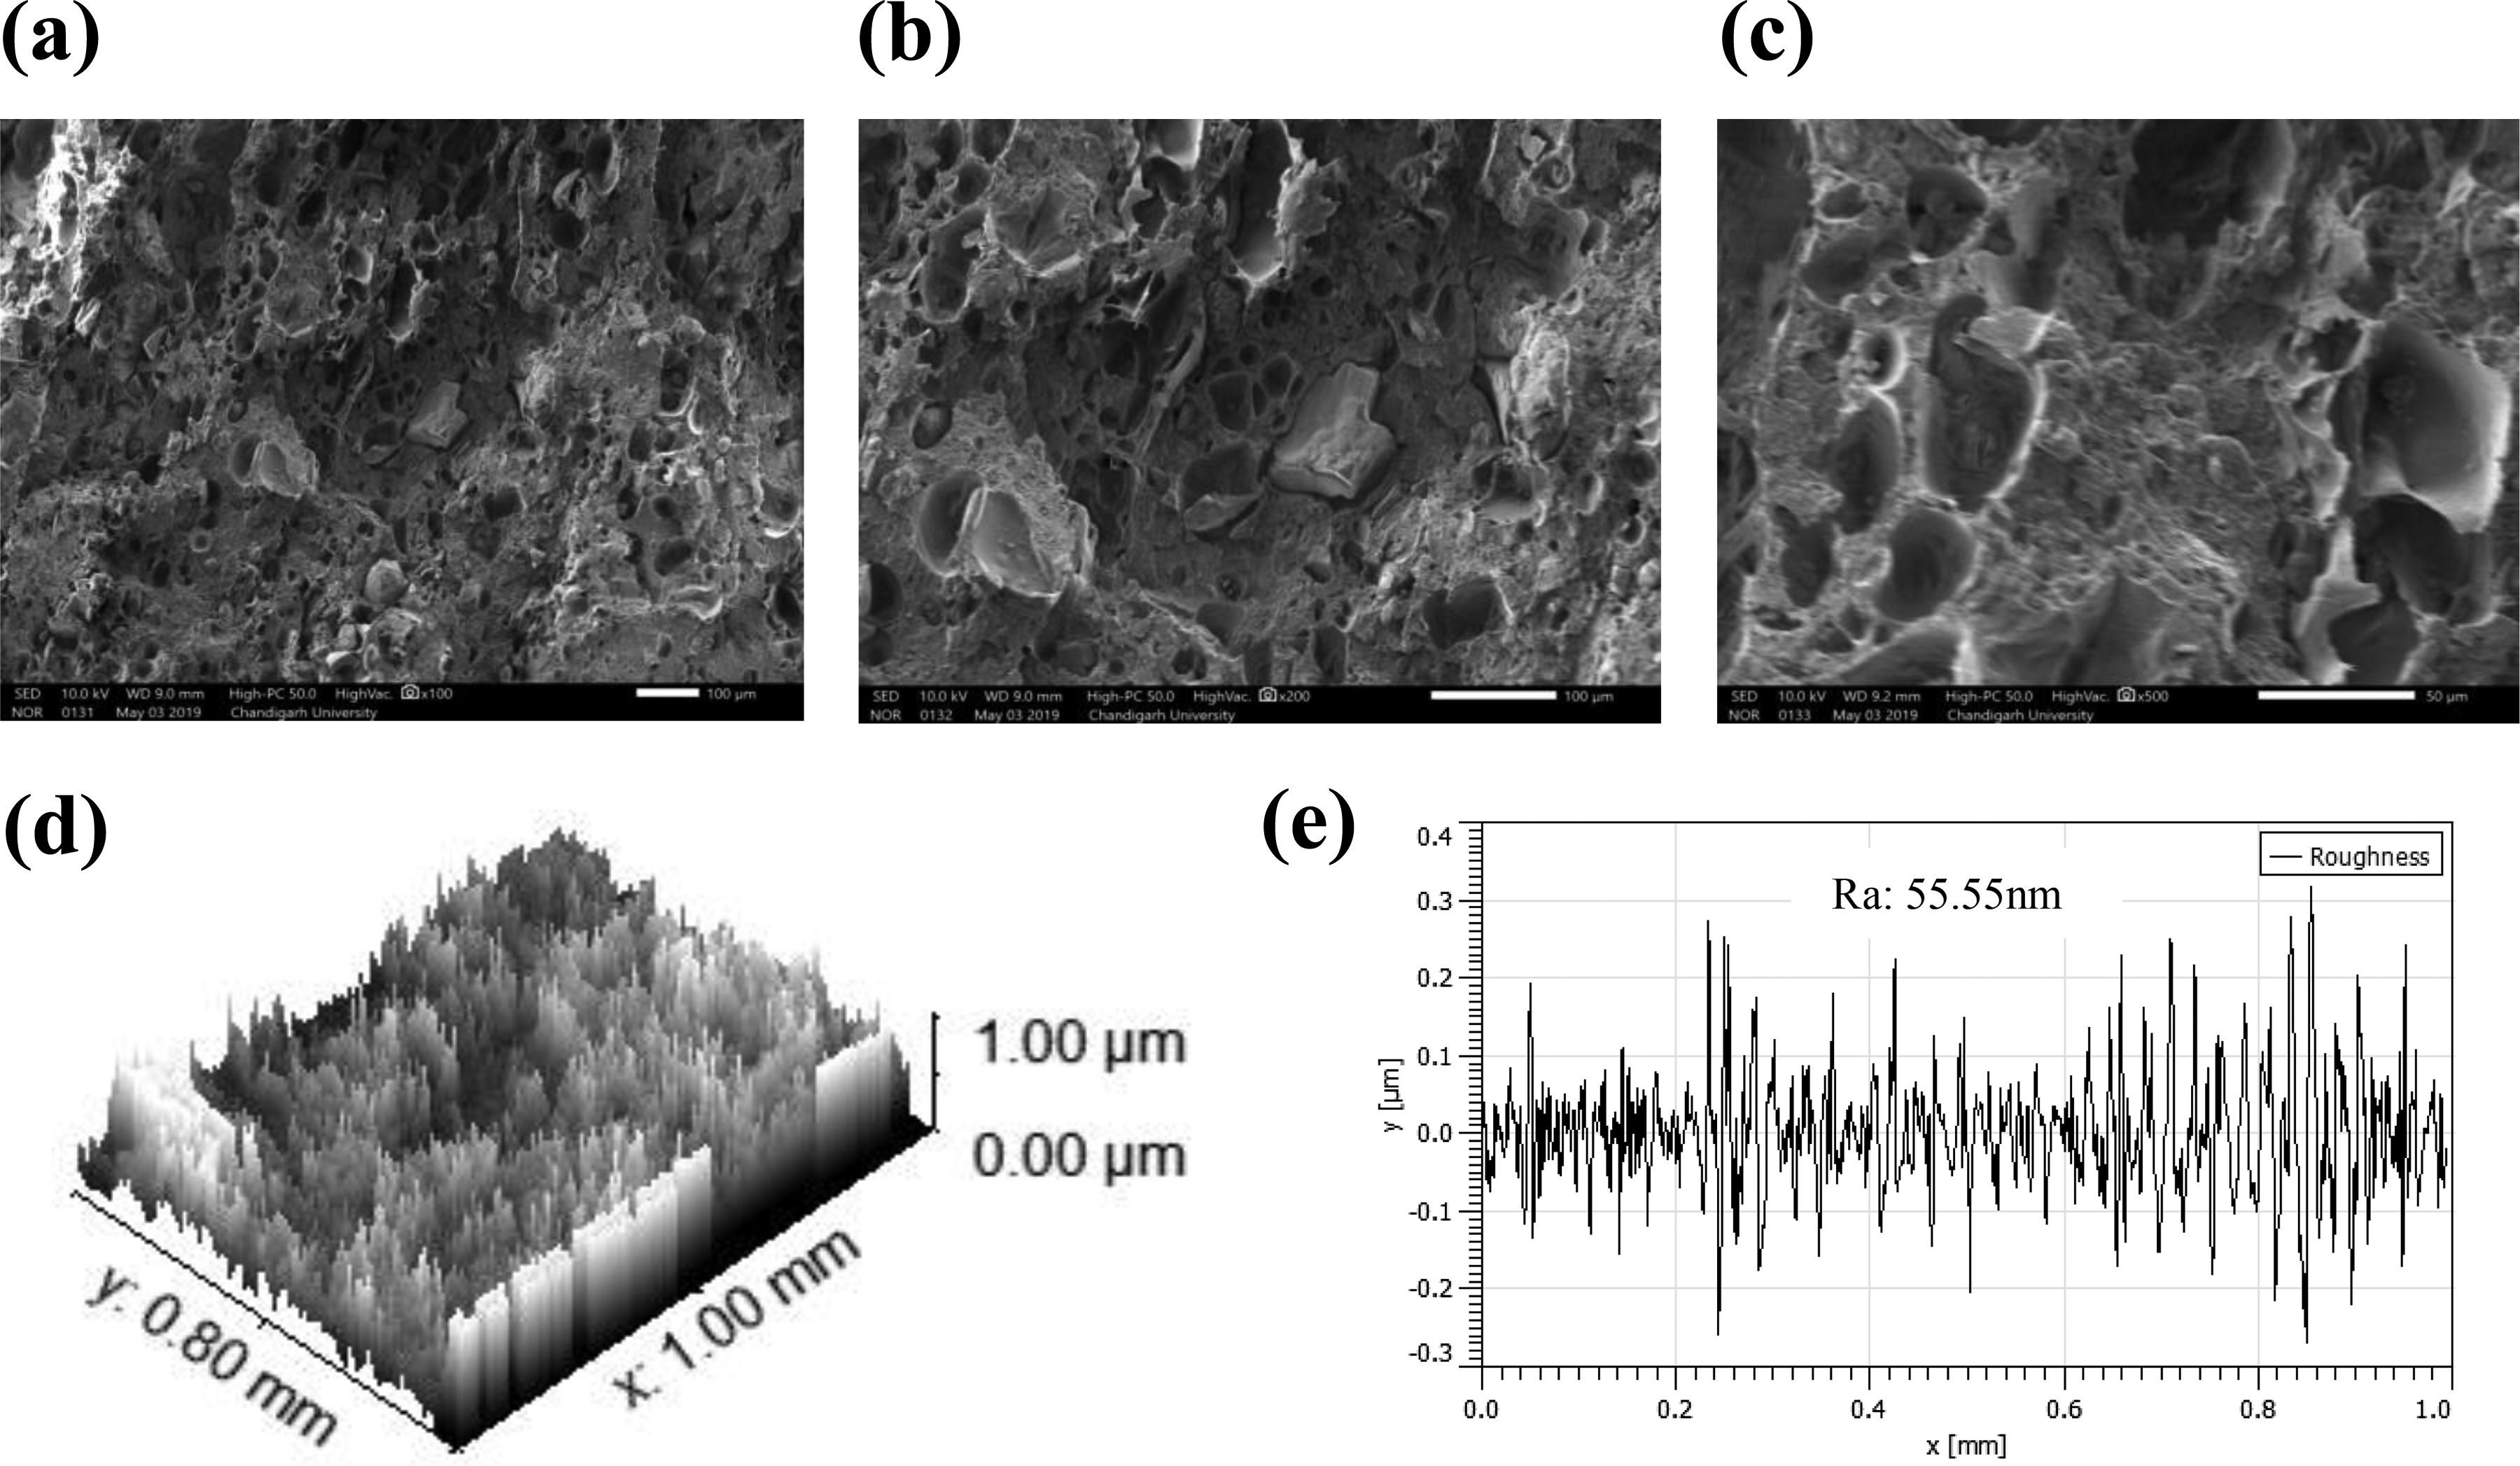
SEM images for sample number 8: (a) SEM image at ×100, (b) SEM image at ×200, (c) SEM image at ×500, (d) rendered 3D SEM image (×100) and (e) surface roughness profile.
SEM images for sample number 1: (a) SEM image at ×100, (b) SEM image at ×200, (c) SEM image at ×500, (d) rendered 3D SEM image (×100) and (e) surface roughness profile.
Based upon observations in Figures 9 and 10 to ascertain the composition/proportion of reinforcement in ABS matrix, energy-dispersive X-ray spectroscopy (EDS) was conducted for sample numbers 8 and 1 (see Figures 11 and 12), which clearly indicate high proportion of ceramic reinforcement in sample number 8.
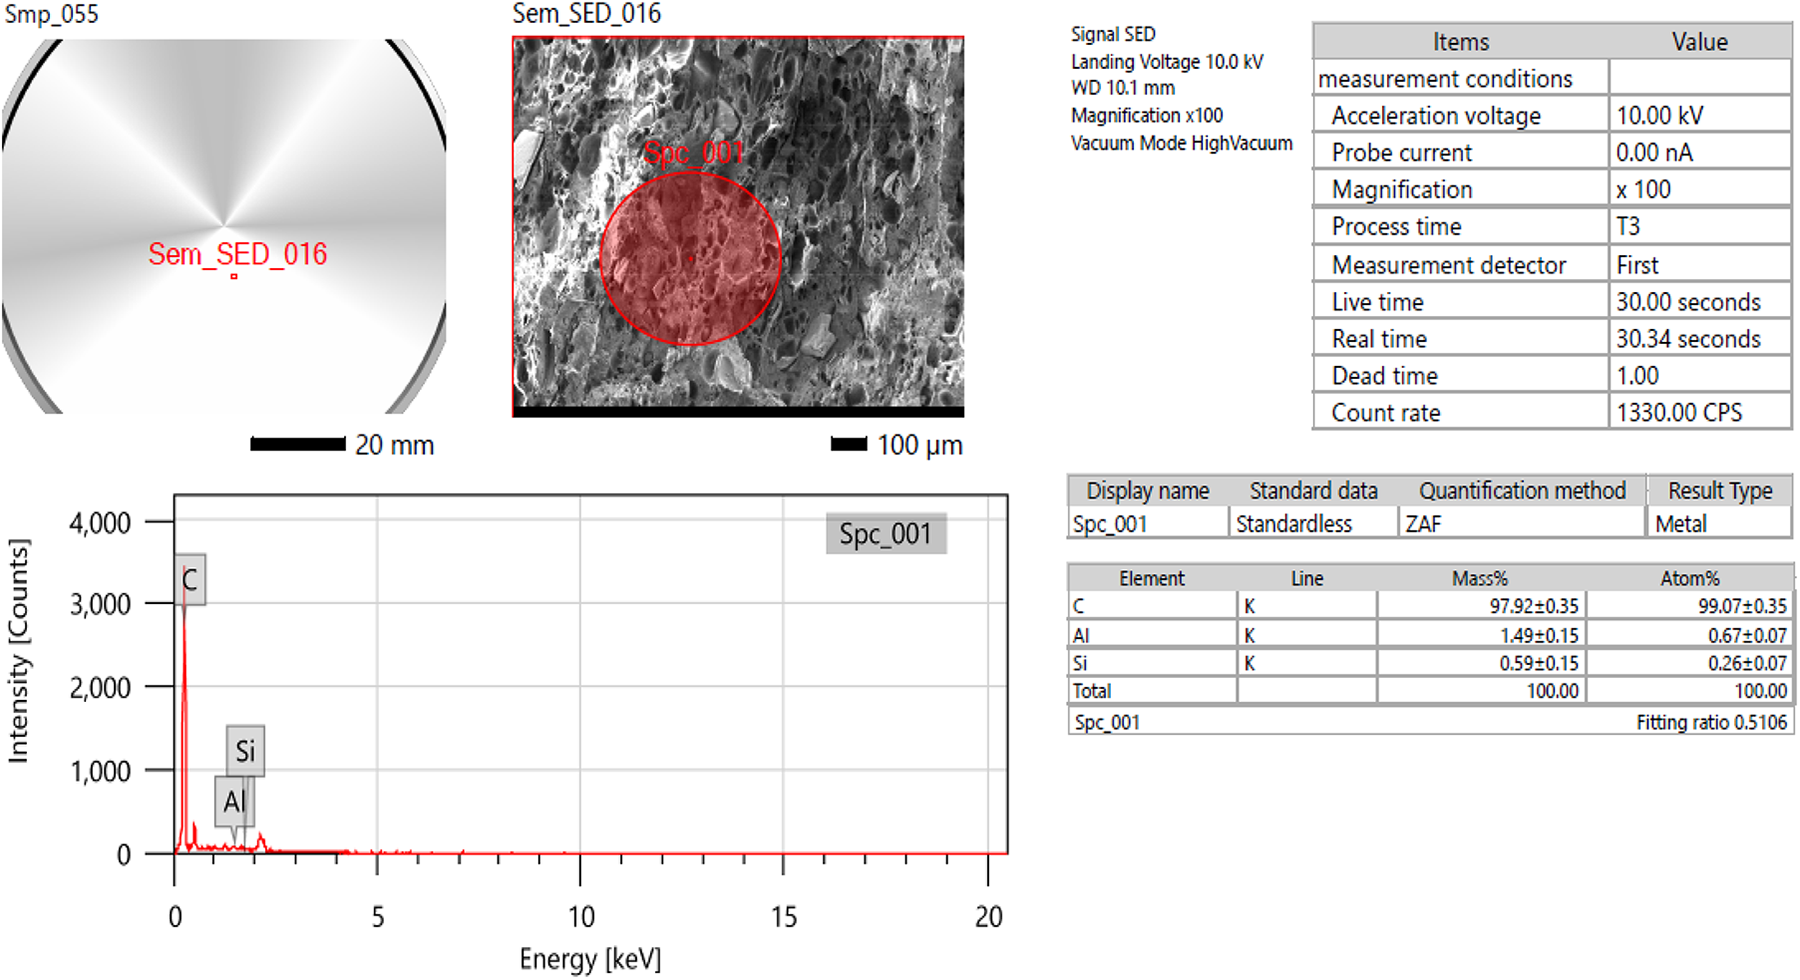
EDS analysis for sample number 8.
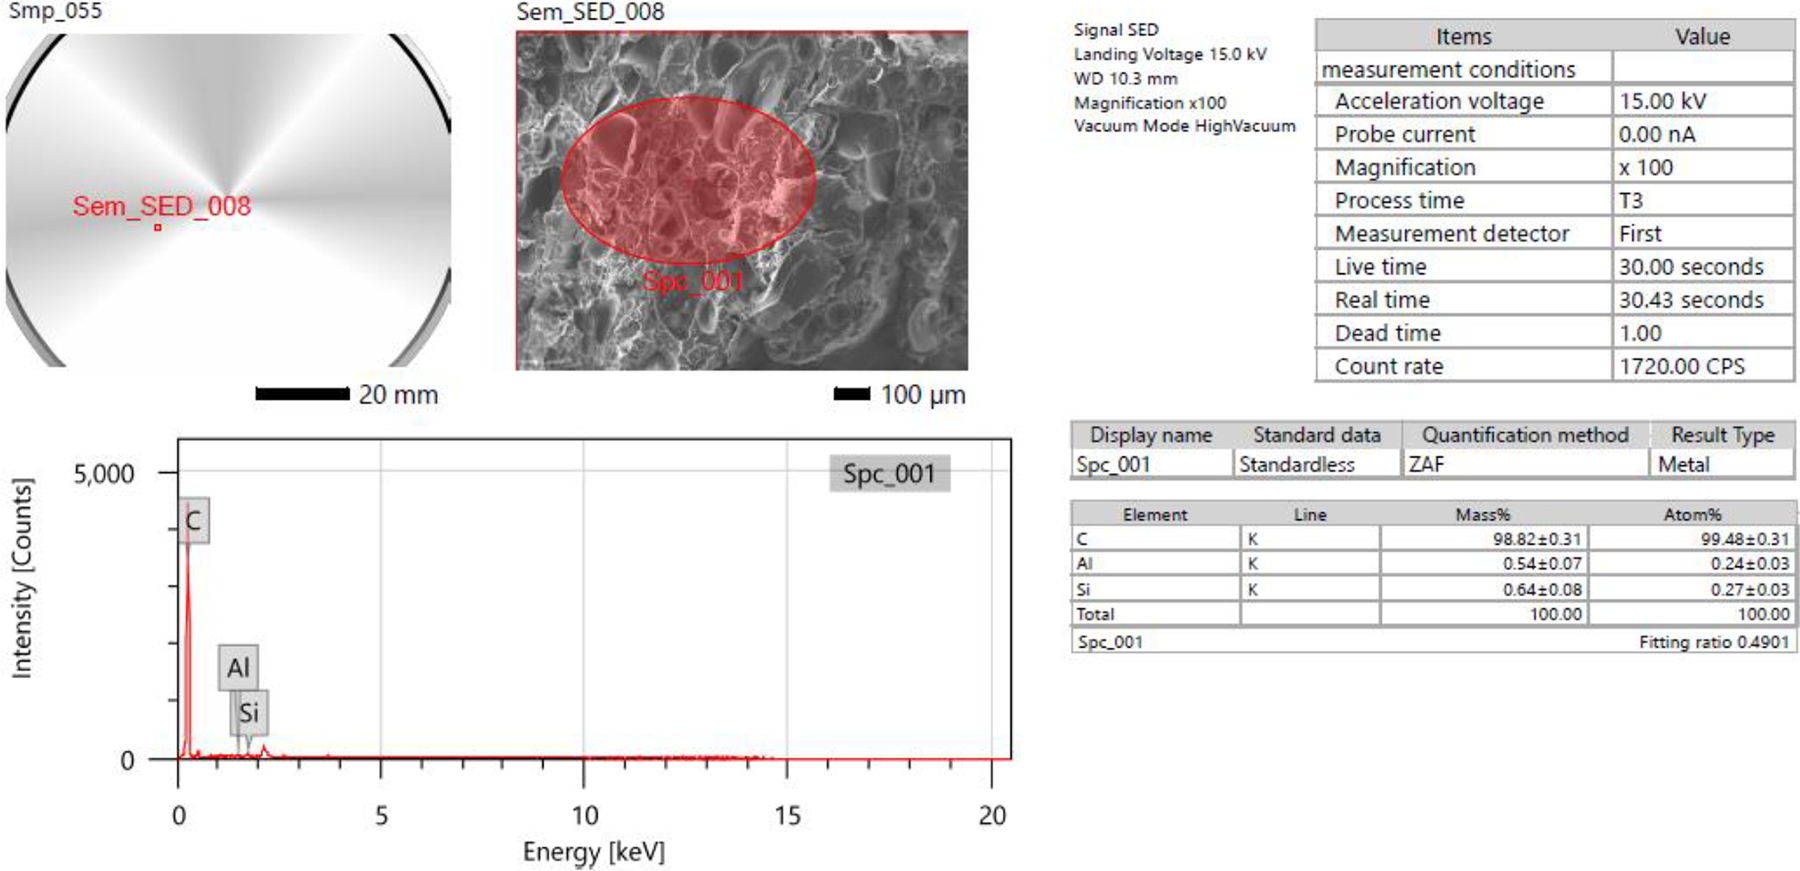
EDS analysis for sample number 1.
Finally for thermal stability analysis, all three compositions/proportions (C1, C2 and C3) were subjected to differential scanning calorimetry test conducted under nitrogen inert atmosphere with a flow rate of 50 ml min−1, maintaining endothermic thermal reaction at 10°C min−1 and exothermic thermal reaction at −10°C min−1 (Figure 13). The results of the thermal analysis show that rise of ceramic proportion in reinforcement has led to increase in heat capacity in the first cycle. For C1 composition (0% ceramic) the heat capacity was 0.63 J g−1, for composition C2 (10% ceramic) the heat capacity was 0.68 J g−1 and for composition C3 (20% ceramic) the heat capacity was 0.77 J g−1. This means that higher proportion of ceramic resulted in more thermal stability in the first heating/cooling cycle. But in the second cycle for all compositions/proportions, heat capacity has been reduced for all compositions/proportions. Also the tendency for thermal deformation of the printed parts in repeated cycles was getting poorer with more ceramic reinforcements. Hence it is ascertained that in repeated cycles, higher ceramic-reinforced thermoplastics should not be subjected to large temperature variations from thermal stability viewpoint.
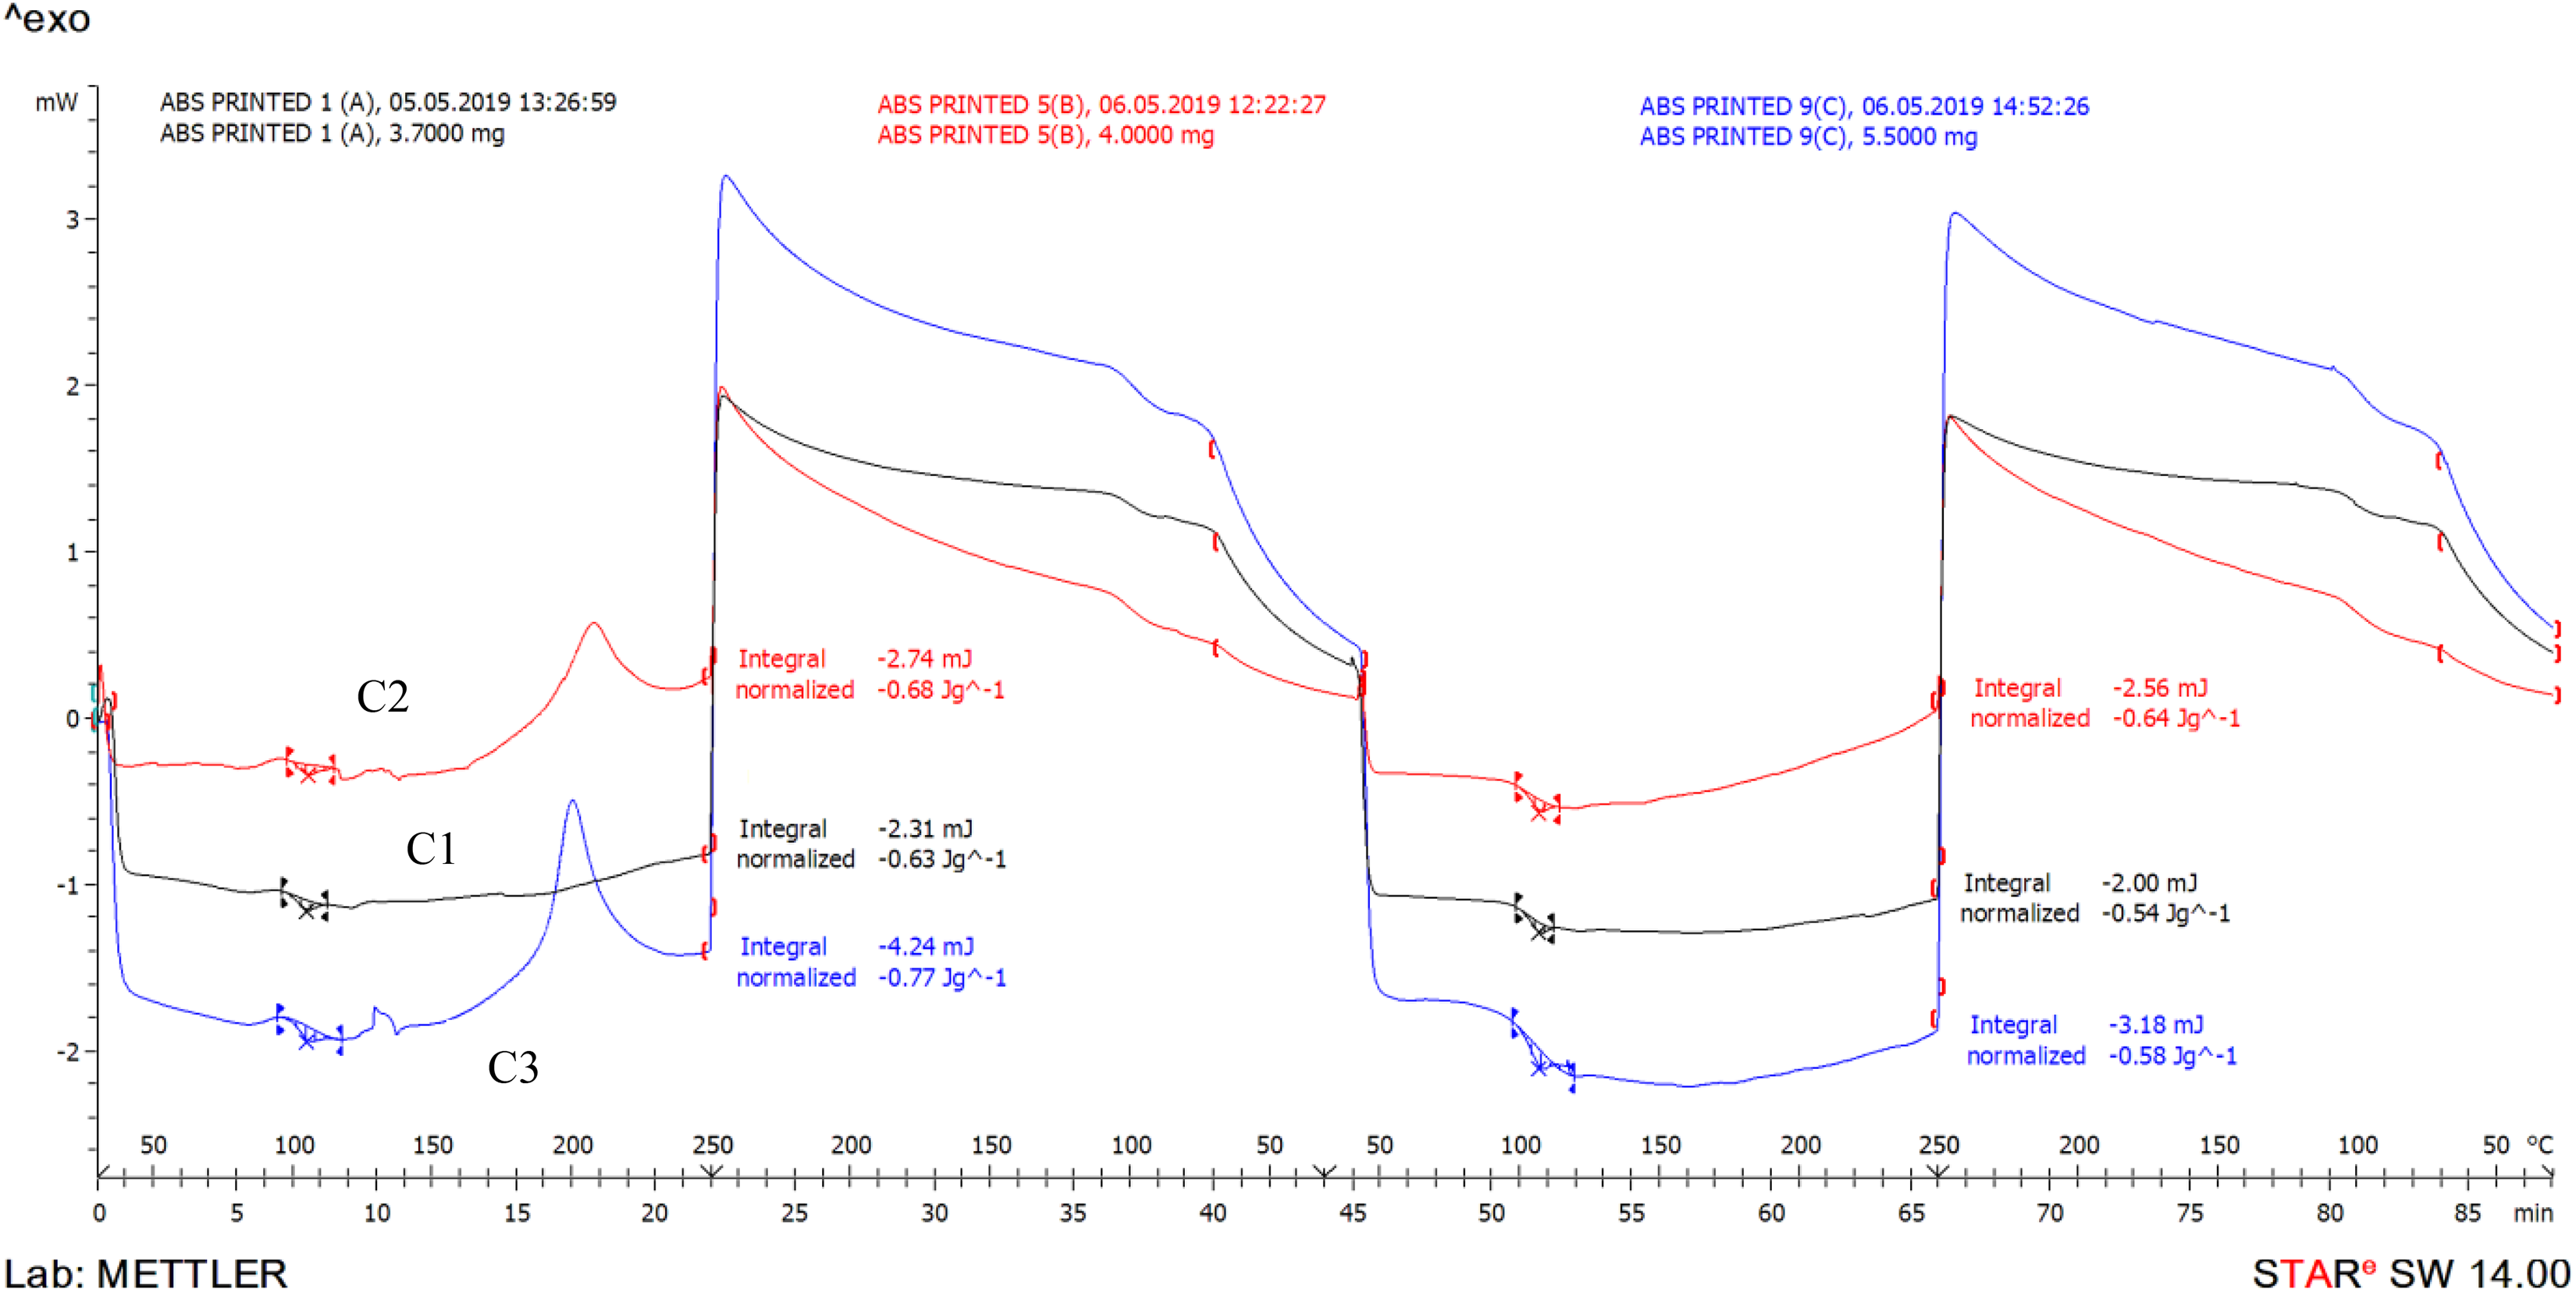
DSC analysis for different compositions/proportions.
Conclusions
Following are the conclusions from this study: The functional prototypes comprising of ABS-BAK-Al2O3-SiC have been successfully 3D printed with improved/at par mechanical properties in comparison to feedstock filament/virgin ABS. However, there was little compromise on thermal stability as after every heating/cooling cycle heat capacity value is reducing marginally. With regard to FDM input parameters from Taguchi optimization viewpoint, 80% infill ratio and 60 mm s−1 infill speed with composition 70%ABS-10%BAK-10%Al2O3-10%SiC are the best settings, whereas from historical data viewpoint, composition is the only significant factor and other input parameters are not significant. So one can select any value from the range available (as per commercial setup) for infill ratio and infill speed. The peak strength of FDM printed parts at proposed setting was observed as 23.21 MPa. It has been observed that sample number 8 with best mechanical properties has relatively less porosity and highest surface hardness. For sample number 8, rendered SEM images and Ra profile outlined formation of more uniform grains (with less Ra value) may be the major reason for better mechanical properties in comparison to sample number 1.
Footnotes
Acknowledgement
The authors are thankful to Manufacturing Research Lab (Department of Production Engineering), Guru Nanak Dev Engineering College, Ludhiana, for providing research facilities.
Funding
The author(s) received no financial support for the research, authorship, and/or publication of this article.