
Abstract
In the structural analysis of automotive products made of lightweight fiber-reinforced thermoplastics (FRT), the primary mechanical requirement is their relation to the orientation states of fibers. The famous Folgar–Tucker equation of fiber orientation has hitherto been used to predict the skin–shell–core structure of fiber orientation patterns for injection-molded fiber composites. However, this model results in inaccurate predictions regarding the thinner core width. To enhance the reliability of fiber orientation predictions, Tucker and coworkers rigorously derived the reduced strain closure and anisotropic rotary diffusion (ARD) models in relation to the theoretical rheology of fiber suspension. More recently, the improved ARD and retarding principal rate model and the Moldflow rotational diffusion model were developed and made available in the industry dealing with the state-of-the-art software of injection molding simulation. A deep understanding of these fiber models is important for achieving successful FRT structural analysis. In this work, we therefore investigate the accuracy of these fiber orientation models, as well as the changes in fiber orientation distribution related to model parameters and model objectivity.
Keywords
Introduction
For automotive products made of lightweight materials of fiber-reinforced thermoplastics (FRT) with advantageous weight reduction and economical fuel consumption, the orientation states of their fibers strongly affect their mechanical properties. Most industrial reports 1,2 indicate that accurate prediction is a critical requirement in seeking to estimate the mechanical properties as well as to simulate structural analysis, especially for FRT parts. State-of-the-art software of injection molding simulation has counted on the famous Folgar–Tucker equation to predict fiber orientation distribution with the skin–shell–core structure pattern. 3 However, there remains the problem of inaccurate predictions of narrow core width compared to actual experimental observation. 4
To correct this problem, Wang et al. 5 used a strain reduction factor (SRF) proposed by Tucker and Huynh to slow down the eigenvalue rate of fiber orientation tensor, thereby obtaining the reduced strain closure (RSC) model. In addition, Phelps and Tucker 6 proposed a two-dimensional (2-D) diffusion tensor defined in surface spherical coordinates to derive the exact form of an anisotropic rotary diffusion (ARD) model developed by Phan-Thien et al. 7 Both the RSC and RSC-ARD models are available for short and long fiber composites, respectively. It is noteworthy that the inlet condition strongly influences the prediction of the RSC and ARD-RSC models. 8 Unfortunately, determining how to derive reliable inlet conditions for a variety of runners and gates is not easy when dealing with complex geometric parts. In addition, the six-parameter ARD-RSC model can cause numerical instability or nonphysical behaviors in the computing process if the excess parameters are not carefully adjusted. 7 To improve the accuracy of 3-D orientation predictions for Autodesk Moldflow Inflow, Bakharev et al. 9 more recently proposed a new model, Moldflow rotational diffusion (MRD), 10 based on both the Folgar–Tucker model and the ARD model.
Regarding the flaws of the RSC and ARD-RSC models, Tseng et al. developed an improved ARD (iARD) model 11 along with a new retarding principal rate (RPR) model. 12,13 The iARD-RPR model can restore the standard Folgar–Tucker model, while the RPR model 13 has been demonstrated to be identical to the RSC model. The iARD-RPR model has been useful not only for predicting the skin–shell–core structure, but also in discussing the core width with respect to operation conditions, 14 mold geometries, 14 long/short fibers, 15 carbon/glass fibers, 15 and low/high fiber concentration, 16 as well as effect of the packing stage on fiber orientation. 17 The iARD-RPR model’s application value for allowing good orientation predictions has been virtually authenticated in the long carbon-fiber composite project of the Oak Ridge National Laboratory in the United States. 1,2 In addition, it is significant to validate that the three-parameter iARD-RPR model for the predictive accuracy and high availability obviously enhanced the six-parameter ARD-RSC model. 18
The classic Folgar–Tucker model and the recent models (RSC, ARD, MRD, and iARD-RPR) have been incorporated into the state-of-the-art software of injection molding simulation: Moldflow and Moldex3D. So far, few researchers have attempted to compare these fiber orientation models. Therefore, the primary aim of this study is to investigate the numerical accuracy and rheological objectivity of the fiber orientation predictions, as well as the relationships between the skin–shell–core structure and the model parameters.
Theoretical orientation models
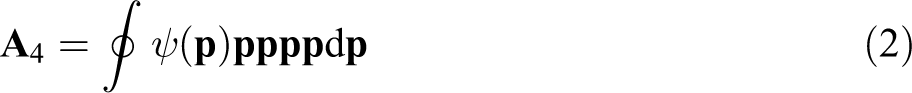
Advani and Tucker 19 defined the second-order orientation tensor as
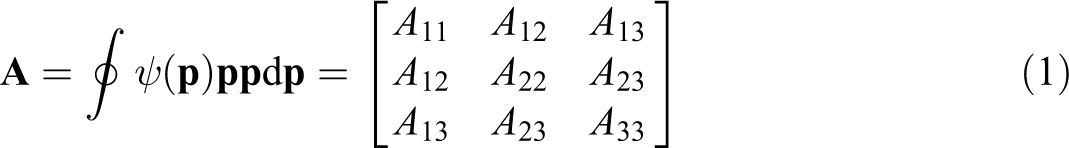
wherein a single fiber is regarded as a rigid cylindrical rod and its unit vector
Orientation tensor
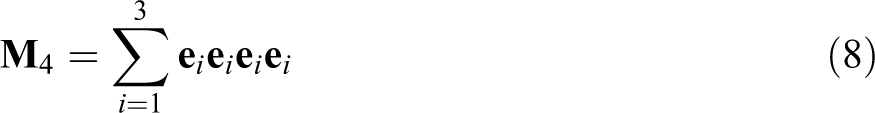
The
A time-evolution equation of the second-order orientation tensor is fixed on the material derivative, denoted as
Following these fiber orientation models, Tseng et al. further developed a new fiber orientation model, namely, iARD-RPR with just three physical meaning parameters. 11 –13,24 The iARD-RPR has been a primary model in the commercial injection molding simulation software, Moldex3D (CoreTech System Co. of Taiwan). More recently, Bakharev et al. also proposed the MRD model as a new default fiber orientation model for 3-D numerical computation in another commercial software, Autodesk Moldflow Insight.
Folgar–Tucker model
The famous Folgar–Tucker equation involves both terms: the Jeffery hydrodynamic (HD) contributor


where
RSC model and ARD-RSC model
However, the Folgar–Tucker model has an inaccurate prediction with the faster response rate of fiber orientation than experimental observation. Thereby, Wang et al. 5 developed the RSC model to slow down such a response rate
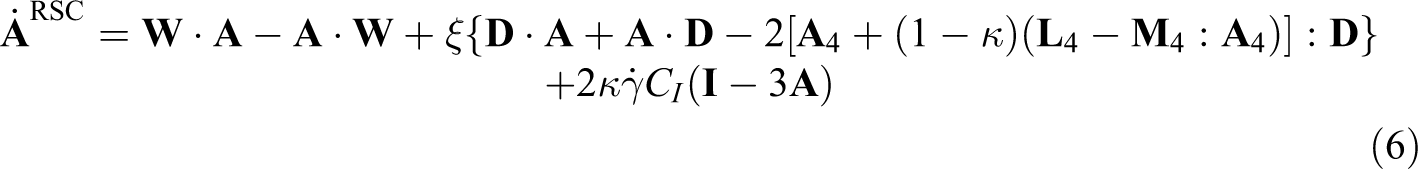
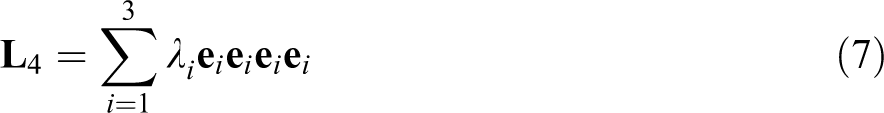
where the factor κ constrained between 0 and 1 is a slow-down factor fit by experimental data and generally suggested in a range of 0.05–0.2. When κ = 1, the RSC equation can restore to the standard Folgar–Tucker equation. λi and
Previously, Phan-Thien et al.
7
proposed the Folgar–Tucker isotropic rotary constant CI
extend to an anisotropic rotary (ARD) tensor


However, anisotropic rotary tensor

where the parameters
In addition, the ARD model is coupled with the RSC model as ARD-RSC, as below
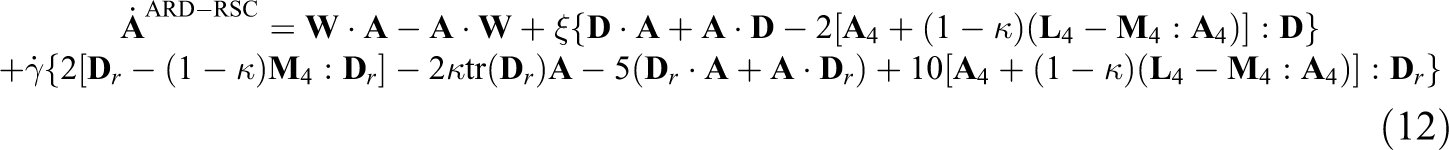
Both RSC and ARD-RSC models have been incorporated into commercial injection molding simulation software, Autodesk Moldflow Insight (AMI). Two RSC parameters (CI
and κ) and six ARD-RSC parameters (
iARD-RPR model
As following previous fiber orientation models of Tucker and coworkers, 5,6,19,23 Tseng et al. developed the iARD-RPR, 12,13 which contains three terms

First, the Jeffery hydrodynamic term

where the tensor
Eventually, the RPR model is introduced as


where
The iARD-RPR model has only three physical parameters: a fiber–fiber interaction parameter CI
, a fiber–matrix interaction parameter CM
, and a slow-down parameter α. The available region of these three normalized parameters is suggested in: 0 < CI
< 1, 0 < CM
< 1, 0 < α < 1. When setting CM
= 0, the iARD-RPR model with α = 0 and
MRD model
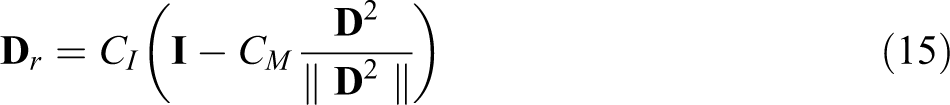
To improve the accuracy of 3-D orientation prediction for Autodesk Moldflow Insight, 10 Bakharev et al. 9 propose a new model, MRD, which is similar to the Folgar–Tucker model and the ARD model


where the tensor
Results and discussion
Based on previous studies of Wonisch and Wüst 25 and Tseng et al., 16 commercial BASF (Ludwigshafen, Germany) composites were used in this work: 35 wt% short glass fiber-reinforced Polyamide66 (SGF/PA66) with the grade name Ultramid A3WG7. The geometry of injection molding parts was designed as a 150 × 150 × 3 mm3 plate, as shown in Figure 1. The molten plastic injected from the injector nozzle traverses a runner and a gate, and fills up the cavity. For the processing conditions, the filling time and filling rate were 1.8 s and 56 cm3/s, respectively. In addition, the mold and melting temperatures were set at 85°C and 290°C, respectively.
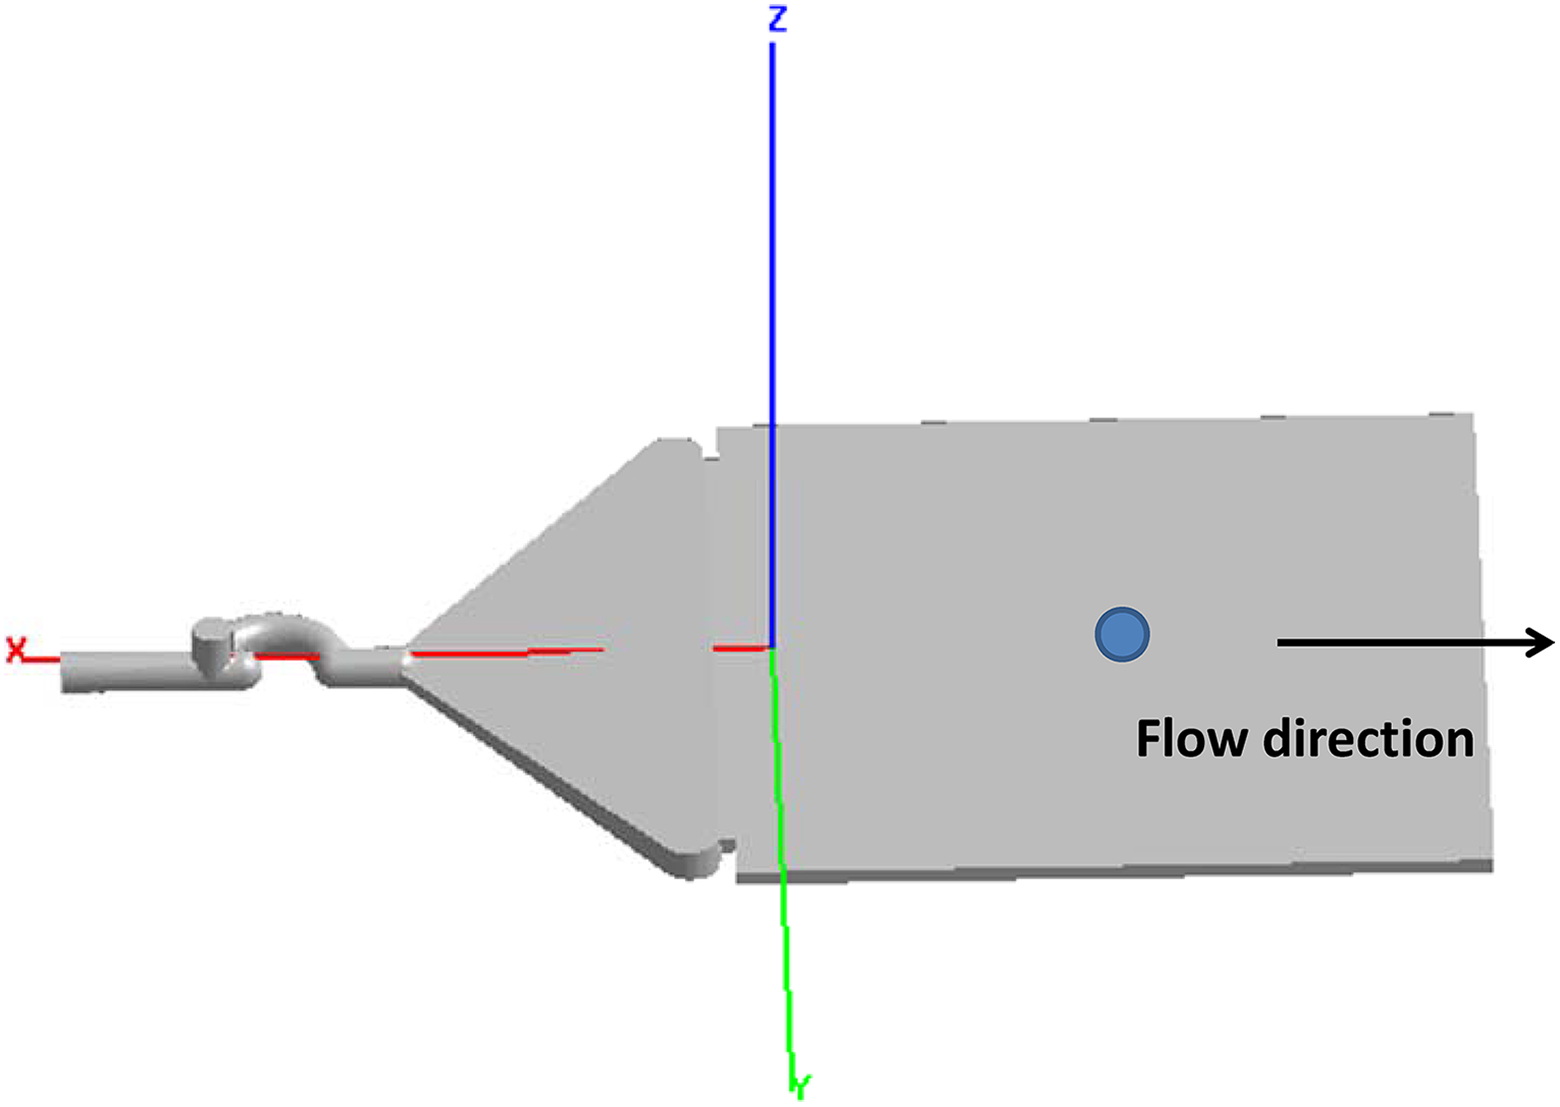
Illustration of the end-gated plate (150 × 150 × 3 mm3).
In this plate, one center location of the gap-wise fiber orientation distribution across the thickness was measured using the micro-computed tomography (micro-CT) scan method. 26 The size of the micro-CT specimen was about 3.0 × 3.0 × 3.0 mm3. In reference to the previous work of Wonisch and Wüst, 25 the micro-CT images were evaluated to obtain a digital continuous curve of the fiber orientation tensor components as a function of the thickness. From the micro-CT analysis, the number-averaged fiber length and diameter were about 200 µm and 10 µm, respectively.
Figure 2 shows the CT slice image across the part’s thickness cuts perpendicular to the main flow direction; observing the five-layer laminated structure of the fiber orientation distribution, skin–shell–core–shell–skin, yields significant results. 3 In the shell plateau, the fibers were strongly aligned along the main flow direction by the shear deformations; others were weakly oriented in the core region. The shell–core interface was found to be a slope of fiber orientation increasing from the core region to the shell plateau. The skin boundary indicates a decrease in fiber orientation, as the fibers at the front were influenced by the fountain flow and fiber–wall interaction.
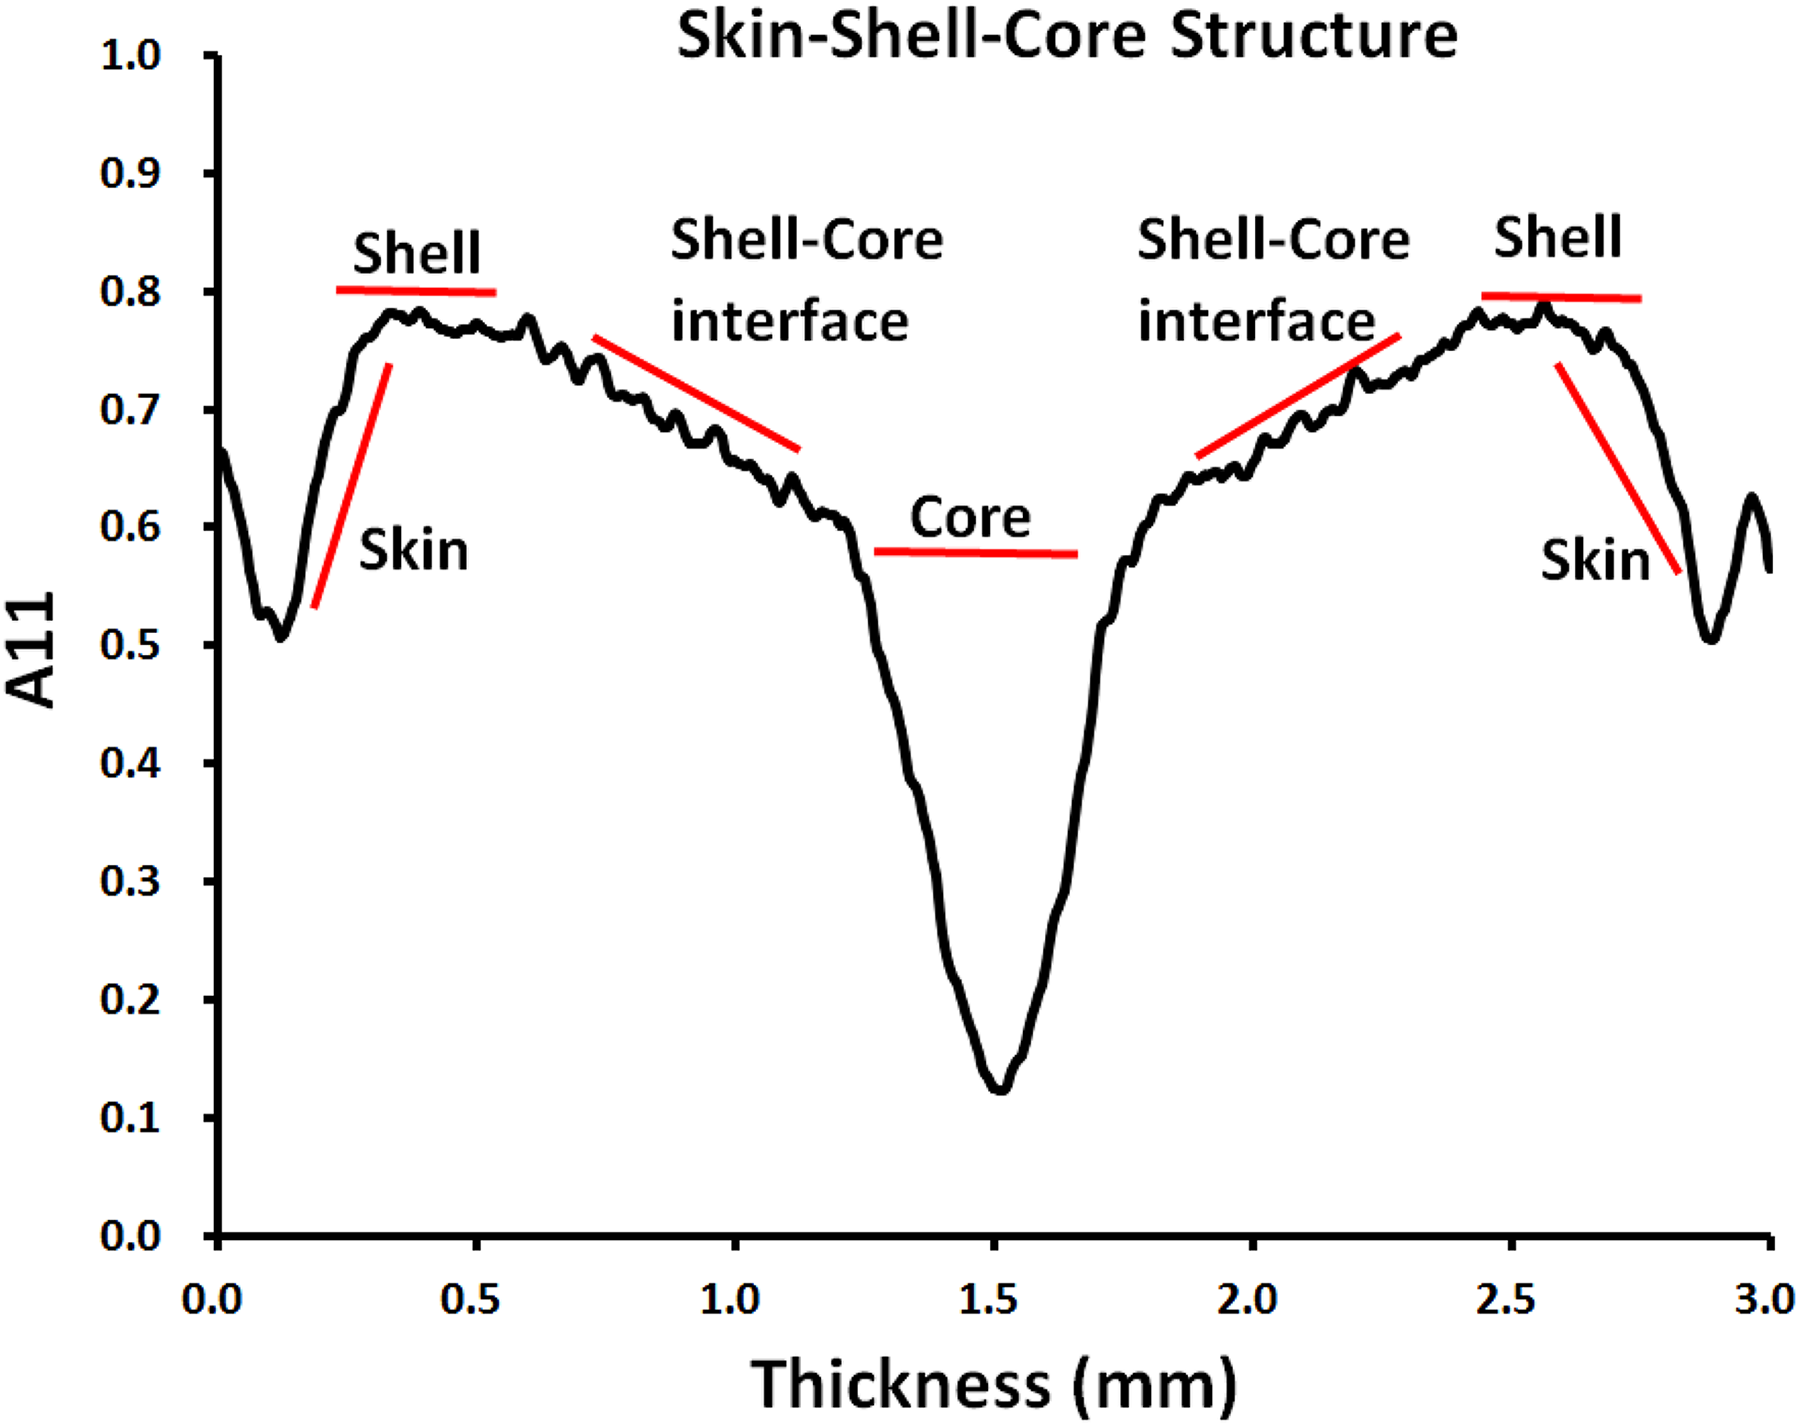
The experimental flow orientation component A 11 distribution through the thickness.
Herein, the commercial injection molding simulation software, Moldex3D, was adopted to perform the 3-D injection molding simulation and fiber orientation predictions. We used the hexagonal element to model the plaque. The initial orientation condition at the runner entrance was set as the isotropic state. It was unnecessary to provide an inlet condition of the experimental fiber orientation distribution set around a gate due to the higher 3-D numerical resolution and the solid runner system’s considerations in the computation. The material properties of 35 wt% SGF/PA66, including the shear viscosity flow curve, pressure–volume–temperature diagram, specific heat and thermal conductivity, can be referred to elsewhere. 27 The primary objective of this work was to compare the recent fiber orientation models incorporated into state-of-the-art predictive engineering tools of injection molding simulation, including the Folgar–Tucker, iARD-RPR, and MRD models. Note that Moldex3D does not provide the RSC model and ARD-RSC model because a US Patent on the RSC model is held by Tucker et al., 28 and Autodesk holds an exclusive license for use of the RSC model. Thus, the RSC and ARD-RSC models were not involved herein. In particular, the RPR model of Tseng et al. 13 has been demonstrated to be identical to the RSC model. As a whole, the three-parameter iARD-RPR model for the predictive accuracy and high availability was validated to effectively improve the six-parameter ARD-RSC model. 1,2,18 In this work, the significant discussions are on investigating changes in fiber orientation distribution with model parameters. In addition, an examination of the rheological objectivity of the fiber orientation models, namely that the fiber orientation distribution given at different global coordinate systems, only yielded one principal result; when many answers occur, such a fiber model is called a nonobjective model.
Folgar–Tucker model
According to equations (3) to (5), the standard Folgar–Tucker equation only has the fiber–fiber interaction parameter attached; CI was used to predict fiber orientation. Figure 3 shows the flow-direction orientation A 11 distribution at different values of parameter CI = 0.0005–0.02. Smaller CI = 0.0005 results in a higher degree of fiber orientation in the shell layers and the broader core region; when parameter CI is increased from 0.001 to 0.02, the core width is narrow and the shell height has clearly fallen. Thus, while the Folgar–Tucker model had satisfactory results in the shell layer, significant deviation still occurred in the core region, shell–core interface, and skin boundary. Evidently, the standard Folgar–Tucker equation cannot completely predict the practical fiber orientation distribution of the skin–shell–core structure.
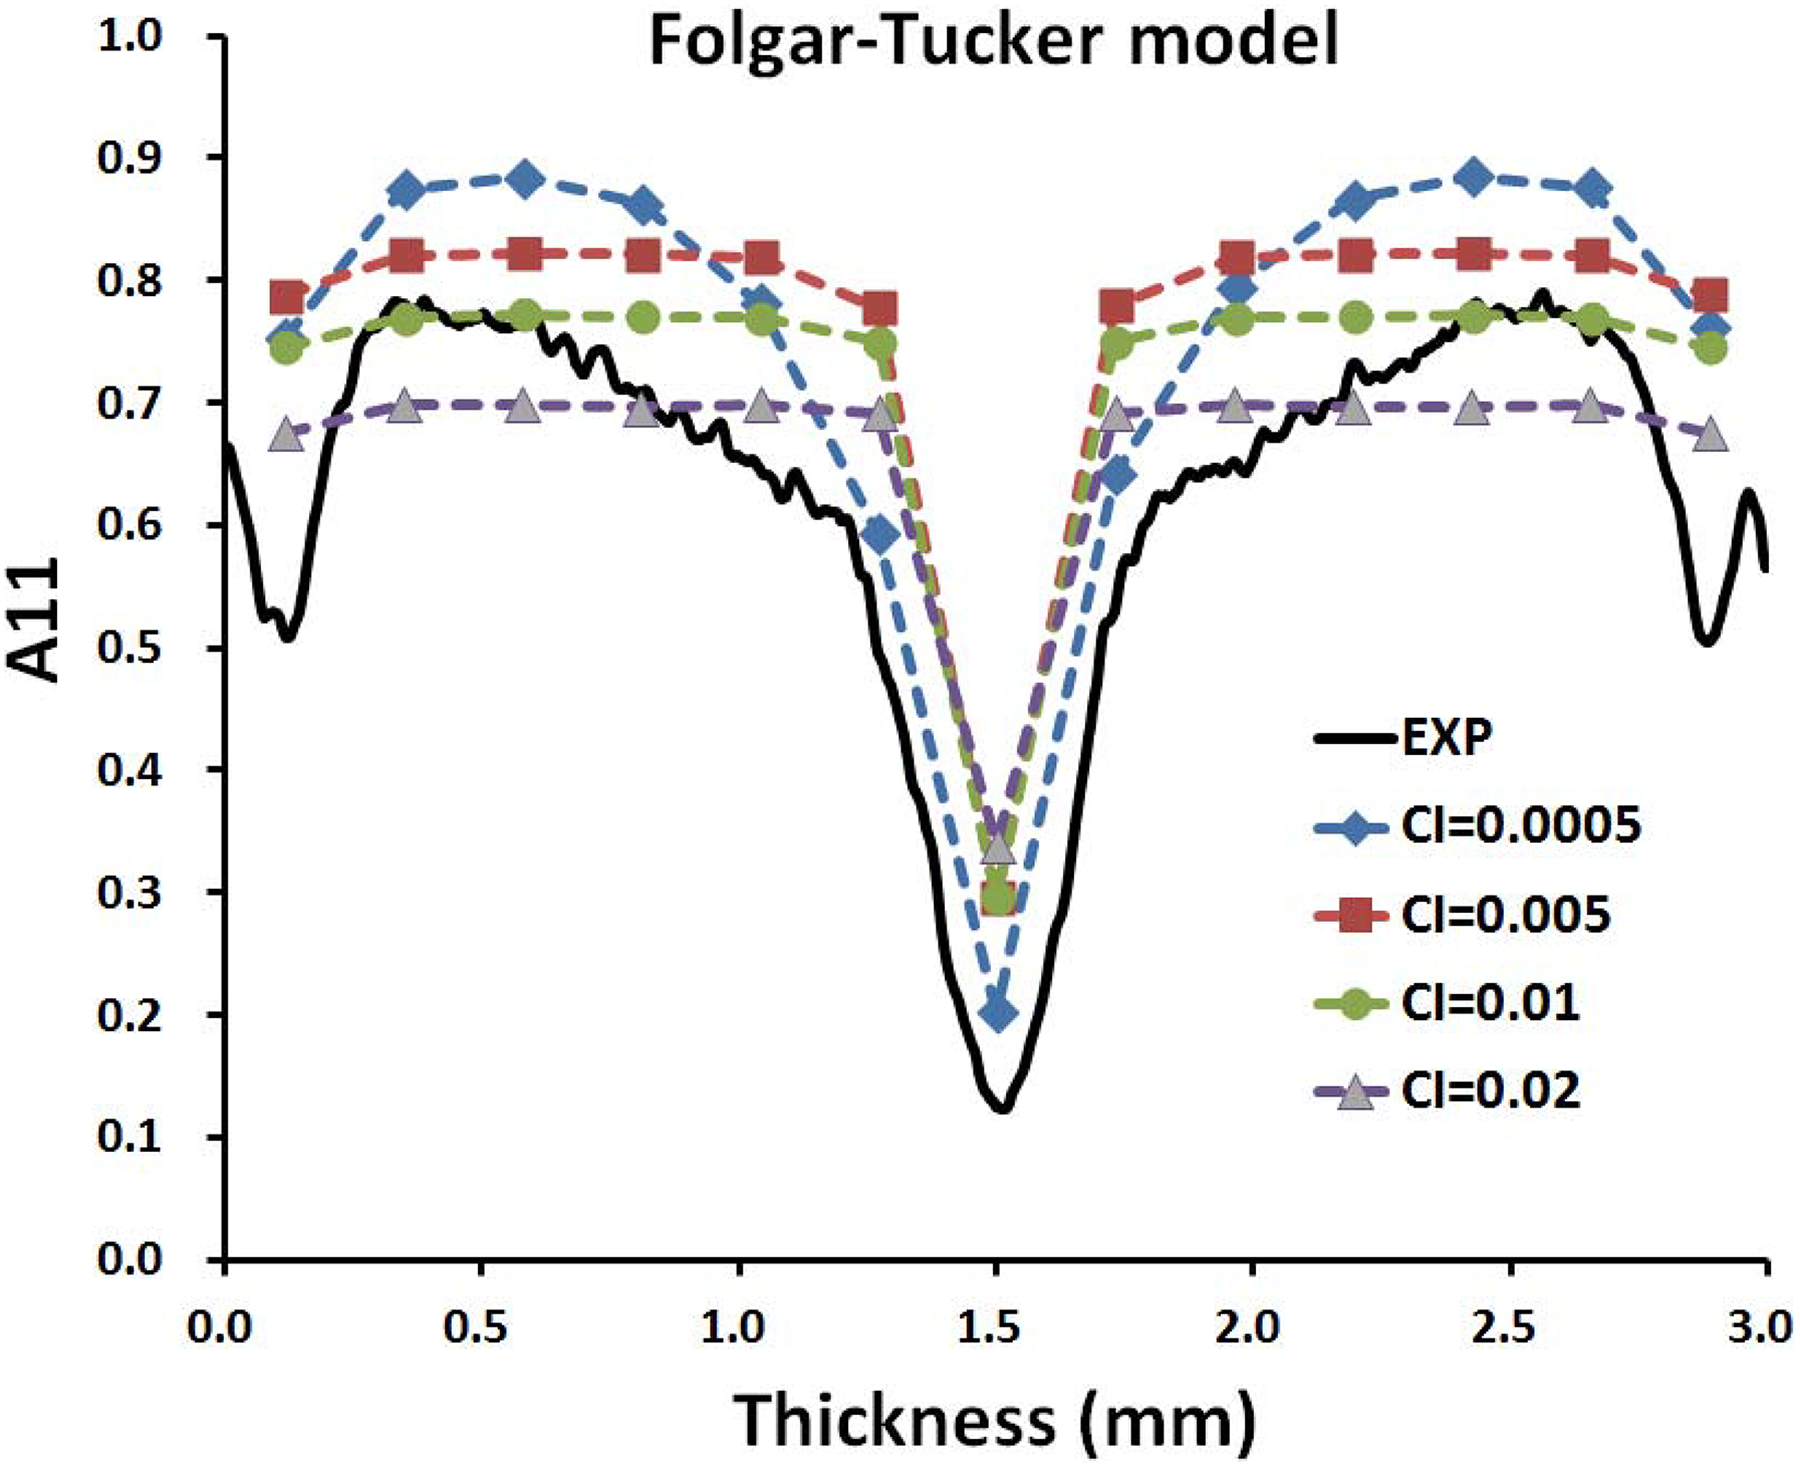
The predicted curves and experimental data of flow-direction orientation tensor component distributions through the normalized thickness for the Folgar–Tucker model at different values of parameter CI .
For a rheological tensor, the classic rheological rule of Euclidean objectivity importantly indicates material frame indifference, namely that different coordinate systems yield only one answer. A nonobjective model exhibiting different results at different coordinates is not a good one. To investigate the rheological objectivity of the Folgar–Tucker model, we attempted to change the x-axis flow direction of the injection molding plate rotated to y-axis and z-axis. Figure 4 shows the flow-direction orientation A 11 distribution at different coordinates of flow direction for the Folgar–Tucker model with CI = 0.01, where x-flow, y-flow, and z-flow signify flow direction along the x-axis, y-axis, and z-axis, respectively. As a result, different coordinate systems obtain almost the same answer. Thus, the Folgar–Tucker model is objective.
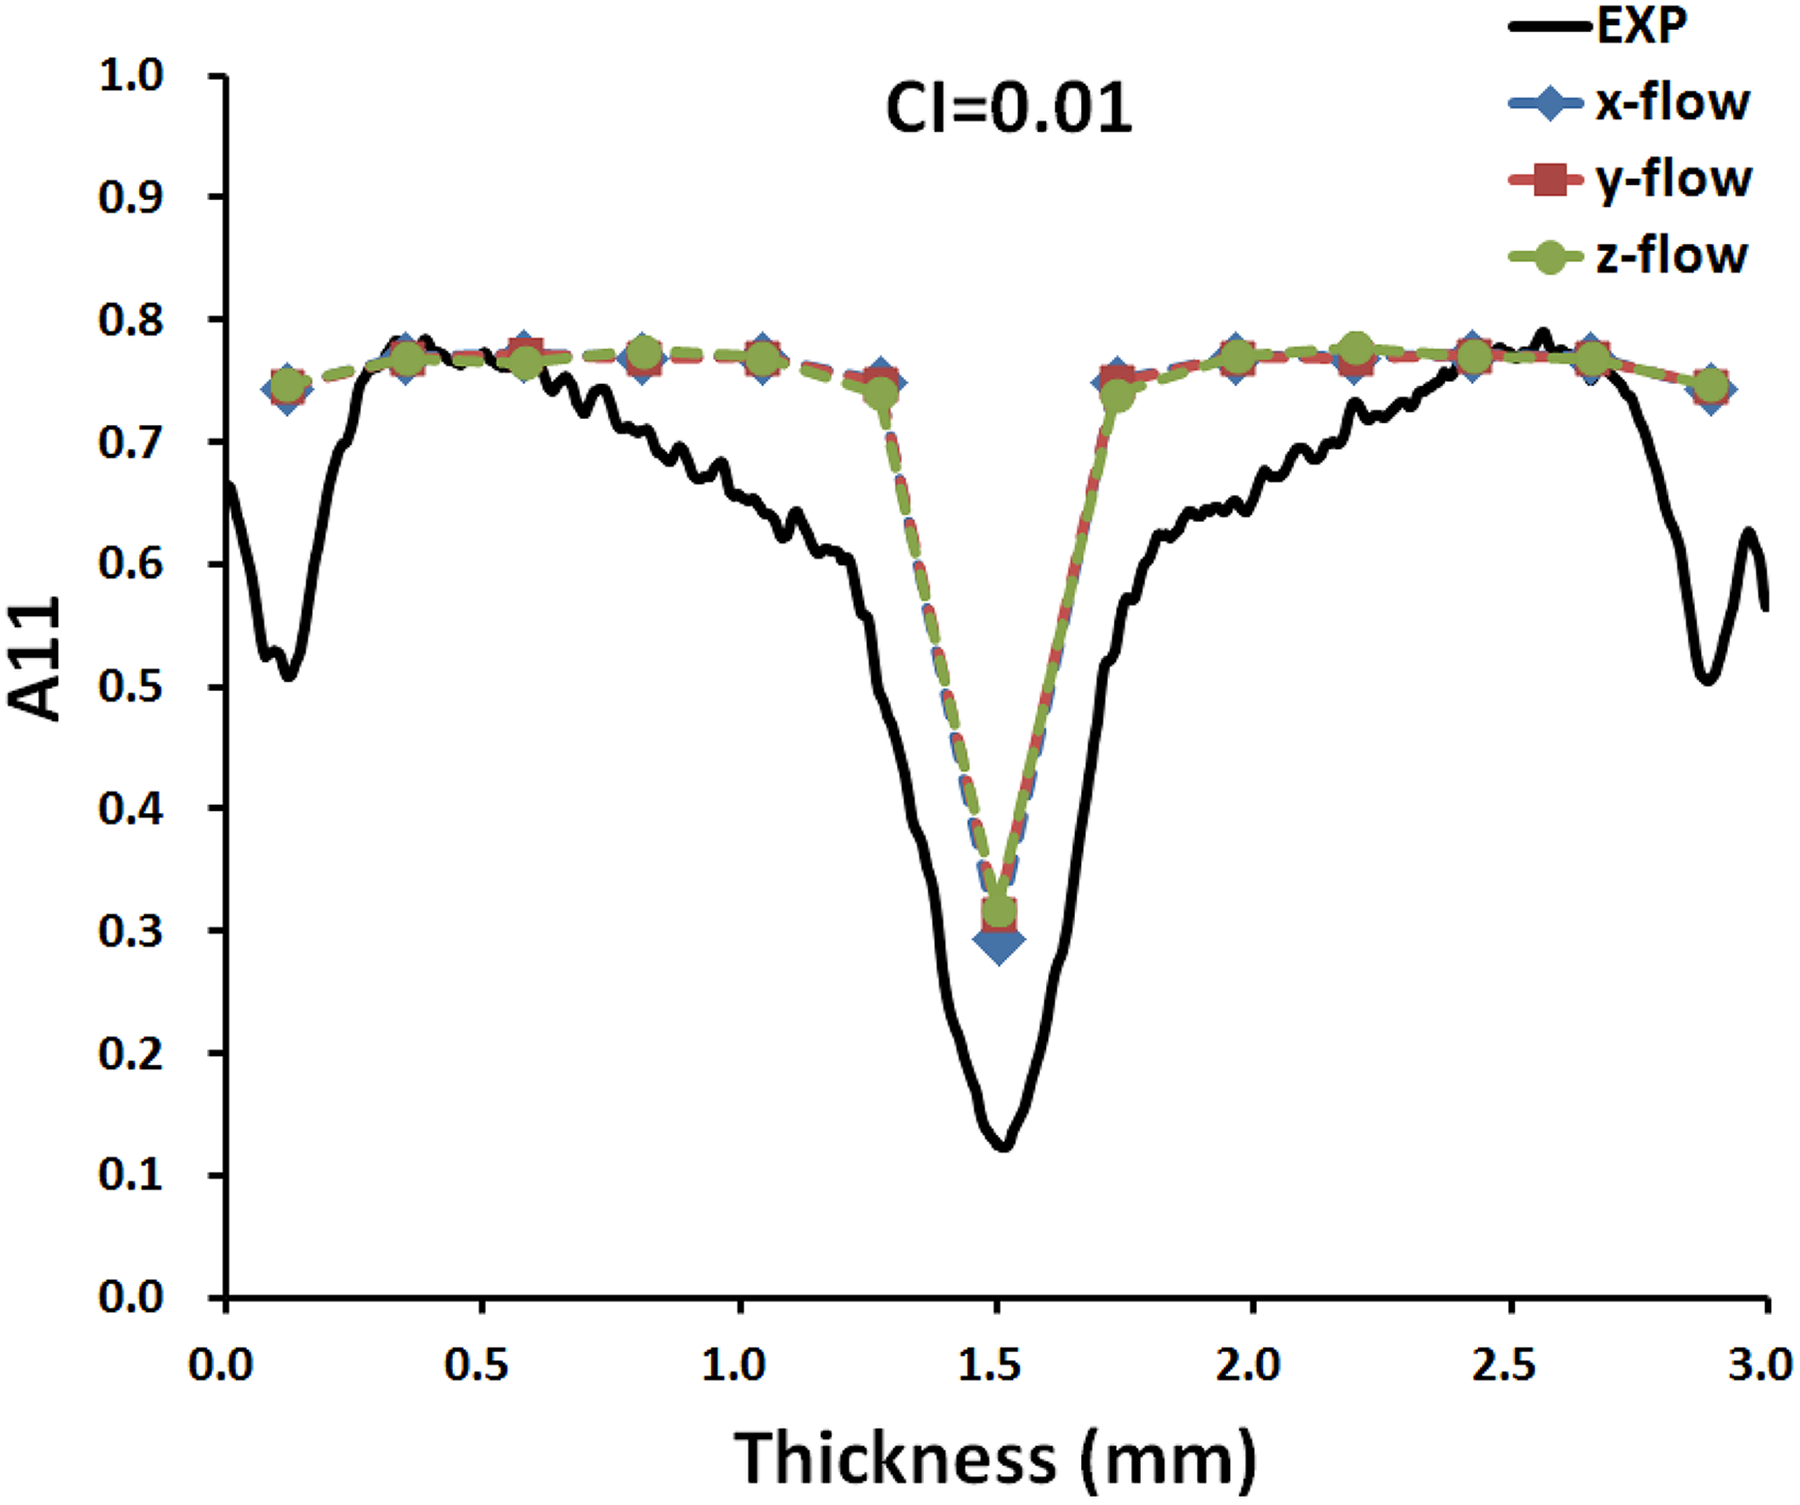
The predicted curves and experimental data of flow-direction orientation tensor component distributions through the normalized thickness for the Folgar–Tucker model parameter CI = 0.01 at different coordinates of flow direction.
iARD-RPR model
In the subsection “iARD-RPR model” under the “Theoretical Orientation Models” section, the iARD-RPR model contained three physical parameters: a fiber–fiber interaction parameter CI , a fiber–matrix interaction parameter CM , and a slow-down parameter α. The available region of these three normalized parameters is suggested in: 0 < CI < 1, 0 <CM < 1, 0 < α < 1. Note that the iARD-RPR model can restore the standard Folgar–Tucker model when setting CM = 0 and α = 0. For the fiber orientation distribution predicted by the iARD-RPR model, the shell height changes with the fiber–fiber interaction parameter CI ; this is the same result as that derived by the Folgar–Tucker model: the shell height is raised by decreasing the CI value, as shown in Figure 3.
In addition, we examined the flow-direction orientation A 11 distribution at different CM values (CM = 0.0, 0.5, 0.7, and 0.9). When the fiber–matrix interaction parameter CM was gradually increased, as Figure 5 shows, the shell height had fallen while the shell–core slope remained distinct. As shown in Figure 6, the skin boundary is strongly related to the slow-down parameter α. A large α value yields an obvious skin boundary. Moreover, Figure 7 presents the same result of the flow-direction orientation distribution at different flow directions for optimizing the iARD-RPR model parameter: CI = 0.0008, CM = 0.8, and α = 0.95. Therefore, we demonstrated that the iARD-RPR is model objectivity.
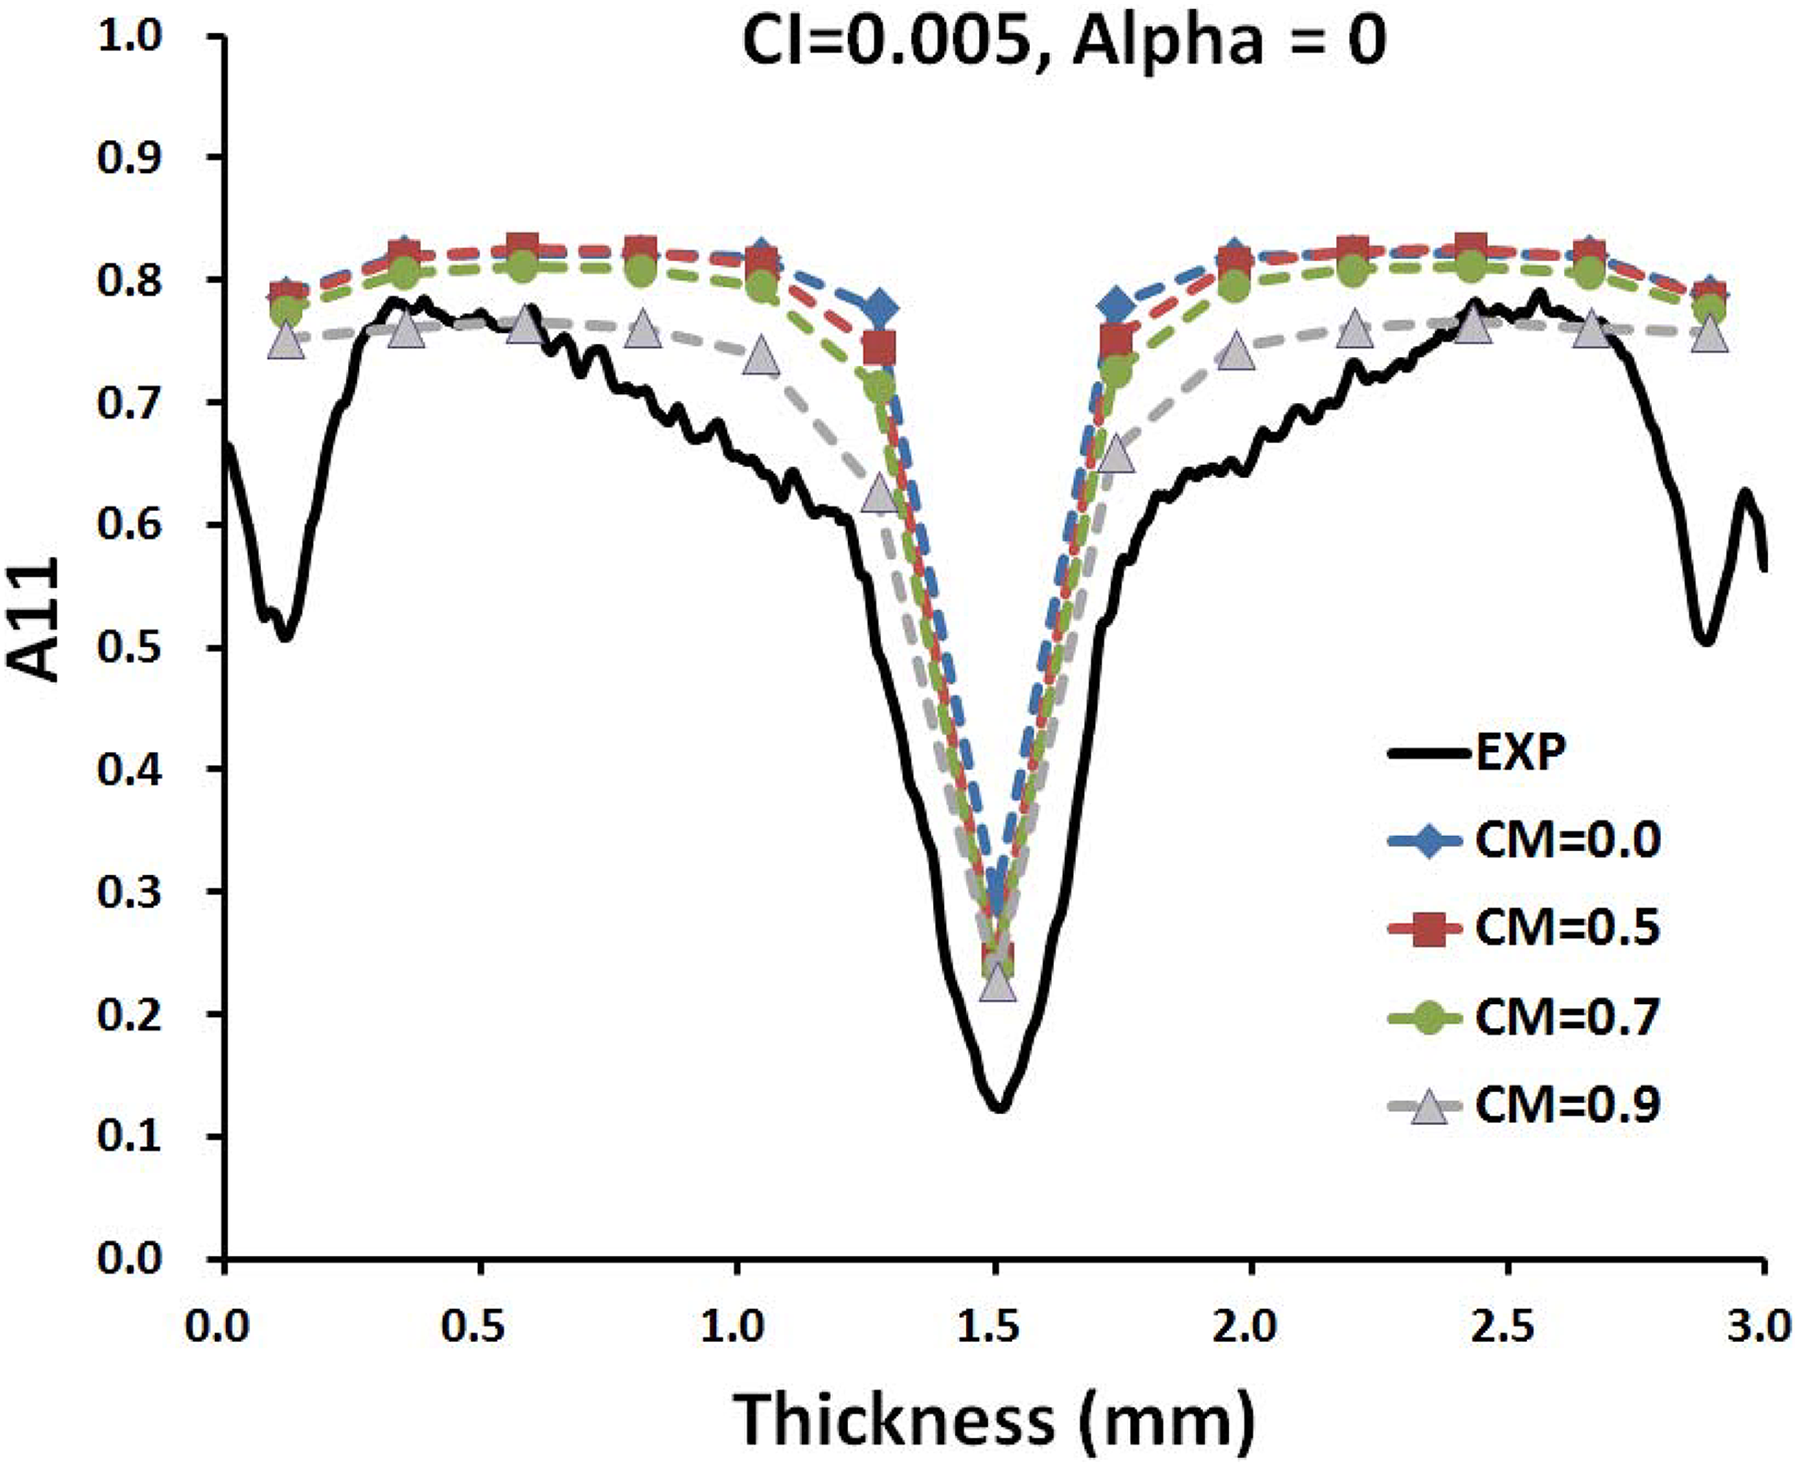
The predicted curves and experimental data of flow-direction orientation tensor component distributions through the normalized thickness for the iARD-RPR model at different values of parameter CM . under fixed parameters CI = 0.005 and α = 0.
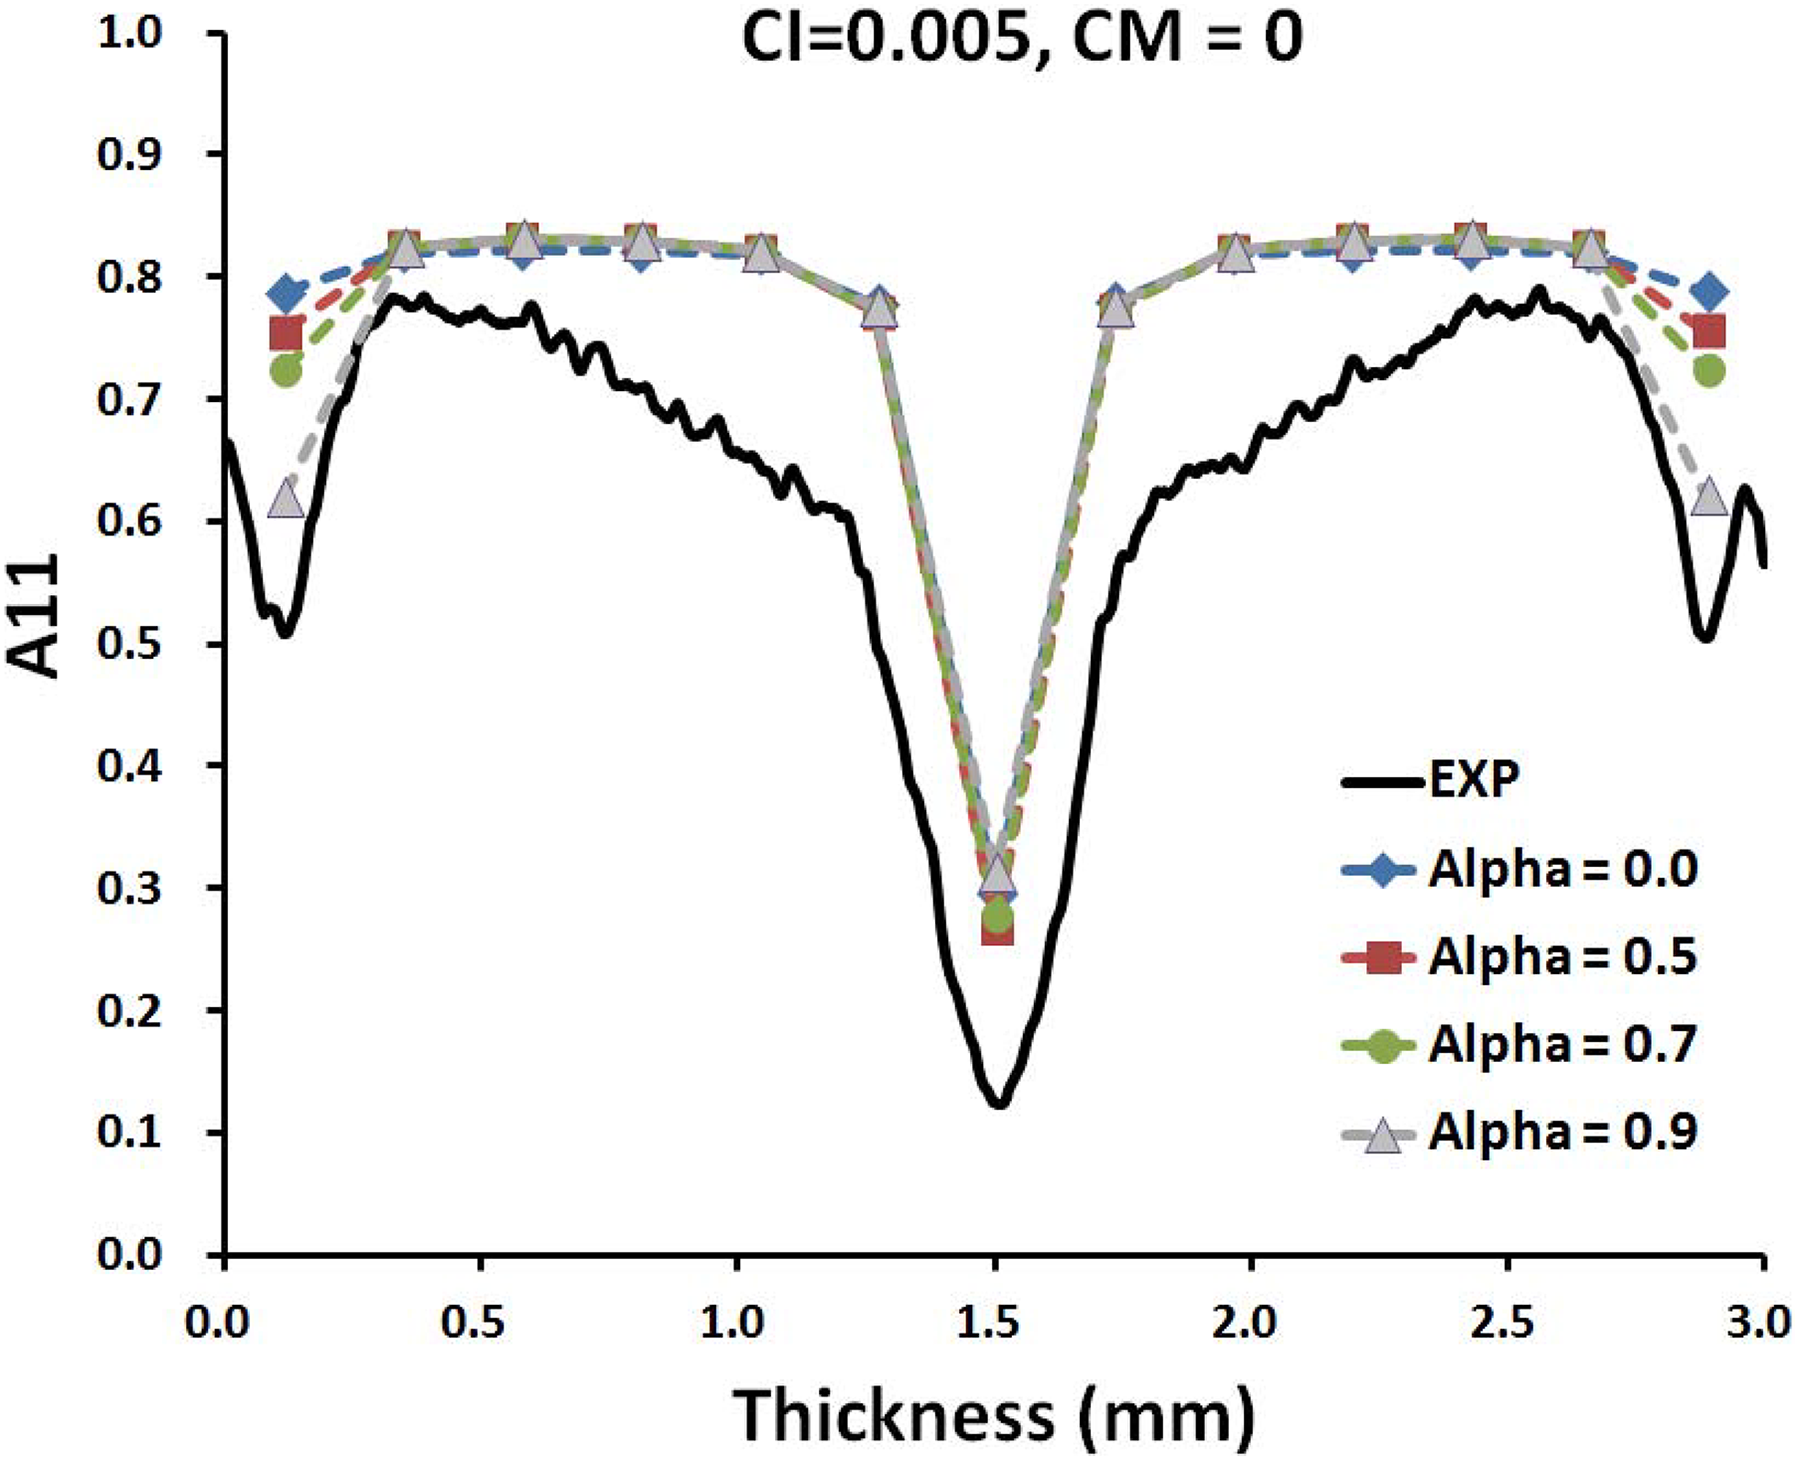
The predicted curves and experimental data of flow-direction orientation tensor component distributions through the normalized thickness for the iARD-RPR model at different values of parameter α under fixed parameters CI = 0.005 and CM = 0.
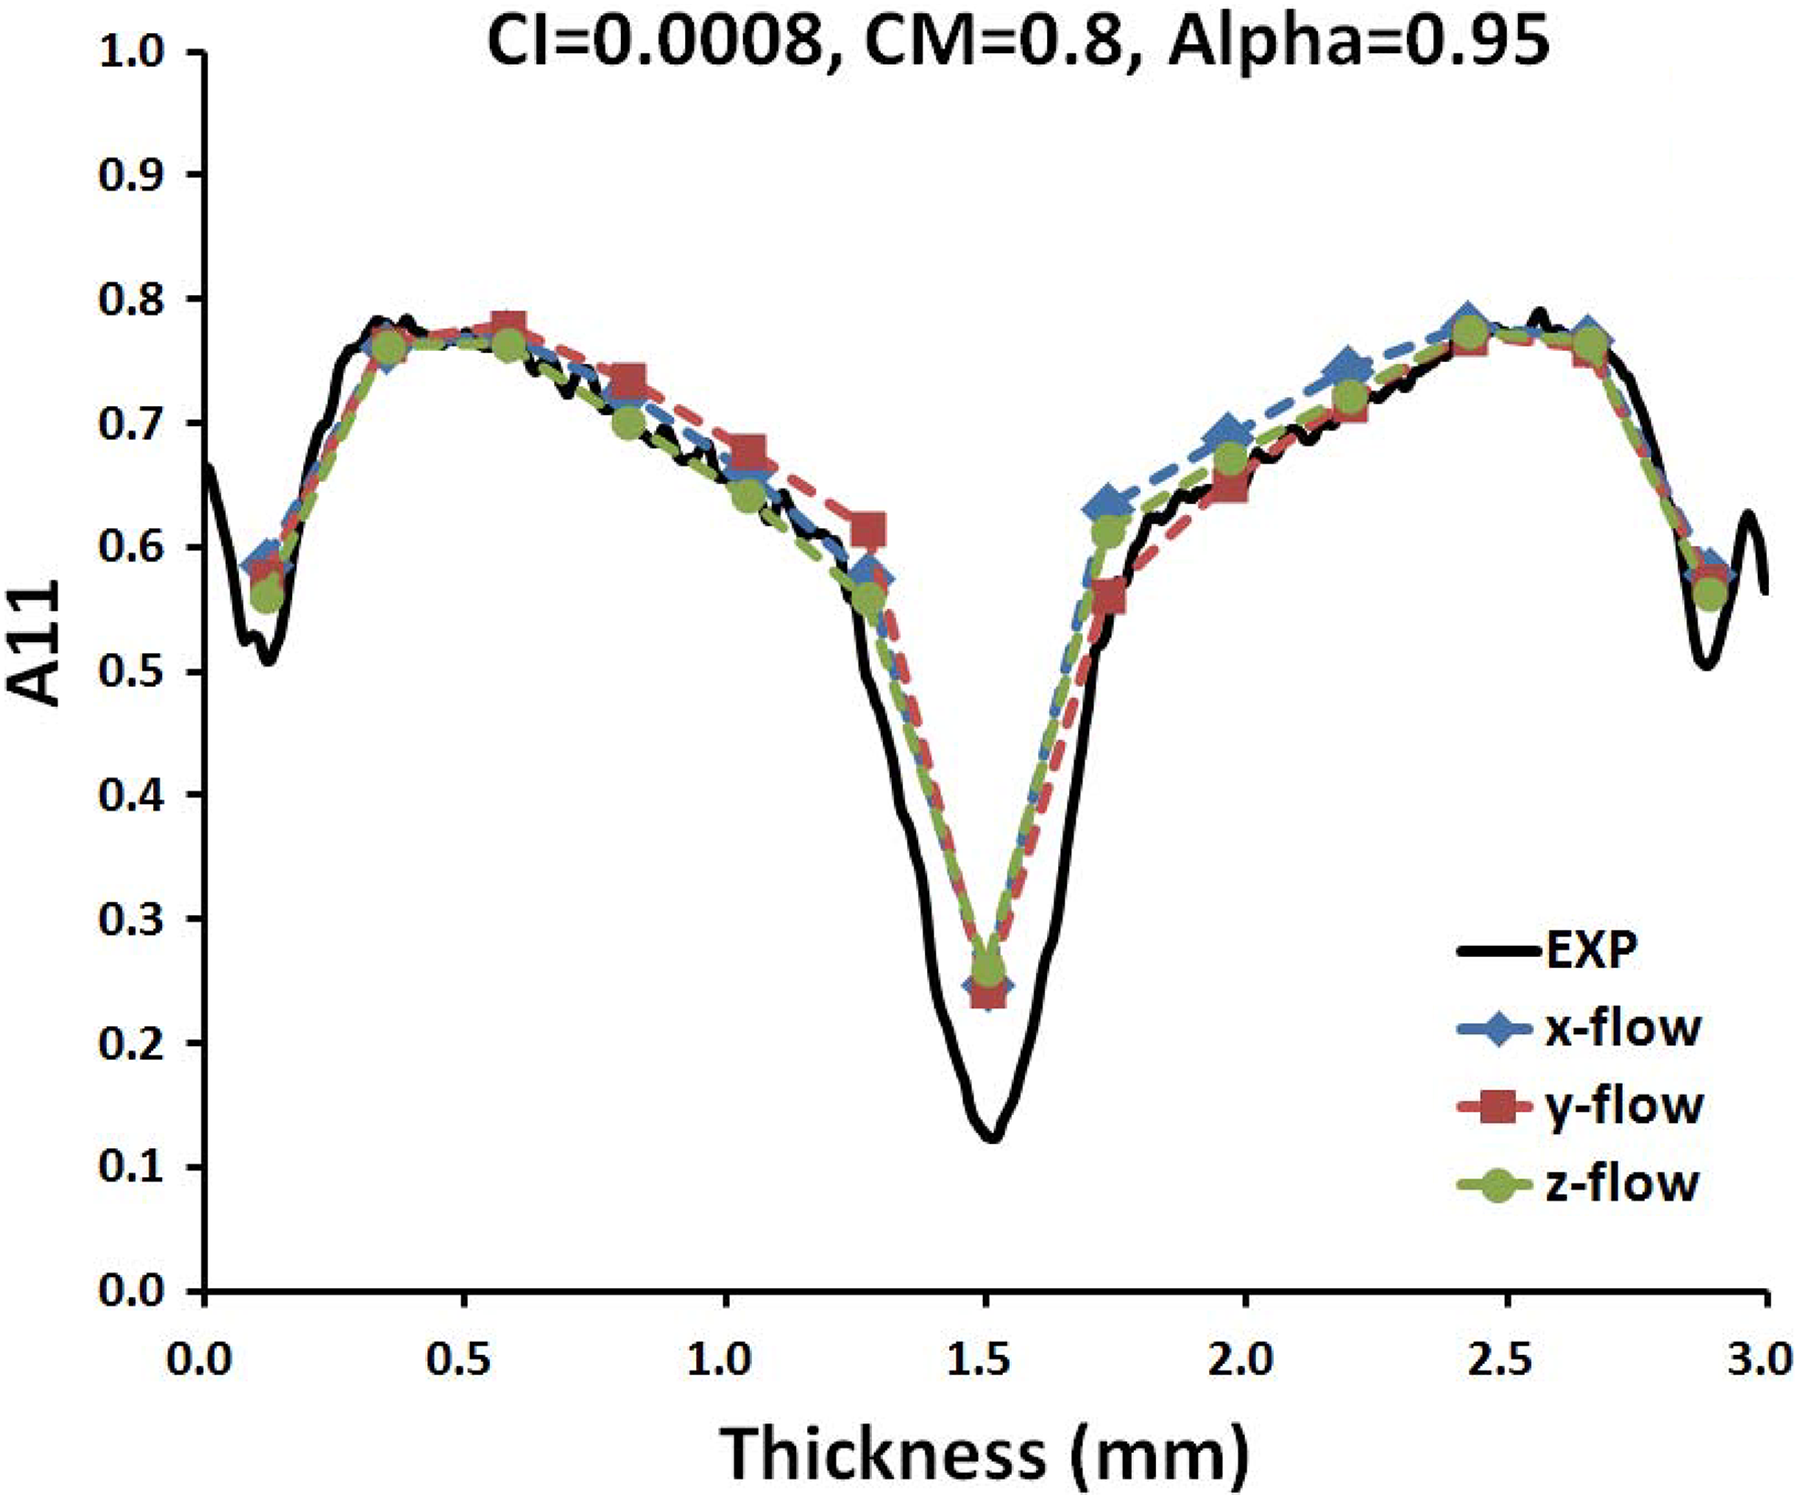
The predicted curves and experimental data of flow-direction orientation tensor component distributions through the normalized thickness for optimizing the iARD-RPR model parameter, CI = 0.0008, CM = 0.8, and α = 0.95, at different coordinates of flow direction.
MRD model
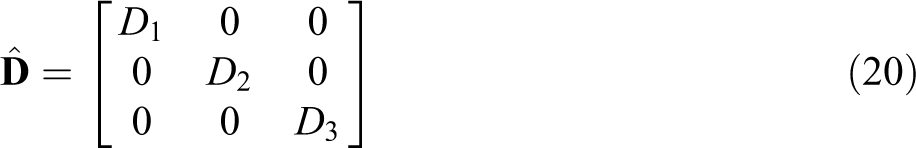
More recently, the MRD model 9 was significantly proposed by Autodesk Moldflow Insight 10 to improve fiber orientation prediction for 3-D numerical computation. Such a model contains four parameters: the fiber–fiber interaction parameter CI and three anisotropic factors (D 1, D 2, and D 3). Bakharev et al. 9 optimized the anisotropic factors to obtain D 1 = 1.0, D 2 = 0.5, and D 3 = 0.3. Here, we were interested in examining the MRD model resulting in the flow-direction orientation distributions at different CI values (CI = 0.0001, 0.0003, 0.0005, and 0.005), as shown in Figure 8. It is obvious that the shell height was raised with increasing CI values; this is contrary to the CI result of the Folgar–Tucker model and the iARD-RPR model (cf. Figure 3). Thus, the MRD’s CI parameter should not be the Folgar–Tucker fiber–fiber interaction. In particular, the core width, the shell–core interface, and the skin boundary are obvious with decreasing CI values, while a smaller CI results in the skin disappearing. In addition, we found the optimal value, CI = 0.0003, obtained excellent prediction.
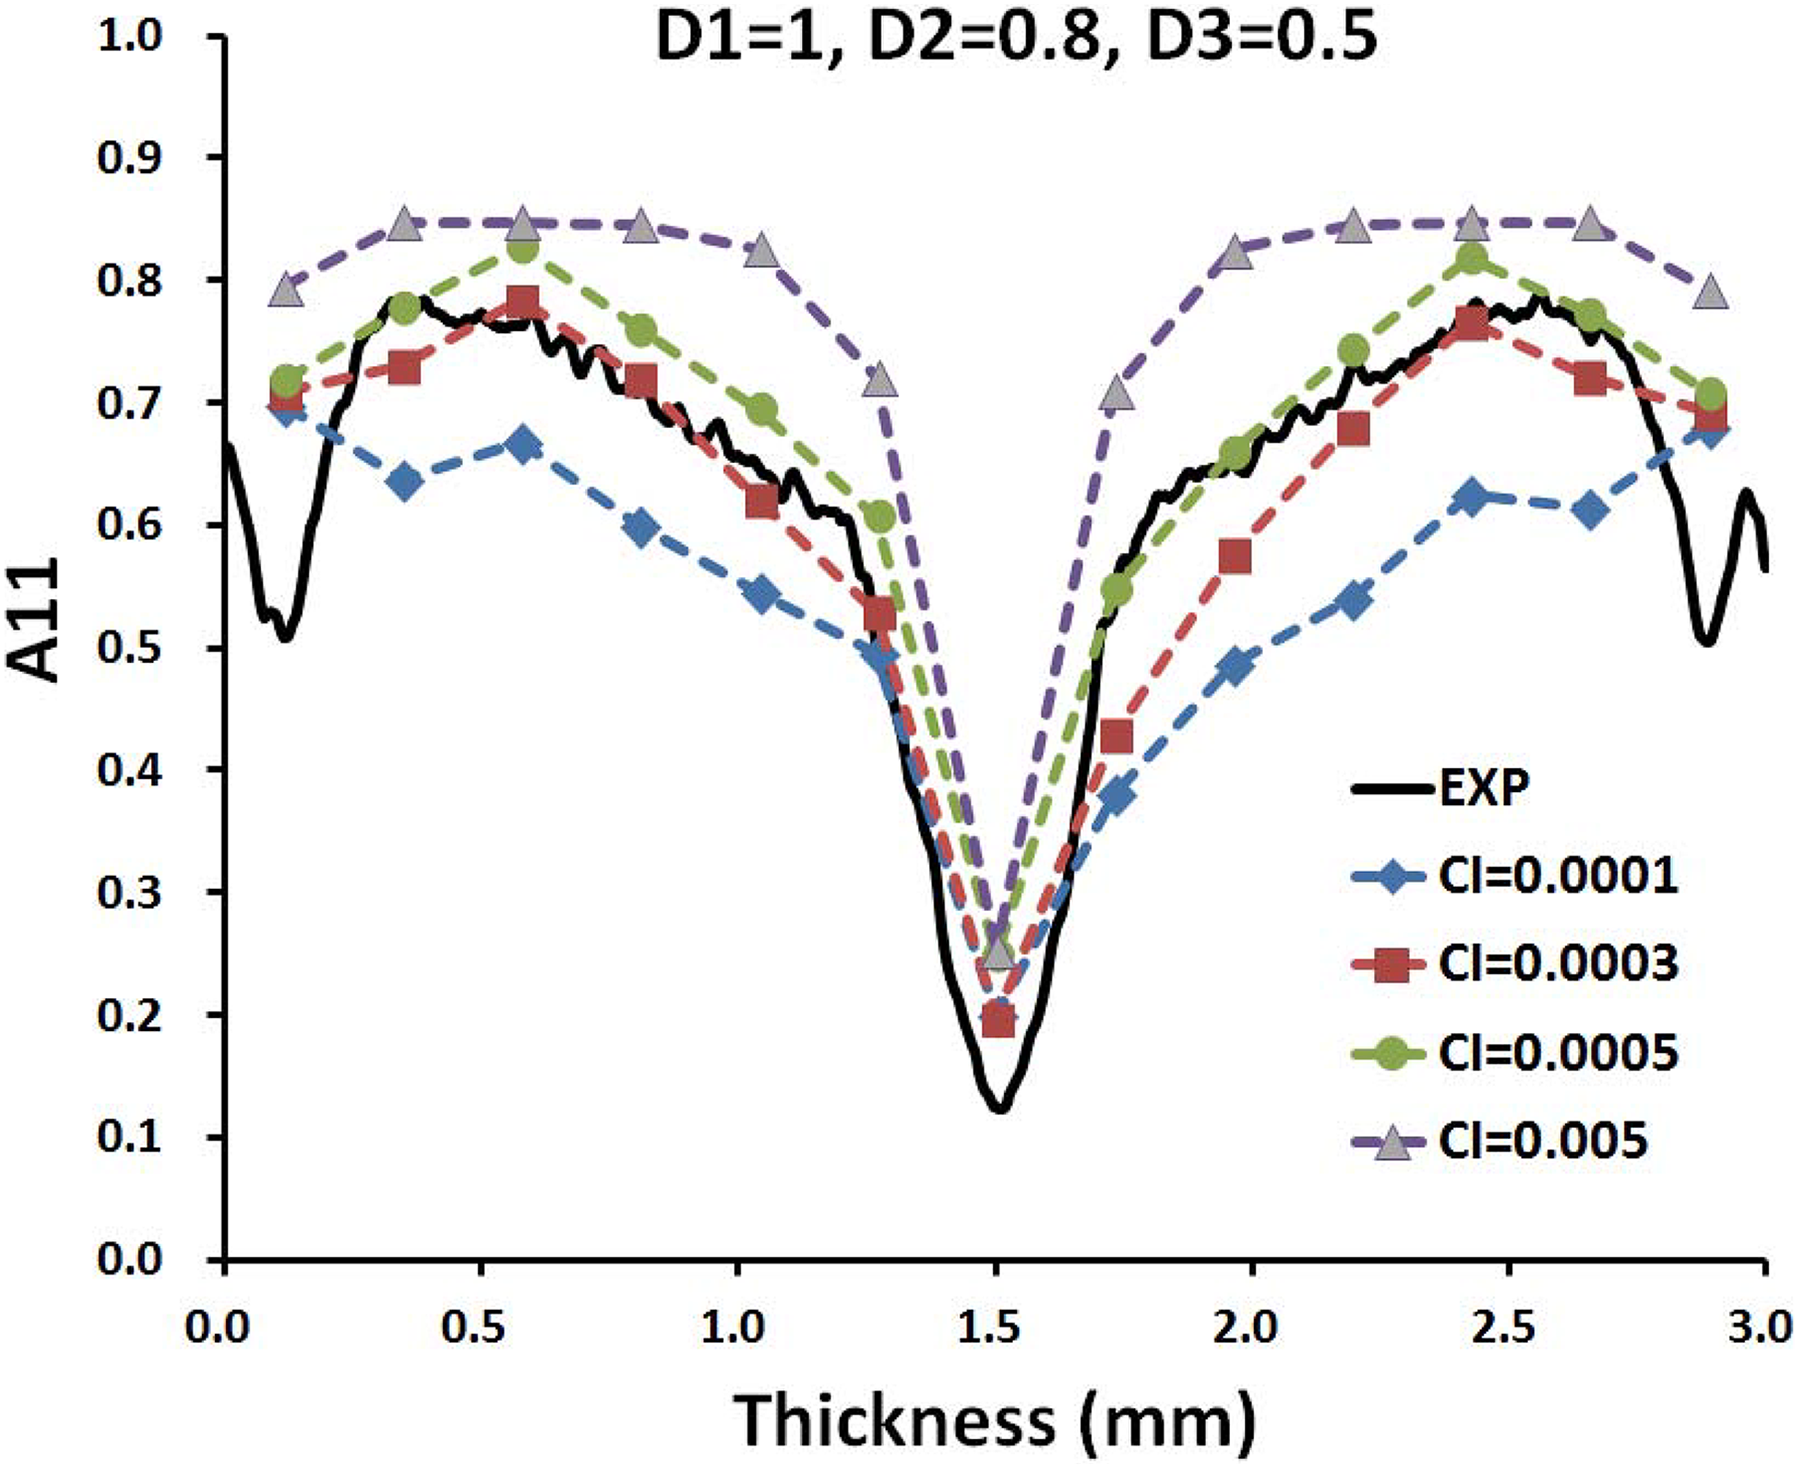
The predicted curves and experimental data of flow-direction orientation tensor component distributions through the normalized thickness for the MRD model at different values of parameter CI .
Finally, we also discussed the objectivity of the MRD model, shown in Figure 9, of the flow-direction orientation tensor component distributions through the normalized thickness for optimizing the MRD model parameter, CI = 0.0003, under the default parameters, D 1 = 1.0, D 2 = 0.5, and D 3 = 0.3, at different coordinates of flow direction. It was unexpectedly found that the y-flow and z-flow results exhibited a higher orientation in the shell layer compared to the x-flow; clearly, these curves are not close to each other. Unfortunately, the MRD should not be rheological objectivity. Moreover, we can fine-tune the MRD parameters, CI = 0.0001 and CI = 0.00015 for the y-flow and z-flow, respectively. Figure 10 shows almost the same curve at different flow directional coordinates with respect to the MRD model parameter, CI .
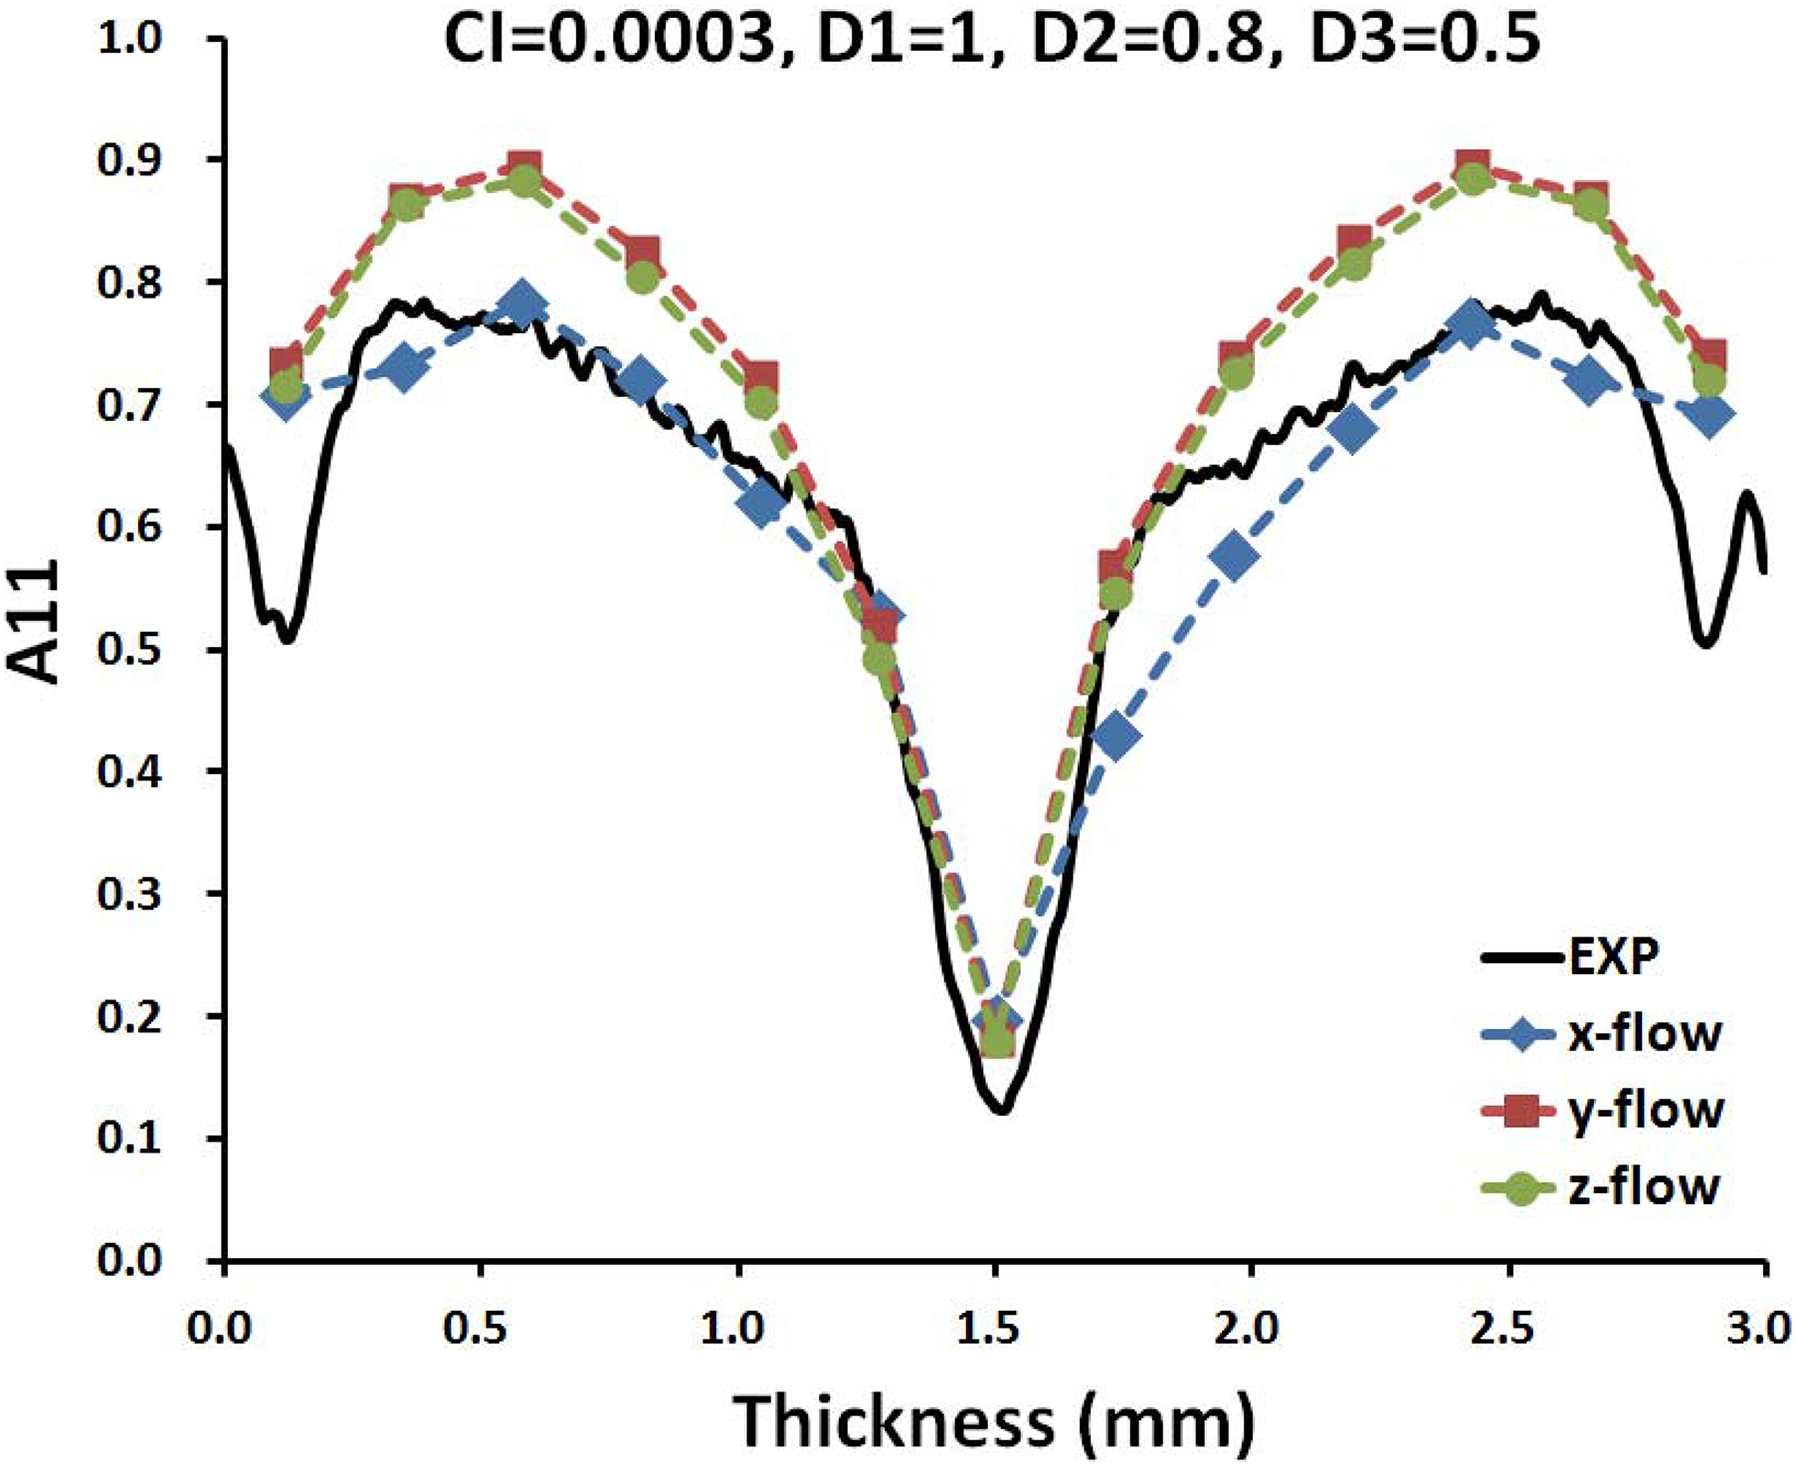
The predicted curves and experimental data of flow-direction orientation tensor component distributions through the normalized thickness for optimizing the MRD model parameter, CI = 0.0003, at different coordinates of flow direction.
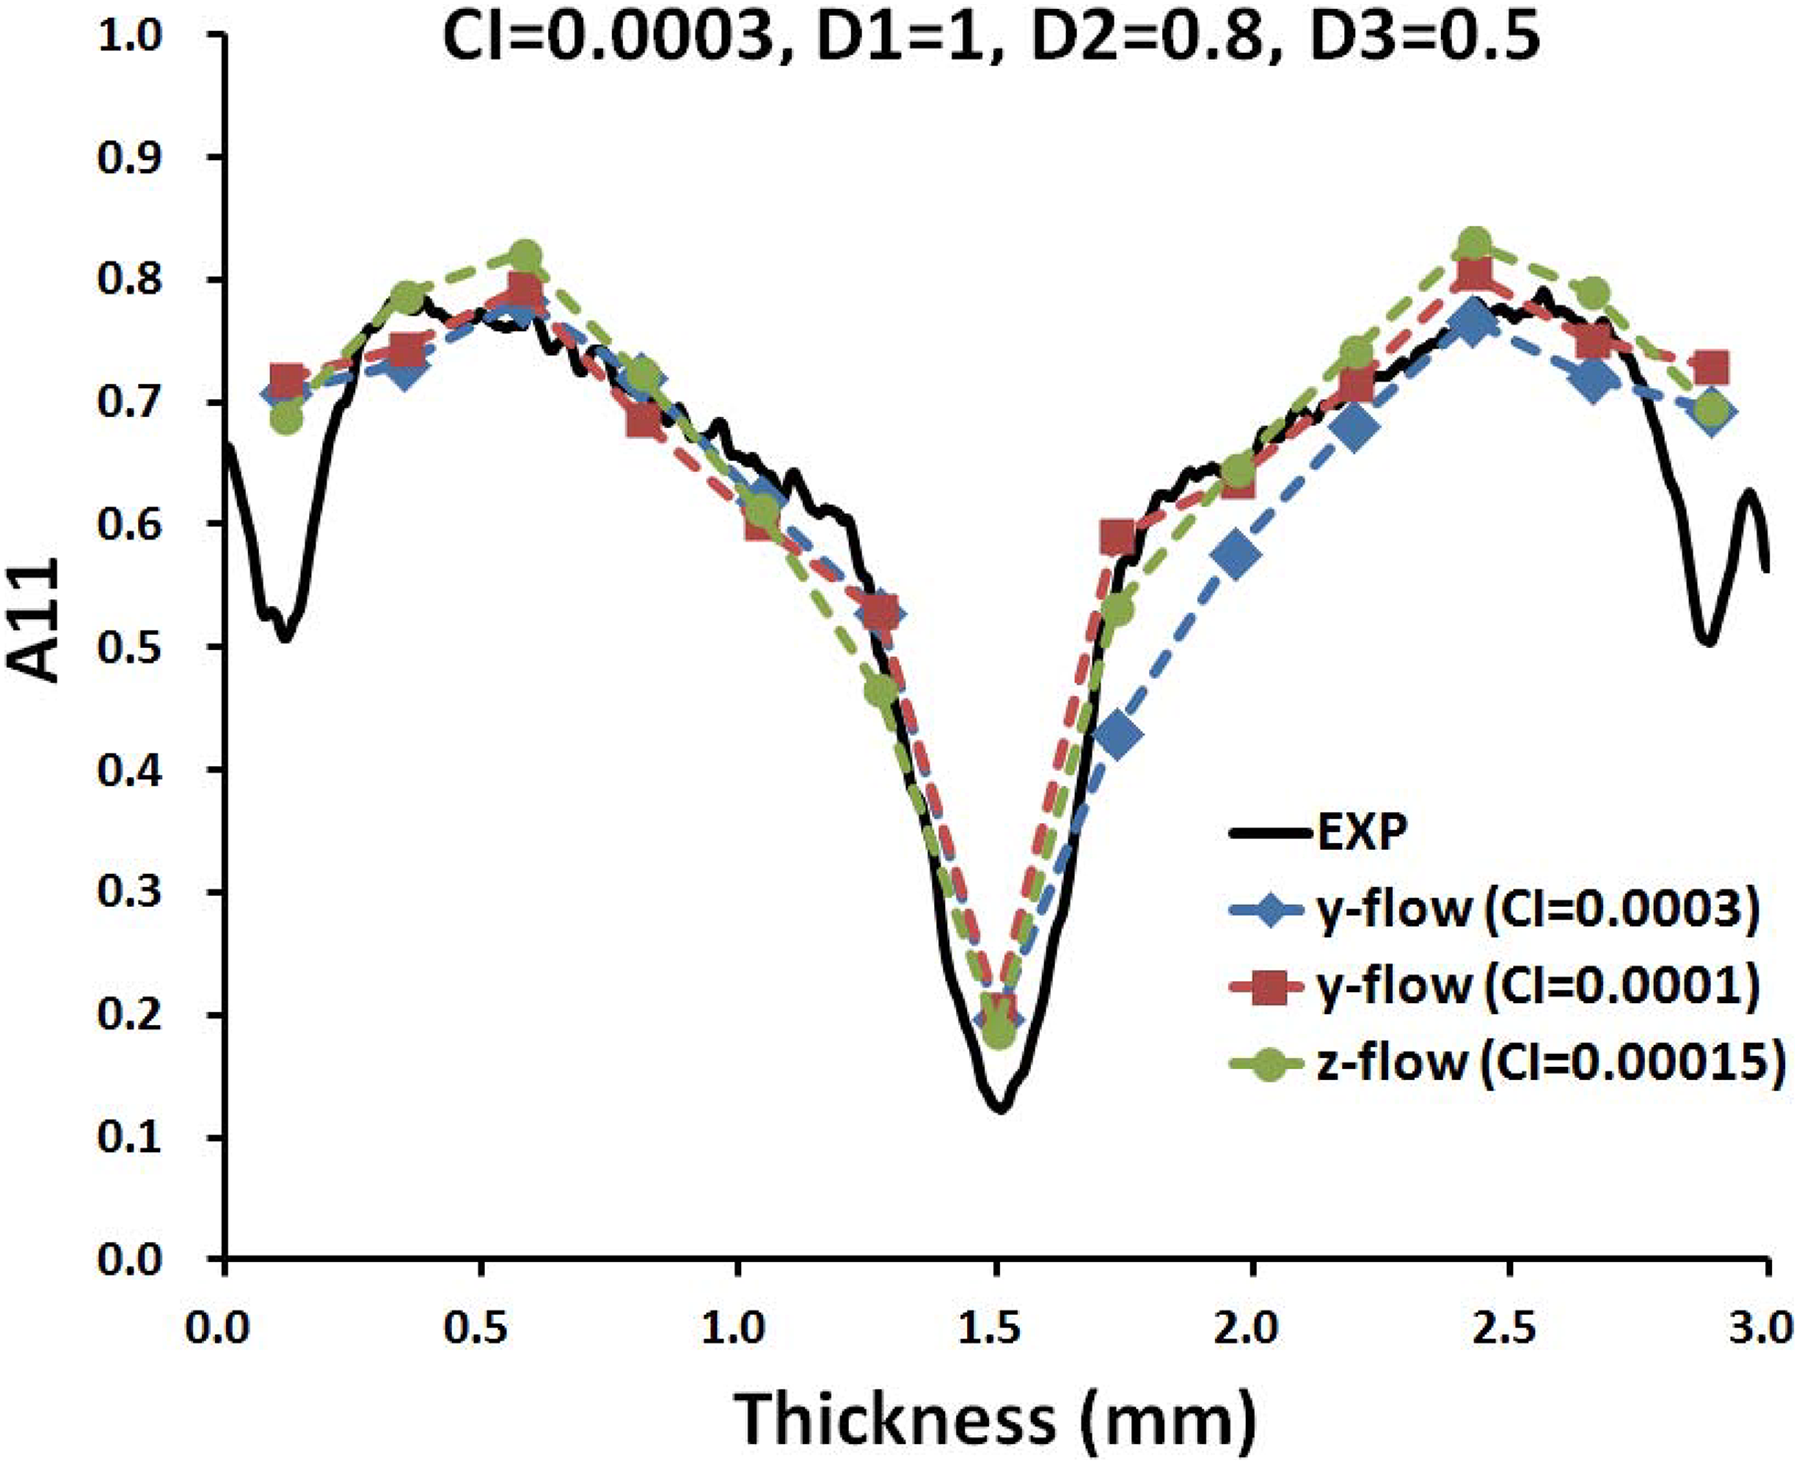
The predicted curves and experimental data of flow-direction orientation tensor component distributions through the normalized thickness for optimizing the MRD model parameter, CI = 0.0003, CI = 0.0001, and CI = 0.00015, at different coordinates of flow direction, x-flow, y-flow, z-flow, respectively.
According to the MRD of equation (19), we discovered that this model suffers from a major flaw. Under an isotropic orientation condition,
Tseng et al. 30 newly defined the spatial tensor as coaxial with the orientation tensor’s principal directions, while the spatial tensor’s principal components are meant to control anisotropic changes in the orientation tensor. Such a principal spatial tensor is used in the Phelps–Tucker ARD model, called the pARD model


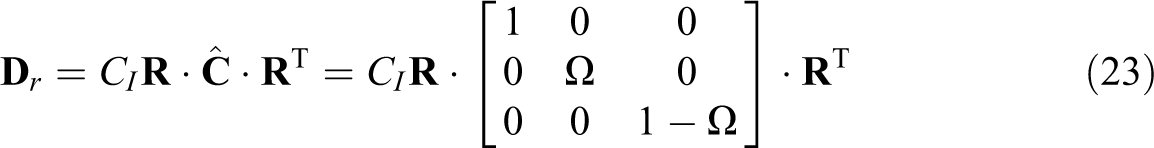
where the rotation matrix
Thus, we attempted to use the pARD model coupled with the RPR model 30 in this work. As a result, Figure 11 clearly shows the same answer at different coordinates of flow direction of the injection molding plate for optimizing the pARD parameters, CI = 0.0003 and Ω = 0.8, as well as the RPR model parameter, α = 0.95. It is positive to suggest that the pARD model should be able to improve the nonobjective MRD model.
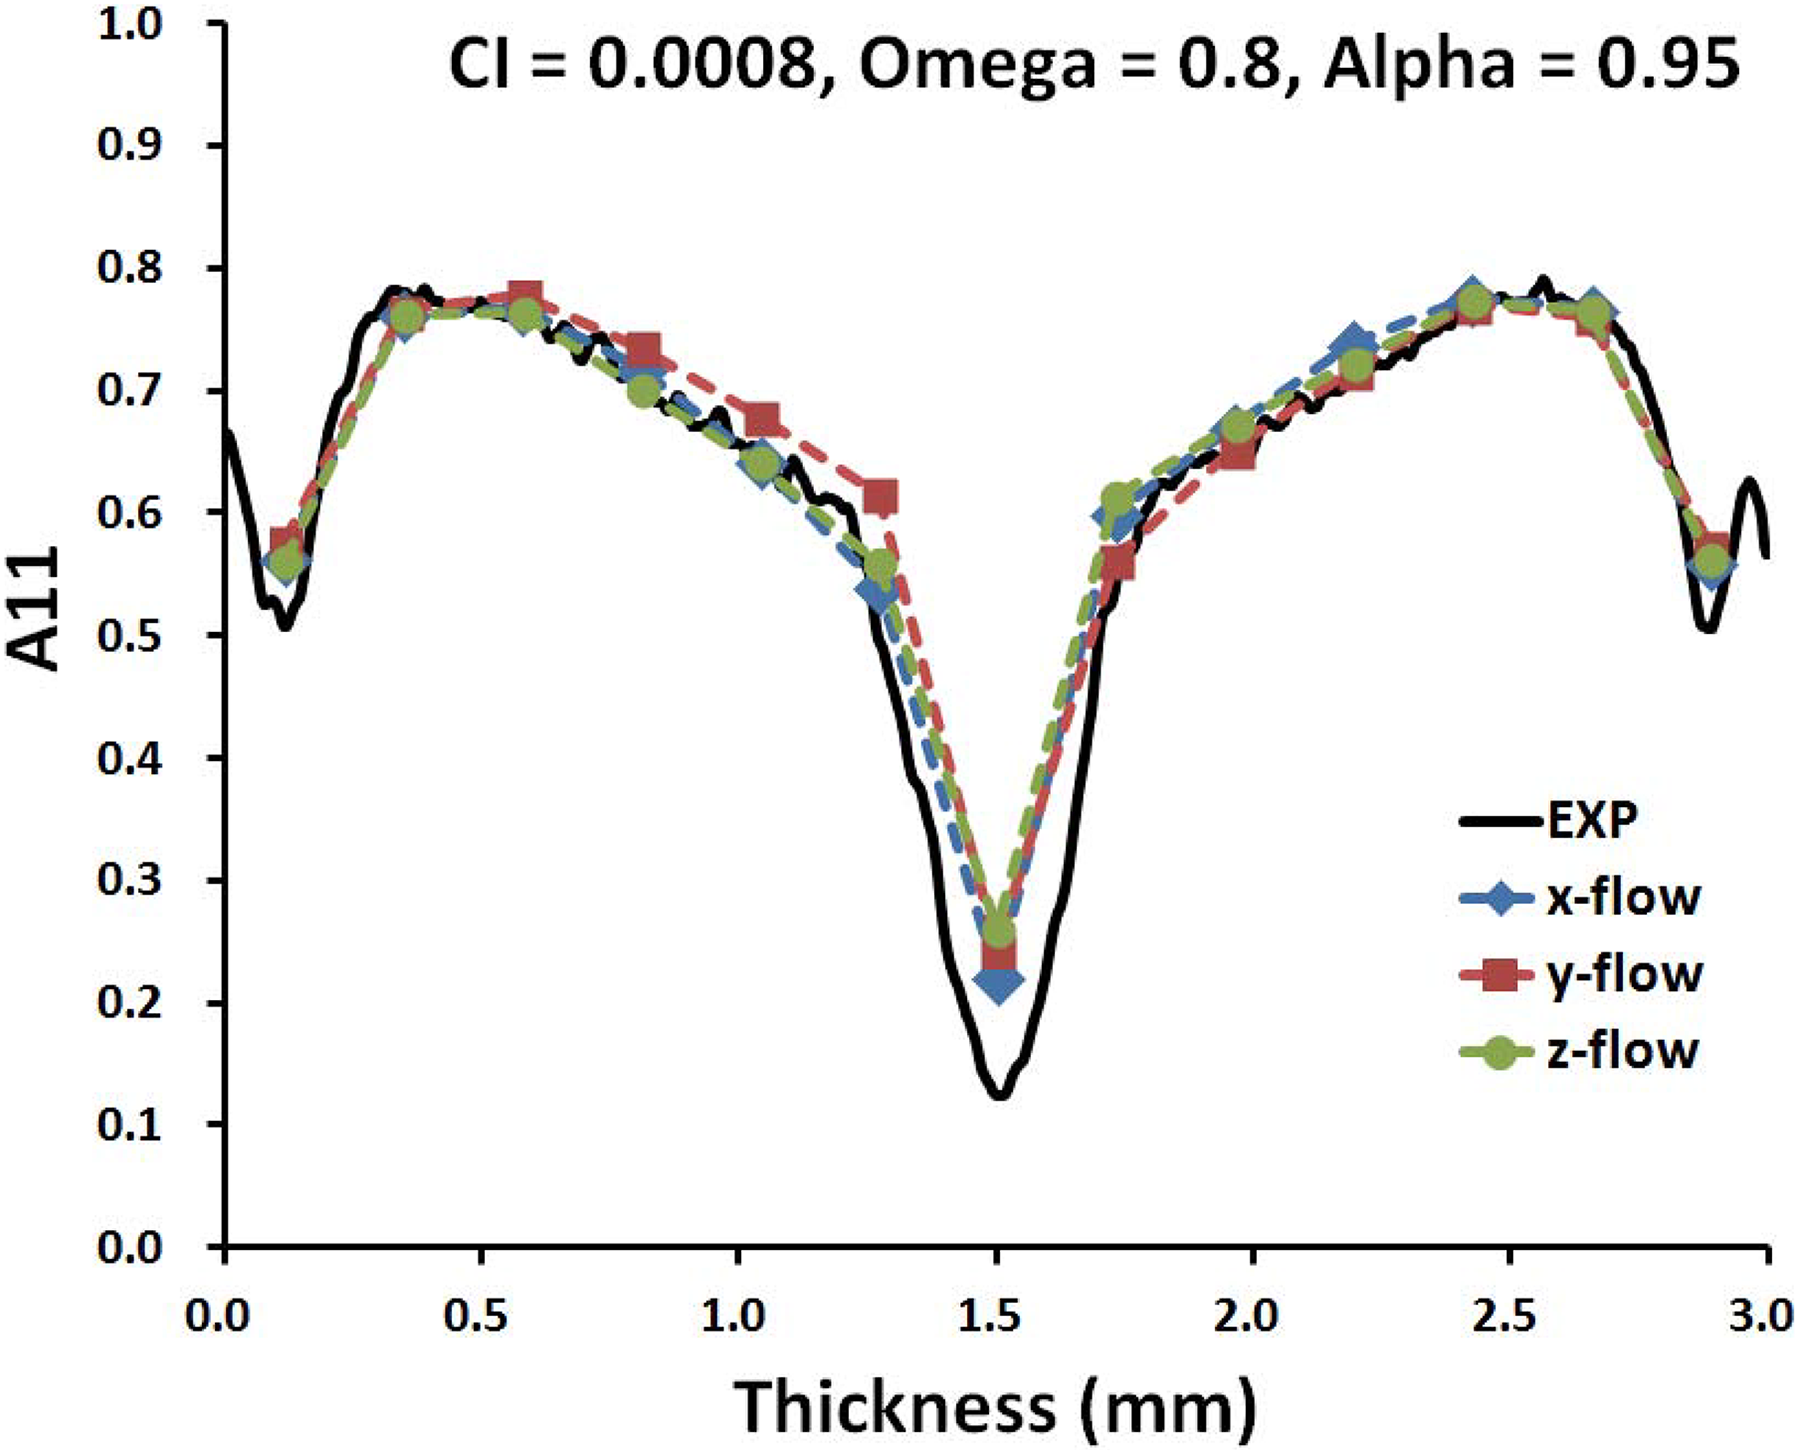
The predicted curves and experimental data of flow-direction orientation tensor component distributions through the normalized thickness for optimizing the pARD-RPR model parameter, CI = 0.0008, Ω = 0.8, and α = 0.95, at different coordinates of flow direction.
Conclusions
In this article, the standard Folgar–Tucker equation results show that the orientation in the shell layer can be predicted fairly well, while significant deviation was found in the core region, shell–core interface, and skin boundary. Both the iARD-RPR and MRD models recently developed by commercial injection molding simulation software, Moldex3D and Moldflow, were used to obtain excellent predictions, respectively. In addition, the Folgar–Tucker model and the iARD-RPR model have been demonstrated as objective models, which means that that the fiber orientation distribution given at different global coordinate systems only yield one principal result; when many answers occur, such a fiber model is called as a nonobjective model. However, the MRD model is nonobjective in terms of its significant deviations of predictive fiber orientation, especially for real automotive products with complex geometries and requisite features. In summary, here we demonstrated that the iARD-RPR model is superior to the Folgar–Tucker and MRD models. Previously, the three-parameter iARD-RPR model for the predictive accuracy and high availability has also been validated to effectively improve the six-parameter ARD-RSC model. It is important to determine an optimal parameter set