
Abstract
During the packing or post-filling stage, a significant flow of polymer inside the cavity may result due to the compressibility of the polymer melt under the higher packing pressure of the injection molding process. In the meantime, the effect of the packing stage on the shell–core structure of the fiber orientation for the fiber-reinforced composites has always been a concern. Even though certain commercial packages have undergone unified simulations of the filling and packing stages, fiber orientation has usually been determined at the end of the filling stage. A recently proposed mathematic model, Improved Anisotropic Rotary Diffusion and Retarding Principal Rate, having incorporated the state-of-the-art technology of 3D injection molding simulation, has demonstrated its ability to provide reliable predictions of fiber orientation. The present numerical results concentrate on comparing and analyzing the difference in fiber orientation between the filling and packing stages, while the important effects of packing time and packing pressure are further revealed. A qualitative comparison of core thickness widths in related experimental investigations is discussed herein.
Introduction
Fiber-reinforced composites are invariably selected as familiar lightweight automotive materials due to their excellent safety and good mechanical properties. The well-known shell–core structure 1 of fiber orientation is found in the injection molding process. Before manufacturing a part, the accurate prediction of the fiber orientation state is a critical consideration in the process of structural analysis.
The famous Folgar–Tucker equation has become a standard calculation tool to predict fiber orientation in injection-molded, fiber-reinforced parts. 1 Several studies have shown that the predictions of the Folgar–Tucker model are in good agreement with actual experiments. In the past, many researchers used “the midplane mesh model” (also called the 2.5D or Shell model) based on the Hele-Shaw approximation employed to predict fiber orientation in injection molding simulation. The injection molding process involves both the filling and packing stages. However, the previous Hele-Shaw calculations 2 –4 of fiber orientation are limited to the filling stage.
In practice, the experimental data on fiber orientation are measured after the end of the packing. With reference to earlier experimental investigations, Bailey and Rzepka’s 5 study found that the core thickness of injection-molded long fiber composites is reduced during packing. They further explained that such an effect was due to the high viscosity gradient. So far, the effect of packing on fiber orientation has not been analyzed theoretically. Even through the use of certain commercial software, reported fiber orientation has usually been obtained at the end of the filling stage.
Generating a 2.5D mesh for a complex 3D geometric part is a very time-consuming task; in addition, the 2.5D calculation based on the Hele-Shaw approximation lacks numerical resolution. The components of a complex geometric part include various rib sizes as well as changes in the flow direction and thickness. It is quite a challenge to determine fiber orientation distributions in the requisite complex designs.
Based on the classic fiber orientation models, 2 –4,6 –10 Tseng et al. 11–14 have recently developed a new objective model, Improved Anisotropic Rotary Diffusion and Retarding Principal Rate (iARD-RPR), which has been incorporated into the commercial software of 3D injection molding simulation, Moldex3D (CoreTech System Co., Taiwan). The iARD-RPR model includes only three physical parameters to enable fiber orientation predictions. Foss et al. 15 utilized Moldex3D to predict short glass fiber orientation in the end-gated plaque and the center-gated disk. Just one set of the optimal iARD-RPR parameters could yield good orientation predictions with respect to flow factors, such as fill rate and part geometry.
In the present study, we therefore use the state-of-the-art technology of 3D injection molding simulation with the objective iARD-RPR model to investigate changes in fiber orientation for a comparison of the filling and packing stages. In addition, we present an explanation of the high viscosity gradient during packing. Various packing times and packing pressures influencing fiber orientation are also analyzed herein.
Theoretical background
The flow-induced fiber orientation indicates that changes in the fiber orientation are strongly driven by the flow field. For injection-molded fiber composites, the actual flow of the fibers dispersed in the polymer melt is transient, non-Newtonian and non-isothermal, with frozen layers building up as the complex mixture flows through the mold cavity. The process is highly nonlinear, as the material properties are dependent upon the rheological and thermal conditions. For completeness, here we summarize the theoretical equations, involving fluid mechanics and fiber orientation kinetics.
Basic governing equations
The governing equations of the fluid mechanics 16 which describe the transient and non-isothermal flow motion are as follows:
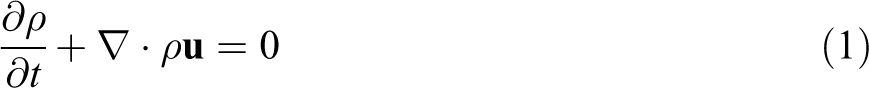


where ρ is the density,
Tait’s Pressure, Volume, and Temperature (PVT) model is to express a thermodynamic state relationship, namely, the volume of the material as a function of the temperature and pressure, 17 as follows:


where these parameters, b 1S , b 1L , b 2S , b 2L , b 3S , b 3L , b 4S , b 4L , b 5, b 6, b 7, b 8, and b 9 are fitted by experimental data.
It is important to understand the viscosity flow curve for highly concentrated fiber composites. For pure polymer fluids, the flow curve of the viscosity versus shear rate involves two regions: the Newtonian plateau at low shear rates (zero-shear-rate viscosity independent of the shear rate) and shear thinning at high shear rates (viscosity decreases with increasing shear rates); this reflects the prior understanding of general polymer rheology. Reviewing previous experimental results 18 –21 on fiber-filled suspensions, the researchers of rheology have demonstrated that the suspension viscosity increases with fiber content and length. For the 30 wt% long glass fiber–filled polypropylene composites with various fiber lengths of 10–30 mm, Thomasset et al. 21 showed that the Newtonian plateau particularly vanishes at low shear rates, instead of the yield stress viscosity, namely, a very sensitive increment of viscosity with decreasing shear rates.
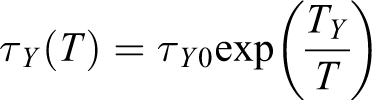
In general, the Cross–William–Landel–Ferry (Cross–WLF) model 17,22 can describe complex viscosity behaviors of polymer melts, including that the viscosity varies with shear rate for the Cross and depends on temperature and pressure for the WLF. In the earlier study of suspension rheological, the yield stress was clearly found to decrease with increasing temperature. 23 In the present study, we therefore adopted the Yield–Cross–WLF model involves the yield stress viscosity term and the Cross–WLF model, called as the Herschel–Bulkley model 24, 25 :
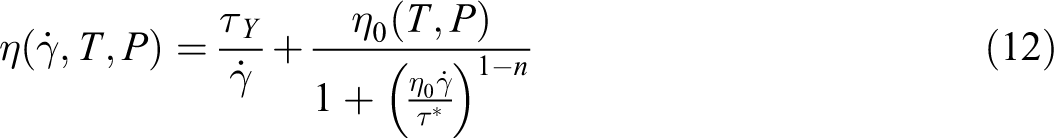


where seven parameters are fit by related experimental data, including n, τ*, A1,
Fiber orientation equations
A single fiber is regarded as a rigid cylindrical rod. The fiber’s unit vector
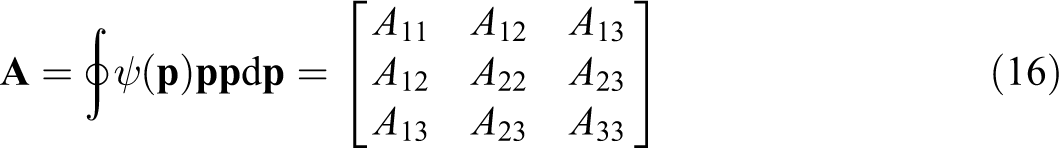
where ψ(
A time evolution equation of the second-order orientation tensor is fixed on the material derivative, denoted as
From the aforementioned fiber orientation models, Tseng et al. 11 –13 developed a new model, the iARD-RPR. However, the iARD tensor does not pass the classic rheological rule of Euclidean objectivity, namely, material frame indifference. It is hard to ignore the non-objective effect due to the fact that different coordinate systems can yield different answers. More recently, Tseng et al. 13 have improved such a non-objective issue and then proposed the objective iARD model. Here, we introduce the objective iARD-RPR model divided into three parts.
Firstly, the iARD-RPR equation contains three terms: the Jeffery Hydrodynamics


where
Secondly, it is significant that the rotary diffusion tensor


where
Eventually, the RPR model is introduced as:


where
The iARD-RPR model has only the three physical parameters: a fiber–fiber interaction parameter CI , a fiber–matrix interaction parameter CM , and a slow-down parameter α. The available region of these three parameters is suggested in: 0 < CI < 0.1, 0 < CM < 1, 0 < α < 1. For short fibers, the default parameters are suggested: CI = 0.005, CM = 0.1, α = 0.7; for long fibers, CI = 0.01, CM =1.0, α = 0.1. In addition, the shell-orientation layer depends on the iARD parameters, while the core width is controlled by the RPR parameter. The value of fiber orientation in the shell increases with increasing CI and decreasing CM . The core width increases with increasing α. According to these criteria, we could fine-tune three parameters to obtain an accurate orientation prediction compared with experimental data, namely, determining an optimal parameters set.
Regarding a particular coupled problem, the flow and orientation equations must be solved simultaneously, since fibers orient in response to flow, and flow and suspension rheology are affected by fiber orientation in reality. To date, the coupled approach has not been implemented in commercial software packages due to require significant computational resources. Previously, VerWeyst and Tucker 30 demonstrated that the effects of coupling the flow filed and fiber orientation calculations had a negligible effect on the solution. For engineering applications, a decoupled approach has been availably applied in which the fluid flow problem is first solved, and the resulting velocity field is used to compute the fiber orientation.
Results and discussion
Referring to the previous disclosed research report by the Pacific Northwest National Laboratory and the Oak Ridge National Laboratory 31 in the United States, as well as a previous study, 12 a center-gated disk geometry is shown in Figure 1. The disk is about 90 mm in radius with a gap thickness of 2 h = 3 mm. One measurement point is located at 34 mm in the radial direction. The mold and melting temperatures were set at 70°C and 238°C, respectively. The filling time and volume flow rate were 0.59 s and 130 cc/s, respectively. The packing time of 10 s and packing pressure of 100 MPa were given, and all of the processing conditions are addressed in Table 1.
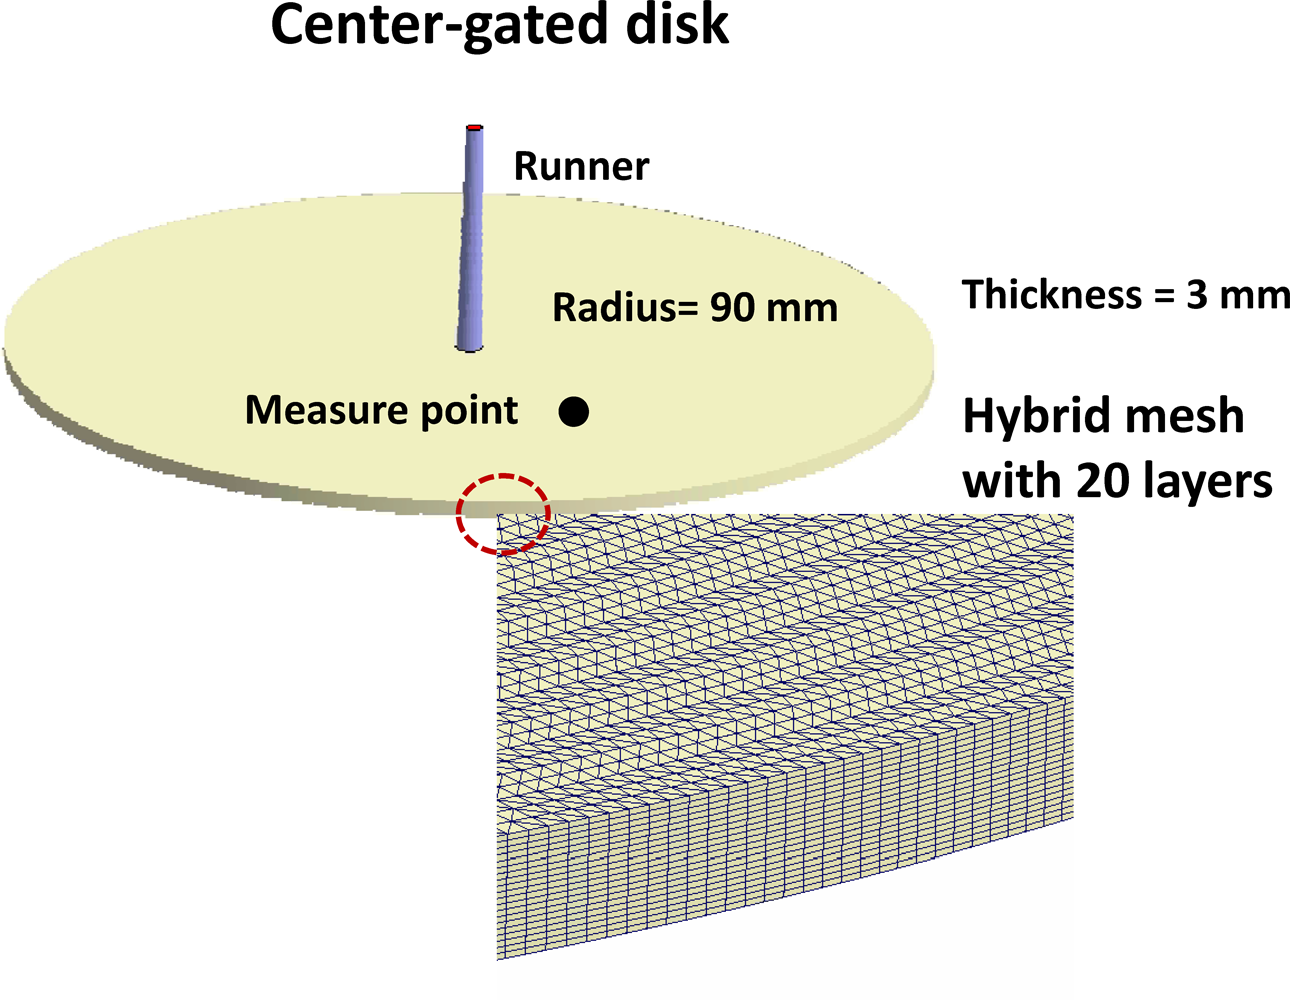
The injection-molding geometry of the center-gated disk (90 mm radius and 3 mm thickness) and its hybrid mesh (20 layers) for 3D numerical computation.
Processing conditions for the 40 wt% LGF/PP composite during the injection mold filling.
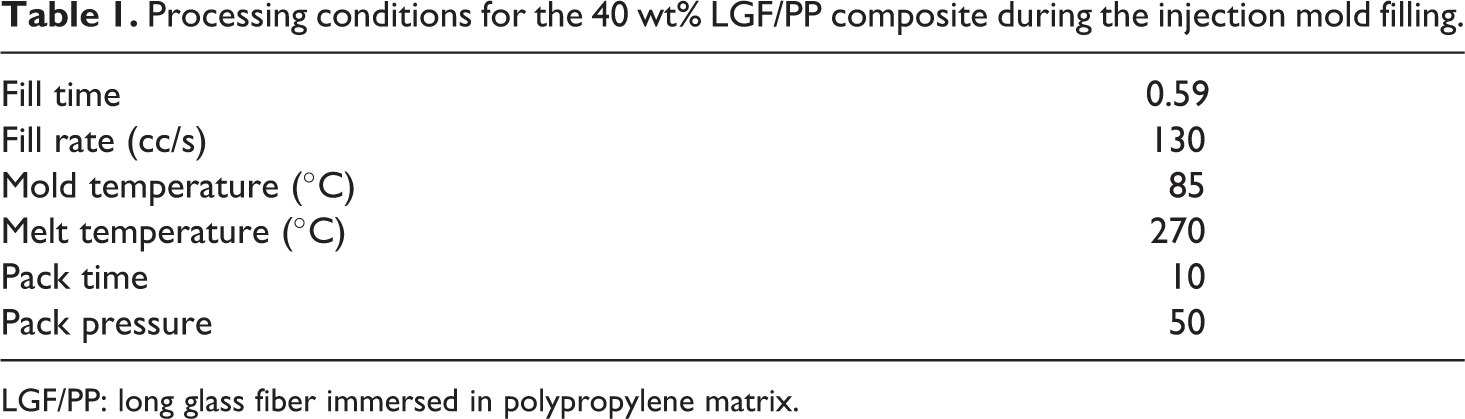
LGF/PP: long glass fiber immersed in polypropylene matrix.
The researched material is the 40 wt% long glass fiber immersed in polypropylene matrix (40 wt% LGF/PP) with a density of 1.22 g/cm3. The initial fiber diameter and length are 17.4 μm and 13 mm, respectively. The post-extruded average fiber length is about 2 mm.
All of material parameters, including the PVT, shear viscosity, specific heat, and thermal conductivity, are summarized in Tables 2 to 4.
The PVT model parameters of the 40 wt% LGF/PP composite.
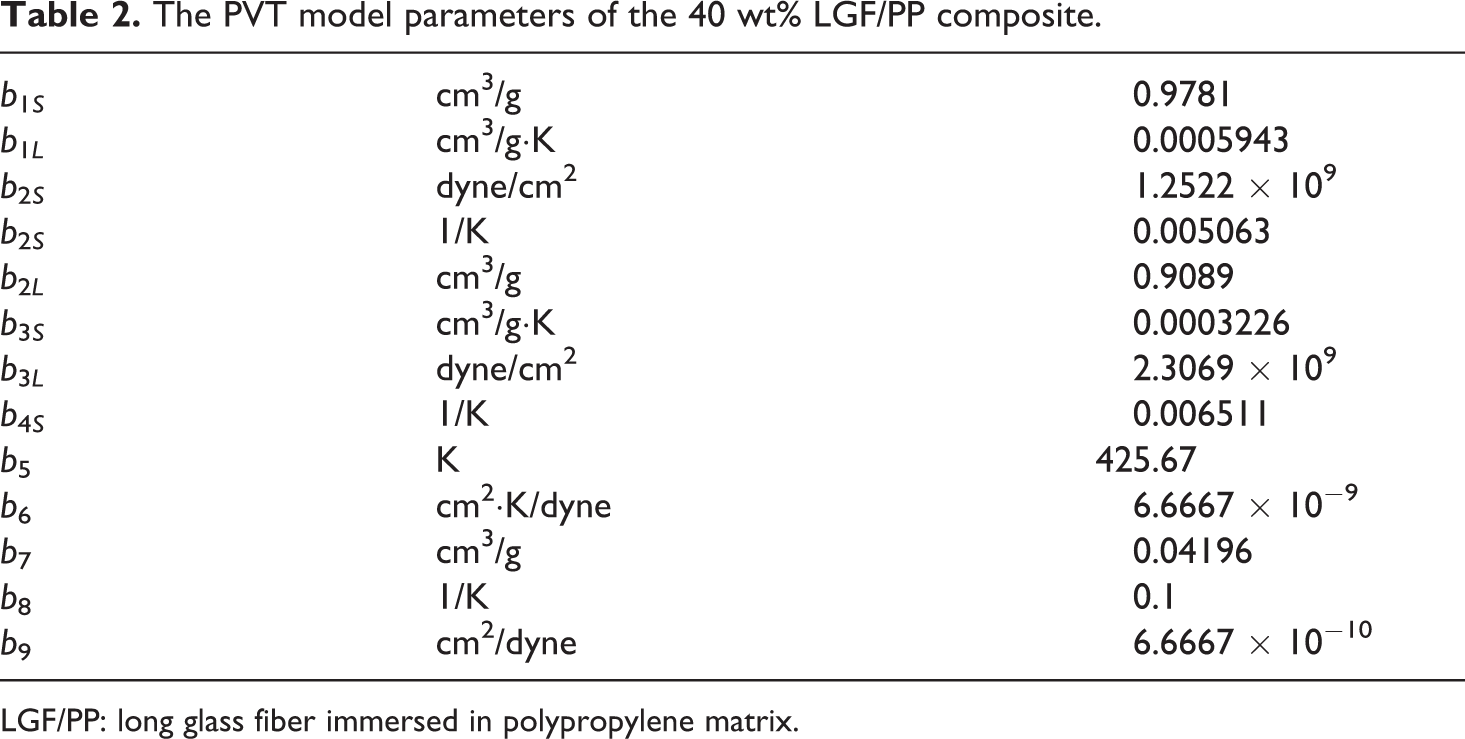
LGF/PP: long glass fiber immersed in polypropylene matrix.
The WLF–Cross viscosity model parameters of the 40 wt% LGF/PP composite.
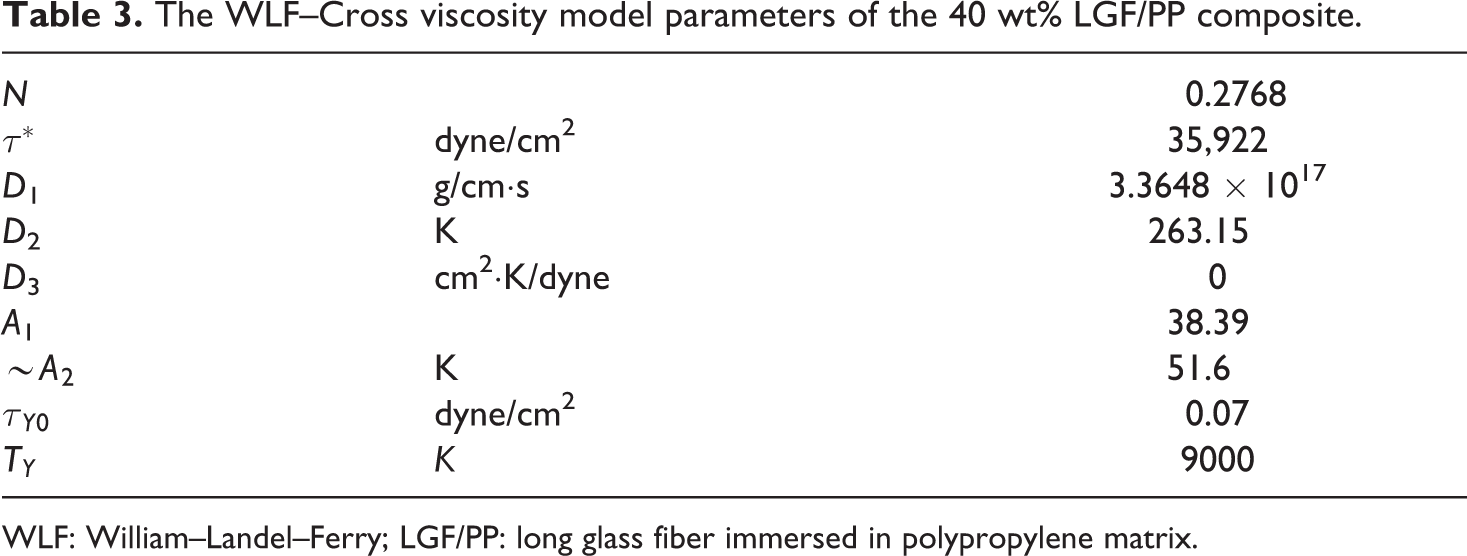
WLF: William–Landel–Ferry; LGF/PP: long glass fiber immersed in polypropylene matrix.
The specific heat and thermal conductivity constants of the 40 wt% LGF/PP composite.
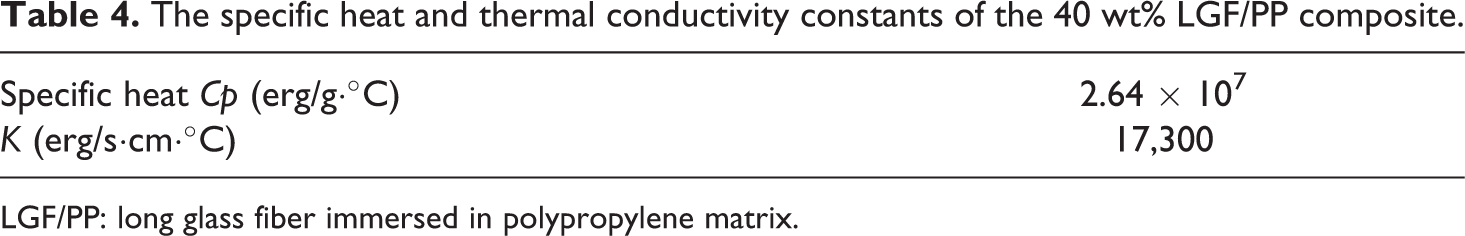
LGF/PP: long glass fiber immersed in polypropylene matrix.
The 3D model was first developed by one of the Computer Aided Design programs and then meshed by creating hexagonal elements with 20 layers, as shown in Figure 1. In this study, the Moldex3D simulation program was used in the disk during the injection molding process. Figure 2 shows the sprue pressure history from the filling stage (0.59 s) to the packing stage (10 s).
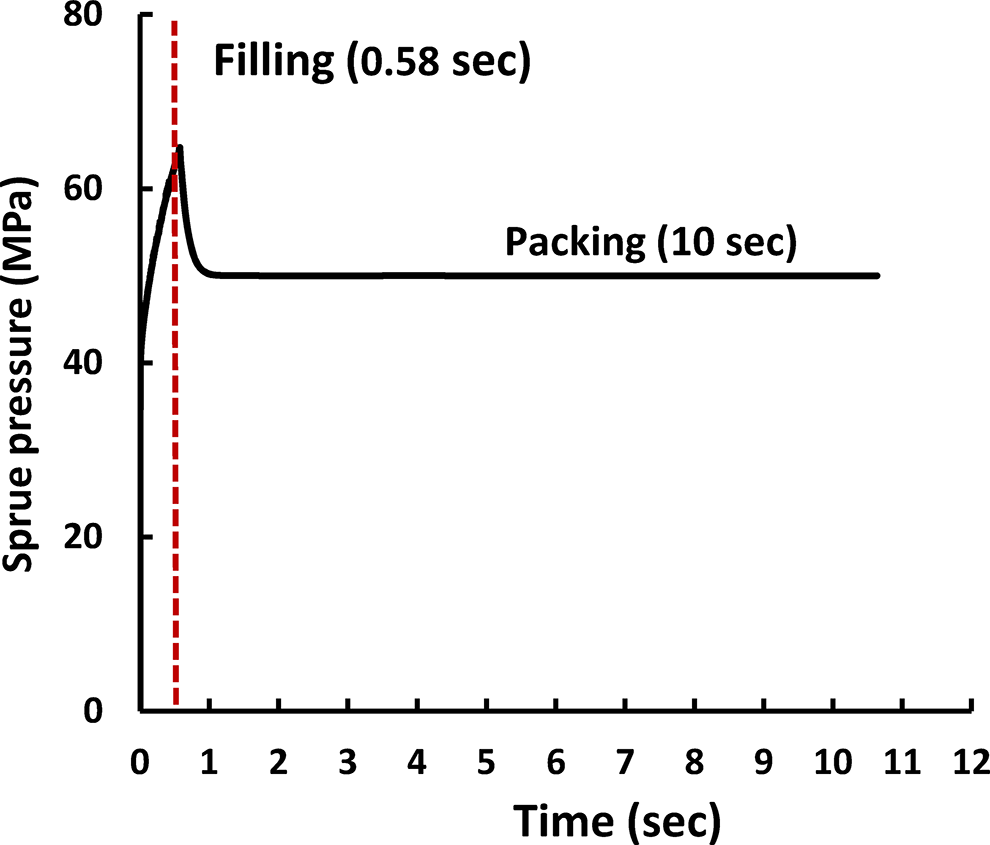
Sprue pressure history from filling stage to packing stage.
For fiber orientation prediction, the iARD-RPR model parameters are listed in Table 5. Additionally, the initial condition of the fiber orientation tensor at the runner entrance is set as the isotropic state. Due to the higher 3D numerical resolution and the runner system consideration in the computation, it was unnecessary to set an experimental inlet condition around a gate for enhancing the accuracy in determining the fiber orientation.
Optimal parameters of the iARD-RPR fiber orientation model for the 40 wt% LGF/PP composite.
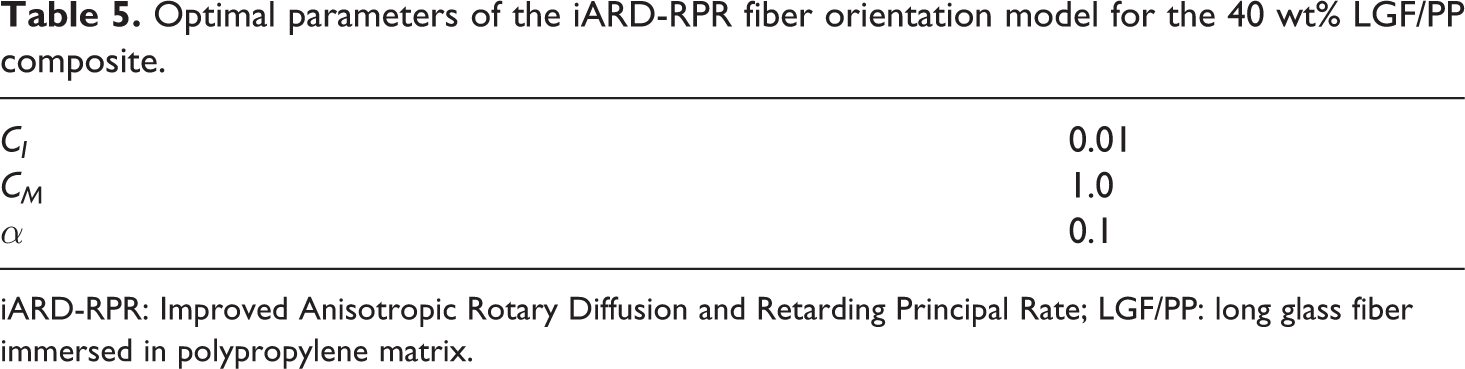
iARD-RPR: Improved Anisotropic Rotary Diffusion and Retarding Principal Rate; LGF/PP: long glass fiber immersed in polypropylene matrix.
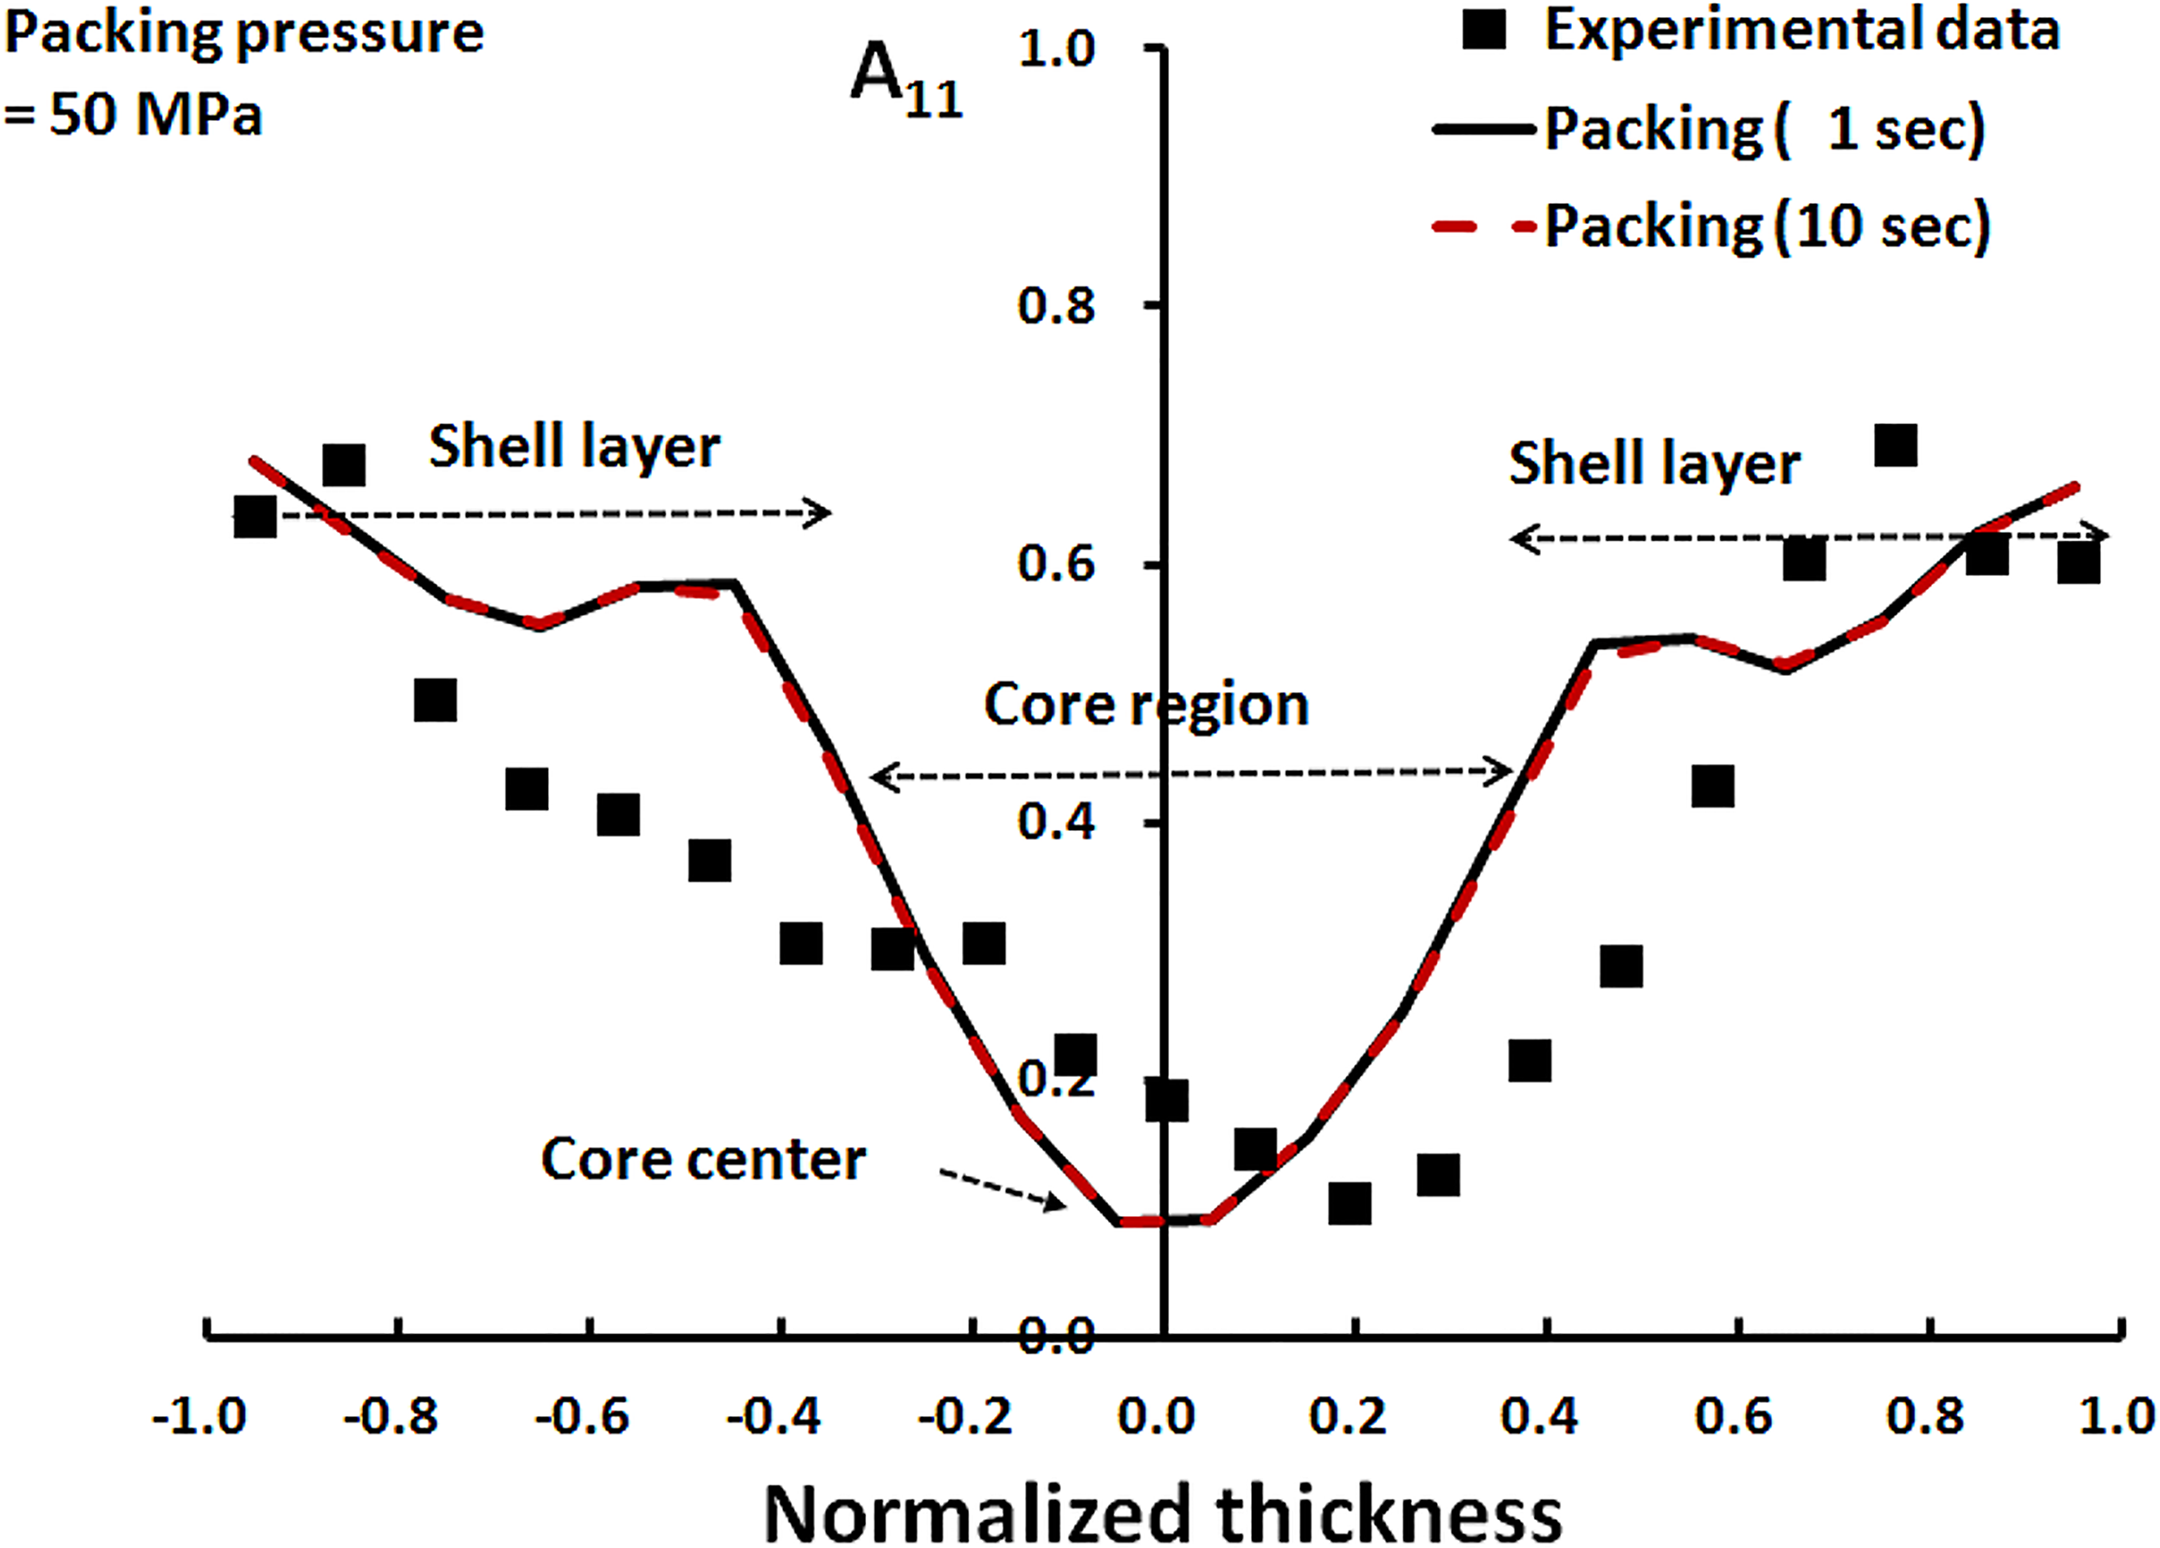
Both fiber orientation components, A 11 and A 22, correspond to the flow and the cross-flow directions, respectively. As a result, Figures 3 and 4 show the predicted gap-wise distribution of fiber orientation tensor components, A 11 and A 22, at the measurement point located at 34 mm in the radial direction. The solid and dash lines are at the end of the filling and packing stages, respectively. For the experimental data on fiber orientation, reference can be made to the PNNL–ORNL report 31 ; these predicted distributions exhibit a distinct core–shell structure. The fibers found in the shell region near the cavity are strongly aligned with the flow direction, as opposed to the others found in the core region near the cavity center, which are transverse to the flow. In particular, the core width of the orientation distribution for the filling is obviously broader than that for the packing. Significantly, this prediction is in qualitative agreement with the earlier experimental results on long fibers in the study by Bailey and Rzepka, 5 who concluded that the core thickness is reduced during packing. As a whole, the iARD-RPR predictions for the core region and shell layers agree fairly well with the PNNL–ORNL results of the fiber orientation data.
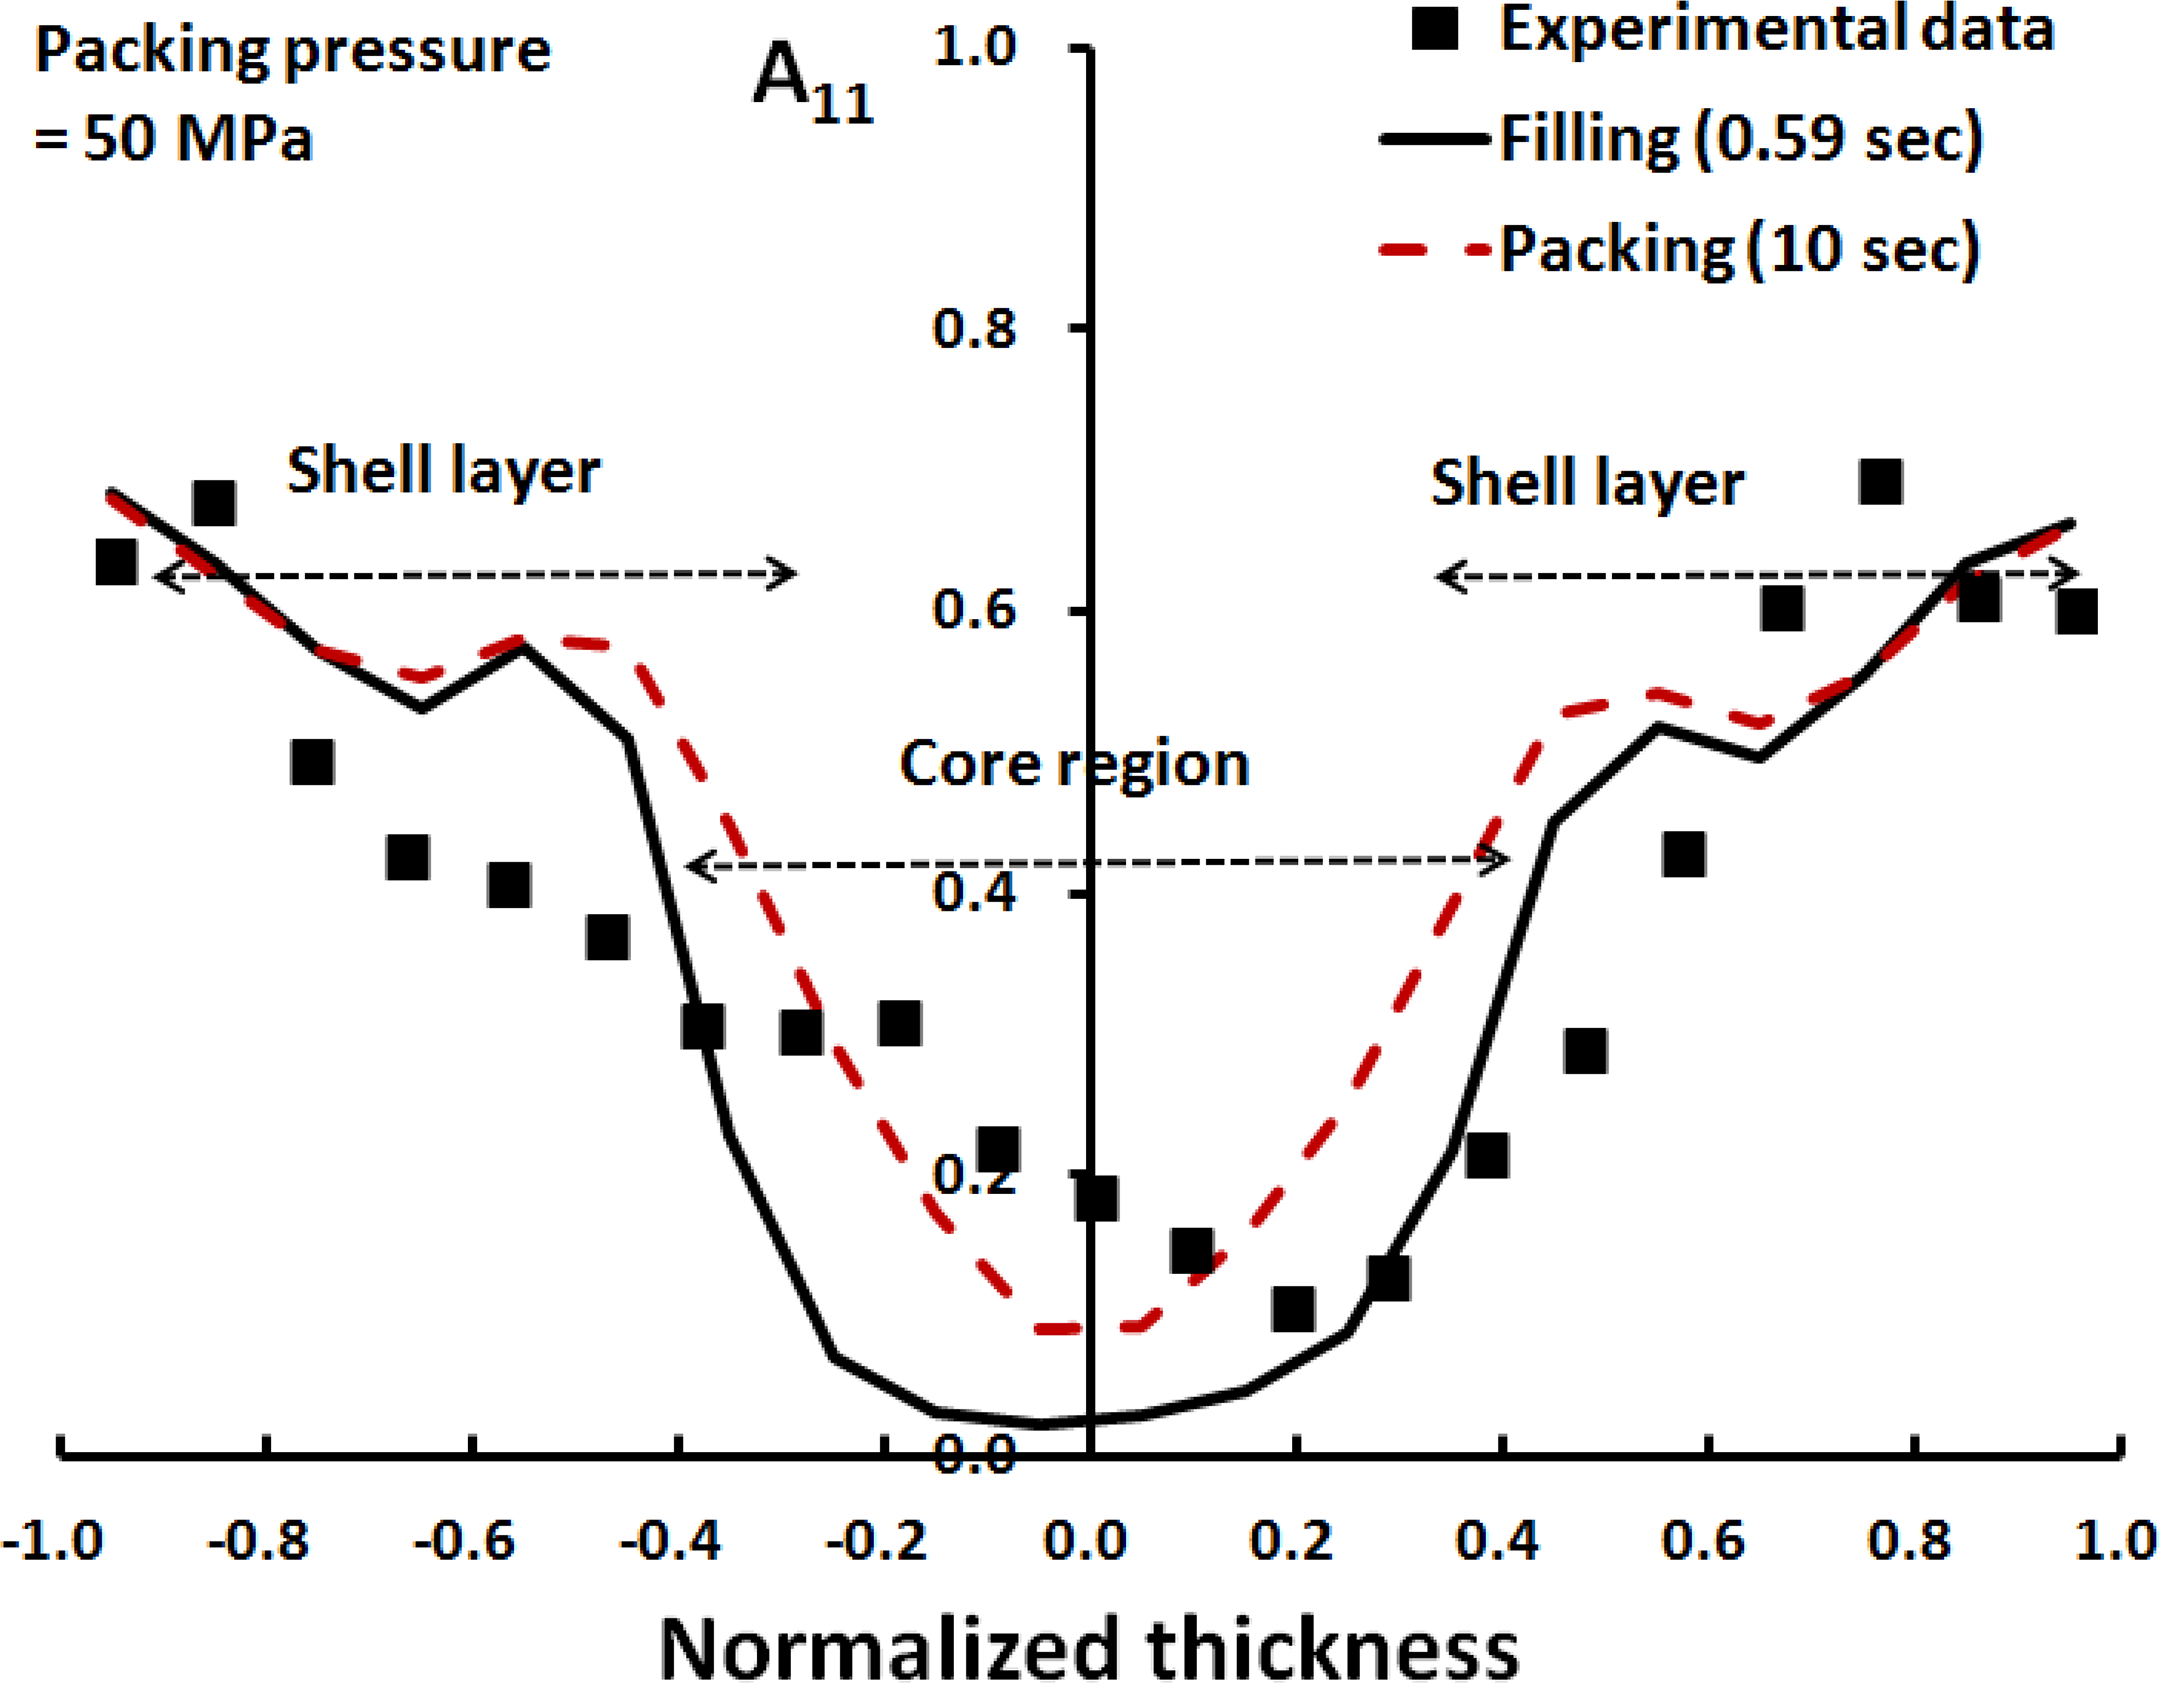
Comparison of the predicted orientation distributions along the flow directions through normalized thickness at the measure point for the filling and packing stages with experimental validation for the 40 wt% LGF/PP composite. LGF/PP: long glass fiber immersed in polypropylene matrix.
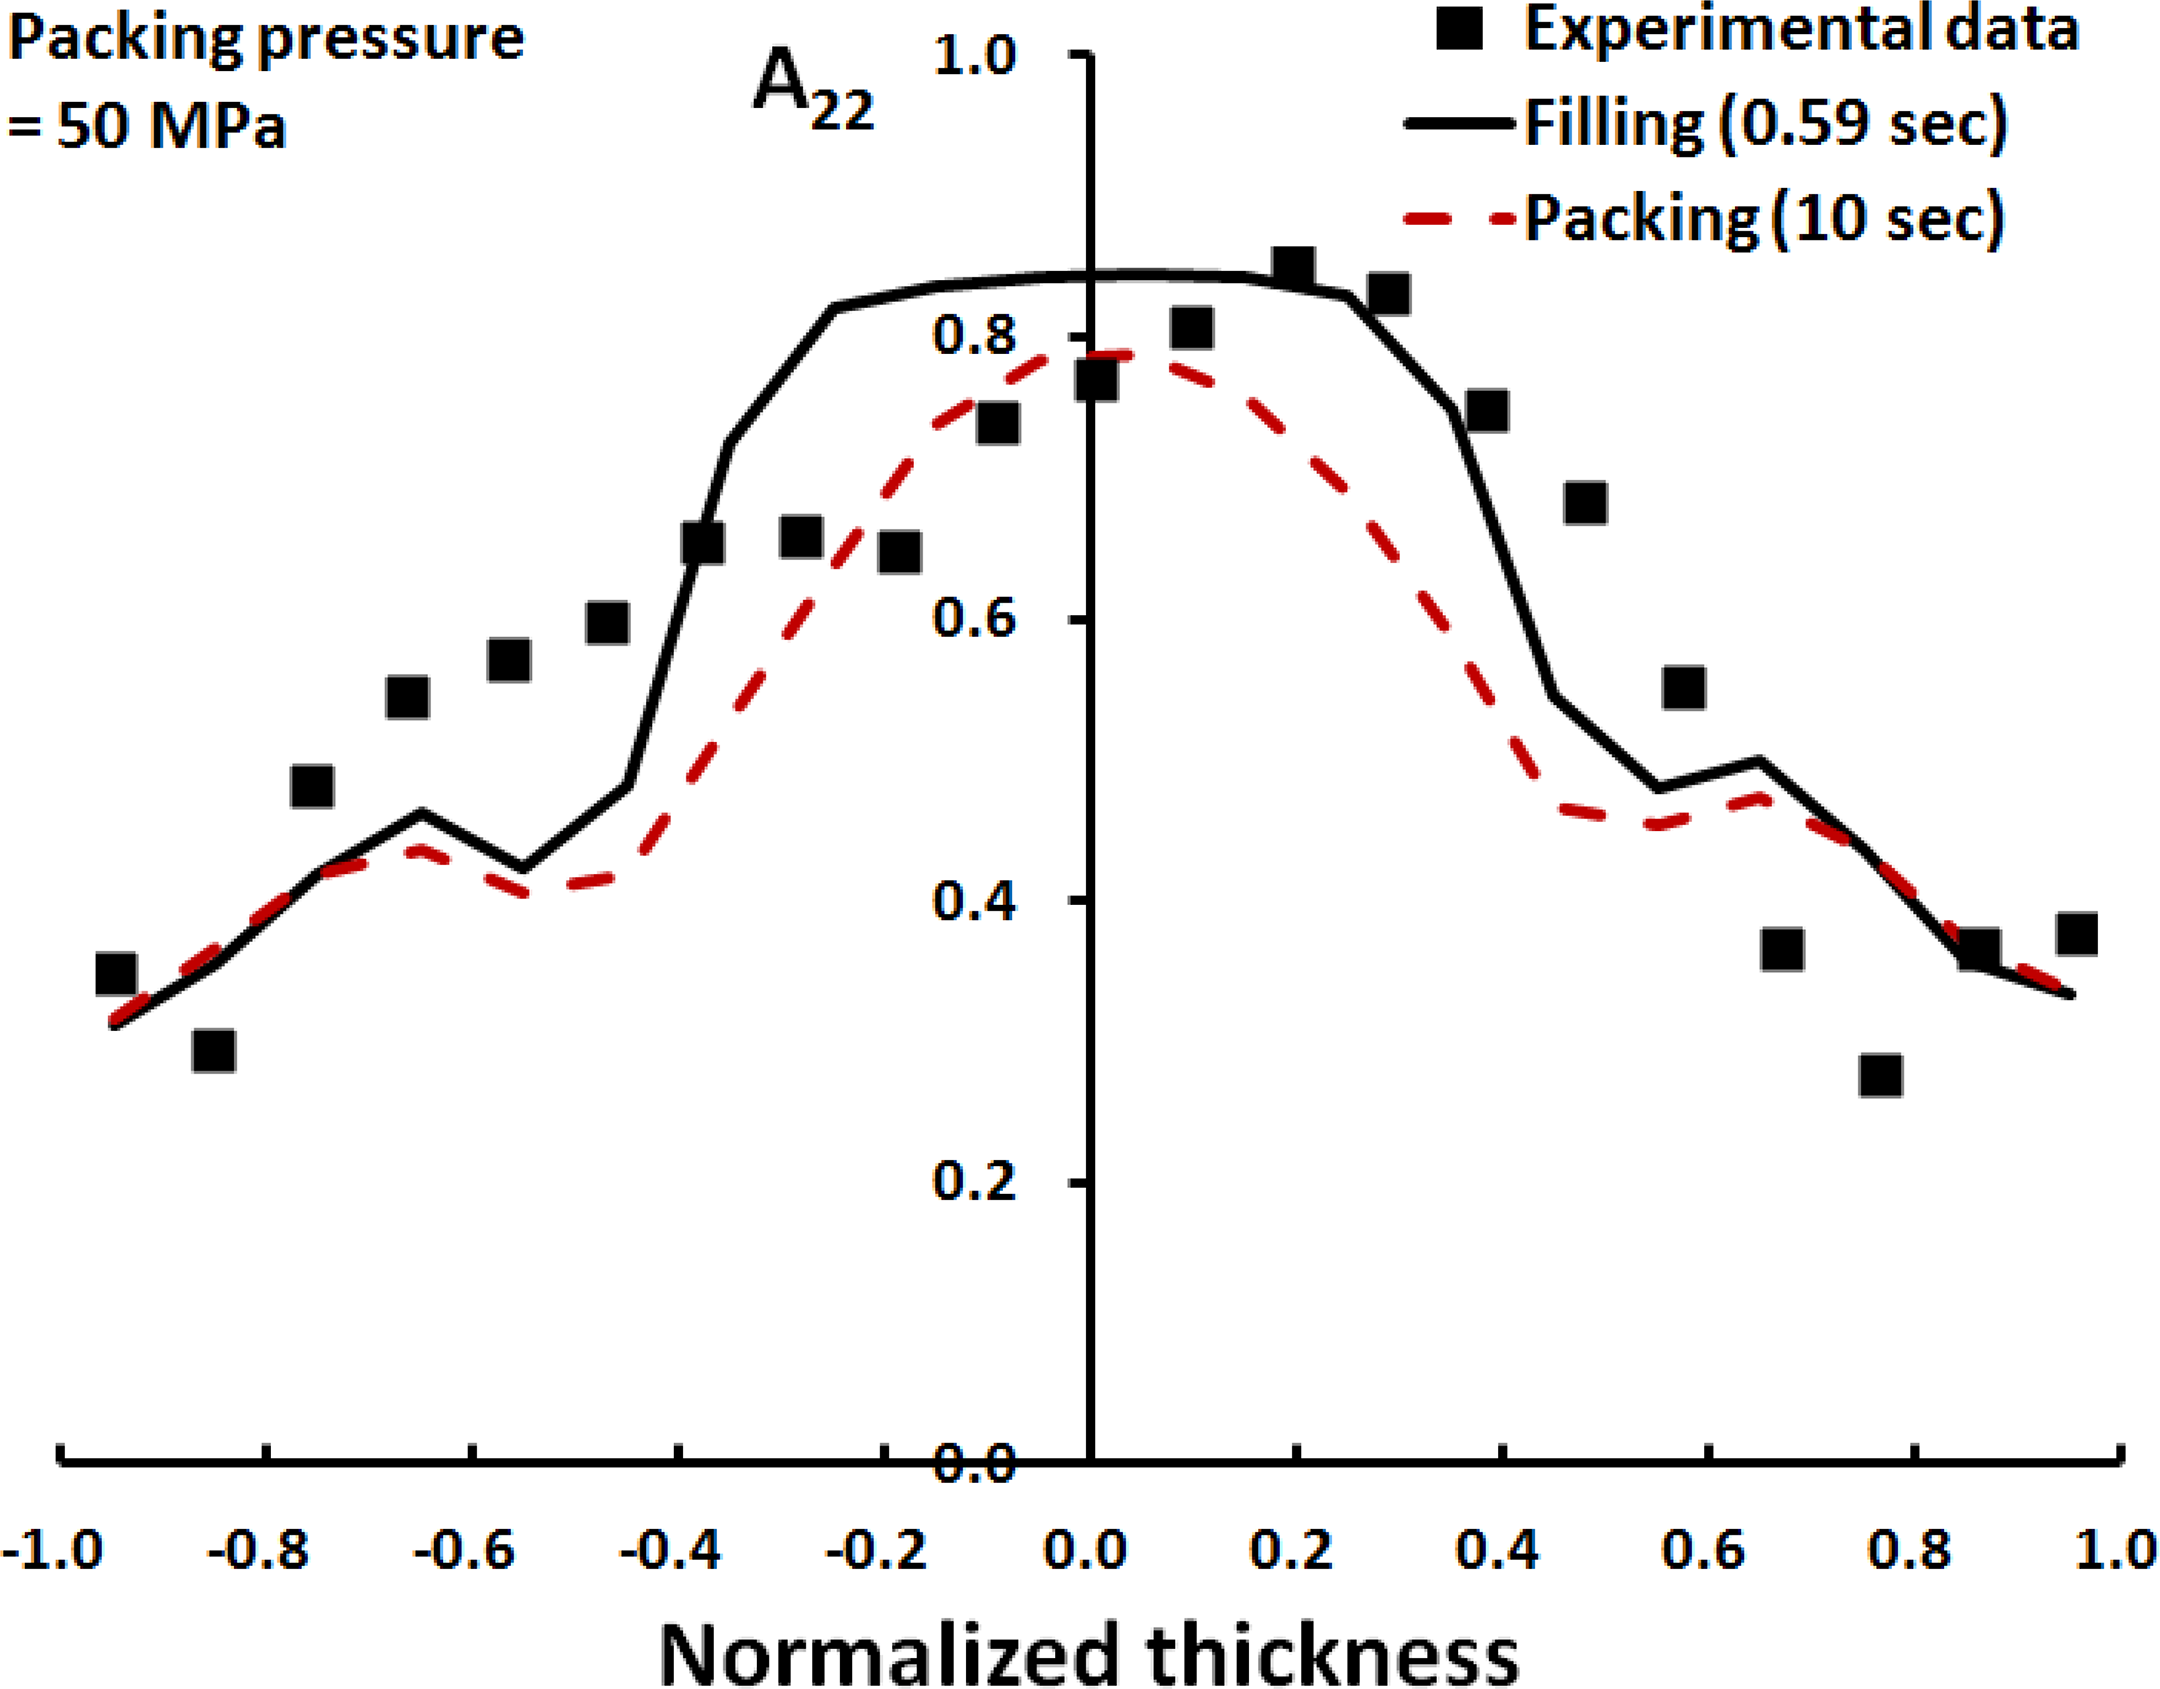
Comparison of the predicted orientation distributions along the cross-flow directions through normalized thickness for the filling and packing stages with experimental validation for the 40 wt% LGF/PP composite. LGF/PP: long glass fiber immersed in polypropylene matrix.
After a cavity has been completely filled, the density and viscosity of a compressible polymeric melt affect the state of fiber orientation during the packing stage. Bailey and Rzepka 5 proposed the mechanism of the large viscosity gradient from the lower viscosity of the core region to the higher viscosity of the shell layer during the packing stage. According to the simulation, Figure 5 shows the density profile at the measurement point through normalized thickness at this point, for a comparison of the filling and the packing stages. There is an obvious compressible effect during the packing stage since the packing density is higher than the filling density.
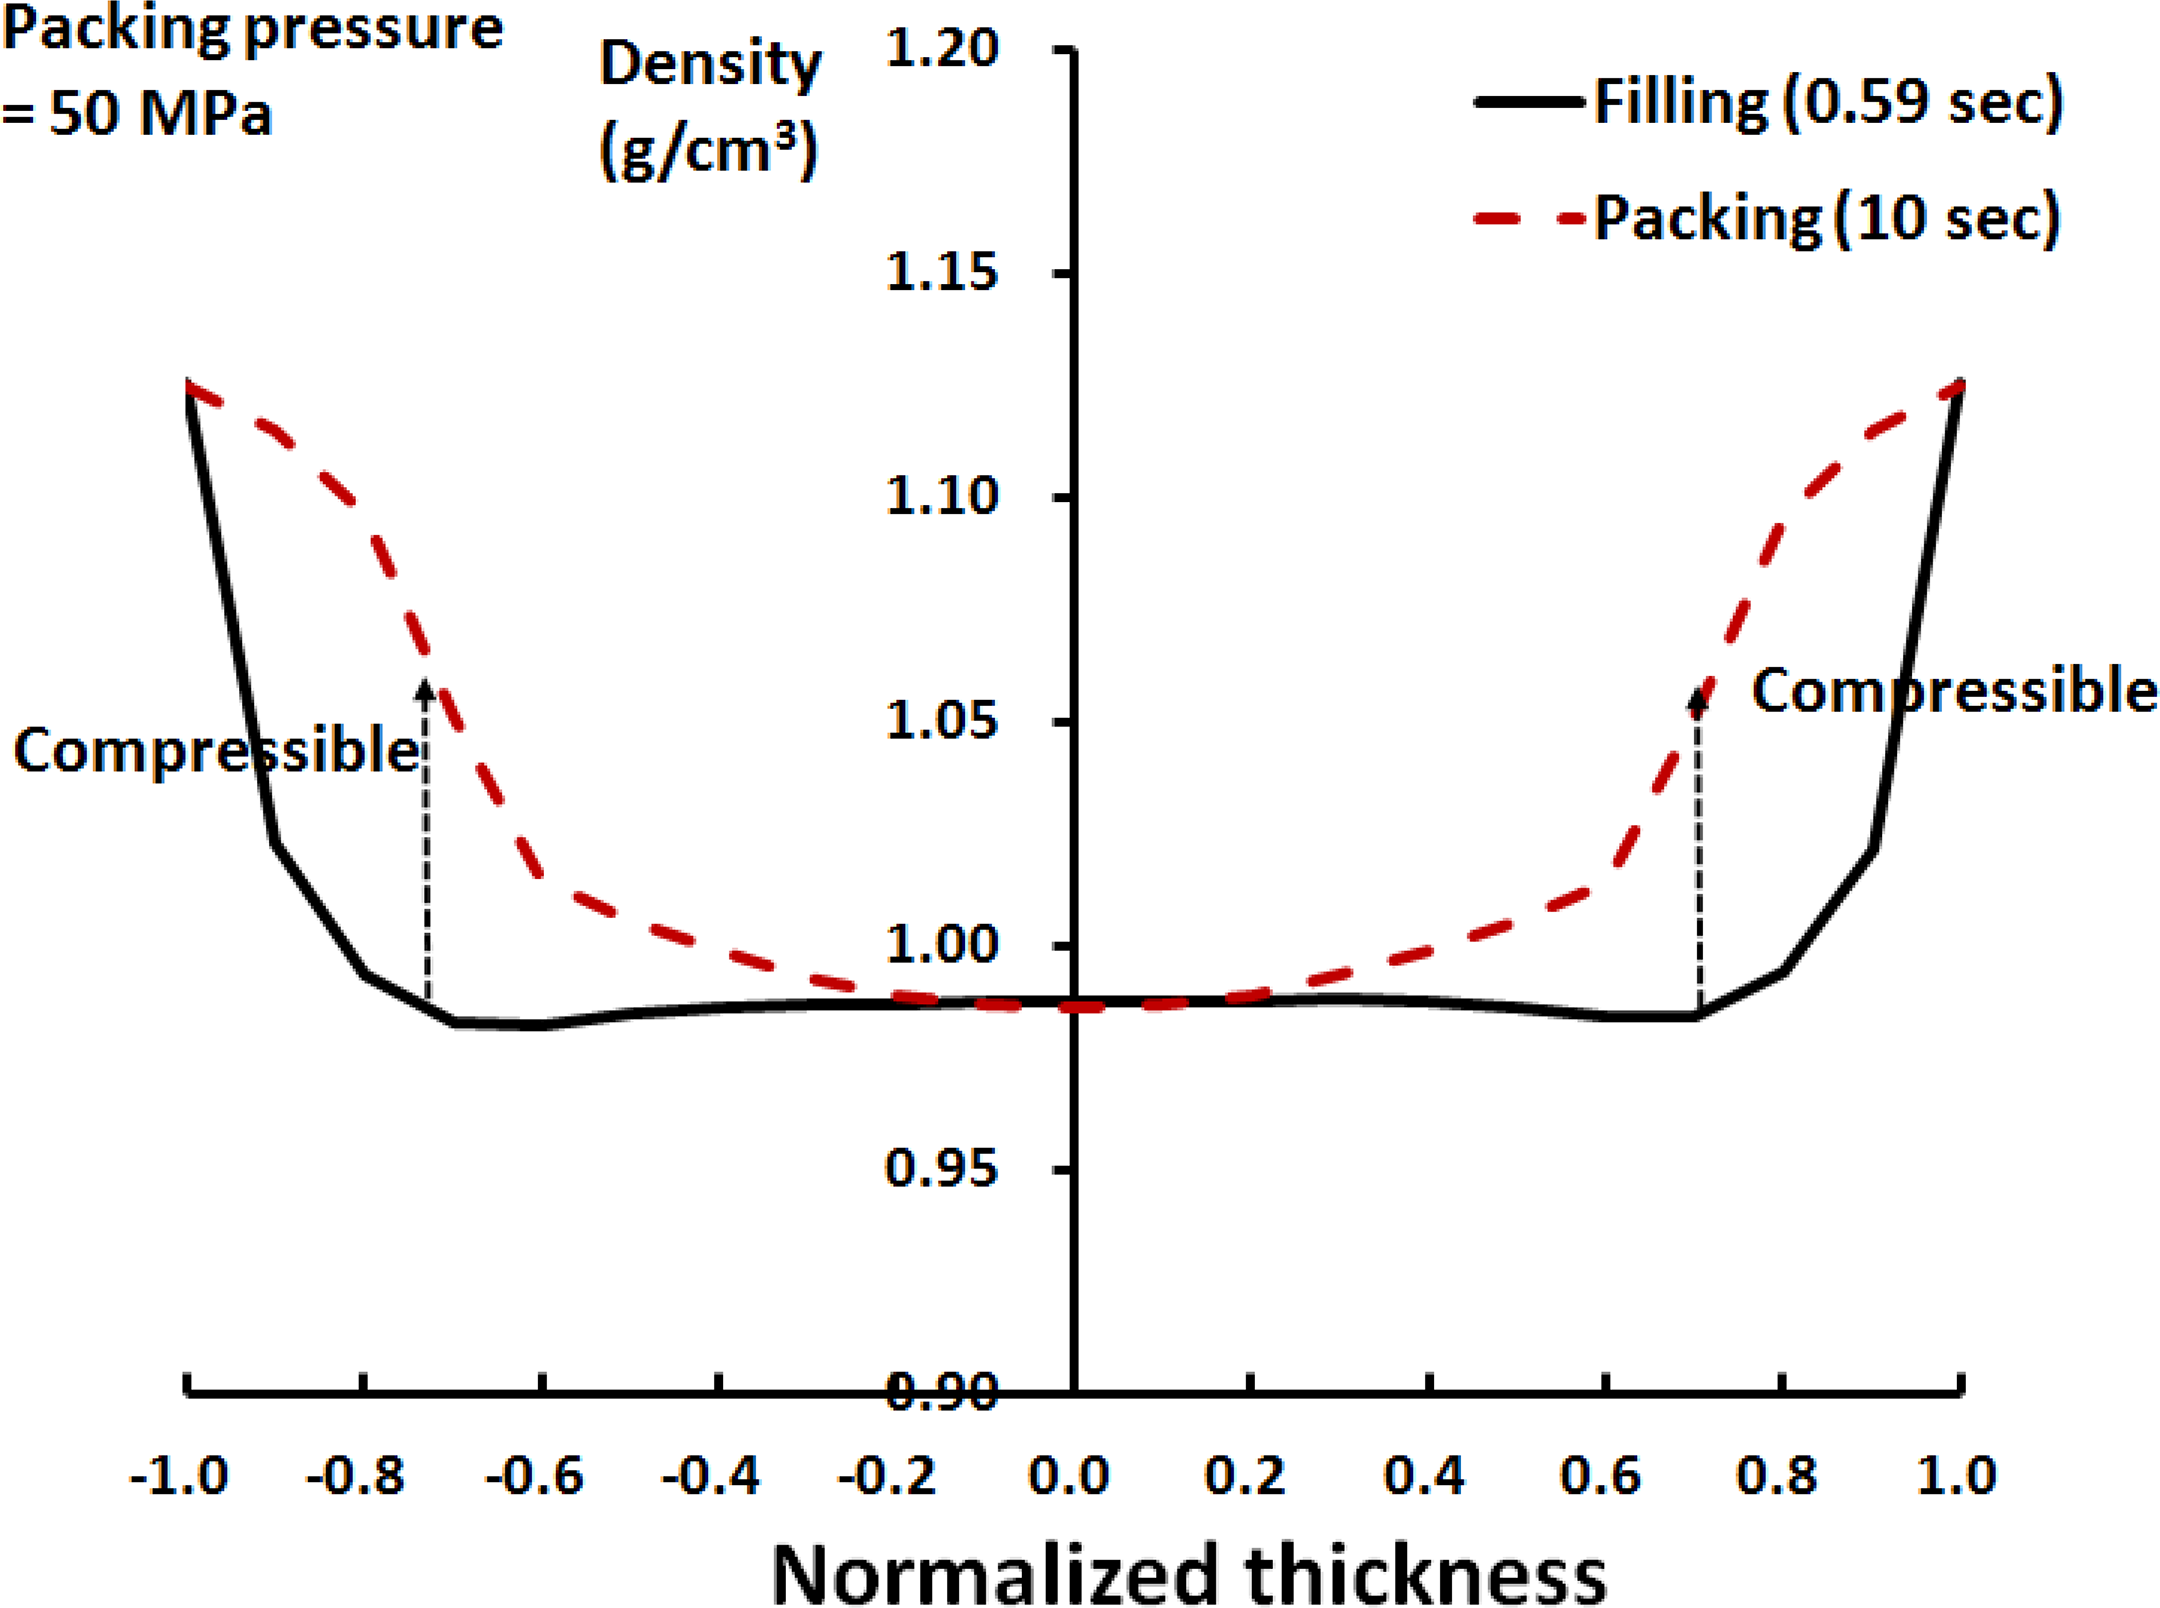
Density profile through normalized thickness at the measure point for the filling and packing stages.
Moreover, Figure 6 presents the shear viscosity profile on a logarithmic scale for a comparison of the filling and packing stages. During the filling, the shell viscosity is lower than the core viscosity. In other words, fibers at the shell layer easily align along the flow direction due the lower flow resistance. Near the boundary close to the cold mold, a very high viscosity due to the frozen fluid is found. In contrast to the packing, the core viscosity is lower than the shell viscosity, namely involving an increase in the flow-direction fiber orientation A 11. Thus, this predicted finding supports the viscosity gradient proposed by Bailey and Rzepka 5 for a reduction of core thickness or an increase of fiber orientation during the packing. This result is attributed to the packing-induced flow in the core region.
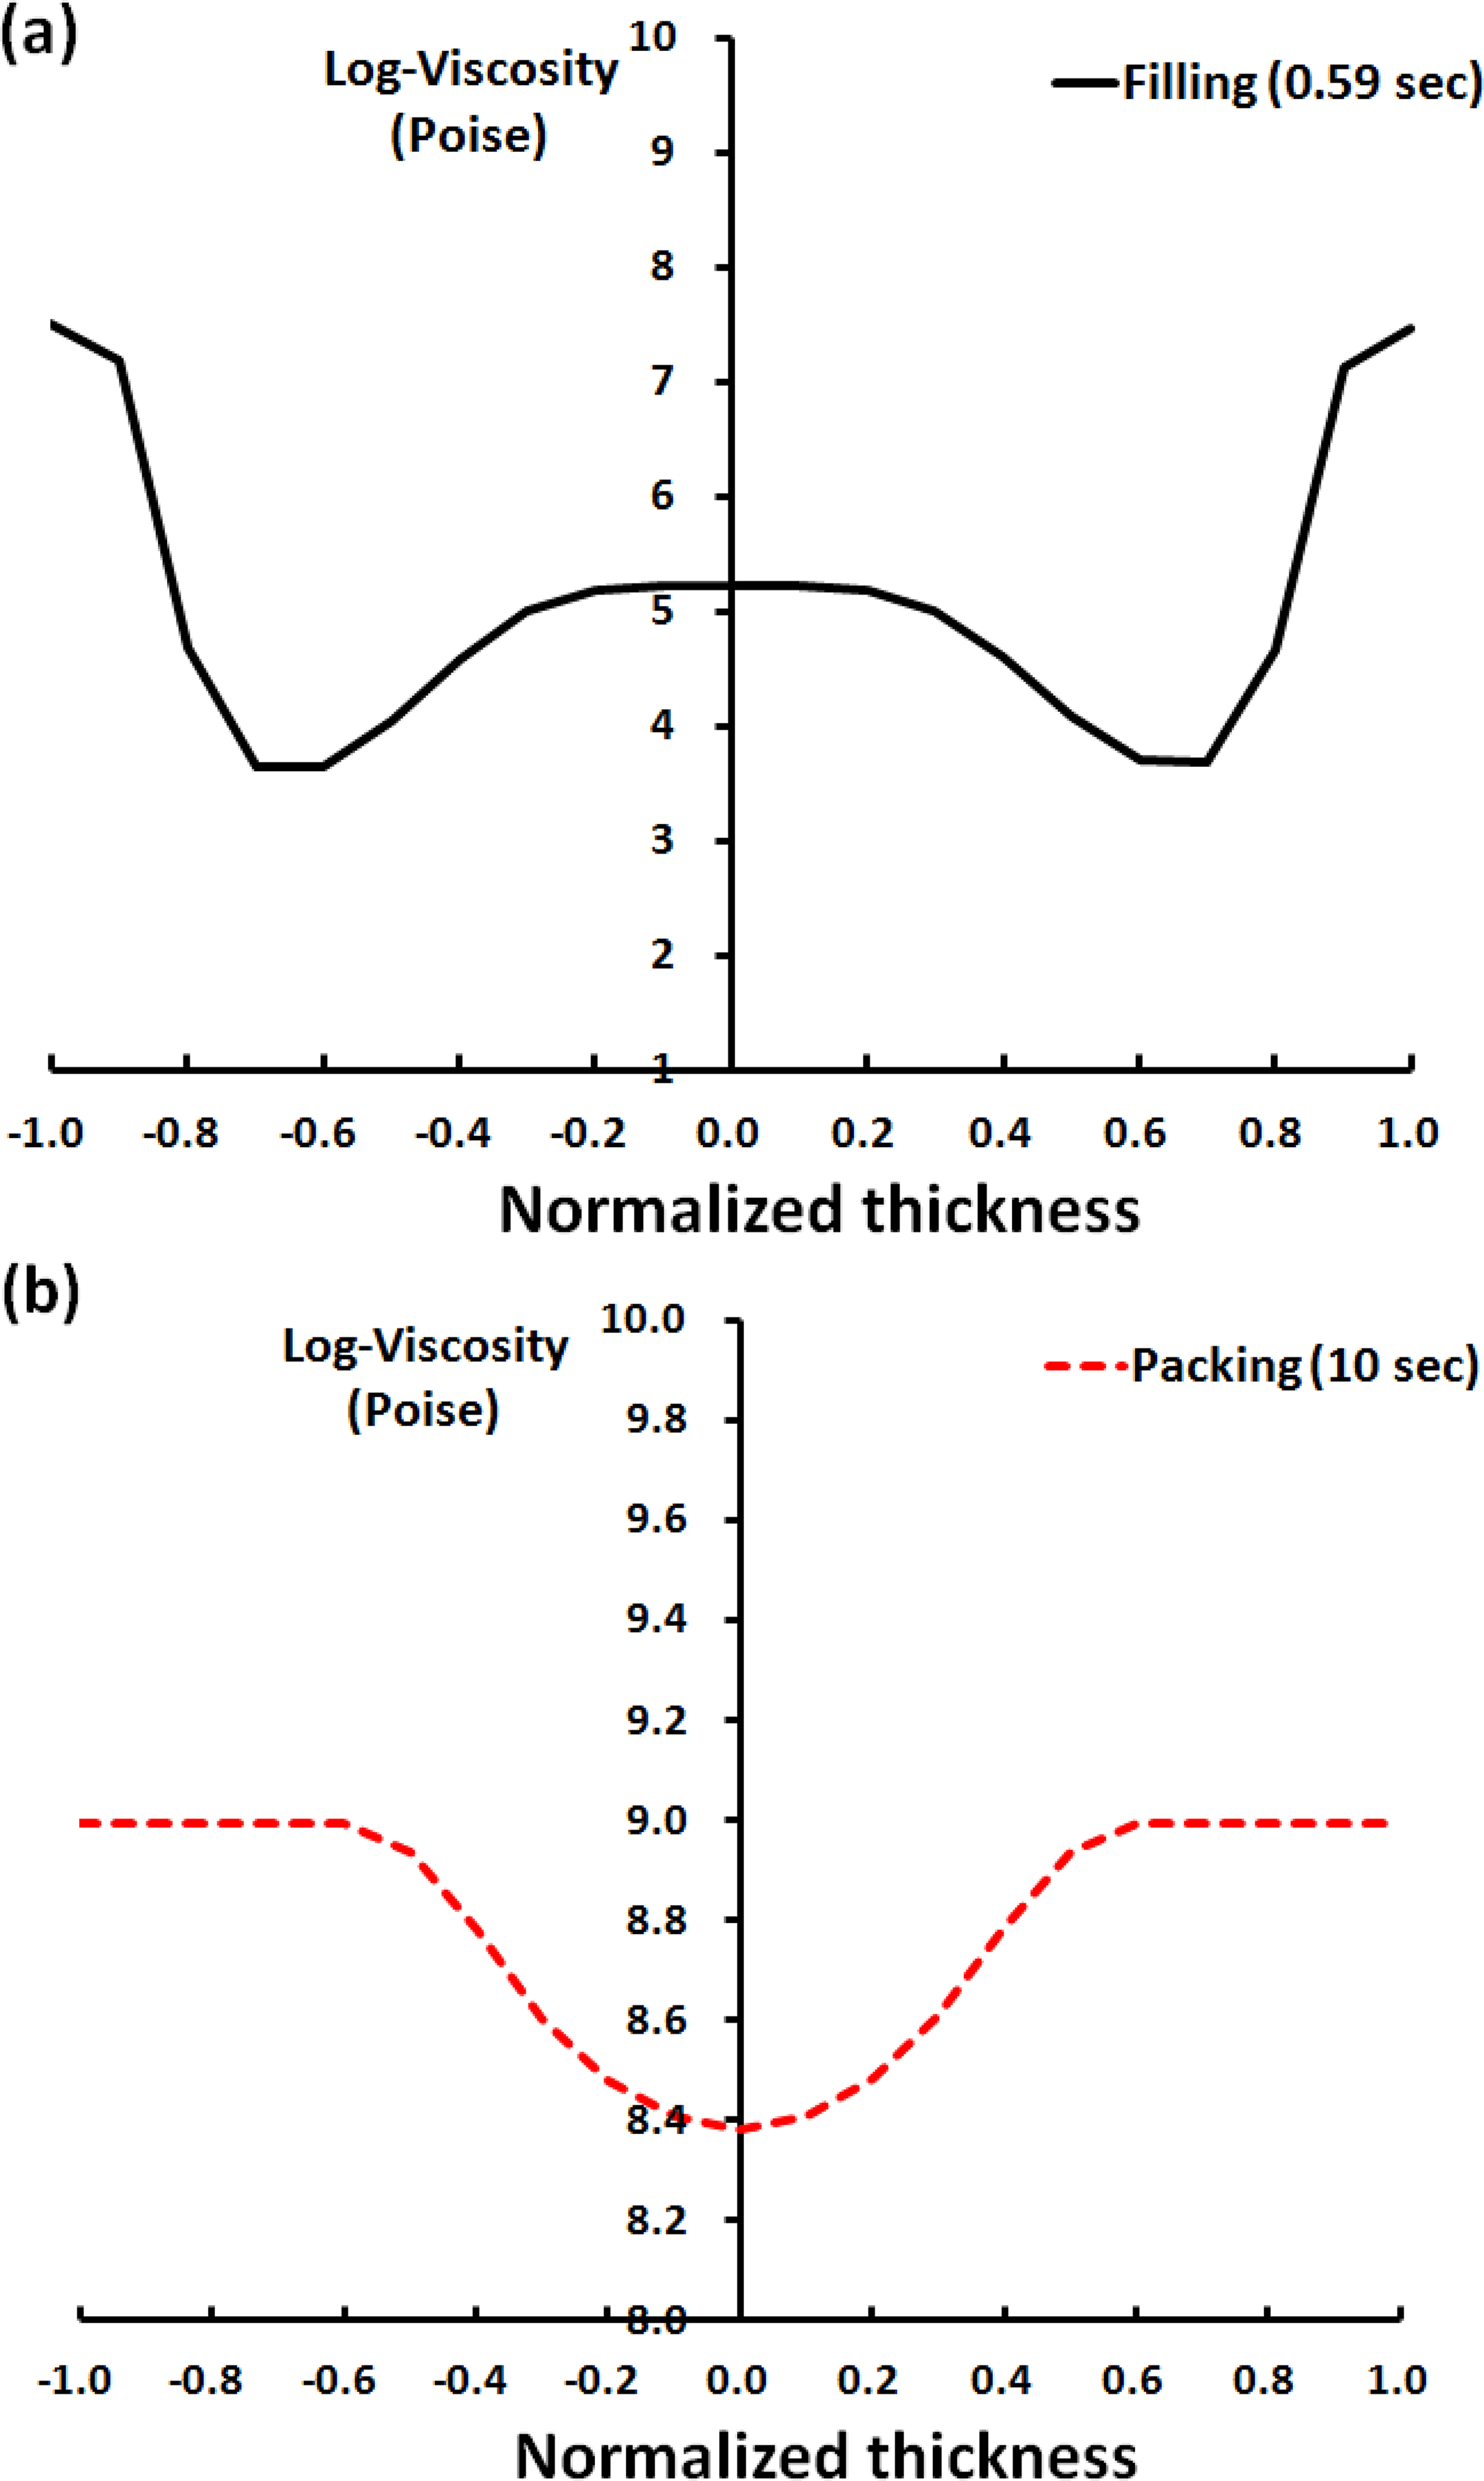
Viscosity profile on a logarithmic scale through normalized thickness at the measure point for a comparison of filling stage and packing stage.
Furthermore, Figure 7 exhibits the flow-direction fiber orientation A 11 distribution at two various packing times, 1.0 and 10 s under constant packing pressure of 100 MPa. Obviously, the A 11 distribution is kept almost constant. In addition, there is a small change in the fiber orientation distribution at two packing pressures, 100 and 500 MPa under constant packing time of 10 s, as shown in Figure 8. There is a slight reduction of core thickness under a strong packing pressure. These predicted results also agree with Bailey and Rzepka’s experimental observation. 5
Flow-direction fiber orientation composite normalized thickness at the measure point for various packing times.
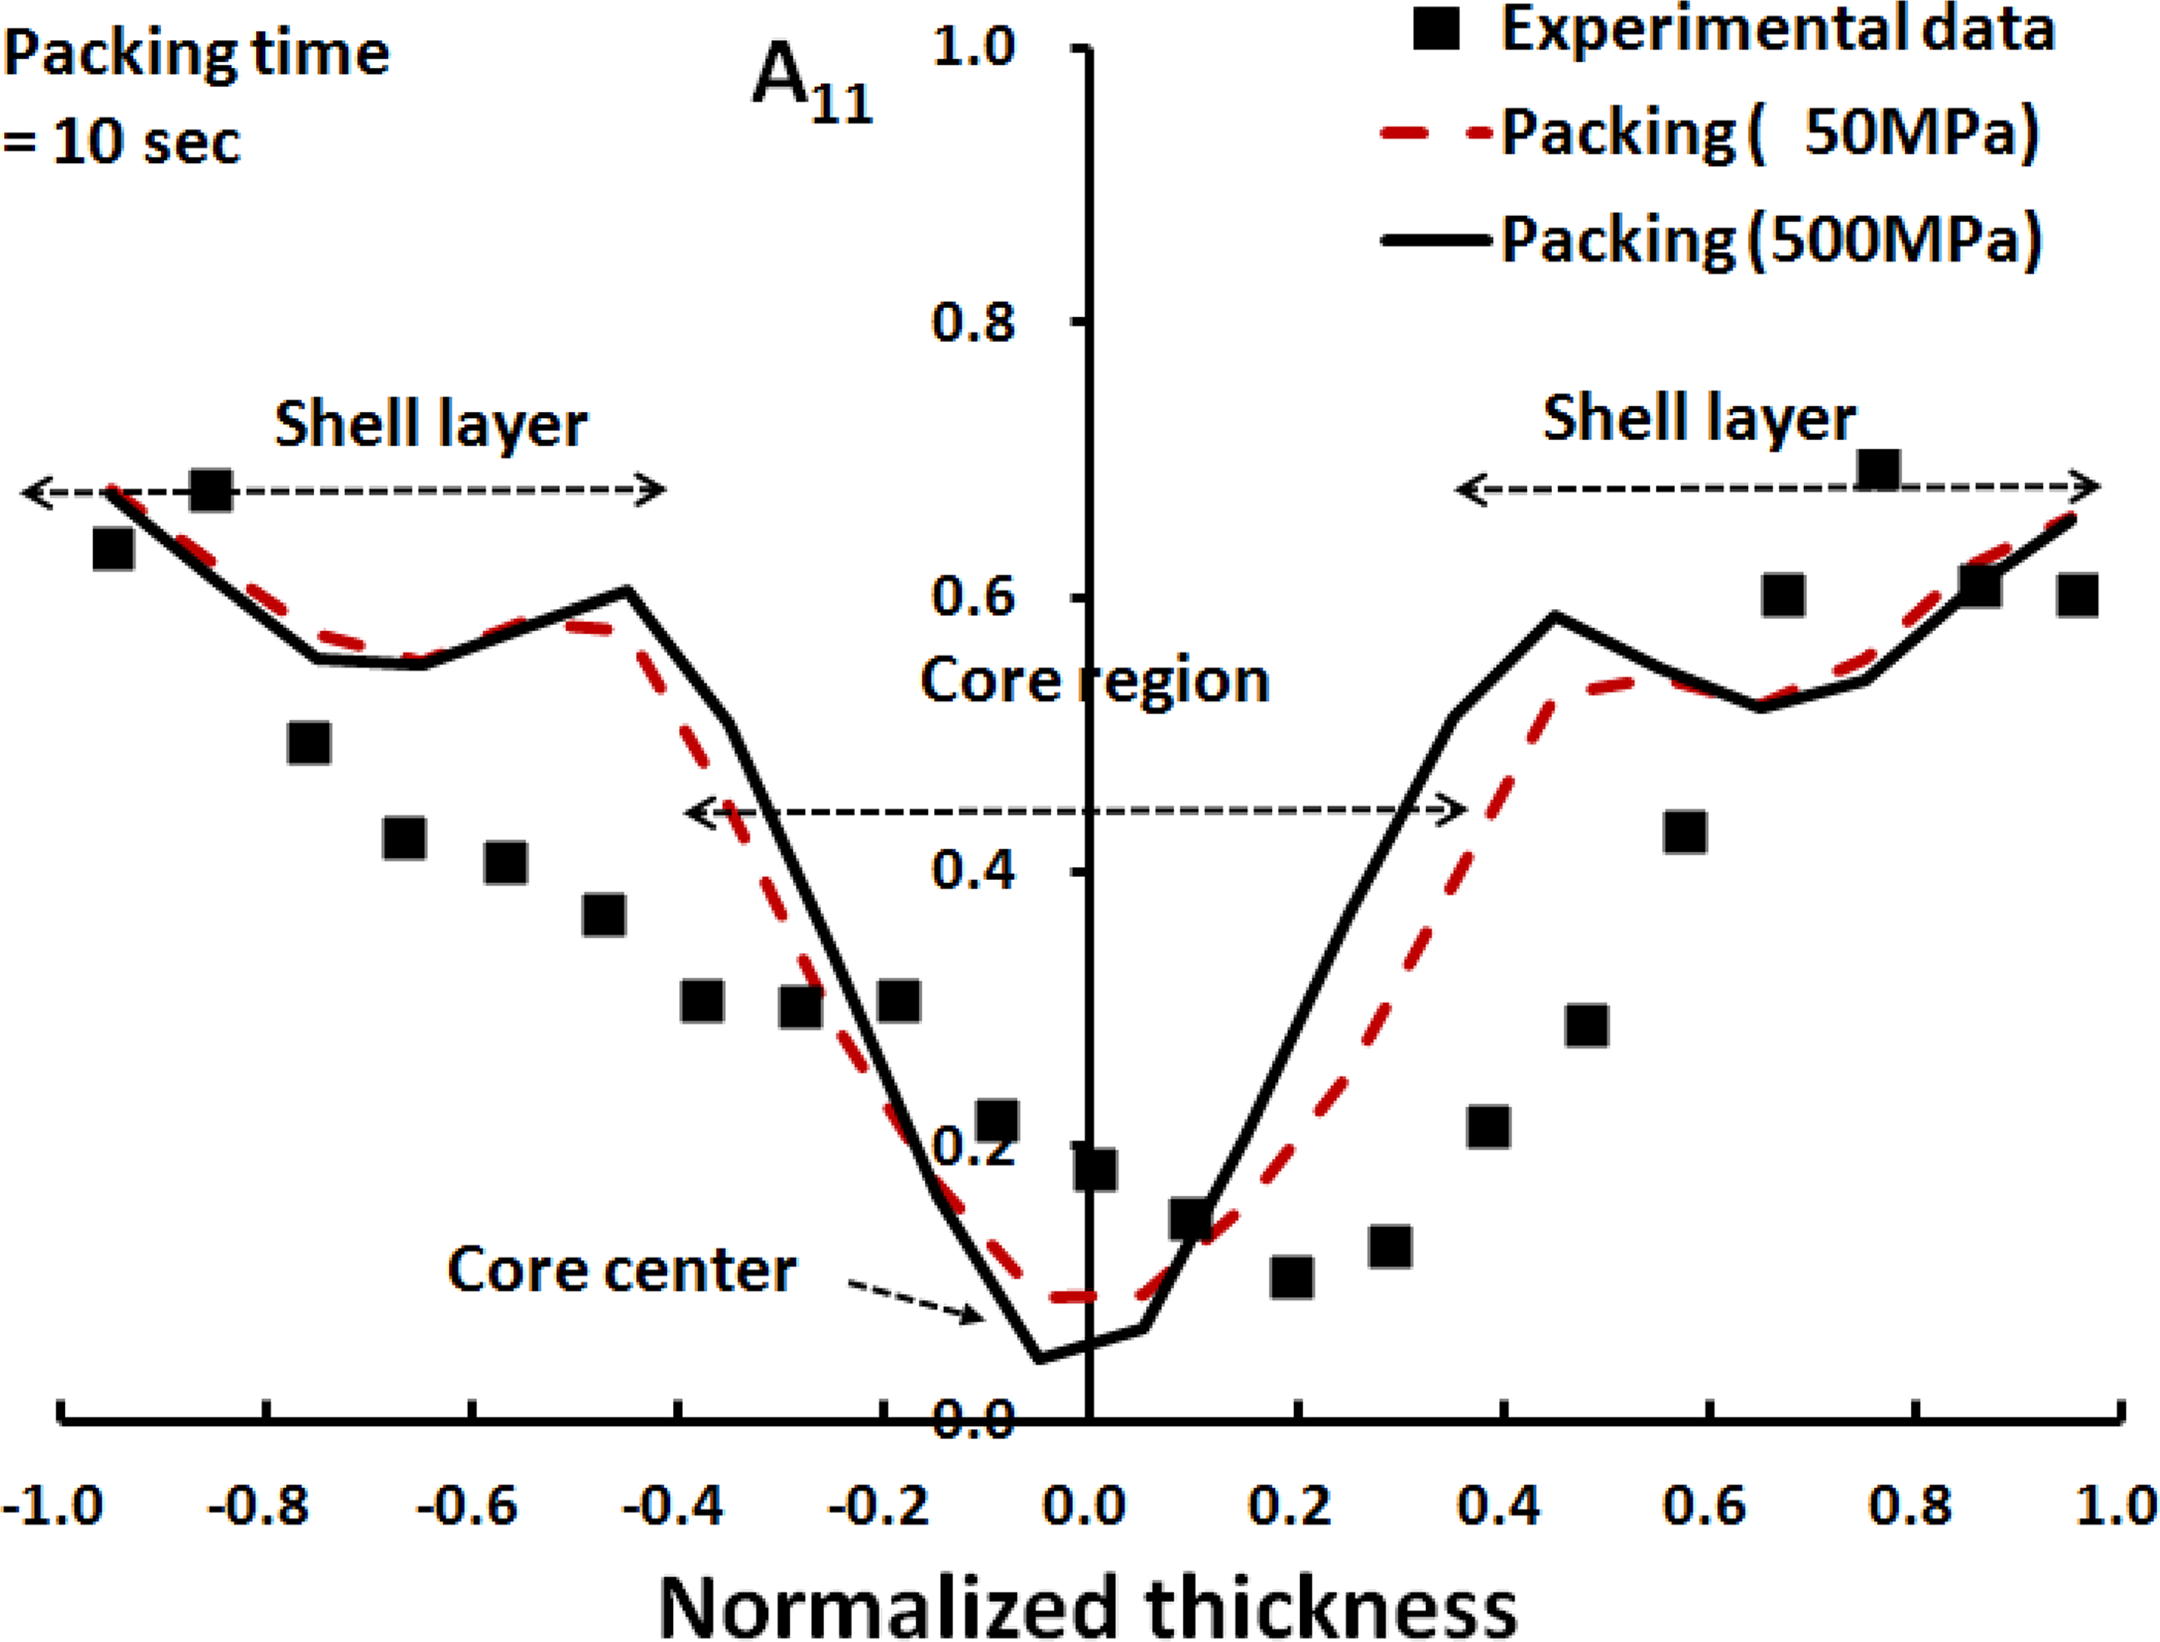
Flow-direction fiber orientation composite normalized thickness at the measure point for various packing pressures.
Conclusions
In the past, fiber orientation states were merely determined in the filling stage for injection molding simulation based on the 2.5D or Shell computational algorithm. In this study, we focused on the injection molding process of the center-gated disk from the filling to the packing stage for long glass fiber composite. By employing the state-of-the-art technology of 3D injection molding simulation, our ultimate goal was to demonstrate the effect of the packing stage on fiber orientation. The packing core width of the orientation distribution is obviously narrower than that of the filling due to the high viscosity gradient. Furthermore, the fiber orientation distribution is almost unchanged at various packing times, whereas the great packing pressure slightly influences the core thickness reduction. The predicted results also agree with the previous experiments. Therefore, we believe that the effect of the packing on fiber orientation is primary for a real, bigger, complex geometry of designing high-quality automotive parts, such as various changes in the direction of the flow, the inclusion of ribs, and the changes in the thickness and holes.
Footnotes
Declaration of Conflicting Interests
The author(s) declared no potential conflicts of interest with respect to the research, authorship, and/or publication of this article.
Funding
The author(s) received no financial support for the research, authorship, and/or publication of this article.