
Abstract
Sponge-gourd fibers (SGFs) were subjected to chemical treatments such as alkalization, acetylation, and benzoylation by 5−15 wt% sodium hydroxide, acetic anhydride, and benzoyl chloride solutions, respectively, in order to improve fiber–matrix adhesion. SGF-reinforced polylactic acid (PLA) biocomposites were fabricated using melt compounding technique. Both untreated and chemically treated fiber-reinforced composites were subsequently characterized by using a field emission scanning electron microscope, a Fourier-transform infrared spectrometer, an X-ray diffractometer, a universal testing machine, and a thermogravimetric analyzer. Structural analyses show that the chemical treatment improves the crystallinity of SGF and exhibits chemical bond formation in the SGF-reinforced PLA composites. Surface morphology indicates that after the treatment of fibers and increase in the treated fiber content, the interfacial adhesion between PLA and fibers is improved. The effects of fiber loading of chemically treated SGF on physical and mechanical properties of the composites were analyzed. Compressive strength of the composites was increased by 10–35% with incorporation of treated fibers into the PLA matrix. The thermal stability of them is found to increase significantly. Soil burial test has confirmed that the composites are biodegradable. Benzoylation of SGF shows superior mechanical properties and enhances thermal stability among the composites.
Keywords
Introduction
Polylactic acid (PLA) is highly versatile, aliphatic polyester derived from 100% renewable resources. Among biodegradable plastics, PLA has been one of the most promising candidates for various applications, because of its agricultural origin and biodegradability. 1 High-molecular-weight PLA is generally prepared by the ring-opening polymerization of lactide, which, in turn, is obtained from the fermentation of renewable resources such as corn, potato, and sugar beet. 2,3 On the other hand, it is well known that the fiber reinforcement is a viable method to improve the material properties of biodegradable polymers and to reduce the overall costs of the prepared materials. 4 Depending on the source, fibers are largely divided into two categories: natural and synthetic. Synthetic fiber-reinforced thermoplastic composites have better mechanical properties than natural fibers (NFs), but they are not environmentally friendly. 5 It is notable that NFs have many advantages compared with synthetic fibers. For instance, they have relatively low weight, high strength, and stiffness and are biodegradable. They also cause no skin irritations. 6,7
Sponge gourd (SG; Luffa cylindrica) is a tropical and subtropical vegetable belonging to the family of Cucurbitaceae, which produces fruit containing fibrous vascular system. Sponge-gourd fiber (SGF) is such an NF extracted from the sponge-gourd plants and is extensively grown in Bangladesh. Recently, the uses of SGF as reinforcing material in fabrication of polymer–SGF composites have raised great interest and expectations among materials scientists and engineers. 8 –19
The primary advantages of using this fiber as an additive in polymer are that it has low cost, low density, nonabrasive nature, high possibility of filling levels, low energy consumption, high specific properties, biodegradability, wide varieties, availability throughout the world, and a generation of rural/agriculture-based economy. The chemical composition of SGF depends on plant origin, weather conditions, soil, and so on. The cellulose, lignin, and hemicellulose content vary from 55% to 90%, 10% to 23%, and 8% to 22%, respectively. 17
SGF is hydrophilic in nature and absorbs moisture from the environment. This characteristic of the fibers leads to poor adhesion with polymer matrix, ultimately causing debonding between fiber and matrix. In wet conditions, therefore, such composites show very poor mechanical and thermal properties. Therefore, it is necessary to modify the fiber surface without genetic manipulation in order to alleviate hydrophilicity of the fiber so that its adhesion with the hydrophobic moiety of polymers can be improved. It is expected that sodium hydroxide (NaOH), acetic anhydride ((CH3CO)2O), and benzoyl chloride (C6H5COCl) chemical treatments disrupt hydrogen bonding in the network structure, thereby increasing surface roughness. 20 These treatments remove a certain amount of lignin, waxes, and hemicelluloses of the fiber cell wall, depolymerize cellulose, and expose the short-length cellulose fibril. 21
Alkali treatment on NFs is a very common method usually used to remove hemicelluloses and lignin from them. 22 This treatment increases hydrophobicity and leads to breaking down of the composite fiber bundle into smaller fibers. It also reduces fiber diameter and thereby increases the aspect ratio, which leads to the formation of a rough surface topography that results in better fiber–matrix interface adhesion. 23 Furthermore, this treatment also increases the number of possible reactive sites and allows better fiber wetting. In order to improve interfacial bonding and to reduce moisture absorption, the SGFs are treated with alkali. Acetylation is also a well-known esterification method causing plasticization of cellulosic fibers like SGF. It is beneficial in reducing the moisture absorption of NFs. 24 The reduction of the number of hydroxyl groups reduces the polarity. On the other hand, C6H5COCl includes benzoyl (C6H5C=O) that is used for benzoylation of NFs and attributed to the decreased hydrophilic nature of the treated fiber. 23
The effect of chemical treatment, such as methacrylamide, alkalization, or acetylation, on the properties of SGF-reinforced polymer composites has been studied earlier. 8 –16 They have shown that the surface texture can be considerably modified by alkali treatments. When the modified fiber is added to the polymer matrix, the treated fiber-reinforced polymer composites (TFPC) exhibit a significant increase in mechanical properties as compared to the untreated ones.
The effect of fiber treatment and fiber loading on the mechanical properties of Luffa–resorcinol composites were investigated by Parida et al. 14 They reported that tensile and compressive strength (CS) of the composites decreased with the incorporation of untreated LC fibers, but these values increase with the inclusion of treated fibers. The mechanical properties of kenaf/poly-L-lactide composites were studied by Nishino. 25 They observed that the modulus of the composites increases with the increase of the volume fraction up to a threshold limit and then decreases with an increase in the volume fraction of fibers in the composites.
Most of the recent researchers reported that different NFs, such as bamboo, 26 banana, 27 flax, 28 hemp, 29 jute, 30 kenaf, 31 and oil palm-empty fruit bunch, 32 have been used to reinforce PLA, where coupling agent and mercerization method for fiber surface treatment has been followed. Besides, to the best of our knowledge, the acetylation and the benzoylation method as well as ultrasonication of SGF have not yet been applied before to observe the structures and properties of SGF-reinforced PLA biocomposites.
The present study deals with the preparation and property evaluation of SGF-reinforced PLA biocomposites. In this work, the effect of alkalization, acetylation, and benzoylation of SGF on the structures and properties of reinforced composites has been compared. Besides, the effect of fiber content on the structures and properties of fabricated composites has also been observed.
Experimental
Materials
Semicrystalline PLA in pellet form was purchased from Titan Chemical, Pasir Gudang, Malaysia. SGFs were collected from rural area. The as-received SGFs were cut carefully to separate the outer mat core from the inner fiber core (central core). Only the outer mat core was used in this study. SG single fibers were separated by hand until fine particulate fibers were obtained. The essential chemical modifiers such as NaOH for alkalization, acetic acid (CH3COOH) and (CH3CO)2O for acetylation, and C6H5COCl) and ethanol (C2H5OH) for benzoylation were procured for treatment of SGF. All chemical compounds are the products of Merck, Germany.
Methods
Fiber surface treatment
Alkalization
SGFs were cut into 10 mm length and soaked in various concentrations (5–15 wt%) of NaOH solution at 30°C maintaining a bath ratio of 20:1. For this purpose, the fibers were washed with distilled water to remove dirt and other water-soluble impurities. Then, the fibers were immersed in NaOH solution for 2 h. The fibers were washed several times with freshwater to remove NaOH solution sticking to the fiber surface, neutralized with dilute acetic acid solution, and finally washed again with distilled water to maintain the pH value of 7. The fibers were sonicated for 1 h at 50°C in an ultrasonic cleaner (model: VGT-1860QTD, MTI, USA) and then dried at room temperature for 48 h followed by oven-drying at 100°C for 6 h.
Acetylation
Then, 10 g of dried SGFs were immersed in distilled water for 15 min, pressed out, and then introduced in a Buchner funnel. The wet fibers were transferred to a stoppered bottle and covered with 150 ml of glacial acetic acid. After being shaken occasionally for 1 h, the fibers were pressed out as before. Then, a solution of 10% acetic acid in distilled water and 1 ml concentrated H2SO4 at 25°C was prepared. The fibers were kept in this solution. The mixture was shaken vigorously for about 1 min, and then 50 ml of various concentrations (5–15 wt%) of (CH3CO)2O solution was added and again shaken vigorously for about 1 min. The resultant solution was held 5 min at 25°C. The SGFs were sonicated for 1 h at 50°C in an ultrasonic cleaner. The SGFs were then washed with distilled water. Finally, the fibers were dried at 60°C and then stored in desiccators.
Benzoylation
The SGFs were initially pretreated with alkaline in order to activate the hydroxyl groups of the cellulose and lignin in the fibers. Then, the fibers were suspended in 10% NaOH and different concentrations (5–15 wt%) of C6H5COCl solution for 15 min. The isolated fibers were then soaked in C2H5OH for 1 h to remove the C6H5COCl. Then, the SGFs were sonicated for 1 h at 50°C in an ultrasonic cleaner. Finally, the SGFs were washed with distilled water and dried in an oven at 80°C for 24 h.
Sample preparation
Neat PLA foam
In a beaker, neat PLA was dissolved in 1,4-dioxane by stirring with a magnetic stirrer and heating simultaneously. After 20–30 min, the solvent is turned into viscous form. The viscous material was placed in a square-shaped pot. After cooled in ambient temperature, the pot was placed in a refrigerator at −20°C. After 24 h, the sample was shifted to the vacuum dryer. After 24 h, the sample was removed from the dryer and obtained as foam. The prepared neat PLA foam is hereafter abbreviated as PLAF.
Composites
The composites were prepared by solution mixing with SGF and PLA pellets dissolved in 1,4-dioxane by stirring using a magnetic stirrer and heating simultaneously. The prepared composites are untreated fiber-reinforced PLA composites (UFPC), alkali-treated fiber-reinforced PLA composites (ALT-FPC), (CH3CO)2O-treated fiber-reinforced PLA composites (ACT-FPC), and C6H5COCl-treated fiber-reinforced PLA composites (BCT-FPC).
The composites prepared with fibers treated at 5 wt% chemical concentrations are hereafter named as 5ALT-FPC, 5ACT-FPC, and 5BCT-FPC. Those that were prepared with fibers treated at 10 wt% chemical concentrations are hereafter named as 10ALT-FPC, 10ACT-FPC, and 10BCT-FPC and that prepared with fibers treated at 15 wt% chemical concentrations are hereafter named as 15ALT-FPC, 15ACT-FPC, and 15BCT-FPC. In all of these composites, the fiber contents were 5 and 10 wt%.
Water absorption of the composites
Water absorption (WA) of the composites was measured according to the ASTM: C-67–91. The test specimens were cut in a size of 6 cm length, 2 cm width, and 0.5 cm thickness. The cut samples were kept in an oven at 80°C for 24 h. It was taken out from the oven and immediately weighed. Let this weight be Wi. The samples were then immersed in distilled water of 23°C and kept for 24 h. It was taken out from the water, wiped by a cloth, dried in air, and then weighed. Let this weight be Wf. Then, the amount of WA was calculated using the following formula
To measure WA, the above procedures were repeated for 2–30 days for all samples. It is noteworthy that the cut sides of samples were coated with araldite to prevent penetrating water into the sample.
Soil burial test
The degradation of the composites under soil was performed according to the ASTM: G-160. For this method, the samples were kept in an oven at 80°C for 24 h. It was taken out from the oven and immediately weighed. Let this weight be wi. The samples were then buried under soil in a pot. The pot was covered with a plastic net and exposed to atmospheric conditions for 7 days. Readings were taken of the changes in the weight loss (WL) of the samples at intervals of 7 days for approximately 1 month. To determine the WL, the specimen of each sample was taken out from the soil, wiped by a dry cloth or tissue paper, quickly washed with cold water, and dried in an oven at 80°C to a constant weight. Let this weight be wf. Then, the percentage of WL was calculated using the following formula
So, the remaining weight percentage of the samples is

Density measurement
Let us consider that mo is the mass of empty pycnometer, m1 is the mass of pycnometer with only sample, m2 is the mass of pycnometer with sample and added water, and m3 is the mass of pycnometer filled with only water. Then, the mass of only water,

Fourier-transform infrared spectroscopy
Fourier-Transform Infrared (FTIR spectra of the samples were recorded at room temperature using a double-beam IR spectrophotometer (model: Frontier, FT-IR/NIR Spectrometer, PerkinElmer, Japan) in the wave number range of 650–4000 cm−1. For these measurements, the samples were crushed for recording the attenuated total reflectance (ATR)-FTIR spectra in the transmittance (%) mode.
X-ray diffraction technique
The Bruker D8 ADVANCE XRD was used for taking pattern of X-ray diffraction (XRD). In this machine, a high-voltage power supply (35 kV, 20 mA) was used to generate X-ray radiation. The composites were finely ground to prepare the disc specimen of same thickness for each category of samples. Then, 1 g chopped samples were compressed in a cylindrical mold with a pressure of 1 MPa. The specimens were stepwise scanned by XRD over the operational range of scattering angle (2θ) between 10° and 30°, with a step of 0.02°, using the CuKα radiation of wavelength λ = 1.5406 Å. The data were recorded in terms of the diffracted X-ray intensity (I) versus 2θ.
The crystallinity indexes (CI) of the tested samples were calculated from XRD patterns using the following expression 14

where I denotes the maximum intensity of diffraction of the 101 plane, and Iam denotes the intensity of diffraction of the amorphous phase.
CS of the composites
CS tests of PLAF, UFPC, and different TFPCs were performed by a universal testing machine (UTM; model: H10KS, Hounsfield, UK) following the ASTM: D-638−98 at a crosshead speed of 1 mm min−1 and keeping a gauge length of 10 mm. The CS values were calculated by the following equation
where P is the maximum load applied to the sample and A is the area of the sample (for the four-sided specimen, A = L·W, where L is the length and W is the width of the sample).
Field emission scanning electron microscopy
The fractured samples of PLAF, UFPC, and TFPCs obtained from the CS tests were examined using a field emission scanning electron microscope (FESEM; model: JSM-7600F, JEOL Ltd., Japan) at an acceleration potential of 20 kV. The fractured surfaces of the specimens were sputter-coated with a thin layer of platinum using a JEOL JFC-1600 auto fine coater.
Thermal analyses
Thermogravimetric analyzer (TGA) coupled with a differential thermal analyzer (DTA; model: EXSTAR6000, Seiko Instrument Inc., Japan) was used in this study. The samples were heated from room temperature up to 600°C in a nitrogen atmosphere at a heating rate of 20°C min−1. TGA is used primarily for determining the thermal stability of samples. Data are recorded as thermograms of weight versus temperature.
Results and discussion
Density measurement
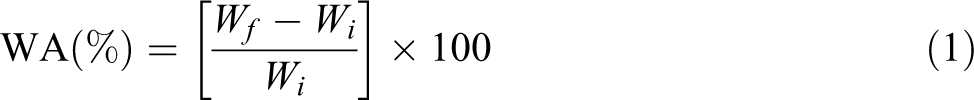
Figure 1 shows the density comparison among neat PLA, PLAF, UFPC, and different TFPCs. Original PLA has a specific density of about 1.24 g cm−3. When PLA is dissolved to prepare PLAF, the density decreases. The main reason for this characteristic is the creation of huge amount of voids or pores during the process of casting. The density of raw SGF is measured to be 0.703 g cm−3. The composites prepared by untreated SGF also have huge amount of voids because of poor adhesion between PLA matrix and fibers. On the other hand, the composites prepared by chemically treated SGF contain reduced voids because of good adhesion between PLA matrix and fibers. For these reasons, the density of different TFPCs is higher than that of UFPC.
Density measurement of neat PLA, PLAF, UFPC, and different TFPCs prepared with 5 wt% fiber content. PLA: polylactic acid; PLAF: prepared neat PLA foam; TFPC: treated fiber-reinforced PLA composites; UFPC: untreated fiber-reinforced PLA composites.
The density of neat PLA, PLAF, UFPC, and different TFPCs are listed in Table 1.
Physical properties comparison among original PLA (neat PLA), PLAF, UFPC, and different TFPCs containing 5 and 10 wt% fiber weight ratio.
5ALT-FPC, 5ACT-FPC, and 5BCT-FPC: composites prepared with fibers treated at 5 wt% chemical concentrations; 10ALT-FPC, 10ACT-FPC, and 10BCT-FPC: composites prepared with fibers treated at 10 wt% chemical concentrations; PLA: polylactic acid; PLAF: prepared neat PLA foam; SD: standard deviation; SGF: sponge-gourd fiber; TFPC: treated fiber-reinforced PLA composites; UFPC: untreated fiber-reinforced PLA composites.
WA observation
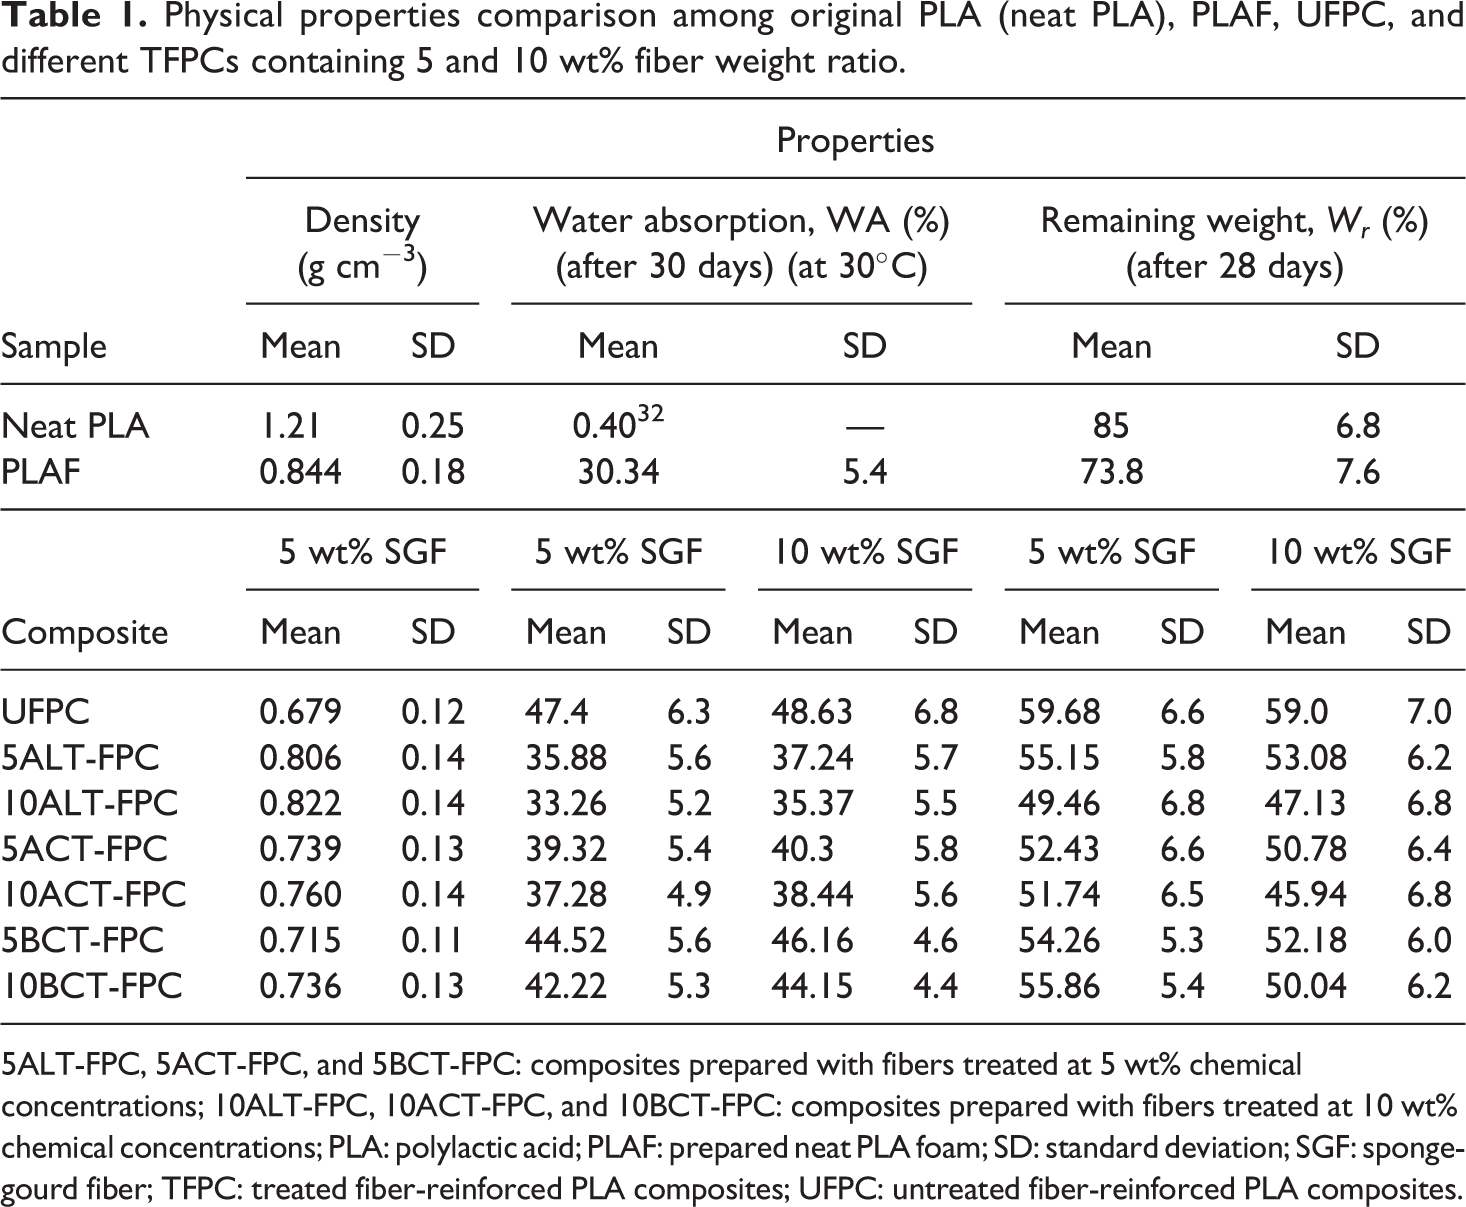
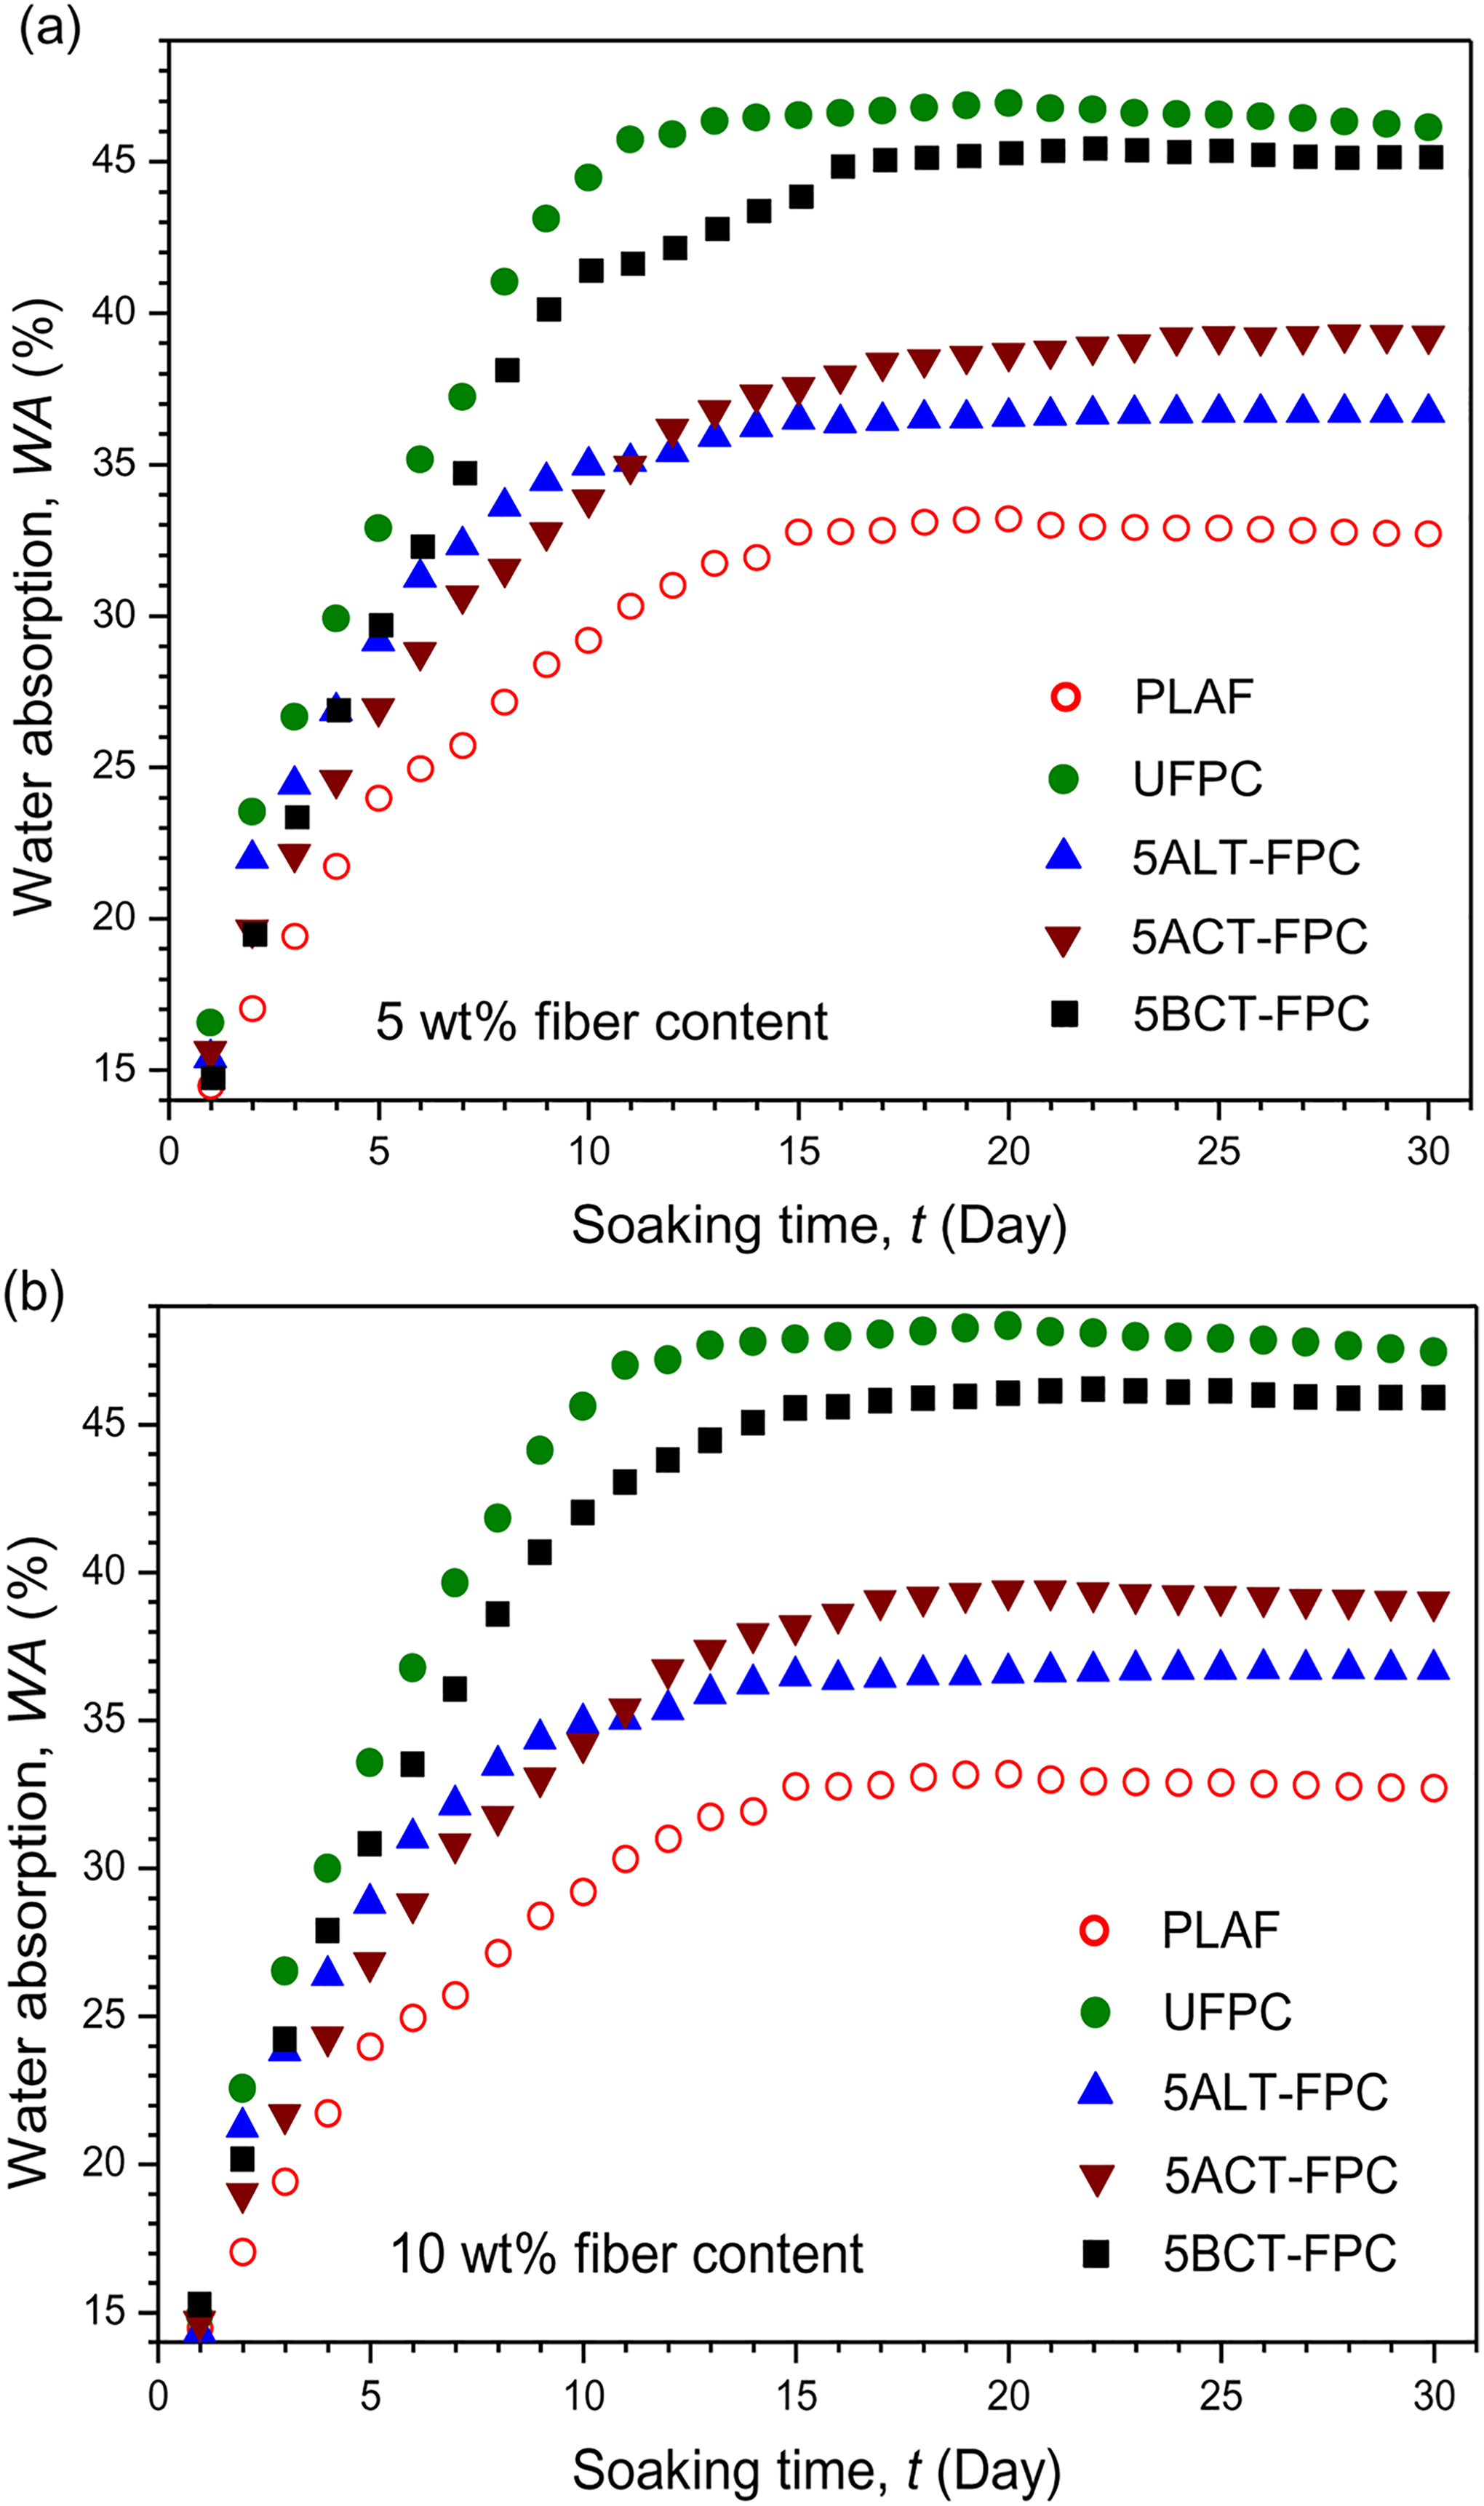
Figures 2(a) and (b) and 3(a) and (b) show the variation of WA on soaking time for PLAF, UFPC, and different TFPCs for 5 and 10 wt% treatment concentrations, respectively. WA increases rapidly at the initial stage and nearly levels off after 10 days for UFPC and after 15 days for TFPCs. These results indicate that the absorption of water is slower for TFPCs than for UFPC. WA is higher in UFPC followed by BCT-FPC, ACT-FPC, and ALT-FPC for both 5 and 10 wt% TFPC and PLAF. Although it is observed that WA values of 5TFPCs are higher than that of 10TFPCs. Also, the WA values of the samples for 10 wt% fiber weight ratio are more than that of the samples for 5 wt% fiber weight ratio. Untreated SGF is hydrophilic in nature, and as a result, WA is found to be more in UFPC than that in TFPCs and PLAF, but after treatment, the hydrophilicity of the treated fiber decreases as well as a good adhesion of fiber with polymer matrix is established. Consequently, WA of TFPCs decreases, as also reported elsewhere. 33 The maximum WA obtained in this study is 48.63 wt% for UFPC.
The variation of WA on soaking time for PLAF, UFPC, and different TFPCs of 5 wt% chemical concentration prepared with (a) 5 wt% and (b) 10 wt% fiber content. PLA: polylactic acid; PLAF: prepared neat PLA foam; TFPC: treated fiber-reinforced PLA composites; UFPC: untreated fiber-reinforced PLA composites; WA: water absorption.
The variation of WA on soaking time for PLAF, UFPC, and different TFPCs of 10 wt% chemical concentration prepared with (a) 5 wt% and (b) 10 wt% fiber content. PLA: polylactic acid; PLAF: prepared neat PLA foam; TFPC: treated fiber-reinforced PLA composites; UFPC: untreated fiber-reinforced PLA composites; WA: water absorption.
Degradation under soil
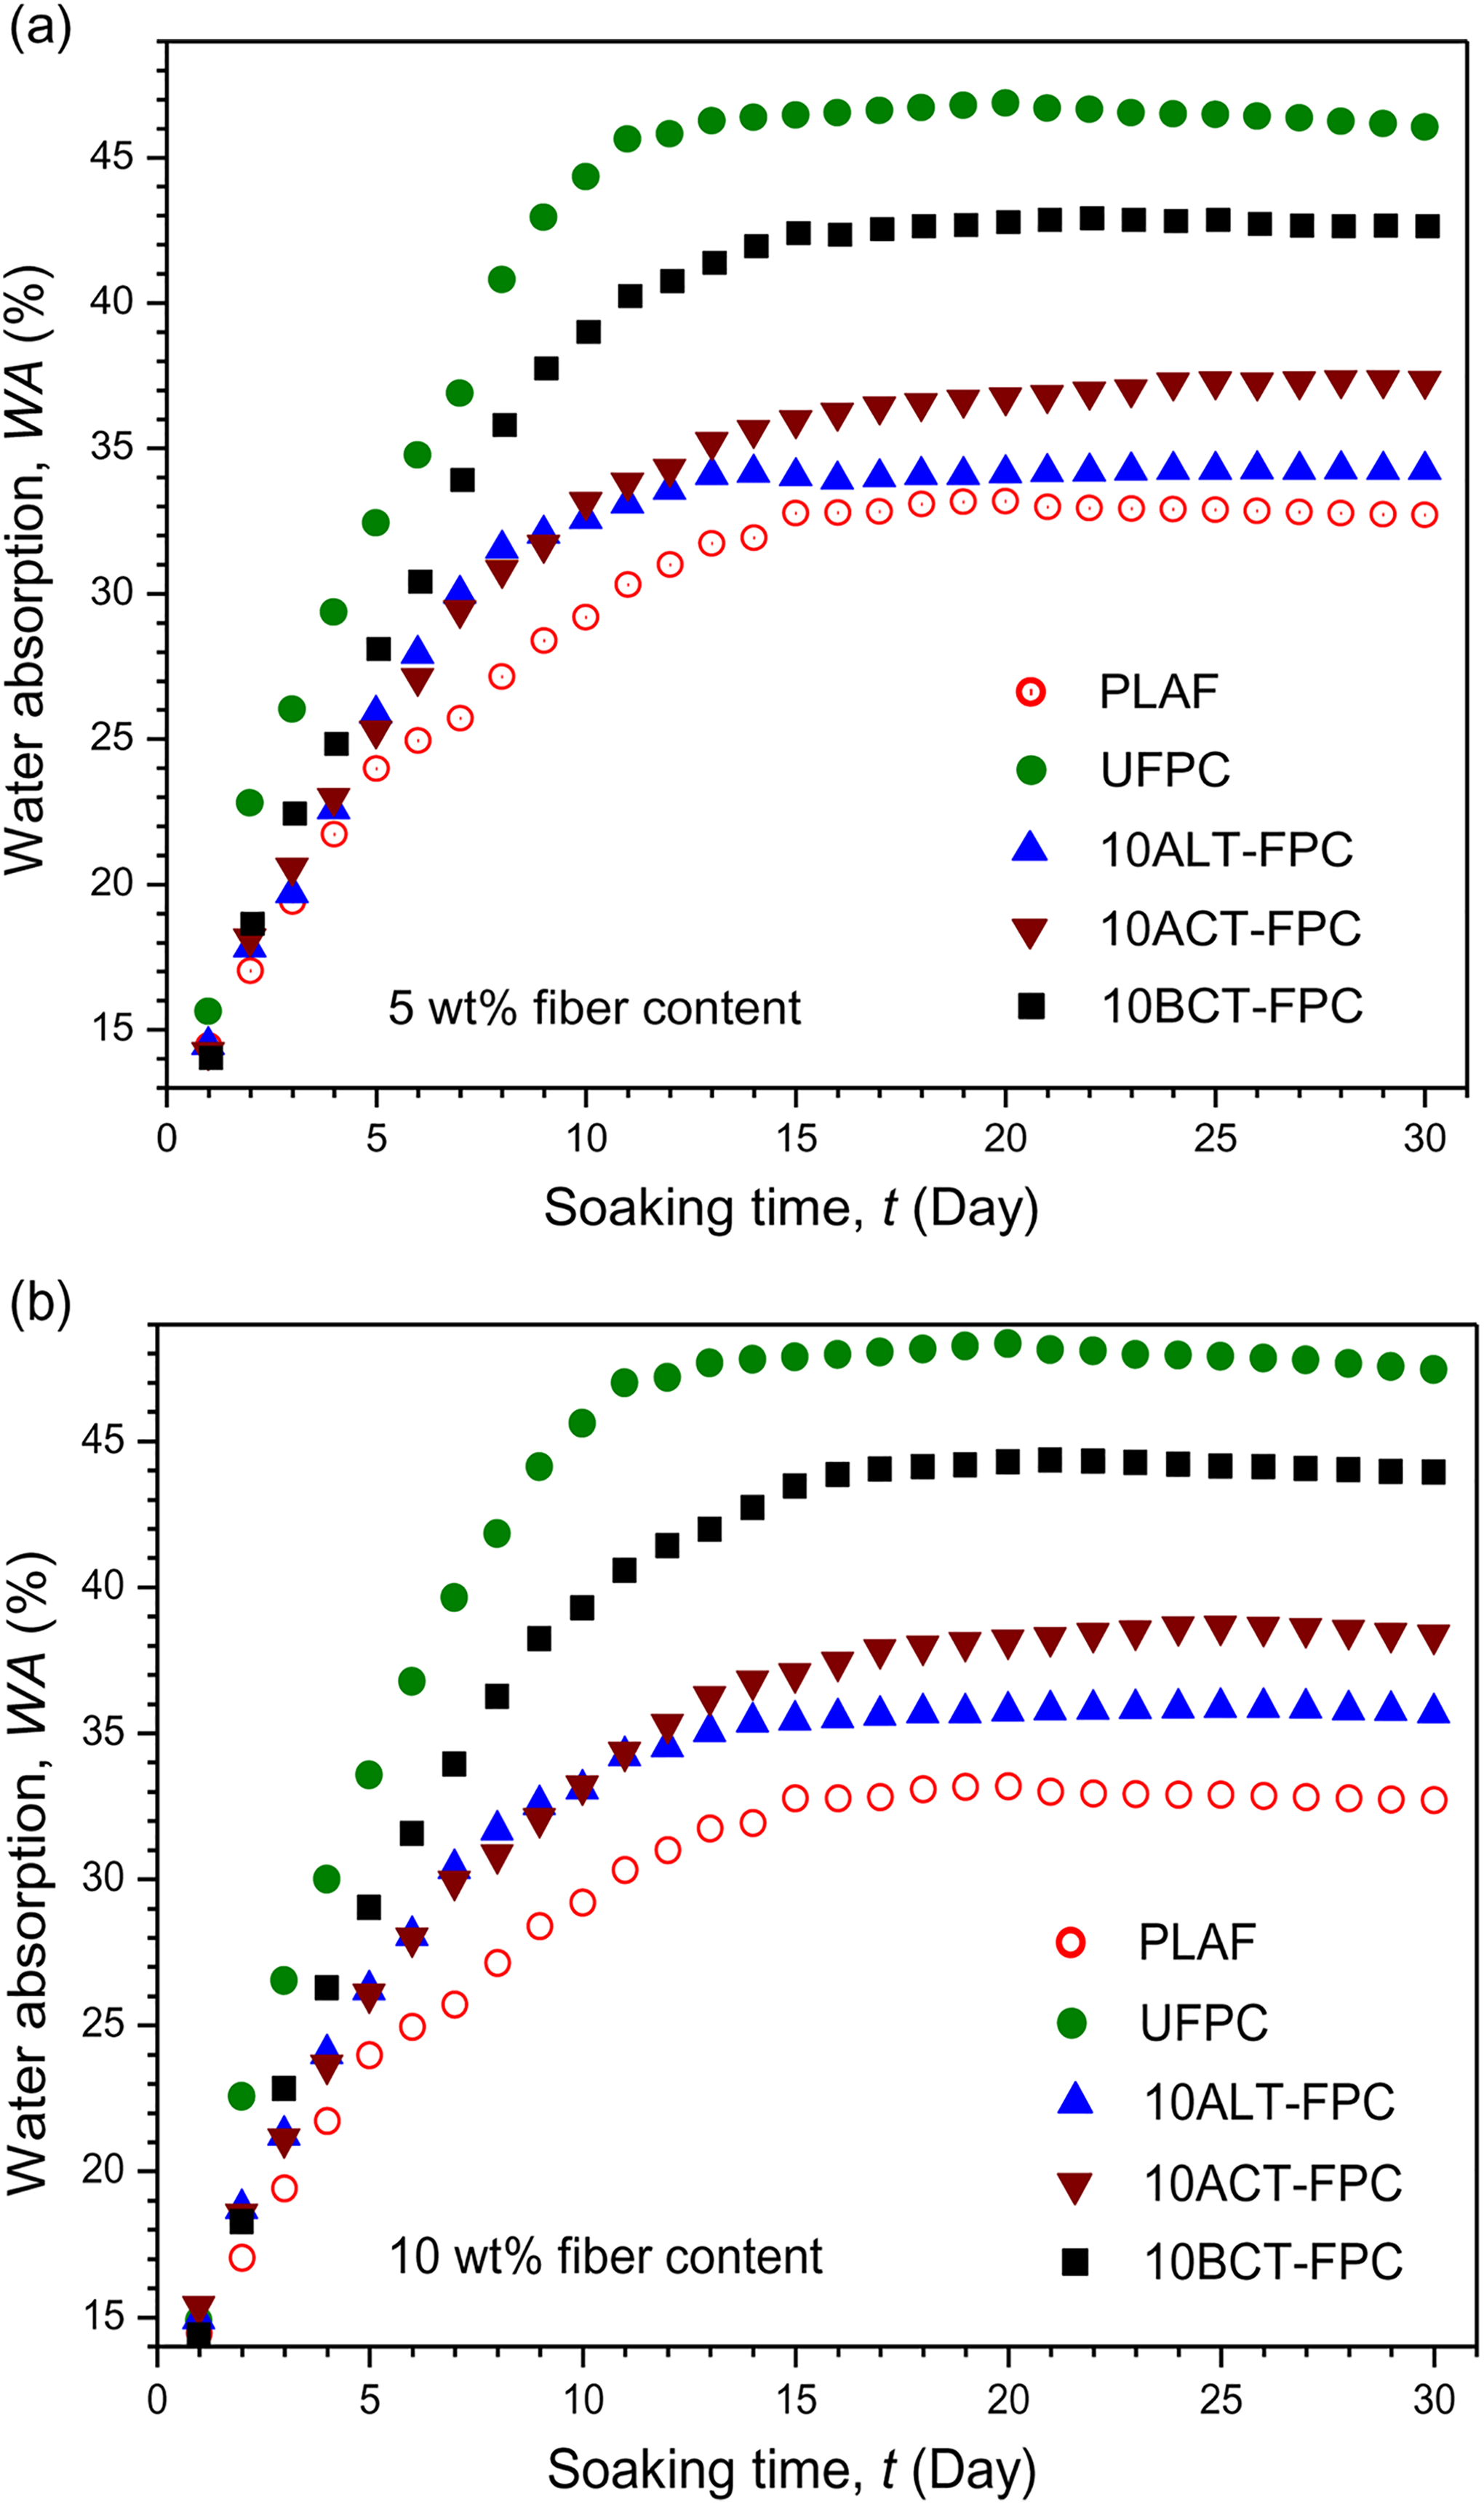
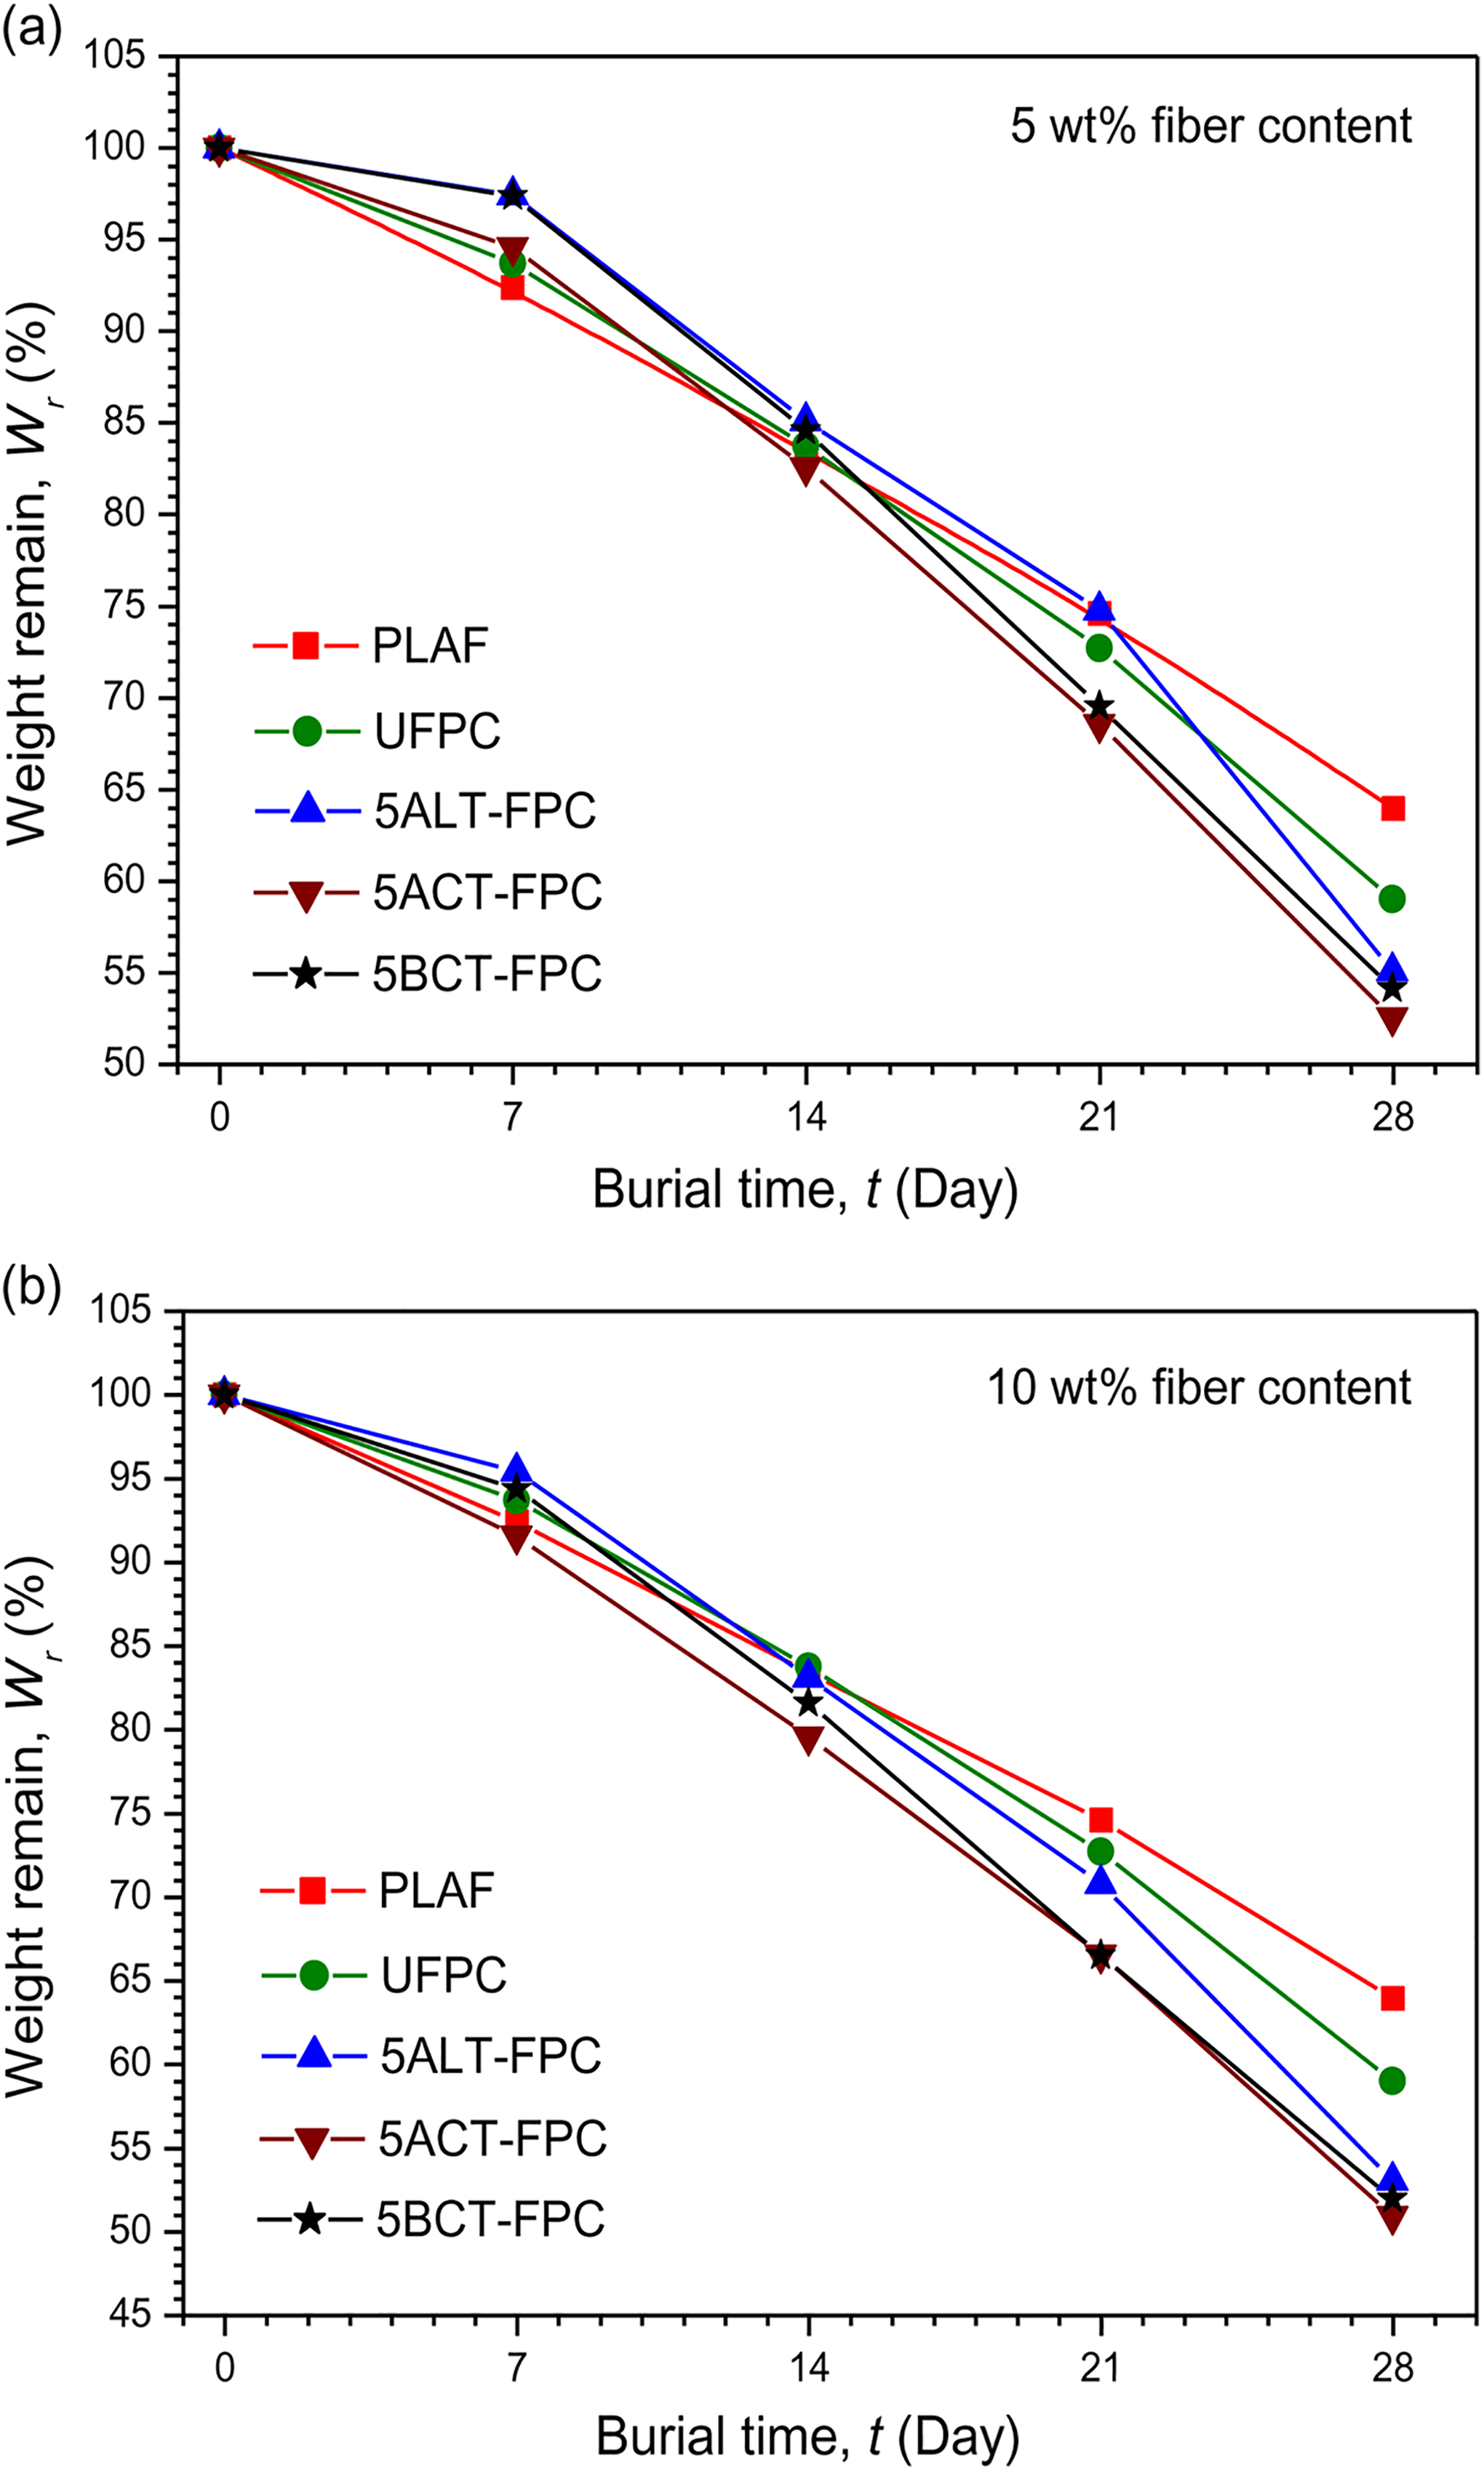
The degradation of composites has been evaluated by measuring the weight remaining after 28 days. Figures 4(a) and (b) and 5(a) and (b) illustrate the weight remaining (Wr) of PLAF, UFPC, and different TFPCs as a function of the burial time (t). According to the results, all composites show an increased degradation rate during the buried process. This is likely a result of the penetration of moisture into the composites, causing the hydrolysis of surfaces and interfaces. 34 During 28 days’ coverage, the WL (%) values are presented in Table 1. These results suggest that the degradability of composites is slightly higher than that of PLAF. Apparently, the degradability of composites as compared to that of the PLAF is not swift but is slow, which is expected from biocomposites so that they can be used as substitution of nondegradable composite materials. 32
Variation of weight remaining after degradation under soil with burial time for PLAF, UFPC, and different TFPCs of 5 wt% chemical concentration prepared with (a) 5 wt% and (b) 10 wt% fiber content. PLA: polylactic acid; PLAF: prepared neat PLA foam; TFPC: treated fiber-reinforced PLA composites; UFPC: untreated fiber-reinforced PLA composites.
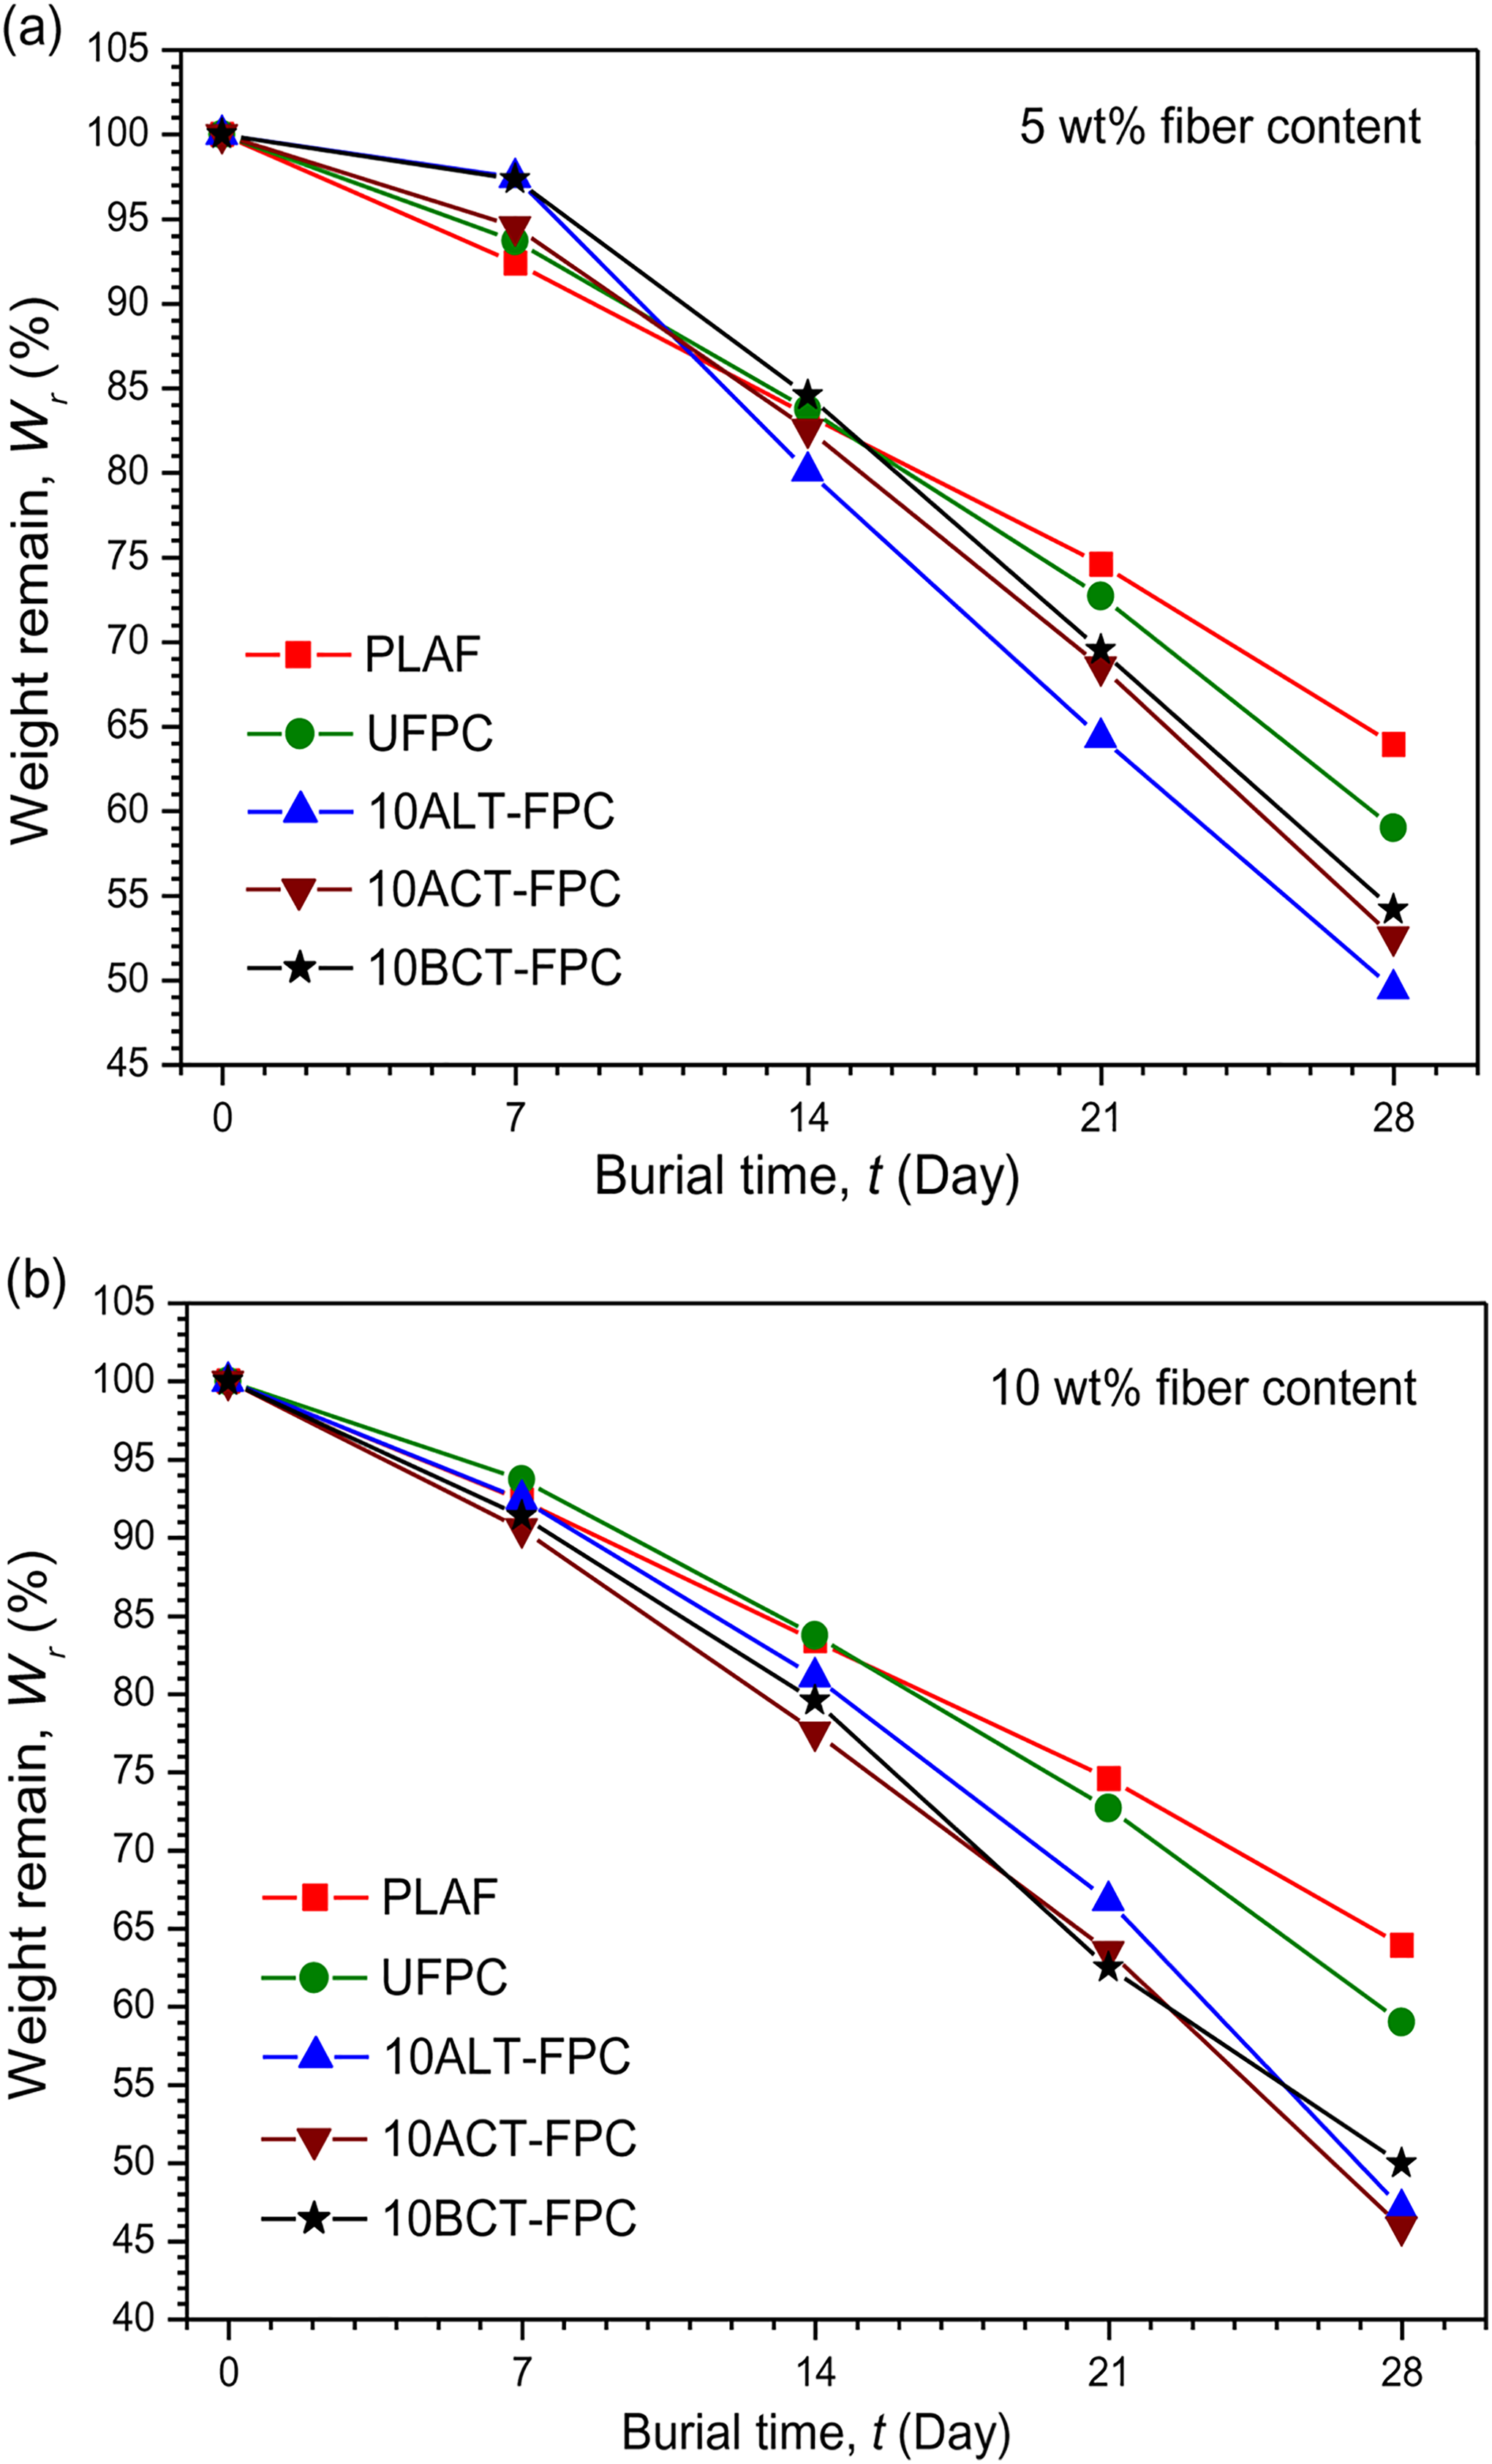
Variation of weight remaining after degradation under soil with burial time for PLAF, UFPC, and different TFPCs of 10 wt% chemical concentration prepared with (a) 5 wt% and (b) 10 wt% fiber content. PLA: polylactic acid; PLAF: prepared neat PLA foam; TFPC: treated fiber-reinforced PLA composites; UFPC: untreated fiber-reinforced PLA composites.
FTIR structural analyses
The ATR-FTIR spectra of the PLAF, UFPC, ALT-FPC, ACT-FPC, and BCT-FPC are shown in Figures 6(a) and (b) to 8(a) and (b) for the treatment concentrations of 5, 10, and 15 wt%, respectively. There is no notable variation in the FTIR spectra of Figure 6(a). The peaks at the range of 1000–1300 cm−1 from the skeletal stretching vibrations may include the C–C axial elongation and C–N stretching of amines of the samples. On the other hand, there are some variations in the spectra of Figure 6(b). Figures 7(b) and 8(b) also show the variation according to the peak position. Major changes occur in the wavenumber range of 2840–2960 cm−1 for both acetylated and benzoylated samples. They have also show new broad peak against the PLAF in the wavenumber range of 2300–2400 cm−1. The main transmittance peaks in this study have been identified and are presented in Table 2 along with their assignments.
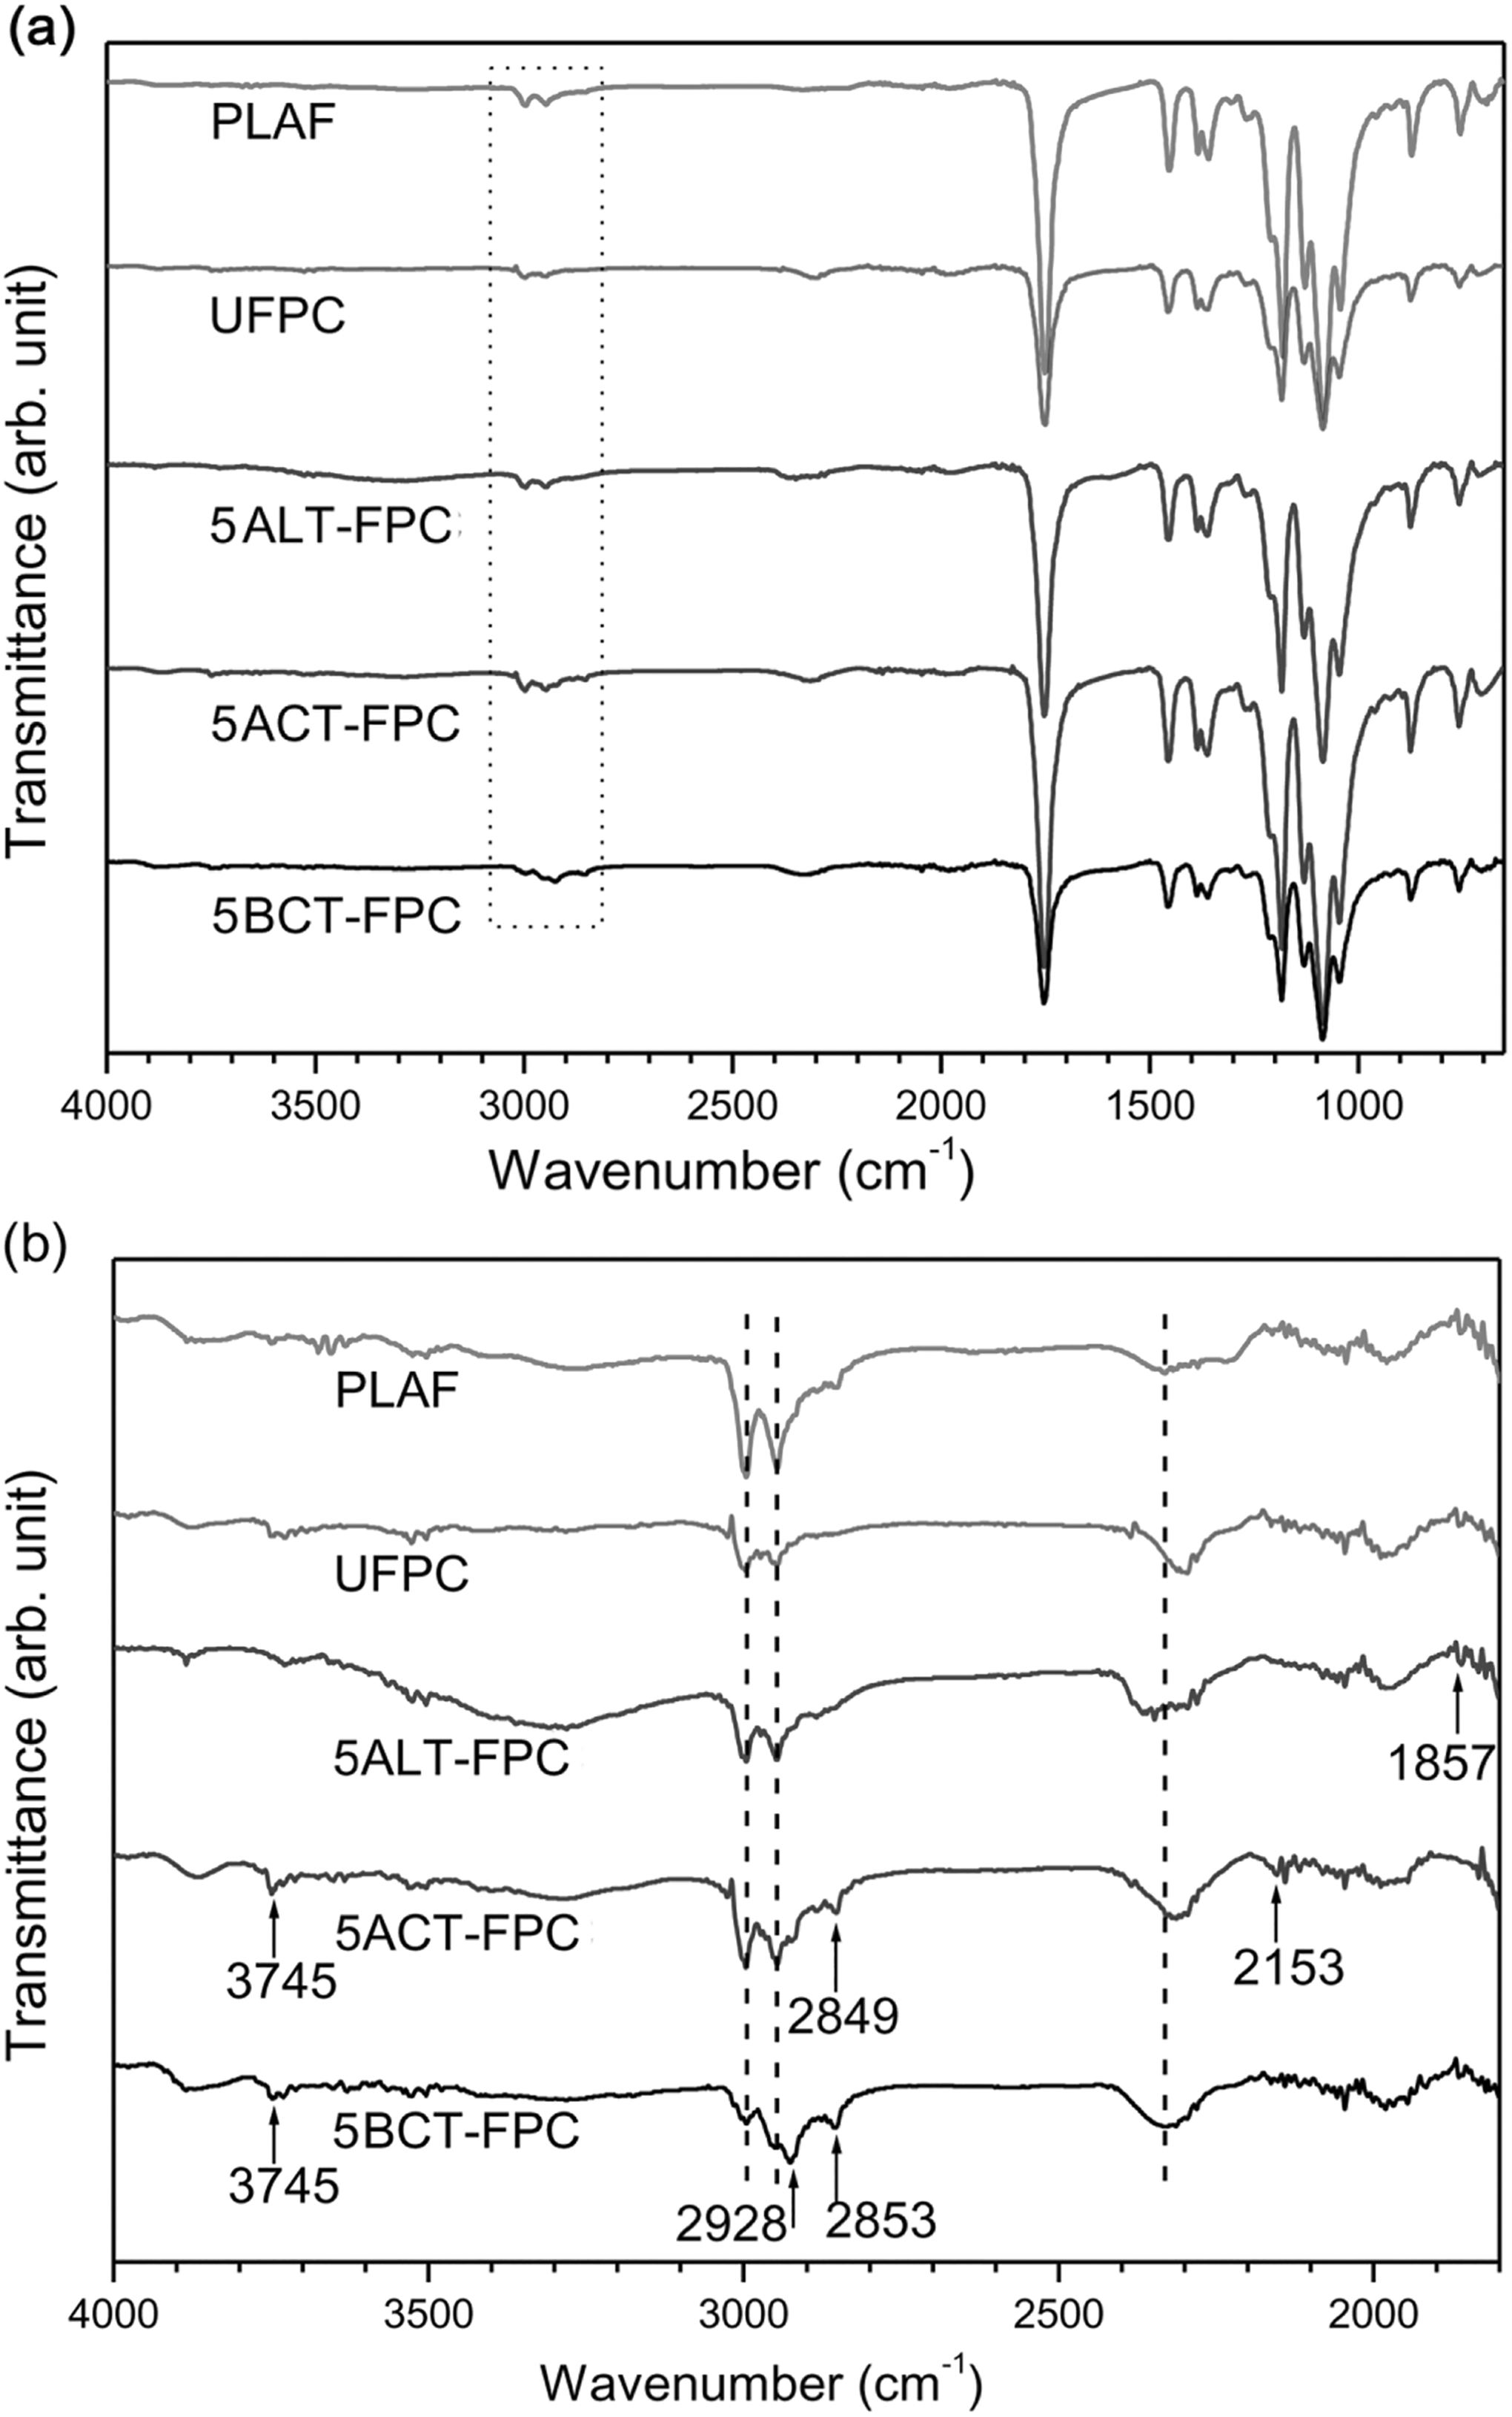
FTIR spectra of PLAF, UFPC, 5ALT-FPC, 5ACT-FPC, and 5BCT-FPC from the wavenumber range of 650–4000 cm−1 and (b) 1800–4000 cm−1. 5ALT-FPC, 5ACT-FPC, and 5BCT-FPC: composites prepared with fibers treated at 5 wt% chemical concentrations; FTIR: Fourier-transform infrared; PLA: polylactic acid; PLAF: prepared neat PLA foam; UFPC: untreated fiber-reinforced PLA composites.
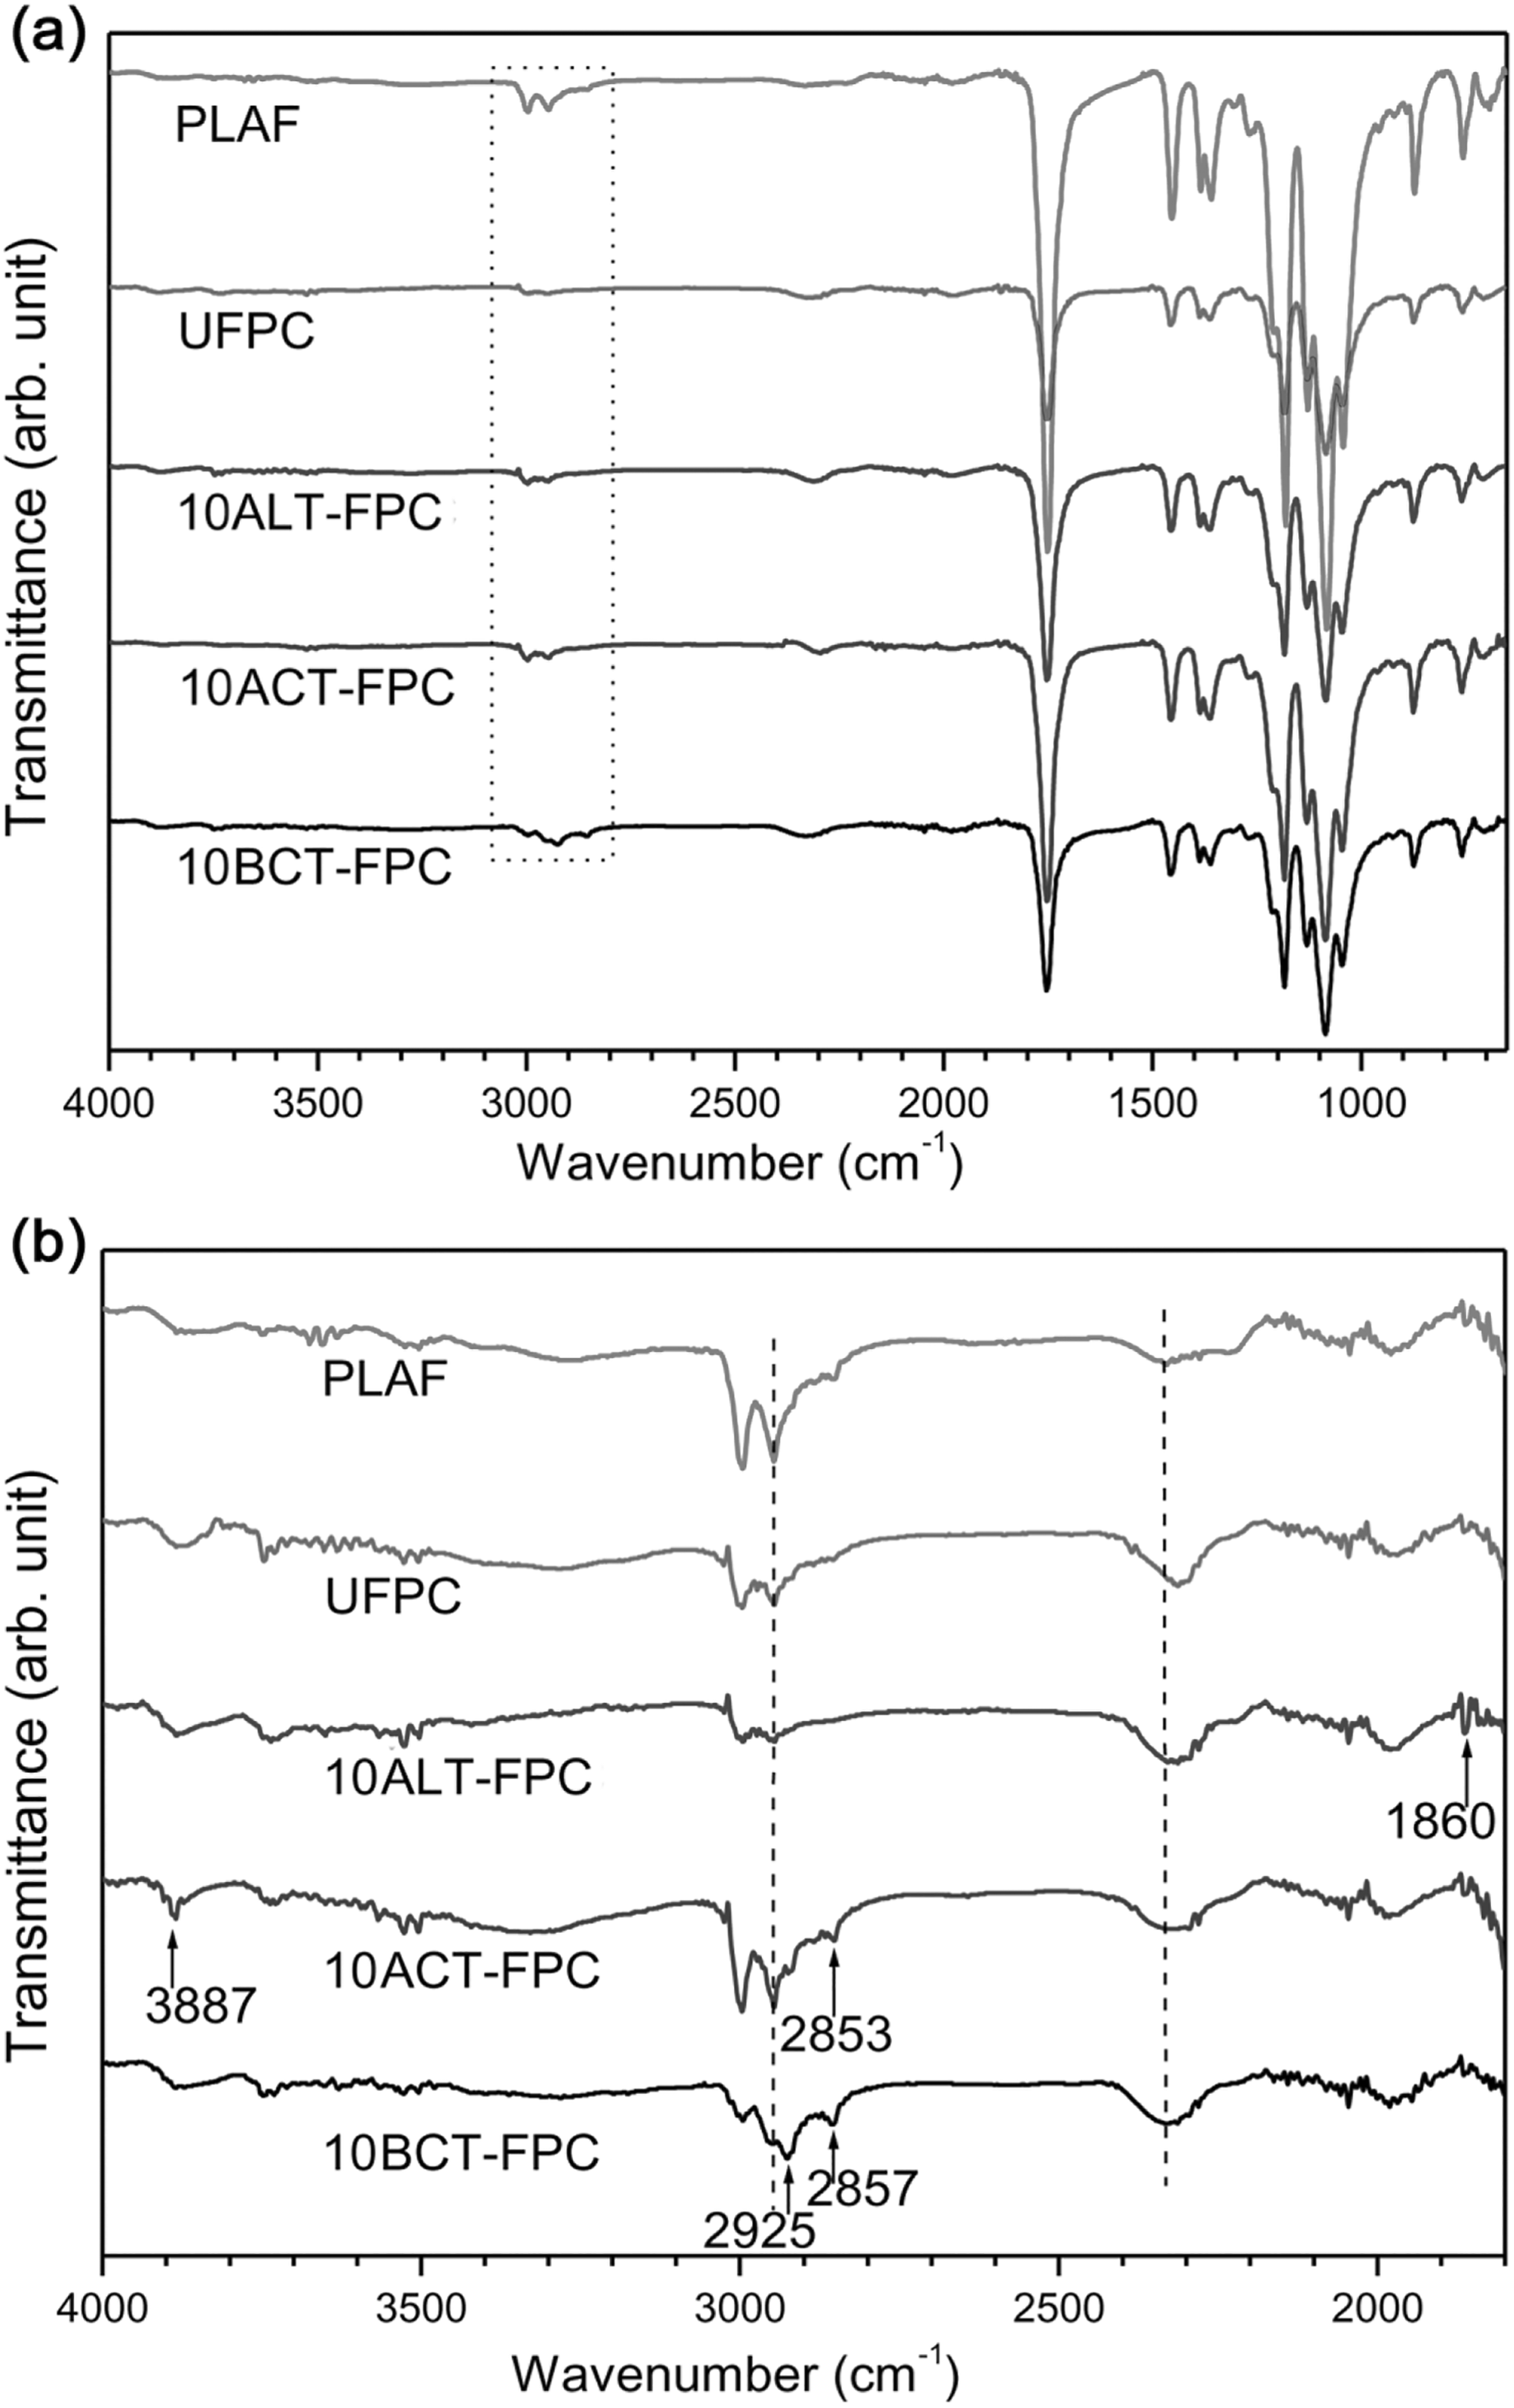
FTIR spectra of PLAF, UFPC, 10ALT-FPC, 10ACT-FPC, and 10BCT-FPC from the wavenumber range of (a) 650–4000 cm−1 and (b) 1800–4000 cm−1. 10ALT-FPC, 10ACT-FPC, and 10BCT-FPC: composites prepared with fibers treated at 10 wt% chemical concentrations; FTIR: Fourier-transform infrared; PLA: polylactic acid; PLAF: prepared neat PLA foam; UFPC: untreated fiber-reinforced PLA composites.
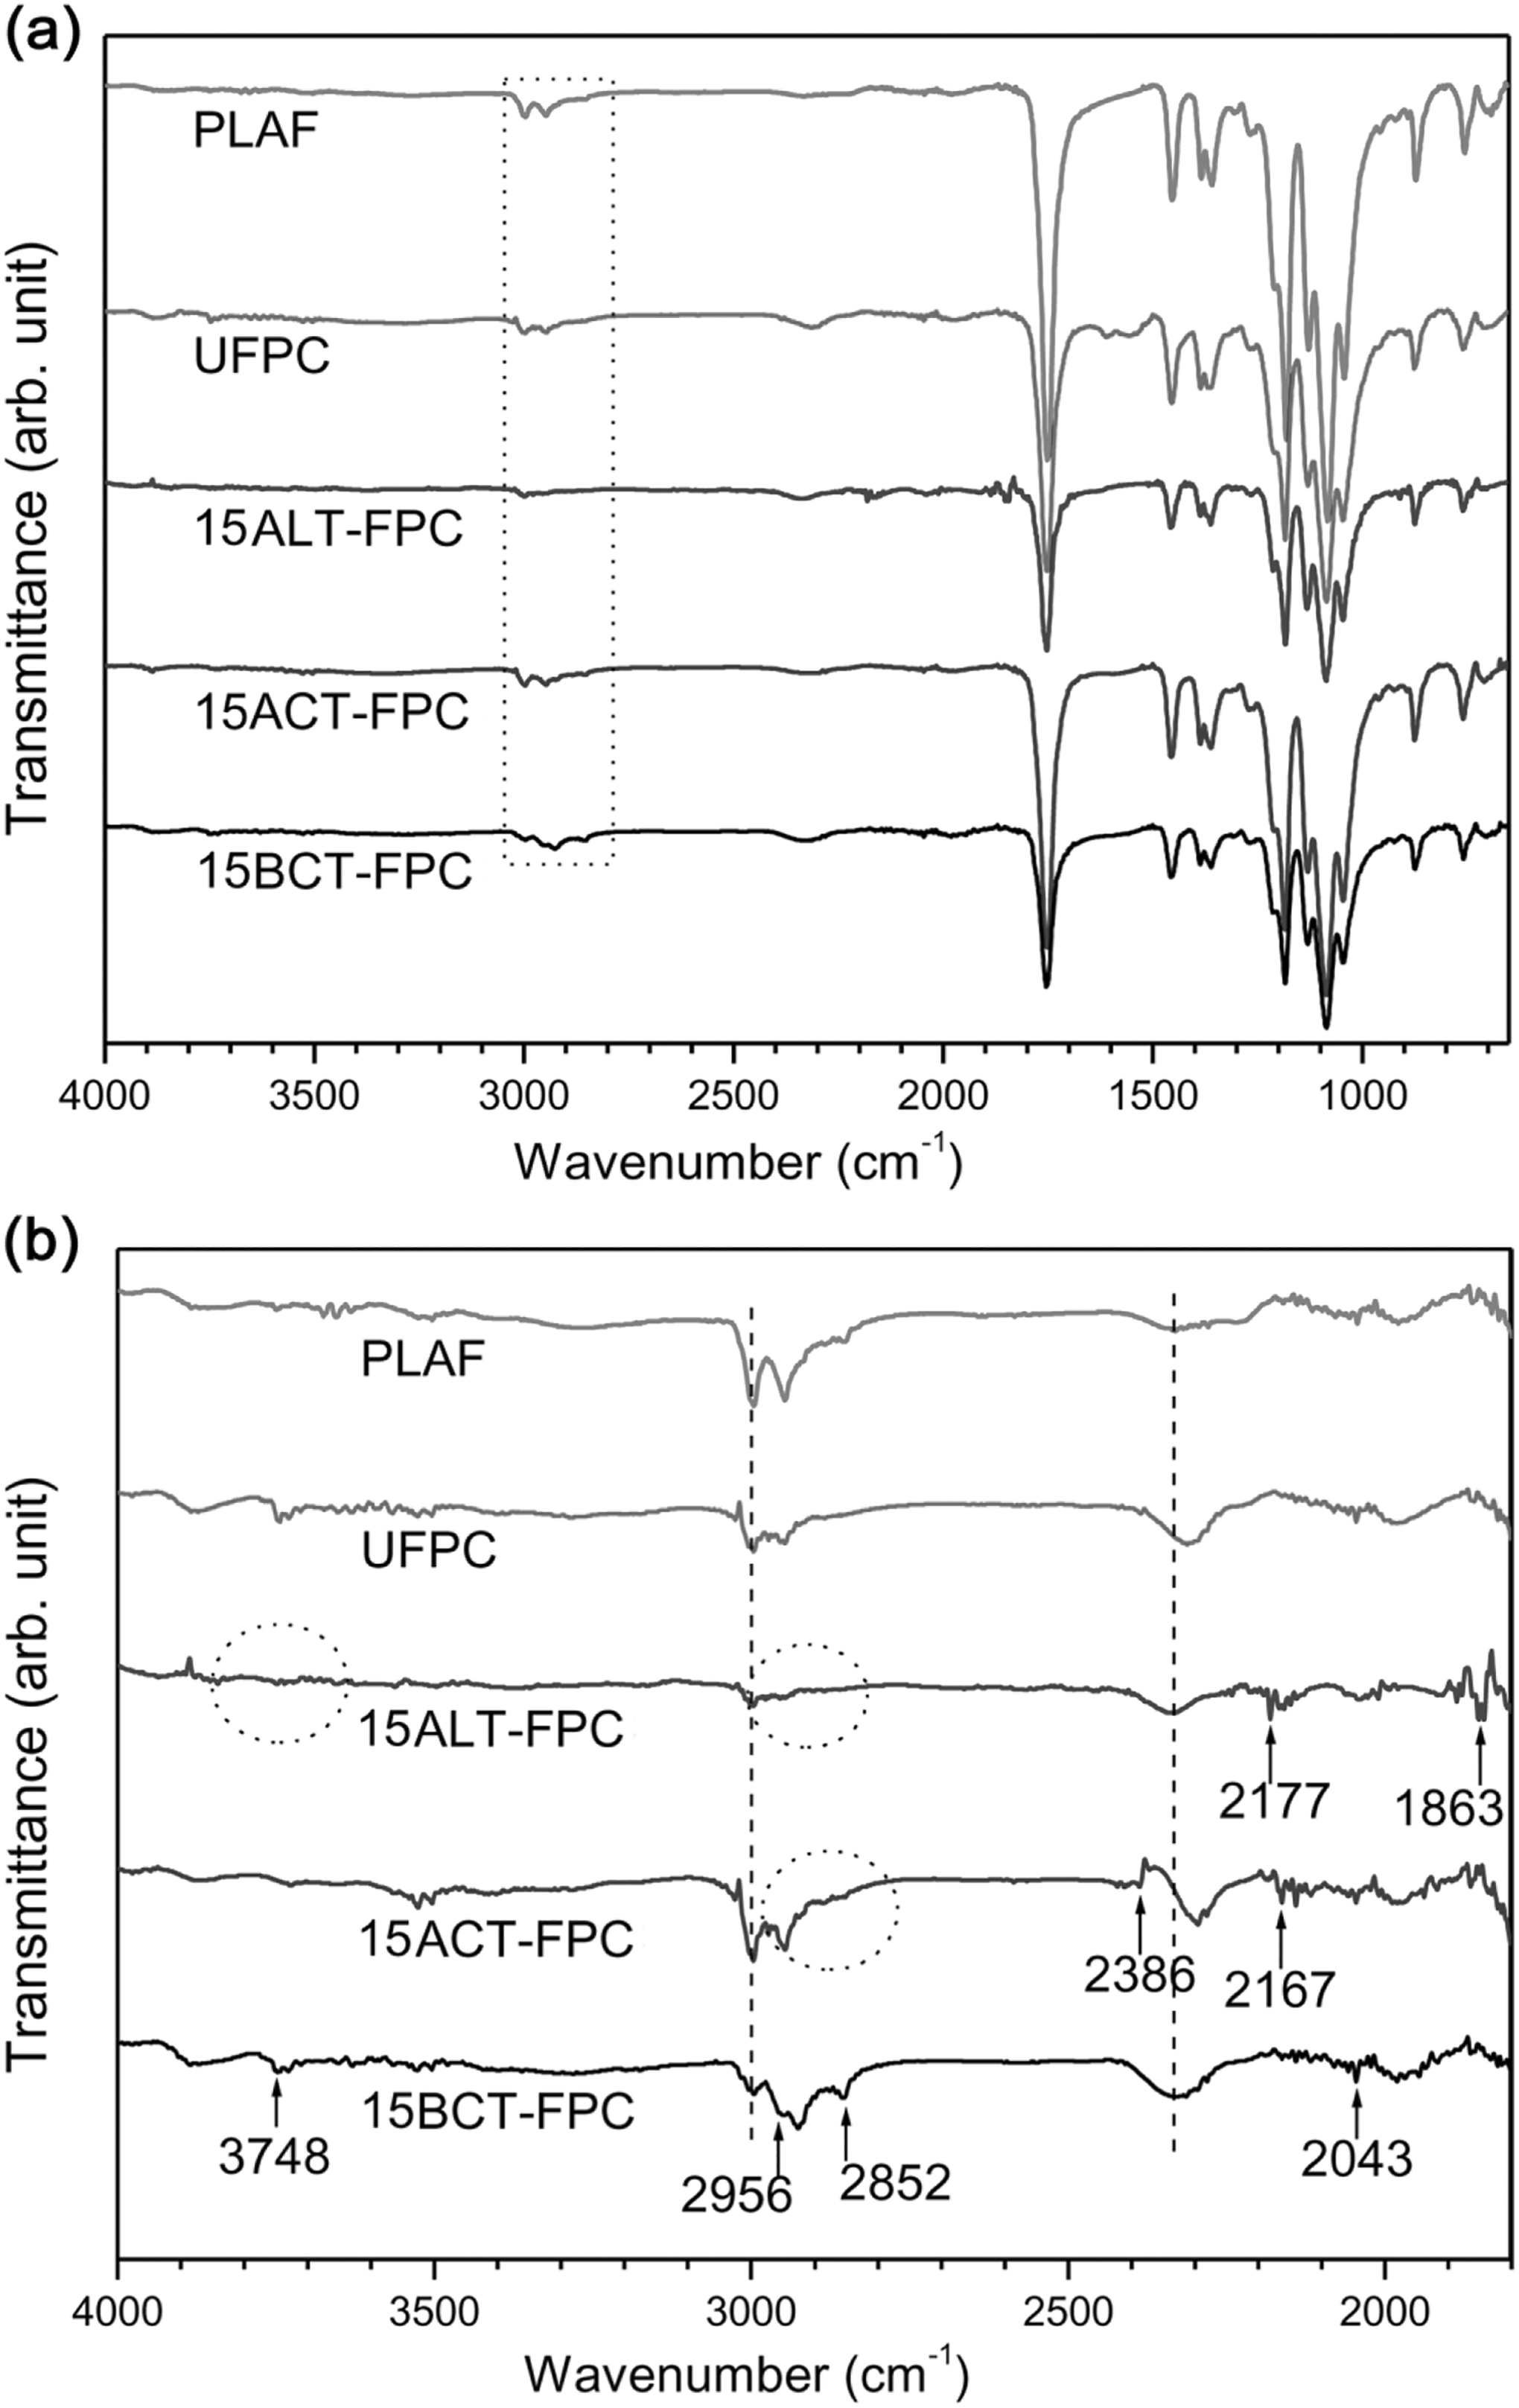
FTIR spectra of PLAF, UFPC, 15ALT-FPC, 15ACT-FPC, and 15BCT-FPC from the wavenumber range of (a) 650–4000 cm−1 and (b) 1800–4000 cm−1. 15ALT-FPC, 15ACT-FPC, and 15BCT-FPC: composites prepared with fibers treated at 5 wt% chemical concentrations; FTIR: Fourier-transform infrared; PLA: polylactic acid; PLAF: prepared neat PLA foam; UFPC: untreated fiber-reinforced PLA composites.
Important peak band assignment of FTIR for PLAF, UFPC, and different TFPCs.
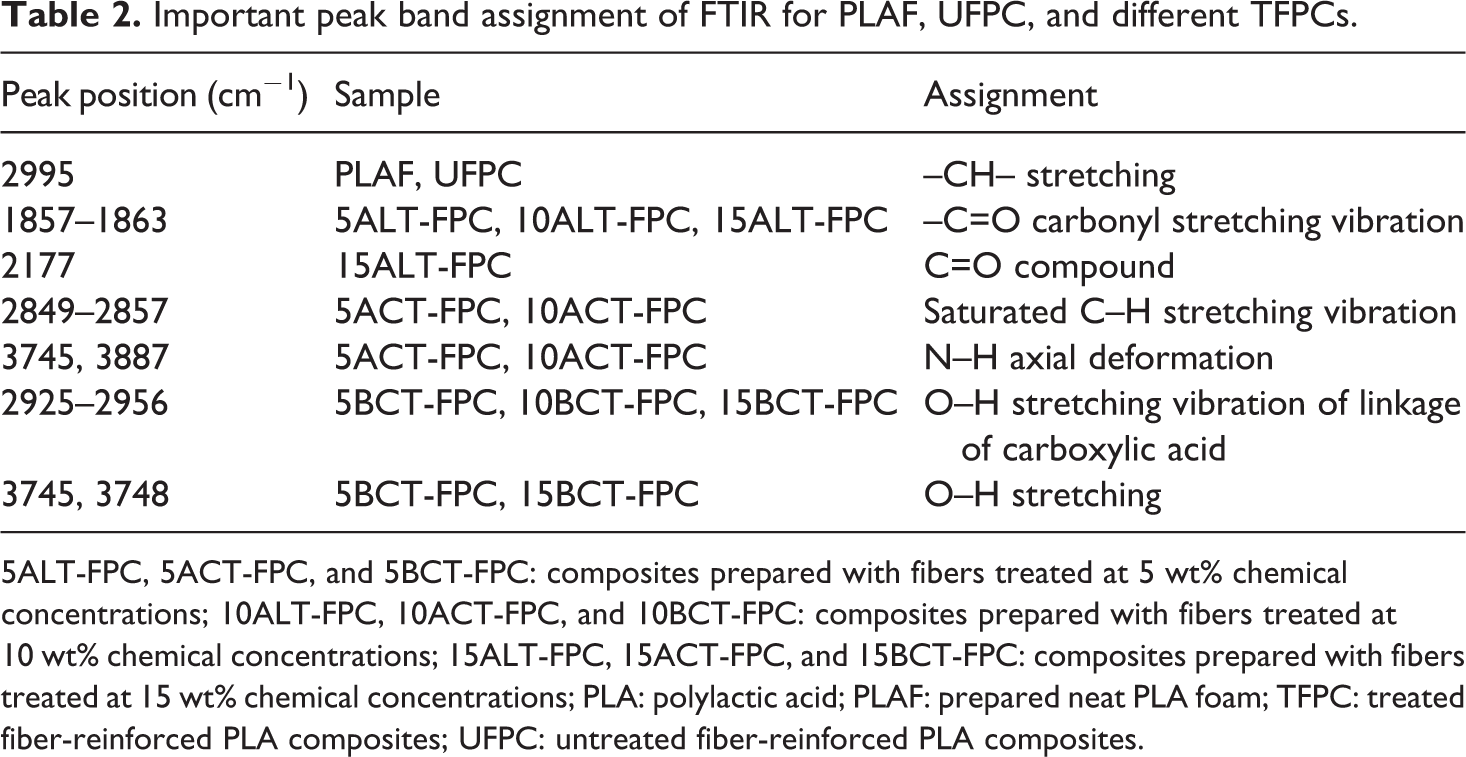
5ALT-FPC, 5ACT-FPC, and 5BCT-FPC: composites prepared with fibers treated at 5 wt% chemical concentrations; 10ALT-FPC, 10ACT-FPC, and 10BCT-FPC: composites prepared with fibers treated at 10 wt% chemical concentrations; 15ALT-FPC, 15ACT-FPC, and 15BCT-FPC: composites prepared with fibers treated at 15 wt% chemical concentrations; PLA: polylactic acid; PLAF: prepared neat PLA foam; TFPC: treated fiber-reinforced PLA composites; UFPC: untreated fiber-reinforced PLA composites.
A schematic diagram for possible bond formation between fibers and different chemicals is illustrated in Online supplementary material. The new bonds may form with Na and oxygen, acetyl group and oxygen, and benzoyl and oxygen of the cellulose.
Thus, it is significantly notable that NaOH, (CH3CO)2O, and C6H5COCl have interacted chemically with SGF.
Crystalline structure
The XRD patterns of PLAF, UFPC, ALT-FPC, ACT-FPC, and BCT-FPC are illustrated in Figure 9(a) and (b) for the treatment concentrations of 5 and 10 wt%, respectively. The two sharp diffraction peaks of PLAF (16.50°) and composites (18.80°) come from the component PLA. The very small XRD peak of treated SGF appears at 22.30° as indicated by arrow. The position of first peak is shifted to slightly higher angle in alkali-treated sample in both 5 and 10 wt%, indicating a decrease in interplanar spacing of PLA crystal. These results suggest that a close packing takes place in the PLA crystal possibly by the crystal nucleation effect of cellulose molecules after the removal of hemicellulose, lignin, pectin, and so on by different treatments. 35 By using equation (5), the estimated CI is 40%, 34%, 52%, 36%, and 42% for PLAF, UFPC, 5ALT-FPC, 5ACT-FPC, and 5BCT-FPC, respectively, and 49%, 48%, and 43% for 10ALT-FPC, 10ACT-FPC, and 10BCT-FPC, respectively. Among all of these samples, the crystallinity is better for 5ALT-FPC than others, and this value is 52%.
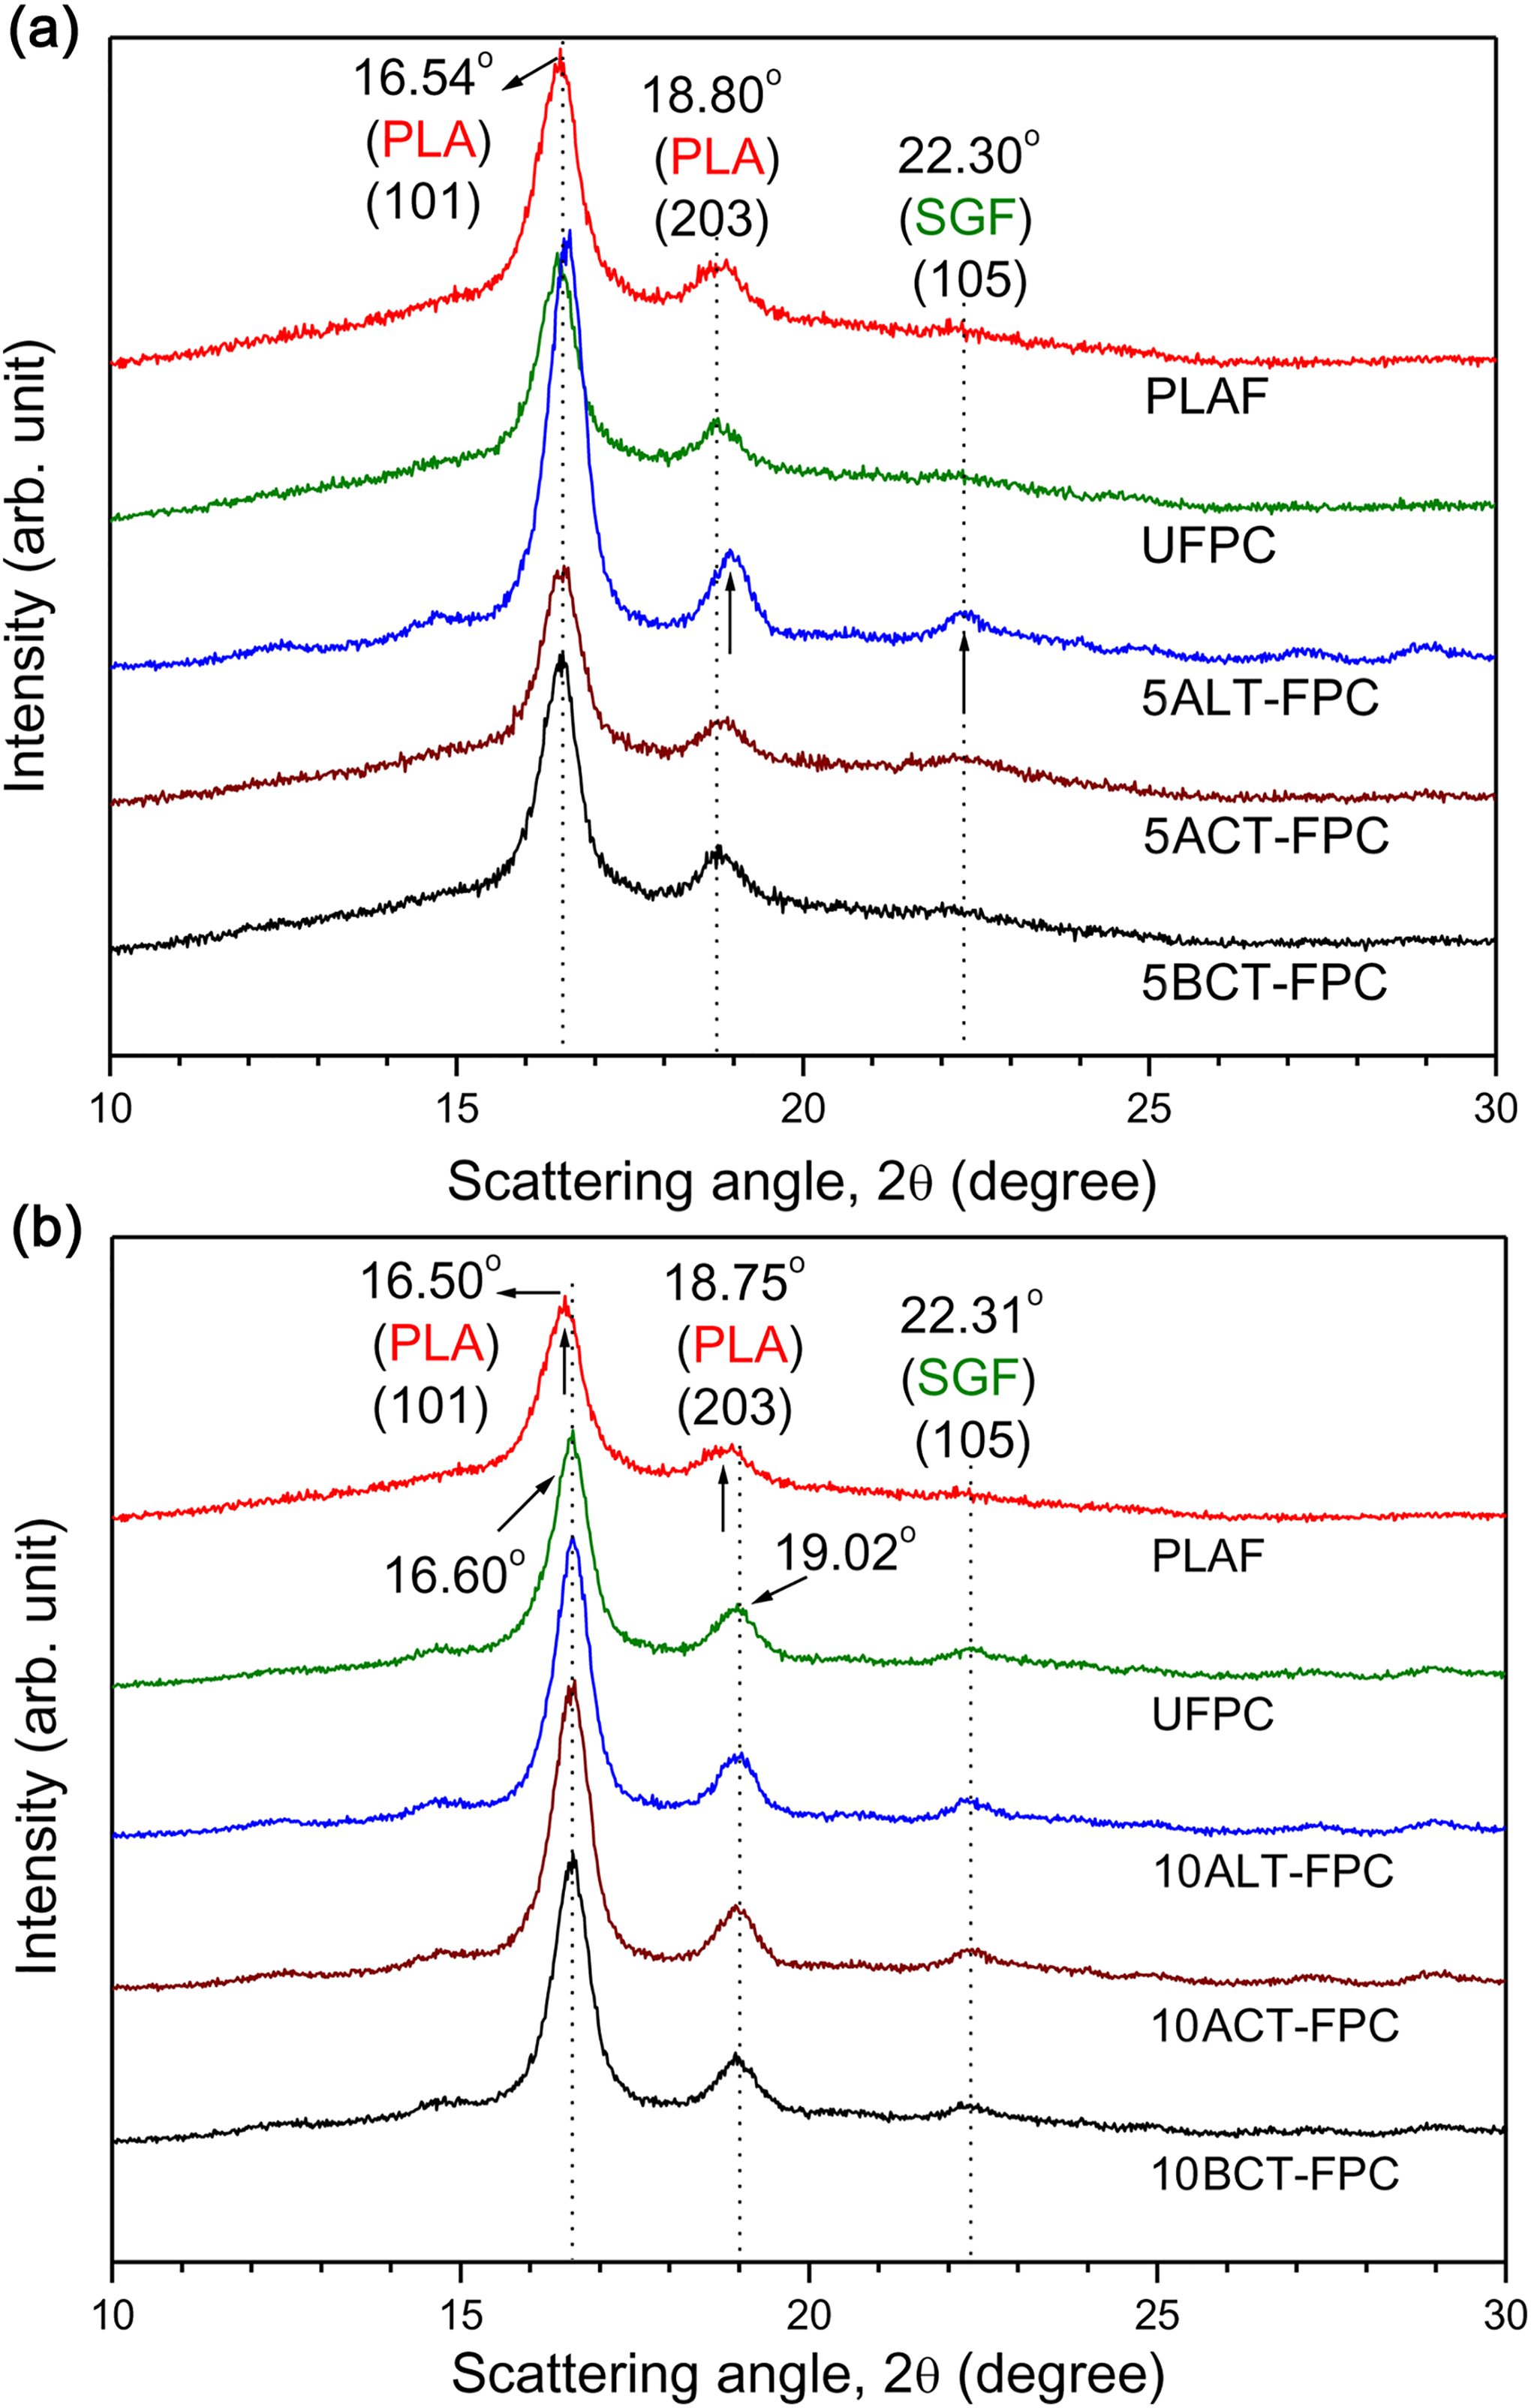
Wide angle XRD profiles of PLAF, UFPC, and different TFPCs for the treatment concentration of (a) 5 wt% and (b) 10 wt%, prepared with 5 wt% fiber content. PLA: polylactic acid; PLAF: prepared neat PLA foam; TFPC: treated fiber-reinforced PLA composites; UFPC: untreated fiber-reinforced PLA composites; XRD: X-ray diffraction.
Compressive strength
The CS test results for PLAF, UFPC, and different TFPCs are shown in Figure 10(a) to (c) for the treatment concentration of 5, 10, and 15 wt%, respectively. The strength of the UFPC for 10 wt% fiber content is the least with a value of 6.68 MPa, but the strength of UFPC containing 5 wt% fiber weight ratio is 7.61 MPa. This result confirms that the compressive strength decreases with the increase of untreated fiber content.
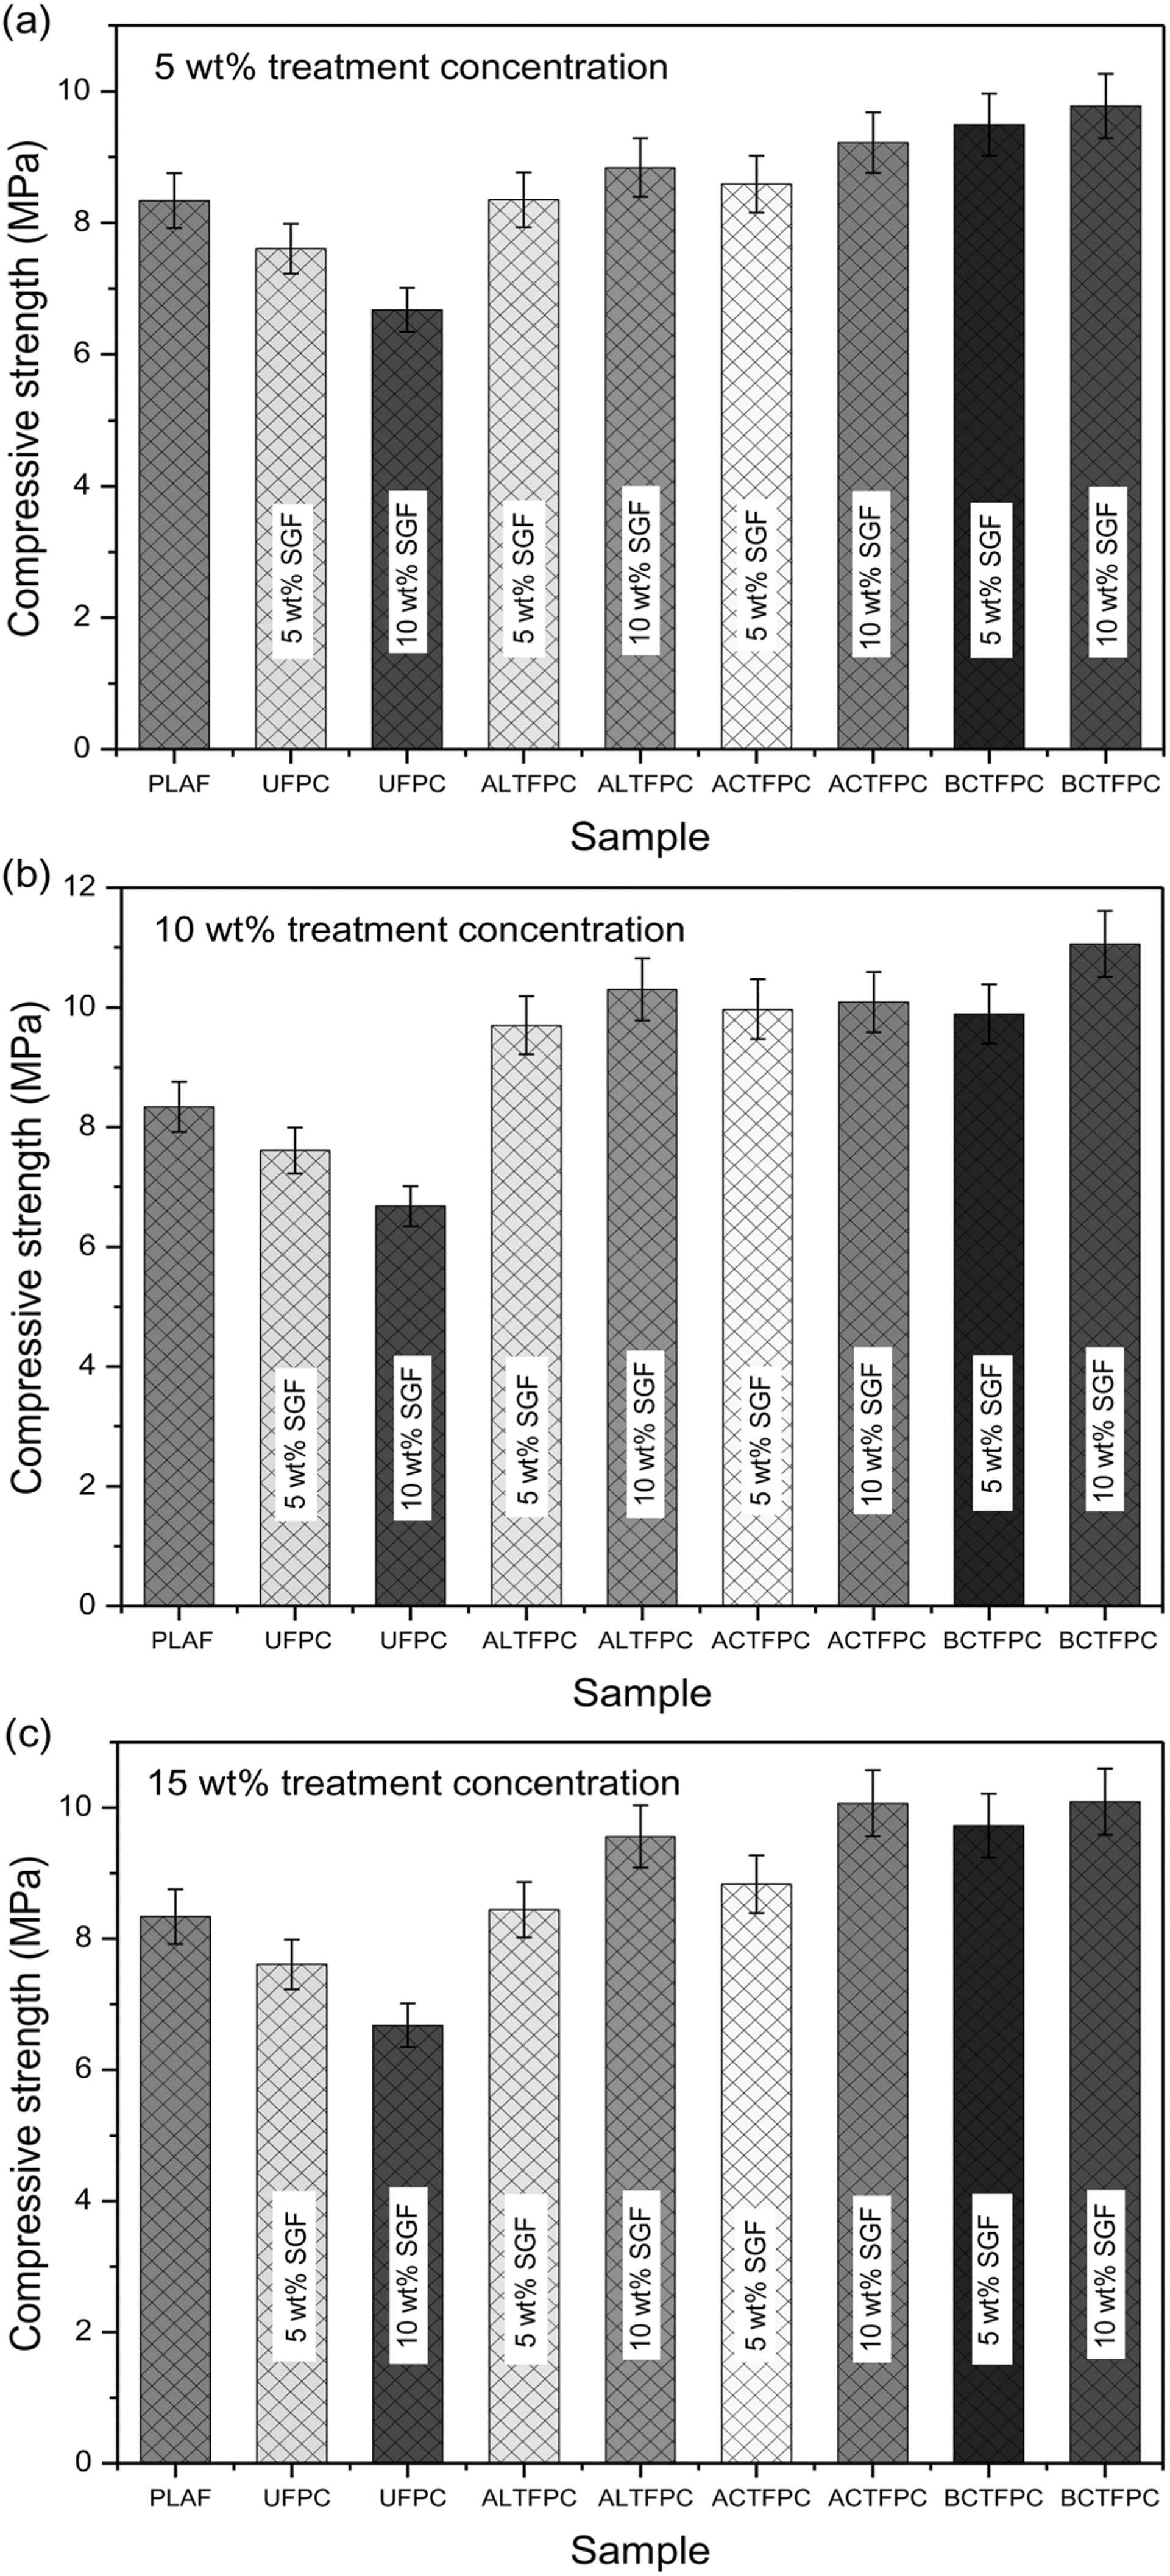
Compressive strength values for PLAF, UFPC, and different TFPCs for (a) 5 wt%, (b) 10 wt% and (c) 15 wt% chemical concentrations, prepared with 5 and 10 wt% fiber content. PLA: polylactic acid; PLAF: prepared neat PLA foam; TFPC: treated fiber-reinforced PLA composites; UFPC: untreated fiber-reinforced PLA composites.
In Figure 10(a) to (c), the highest compressive strength is found for 10BCT-FPC having the value of 11.06 MPa for 10 wt% fiber contents. From these results, it is observed that the CSs of treated samples are more than those of PLAF and UFPC. It is also notable that the increase of treated fiber content is responsible for an increase in the strength of the composites. This increase can be attributed to the reduction of the porosity of foam-type PLA and an enhancement in mechanical bond strength. 36 The results are introduced in Table 3.
Compressive strength values for PLAF, UFPC, and different TFPCs containing 5 and 10 wt% fiber weight ratio.
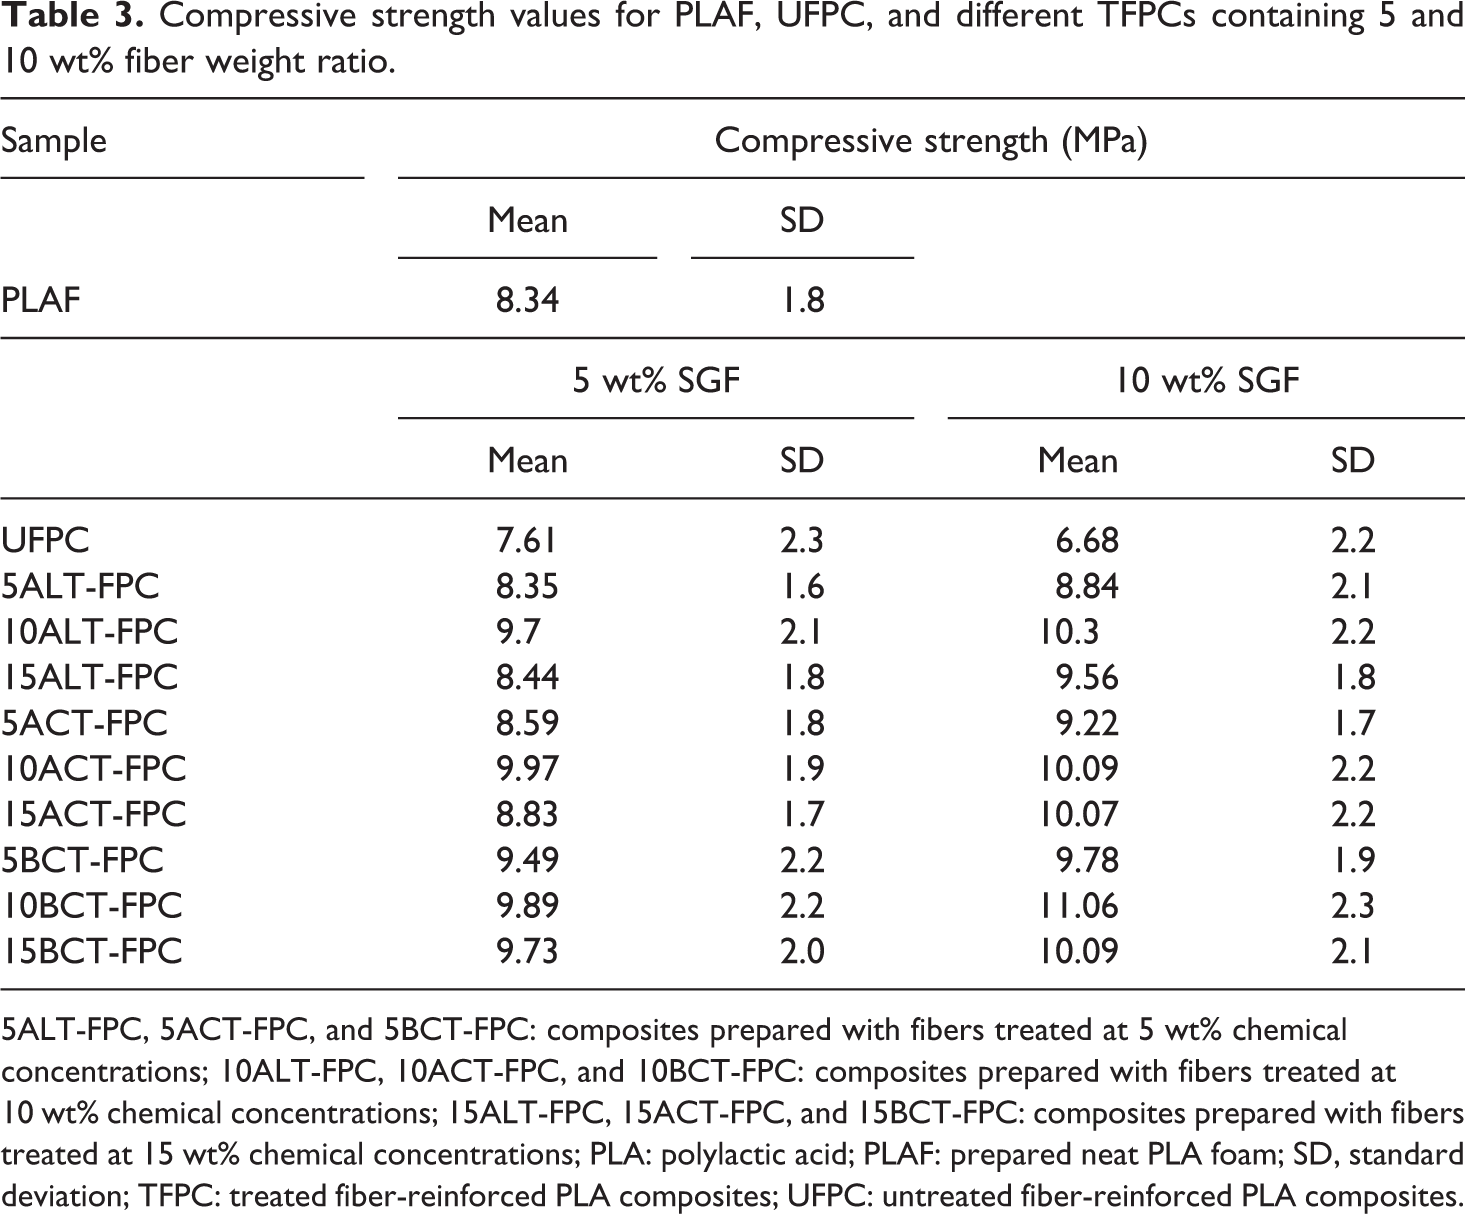
5ALT-FPC, 5ACT-FPC, and 5BCT-FPC: composites prepared with fibers treated at 5 wt% chemical concentrations; 10ALT-FPC, 10ACT-FPC, and 10BCT-FPC: composites prepared with fibers treated at 10 wt% chemical concentrations; 15ALT-FPC, 15ACT-FPC, and 15BCT-FPC: composites prepared with fibers treated at 15 wt% chemical concentrations; PLA: polylactic acid; PLAF: prepared neat PLA foam; SD, standard deviation; TFPC: treated fiber-reinforced PLA composites; UFPC: untreated fiber-reinforced PLA composites.
It is observed that the formation of cracks is extended in the samples without fibers. However, the increase in compressive strength due to SGF inclusion can be attributed to the improvement in the mechanical bond strength between the fibers and matrix where the fibers contribute to delay of microcrack formation and stop their propagation afterward up to a certain extent of fibers volume content. 37,38
Surface morphology
Figure 11 illustrates the FESEM micrograph of the fractured surface of PLAF. The surface of the image is not fairly smooth. The porosity of PLA increases when it is made PLAF by solution casting technique. Besides, a lot of flaws and voids are seen on the surface. In Figure 12(a) and (b), the images of UFPC of 5 and 10 wt% SGF, respectively, show a lot of weak interfaces, resulting in poor adhesion between fiber and matrix components. Huge pores are also found on the surfaces of the samples.
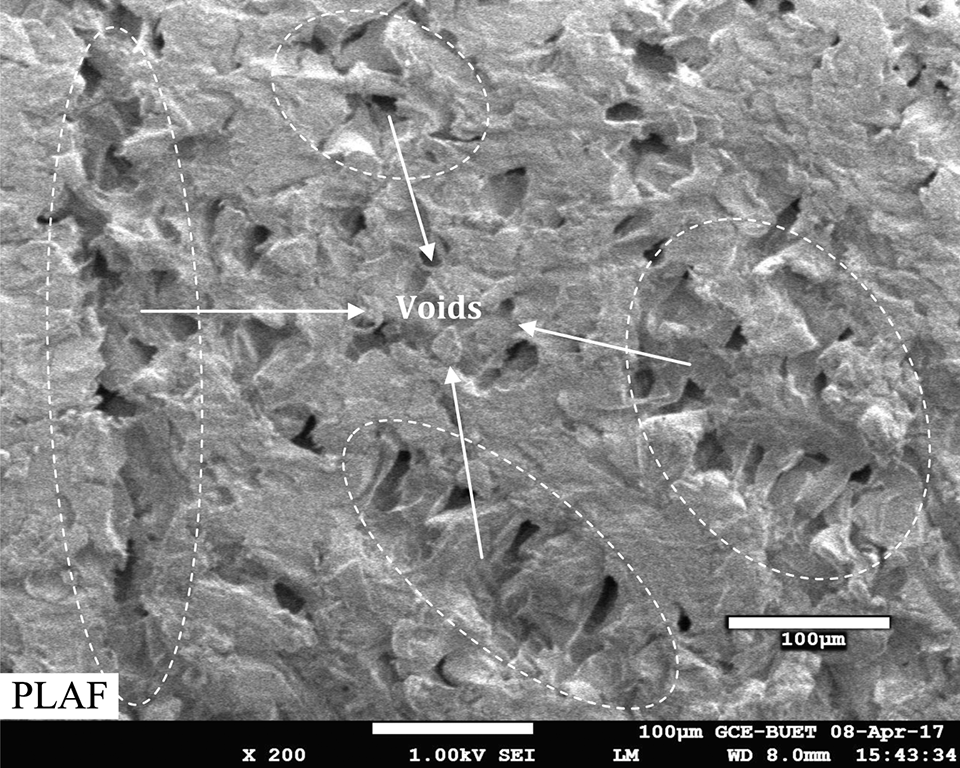
FESEM micrograph of the fractured surface by compressive strength test of PLAF. FESEM: field emission scanning electron microscope; PLA: polylactic acid; PLAF: prepared neat PLA foam.
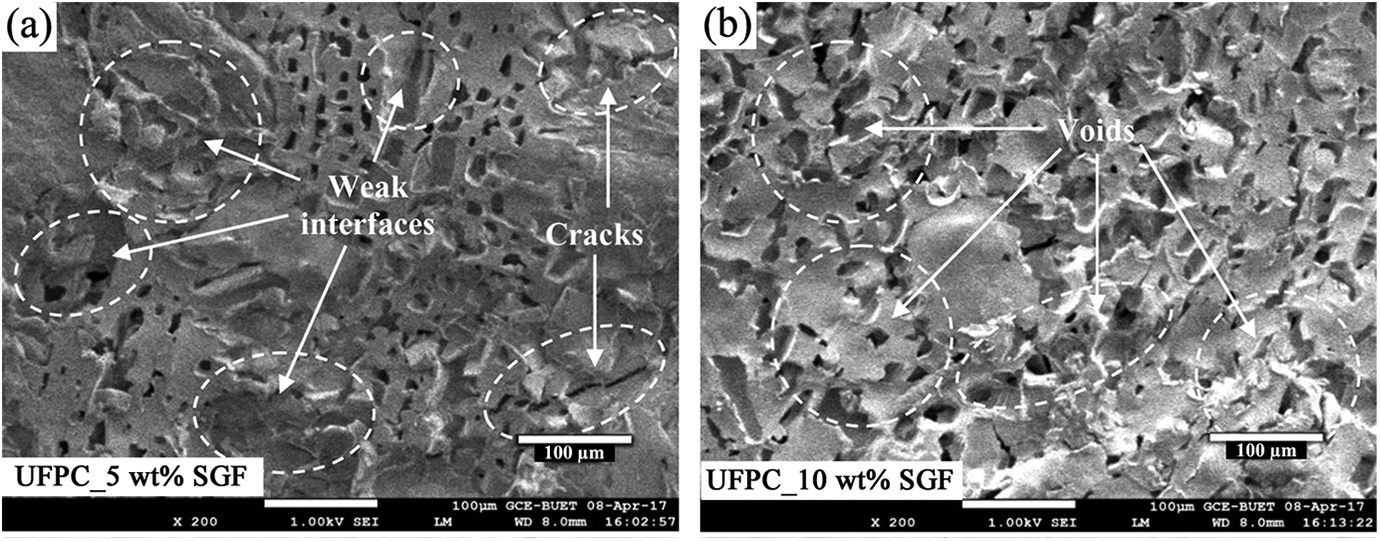
FESEM micrographs of the fractured surface by compressive strength test of UFPC, prepared with the fiber content of (a) 5 wt% and (b) 10 wt%. FESEM: field emission scanning electron microscope; PLA: polylactic acid; UFPC: untreated fiber-reinforced PLA composites.
Figure 13(a) to (c) represents the FESEM micrographs of the fractured surfaces of different TFPCs prepared by 5 wt% chemical concentration and 5 wt% SGF, and Figure 13(d) to (f) represents the FESEM micrographs of same TFPCs for 10 wt% SGF. Figure 13 shows that the impact between PLA matrix and SGF is moderate. It is clear that the surface of the 5 ALT-FPC for 5 and 10 wt% SGF are slightly rough but smoother than that of PLAF and UFPC. Here, it is clearly observed that the sample for 10 wt% SGF is smoother than that of the sample for 5 wt% SGF. In Figure 13(b) and (e), it is remarkable that the interfacial adhesion between matrix and SGF powder is found to be improved. In Figure 13(c) and (f), it is seen that the surface is a little bit rough, and some cracks are observed. Among these samples, the samples for 10 wt% SGF (Figure 13(d) to (f)) show better adhesion between SGF powder and matrix than the samples for 5 wt% SGF (Figure 13(a) to (c)), confirming that the increases of treated fiber improved the adhesion quality between the matrix and fiber.
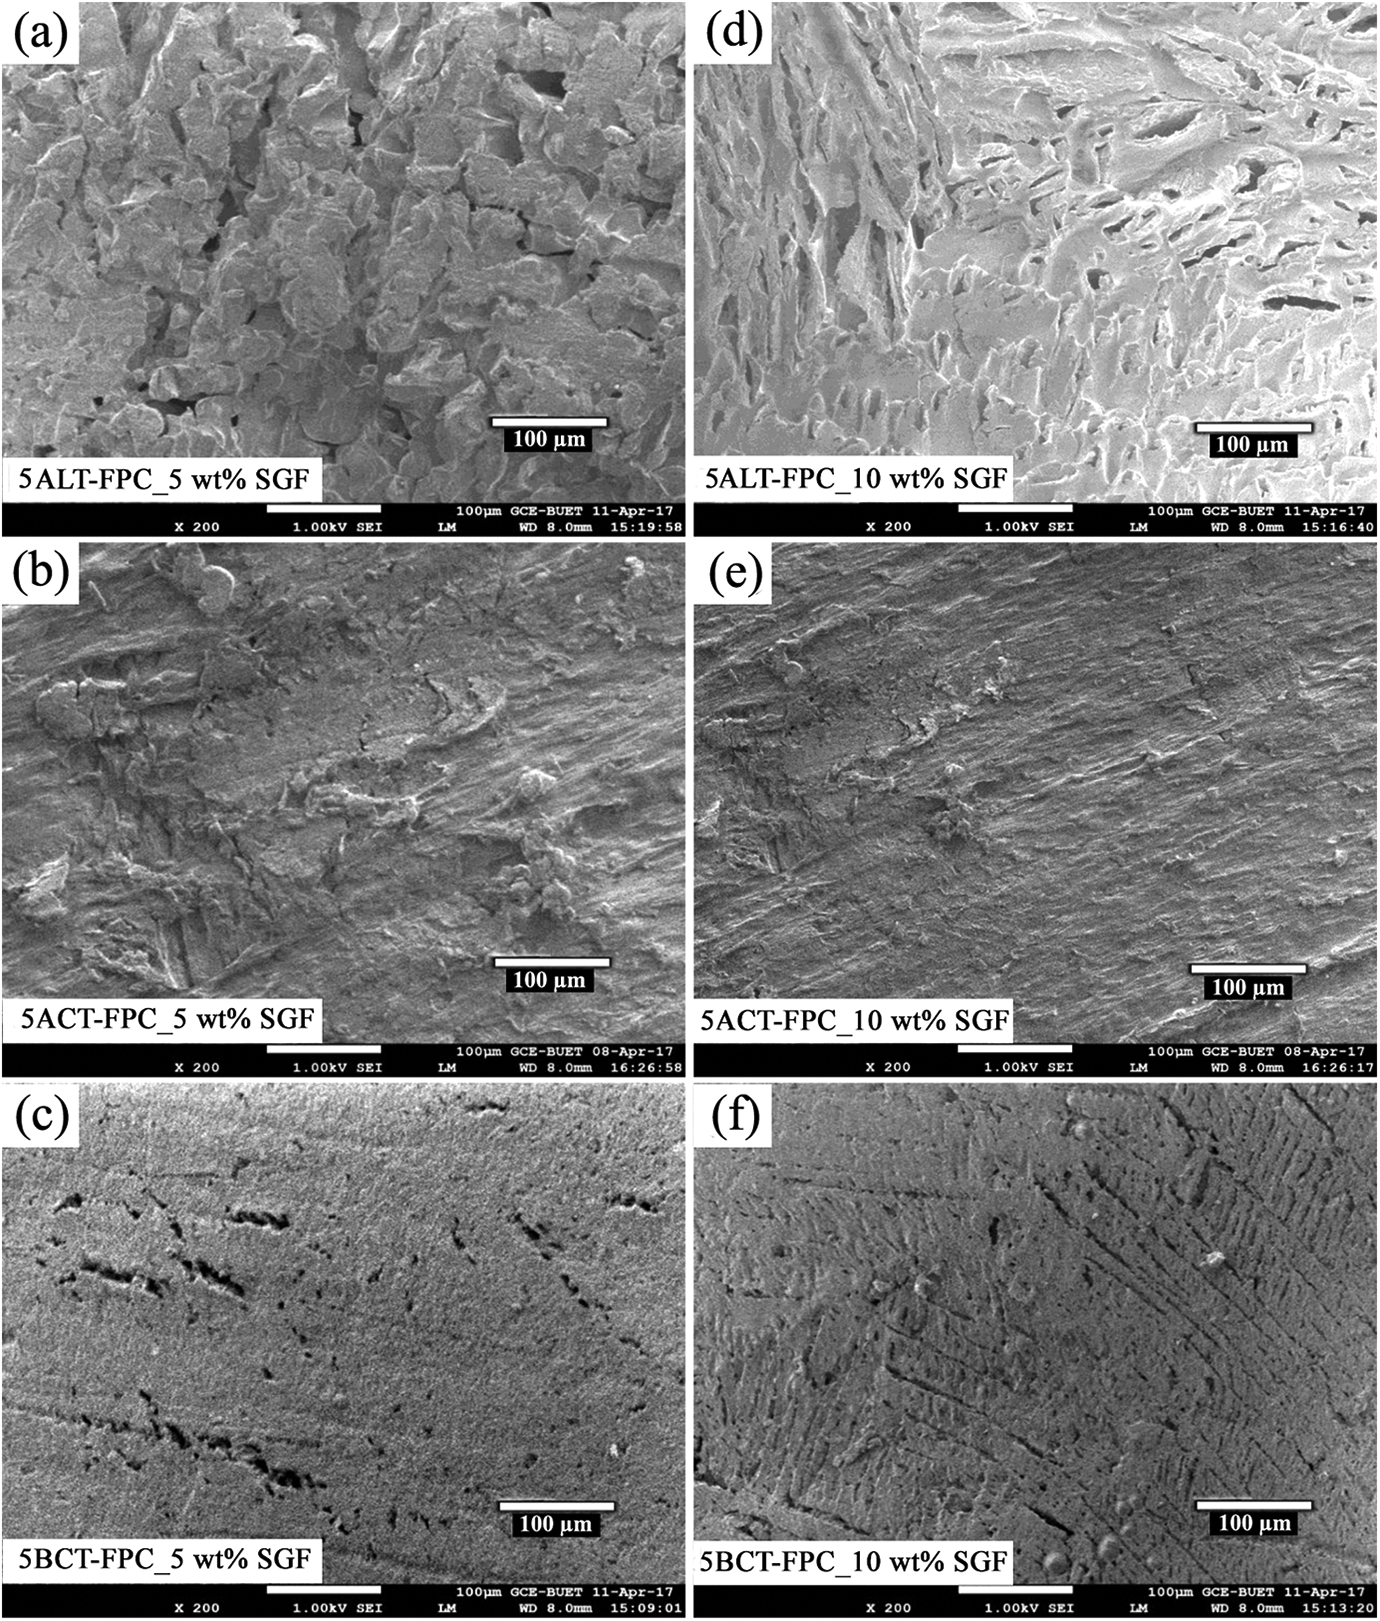
FESEM micrographs of the fractured surface by compressive strength test of 5ALT-FPC, 5ACT-FPC, and 5BCT-FPC, prepared with 5 wt% fiber content ((a), (b), and (c)) and 10 wt% fiber content ((d), (e), and (f)). 5ALT-FPC, 5ACT-FPC, and 5BCT-FPC: composites prepared with fibers treated at 5 wt% chemical concentrations; FESEM: field emission scanning electron microscope.
Figure 14(a) to (f) indicates the FESEM images of fractured surfaces of 10ALT-FPC, 10ACT-FPC, and 10BCT-FPC for 5 and 10 wt% SGF, respectively. Figure 14(a) and (d) is relatively smooth, indicating that the impact between fiber and matrix is good. It is clear that the surface of the 10ALT-FPC is smoother than that of 5ALT-FPC. Among these composites, the samples for 10 wt% SGF show better adhesion between SGF powder and PLA matrix than the samples for 5 wt% SGF. It is also clearly seen that the interfacial adhesion between SGF powder and PLA matrix of 10TFPCs is found to be improved than that of 5TFPCs.
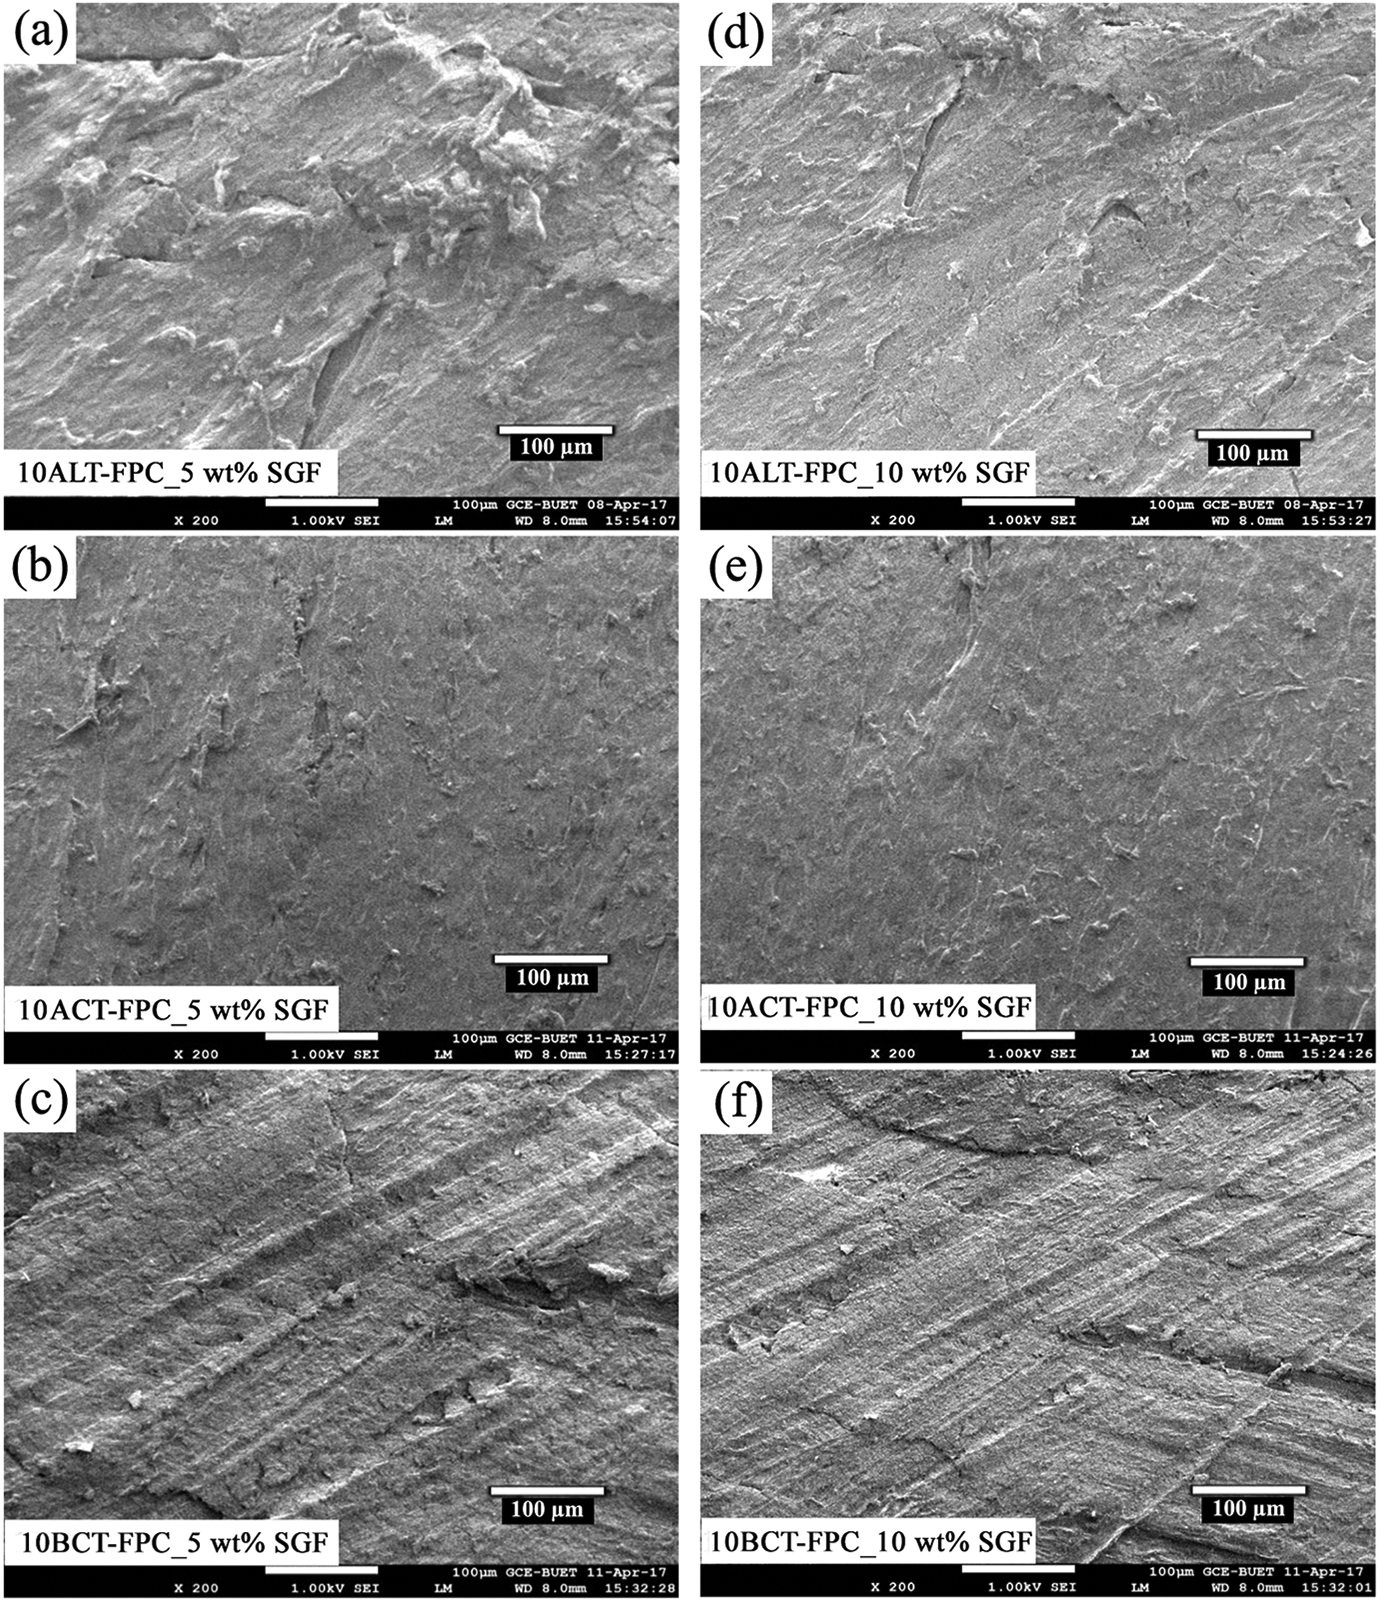
FESEM micrographs of the fractured surface by compressive strength test of 10ALT-FPC, 10ACTFPC, and 10BCT-FPC, prepared with 5 wt% fiber content ((a), (b), and (c)) and 10 wt% fiber content ((d), (e), and (f)). 10ALT-FPC, 10ACT-FPC, and 10BCT-FPC: composites prepared with fibers treated at 10 wt% chemical concentrations; FESEM: field emission scanning electron microscope.
Thermal analyses
Figure 15(a) and (b) illustrates the TGA thermograms of PLAF and UFPC as well as 5TFPCs and 10TFPCs with 5 wt% SGF weight ratio investigated in a temperature range of 35–600 °C. The on-set degradation for all samples occurs at higher temperature, precisely after 280 °C. The TGA sharp fall occurs at different temperatures, depending on the samples. However, the temperature at 50% WL (T50) is considered as the thermally stable temperature for the sample. 39 The on-set temperature (To), temperature at 50% WL (T50), and the end-set temperature (Te) values evaluated from the TGA curves of the samples are introduced in Table 4. From Figure 15 and the values of Table 4, it is clearly seen that the sample of 10BCT-FPC is thermally more stable than others.
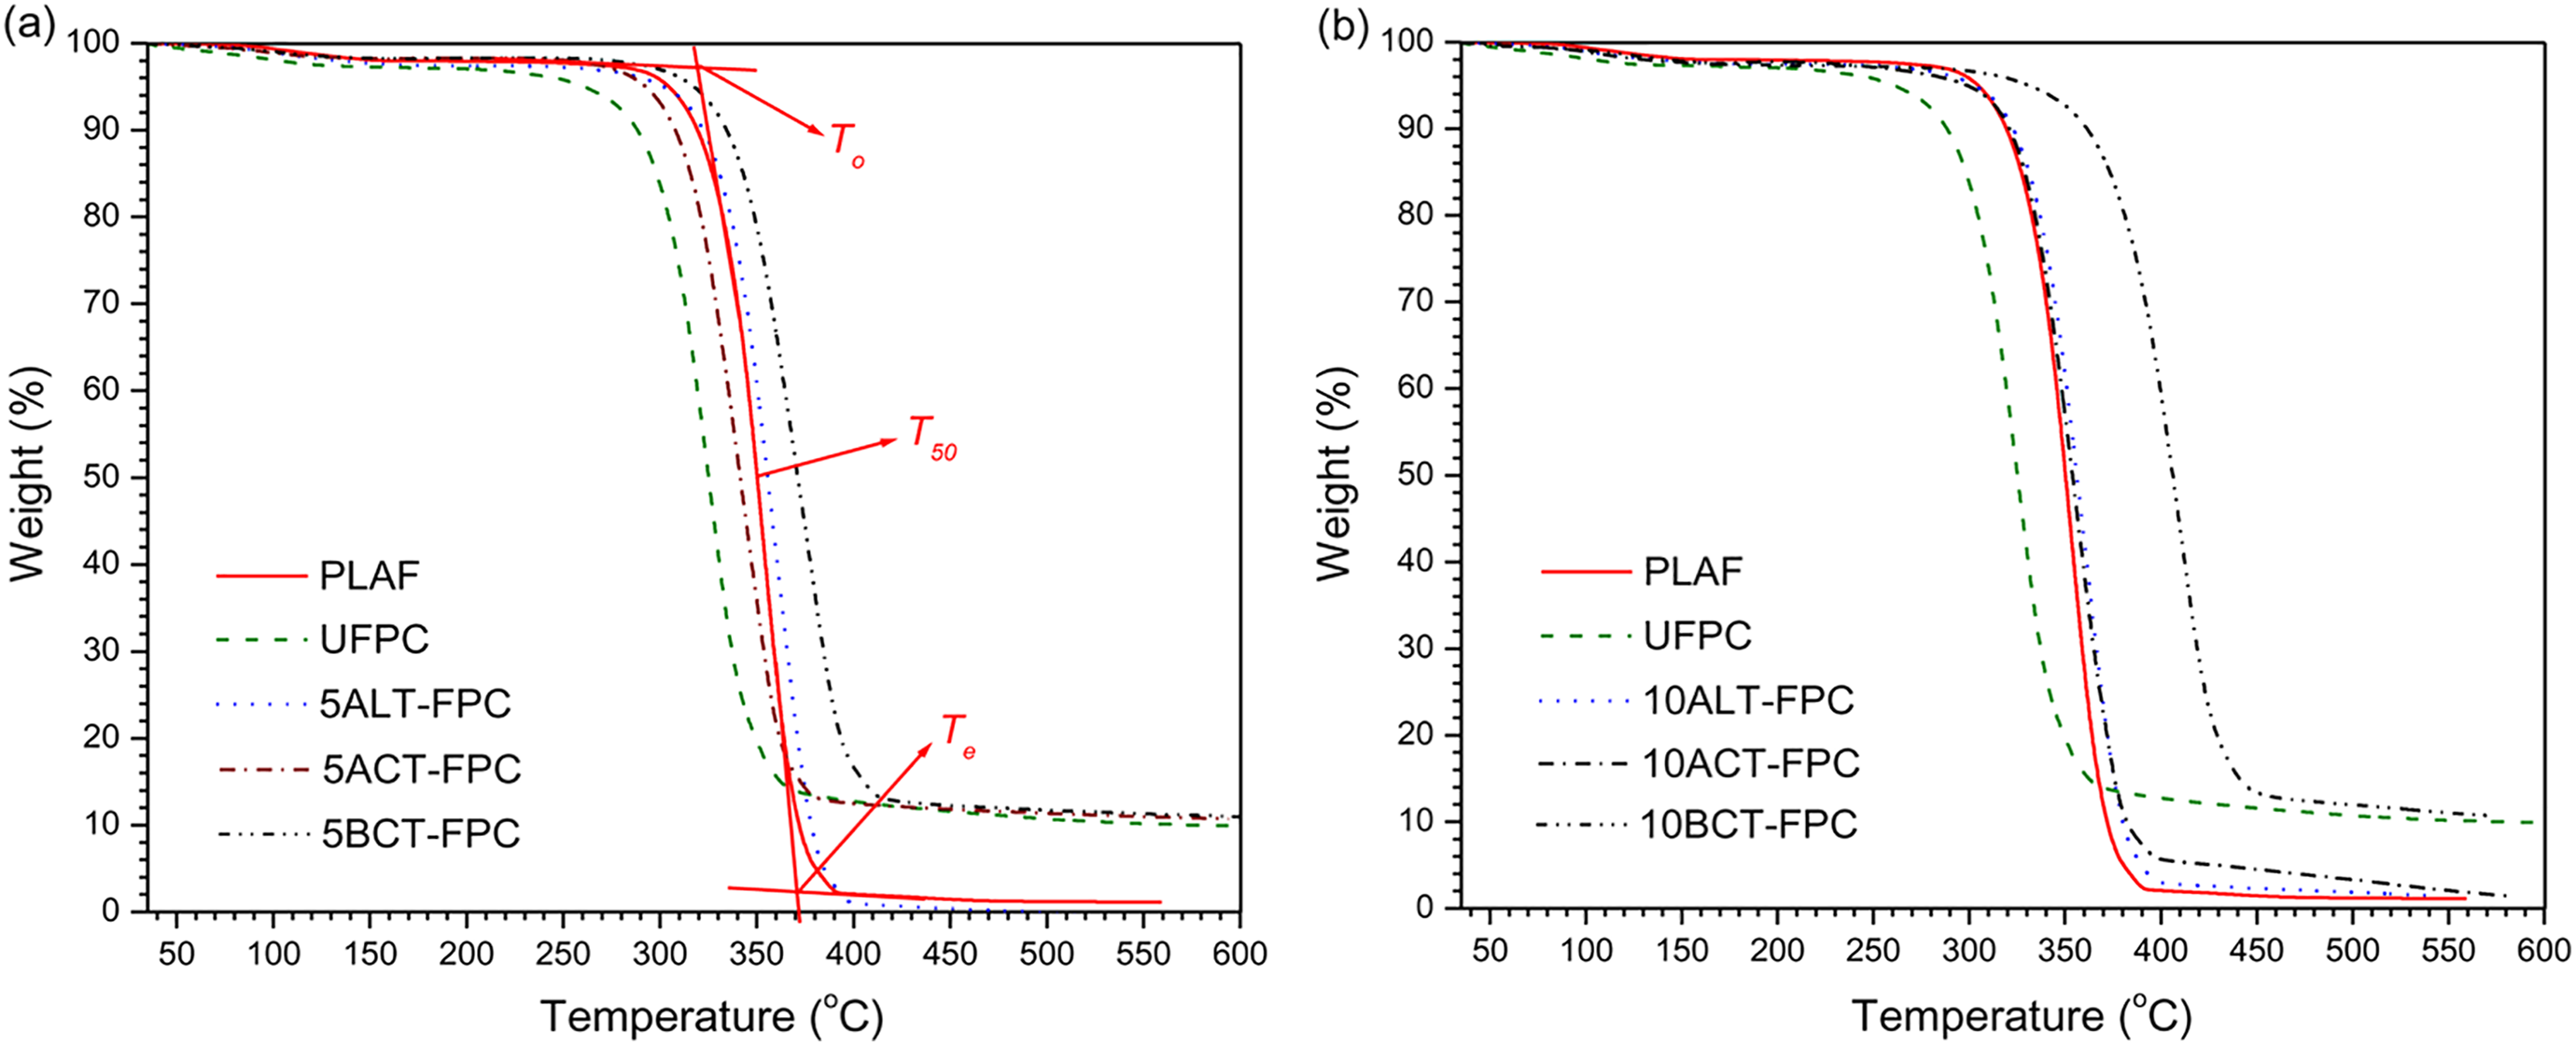
TGA curves for the sample of PLAF, UFPC, and different TFPCs for the chemical concentration of 5 wt% and (b) 10 wt%, prepared with 5 wt% fiber content. PLA: polylactic acid; PLAF: prepared neat PLA foam; TFPC: treated fiber-reinforced PLA composites; TGA: thermogravimetric analyzer; UFPC: untreated fiber-reinforced PLA composites.
To, T50, and Te values obtained from TGA thermograms data of PLAF, UFPC, and different TFPCs.
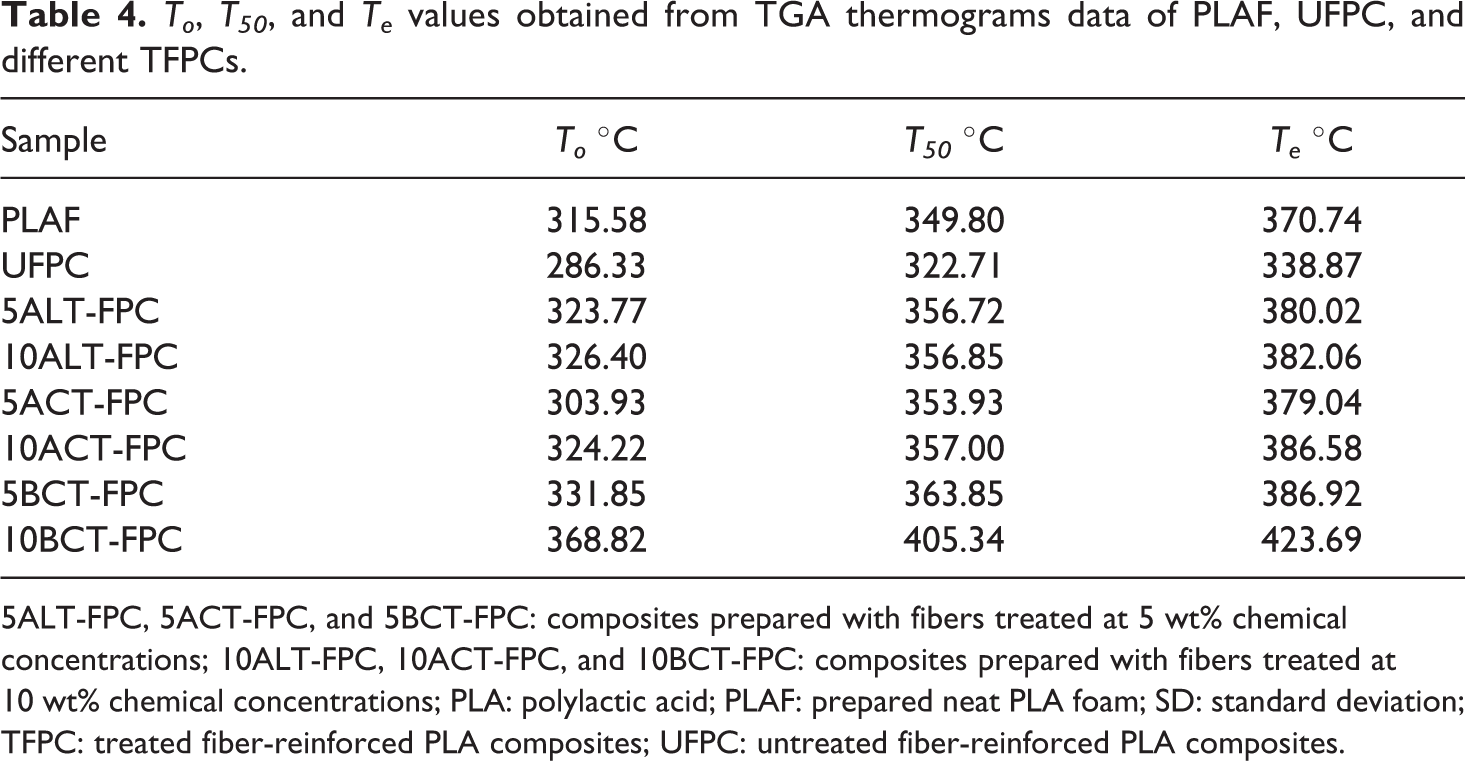
5ALT-FPC, 5ACT-FPC, and 5BCT-FPC: composites prepared with fibers treated at 5 wt% chemical concentrations; 10ALT-FPC, 10ACT-FPC, and 10BCT-FPC: composites prepared with fibers treated at 10 wt% chemical concentrations; PLA: polylactic acid; PLAF: prepared neat PLA foam; SD: standard deviation; TFPC: treated fiber-reinforced PLA composites; UFPC: untreated fiber-reinforced PLA composites.
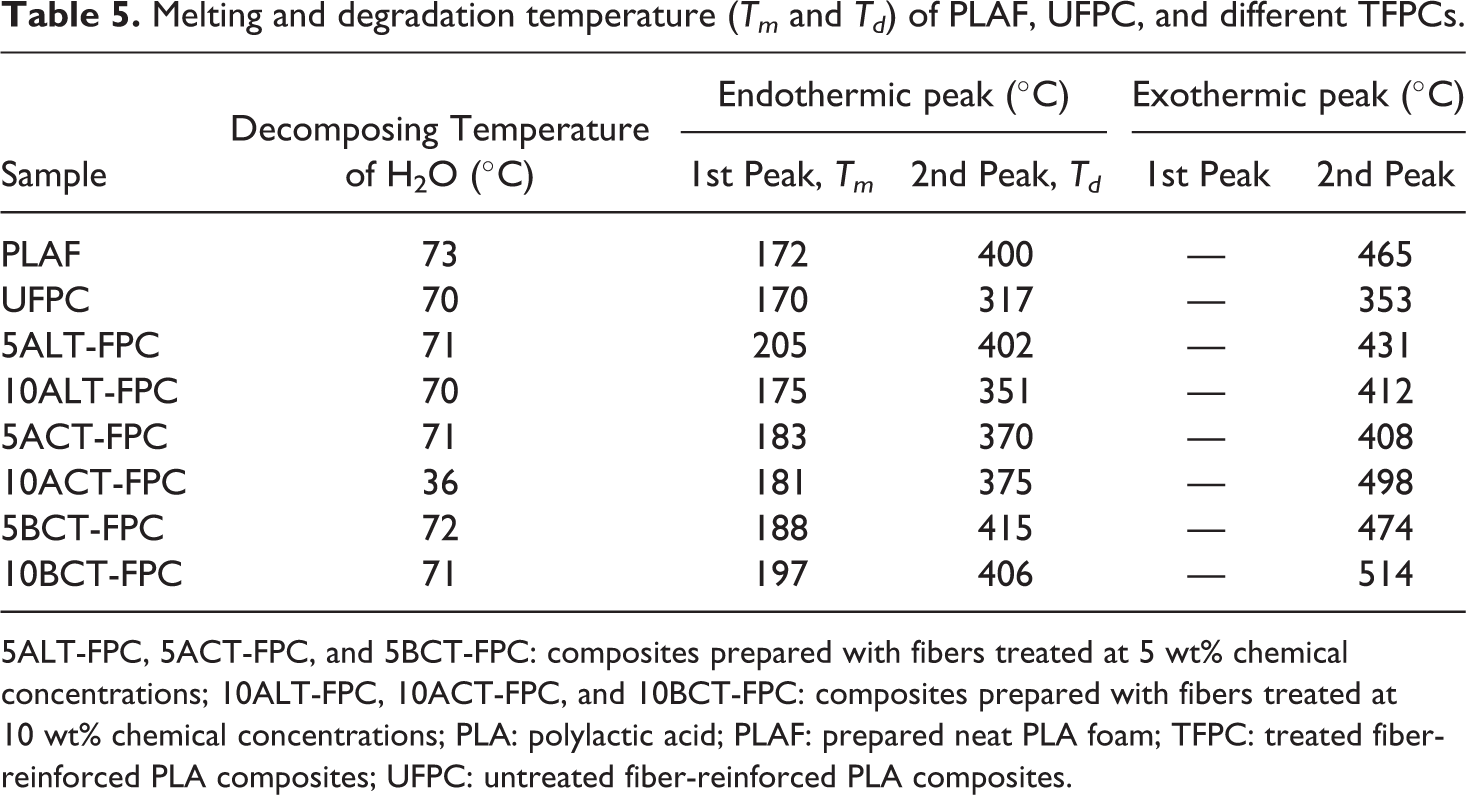
Figure 16(a) and (b) shows the DTA thermograms of PLAF, UFPC, and 5TFPCs and 10TFPCs with 5 wt% SGF investigated in a temperature range of 35–600°C. The starting points of first endothermic peak (Tpeak-1) of DTA for all samples indicate the melting temperature (Tm) of the samples. The starting point of second endothermic peak (Tpeak-2) corresponds to the degradation temperatures (Td) of the samples. The DTA indicates that the Tm value of 5ALT-FPC is more than others, but the value of Td is found to be highest for 5BCT-FPC. All of these values are presented in Table 5.
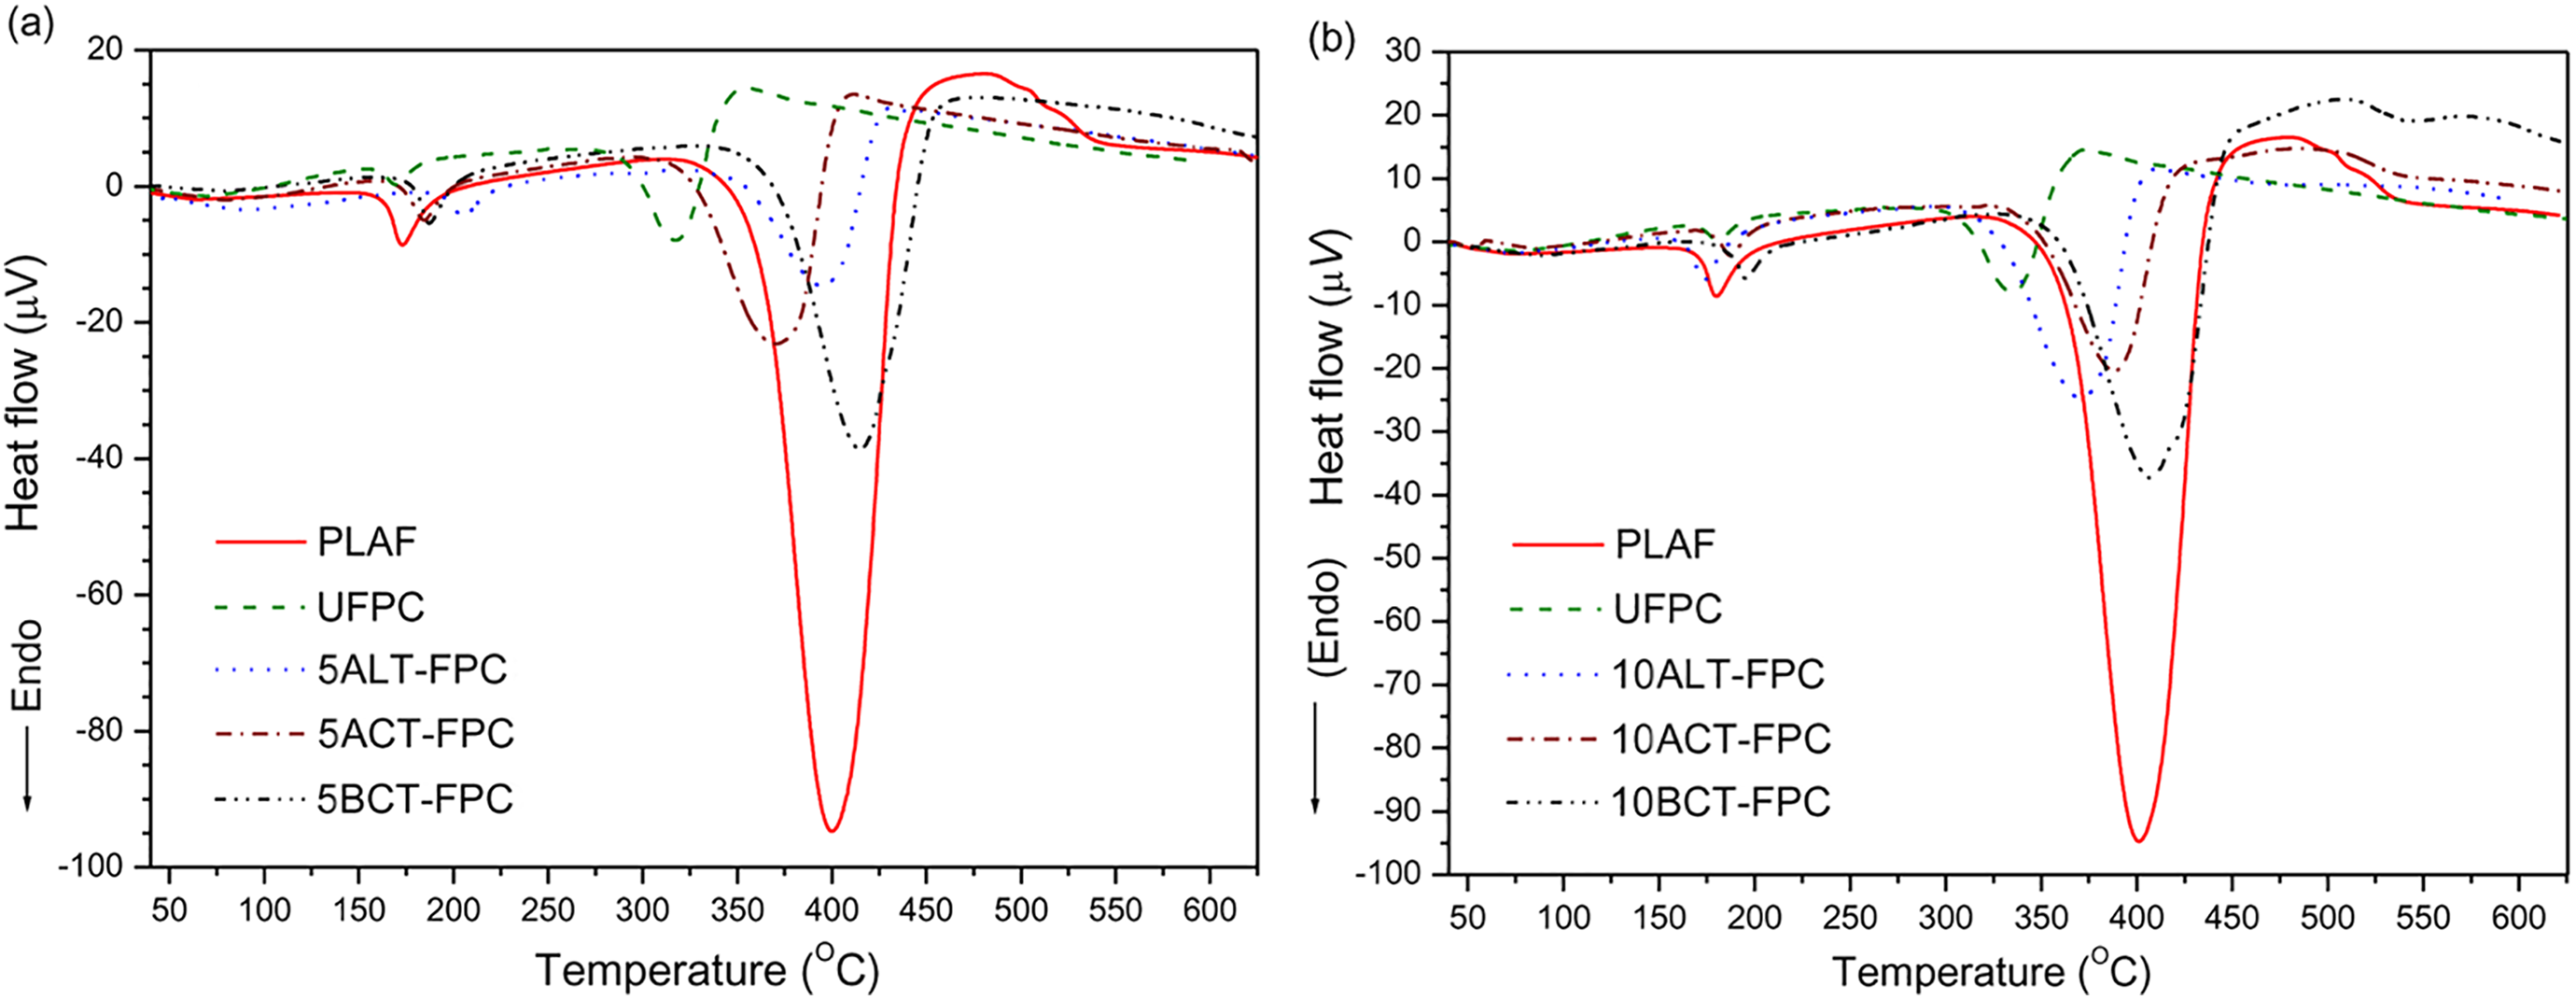
DTA curves for the sample of PLAF, UFPC, and different TFPCs for the chemical concentration of 5 wt% and (b) 10 wt%, prepared with 5 wt% fiber content. DTA: differential thermal analyzer; PLA: polylactic acid; PLAF: prepared neat PLA foam; TFPC: treated fiber-reinforced PLA composites; UFPC: untreated fiber-reinforced PLA composites.
Melting and degradation temperature (Tm and Td) of PLAF, UFPC, and different TFPCs.
5ALT-FPC, 5ACT-FPC, and 5BCT-FPC: composites prepared with fibers treated at 5 wt% chemical concentrations; 10ALT-FPC, 10ACT-FPC, and 10BCT-FPC: composites prepared with fibers treated at 10 wt% chemical concentrations; PLA: polylactic acid; PLAF: prepared neat PLA foam; TFPC: treated fiber-reinforced PLA composites; UFPC: untreated fiber-reinforced PLA composites.
The observed results strongly suggest that the benzoylated composites are thermally more stable than others, and the chemical treatments of SGF result in slow thermal decomposition. This may be connected to the different decomposition behaviors of the molecules of the differently treated SGF.
Conclusion
This research work has been undertaken to fabricate environmentally friendly biocomposites for biomedical, pharmaceuticals, food packaging, and household applications. The WA at room temperature found for UFPC is higher than that of PLAF and TFPCs. The chemical modifications of SGF have accelerated the degradation under soil of the composites, showing increased percentage of WL. The additional peak found for TFPC from the FTIR analyses demonstrates that the NaOH, (CH3CO)2O, and C6H5COCl have interacted chemically with the SGF. The increased intensity of the XRD peak suggests an increase in crystallinity of the composites. The CS of the composites increases by 10–35% with the incorporation of treated fibers into the PLA matrix. The highest values of mechanical strength are found for BCT-FPC with 10 wt% fiber weight ratio. The surface morphology of the samples shows that the formation of voids within the PLA matrix is minimized by fiber treatment, indicating that after the treatment of SGF with chemicals, the interfacial adhesion between PLA and SGF is improved. The chemical treatment of SGF has increased the thermal stability of the composites. The highest value of thermal stability is found for BCT-FPC.
Supplemental material
Supp_material - Material properties of sponge-gourd fiber–reinforced polylactic acid biocomposites: Effect of fiber weight ratio, chemical treatment, and treatment concentrations
Supp_material for Material properties of sponge-gourd fiber–reinforced polylactic acid biocomposites: Effect of fiber weight ratio, chemical treatment, and treatment concentrations by Taimur Al-Mobarak, MF Mina and MA Gafur in Journal of Thermoplastic Composite Materials
Footnotes
Acknowledgement
The authors gratefully acknowledge the Bangladesh Council of Scientific and Industrial Research for allowing facilities for this research.
Funding
The author(s) disclosed receipt of the following financial support for the research, authorship, and/or publication of this article: This work was financially supported by the Bangladesh University of Engineering and Technology.
Supplemental material
Supplementary material for this article is available online.
References
Supplementary Material
Please find the following supplemental material available below.
For Open Access articles published under a Creative Commons License, all supplemental material carries the same license as the article it is associated with.
For non-Open Access articles published, all supplemental material carries a non-exclusive license, and permission requests for re-use of supplemental material or any part of supplemental material shall be sent directly to the copyright owner as specified in the copyright notice associated with the article.