
Abstract
This work reports on the effect of expandable graphite (EG) on the morphology, thermal and dynamic mechanical properties of flame retardant poly(lactic acid) (PLA)/EG composites. The composites were prepared by melt-mixing and their structure, morphology, melting and crystallization behaviour, as well as their dynamic mechanical properties, were investigated. It was found that graphite layers still existed in an aggregate structure with poor filler dispersion resulting in a lack of interfacial adhesion between EG and the PLA matrix. The presence of EG did not favour the crystallization of PLA, increased the glass transition temperature and showed a reduction in the crystallinity of the composites. The composites with higher filler contents showed enhanced storage and loss moduli. The glass transition temperatures from the loss modulus and damping factor curves varied inconsistently with EG content. The use of commercial EG as filler in PLA can preserve the thermal properties of injection moulding grade Cereplast PLA.
Introduction
Among all the biodegradable polymers, poly(lactic acid) (PLA) is the most highly produced biodegradable aliphatic polyester, and it is available at a relatively modest cost. It is applied in the medical and pharmaceuticals, textiles, packaging and composites industries. PLA has advantages of eco-friendliness, biocompatibility, processability and energy efficiency during production. However, due to the inherent limitations of PLA which include hydrophobicity, poor flammability performance and slow crystallization rate, the development and characterization of PLA/filler (e.g. PLA/expandable graphite (EG)) composites are necessary. 1 –10
The structure and morphology of a polymer/filler composite are fundamental to the understanding and furthering of the applicability of composite materials. The valuable information provided by these properties include (i) the spatial arrangement of atoms, molecules and layers of the polymer and platelet-like filler material, such as PLA and EG; (ii) the distribution and/or dispersion of filler within the polymer matrix; (iii) the intercalation and/or exfoliation of a filler and (iv) the level of interaction (i.e. interfacial adhesion) between the filler and the matrix. Different technologies are used to obtain the above-mentioned and include inter alia, X-ray diffraction (XRD) and scanning electron microscopy (SEM). 11 For instance, it was reported that the melt-mixing process, during the fabrication of PLA/filler (i.e. clay and/or graphite) composites, cannot separate the graphite layers in which the majority still existed in an aggregate structure. 3,12 In the case of graphite, the structure and morphology of EG (an intercalated compound produced by the chemical or electrochemical intercalation of molecular or atom guests (i.e. oxidants such as H2SO4 or HNO3 and KMnO4)) were characterized through Raman spectroscopy, SEM and XRD. 3,13 –16 Focke et al. 17 reported that commercial EG exhibited a characteristic reflection peak and/or, at least, a shoulder similar to that of natural graphite due to the presence of extra unreacted or partial sulphate intercalated graphite layers. Other authors reported that EG particles were uniformly dispersed in PLA and that the composites showed flat surfaces with some holes. This was explained through the EG particles being large and having poor compatibility with the PLA matrix. 18 Such structural and morphological characteristics have an influence on other properties, such as thermal transitions (i.e. melting and crystallization) of the polymer composite.
The thermal transition temperatures of polymers and their composites are an integral part of the understanding of the possible-working temperatures (e.g. processing) of materials. They are influenced by the structure and morphology of the materials. These provide information on the melting and crystallization properties. For instance, the melting temperature (T m) of a polymer crystal is dependent on the crystal and/or the lamellar thickness (l). 19 Furthermore, melting is affected by various factors including (i) chemical structure (i.e. stiffness of the main polymer chain, presence of polar groups, as well as the type and size of side groups present on the polymer backbone), (ii) molar mass and degree of chain branching and (iii) copolymerization. For example, the melting of PLA was influenced by the incorporation of filler. 3 In a study where the effect of two-layered silicate clays (montmorillonite and fluoro-hectorite) on the thermal, mechanical and degradation properties of PLA were investigated, Fukushima et al. 3 reported that the presence of clays led to PLA melting with double peaks. They explained this as being due to the presence of the α- and β-crystal structures. The former is said to be highly ordered, as it melts at high temperatures and is the most prevalent polymorph of PLA. The latter was related to a low-melting endotherm with imperfect crystal structure. Cereplast PLA and its clay composites also exhibited two endotherms, and they were attributed to the melting of crystallites with different sizes and/or perfection ordering. 20
The degree of crystallinity was also found to have an important effect on the physical properties of a polymer. Crystallization is said to be a two-step process of nucleation and growth of the crystal nucleus. This is influenced by various crystallization thermodynamic and kinetic theories. From this, the crystallization temperature (T c) of polymeric materials is obtained. 19,21 Generally, PLA may not crystallize on cooling since its crystallization is typically too slow to develop significant crystallinity. It may, however, be induced by strain such as in processes used to produce bottles. 3 Its crystallization may be mainly observed on heating by differential scanning calorimetry (DSC) where a cold-crystallization exotherm is observed above T g. Fukushima et al. 3 and Chapple et al. 20 reported an enhanced cold-crystallization rate in the presence of clays, as shown by a reduced cold-crystallization temperature (T cc), especially at high filler loadings. 3 This was related to the effective nucleation role played by clays. 20 It was also reported that the overall crystallinity of the PLA/clay composites was increased in the presence of clays due to the combination of crystallization during cooling and heating stages 3 and the d-isomer content of the pure PLA. 20
The transition from a glass to a rubber-like state, known as the glass transition temperature (T g), marks a region where dramatic changes in the physical properties are observed. 21 It is affected by several factors including (i) chemical structure (i.e. chain flexibility, steric effects and/or nature of side groups), (ii) copolymerization and (iii) molecular architecture (i.e. molar mass, branching and crosslinking). The value of T g may (i) increase with increasing molar mass, (ii) either be reduced in the presence of a small number of branches or increased when high density branching is present on a polymer chain and (iii) be increased in the presence of chemical crosslinks due to reduced specific volume, thus reduced free volume, and difficulty in molecular motion. 19,21 For example, the T g of PLA/clay composites containing 10 wt% montmorillonite and fluoro-hectorite was lowered by 7°C and 16°C, respectively, and this was attributed to a reduction in the molecular weight of PLA during melt processing. 22 Chapple et al. 20 reported a slight reduction in T g of pure and Cereplast PLA/clay composites and explained it through the plasticizing effect of the organic modifier in the clay.
The dynamic mechanical properties of a polymer are also dependent on the presence of filler in the polymer/filler systems. It is generally expected that the addition of fillers to polymer matrices would result in improved properties, including better tensile and flexural strengths, higher modulus, dimensional stability and higher heat distortion temperature. 23 For example, the addition of clay in PLA was reported to have a considerable effect on the elastic properties of the composites. The storage modulus as a function of temperature increased in the presence of 5 and 10 wt% clay, below and above the T g. This was associated with the (i) reinforcement effect of clays, (ii) good clay dispersion level, (iii) increased polymer composite crystallinity and (iv) more restricted movements of the polymer chains above T g. 22 Although EG has been used as a flame retardant in LDPE, 24 PVC 25 and PLA, 26 relatively little work has been presented on the effect of commercial EG on the morphology and structure, melting and crystallization and the dynamic mechanical properties of PLA/EG flame retardant composites. These composites may have the potential applications in fields such as electric and electronics.
The aim of this study was to investigate the morphology, structure, melting and crystallization and the dynamic mechanical properties of flame retardant PLA/EG composites. The objectives were (i) to prepare PLA/EG composites by melt-mixing at 5, 10 and 15 wt% EG loadings and (ii) to characterize the composites using XRD, SEM, DSC and dynamic mechanical analysis (DMA).
Materials and methods
Materials
The poly(lactic acid) (PLA) used in this study was a Cereplast Sustainable 1001 injection moulding grade containing additives derived from starch and other renewable resources as well as silicon-based materials (i.e. glass) 20 with physical properties as shown in Table 1. The commercial EG used was an ES250 B5 grade consisting of 90–95% carbon content, expansion rate of 250–500 cm 3 g−1 at a starting temperature range of between 180°C and 300°C and a particle size of 80% of the particles >300 µm, supplied by Qingdao Kropfmuehl Graphite, China. The EG contained KMnO4 as an oxidant and H2SO4 as an intercalant. 17,28 The materials were used as received from the suppliers without any modification/purification except for drying in an oven at 50°C overnight prior to the sample preparation.
Physical properties of PLA, Cereplast Sustainable Resin 1001 grade. 27
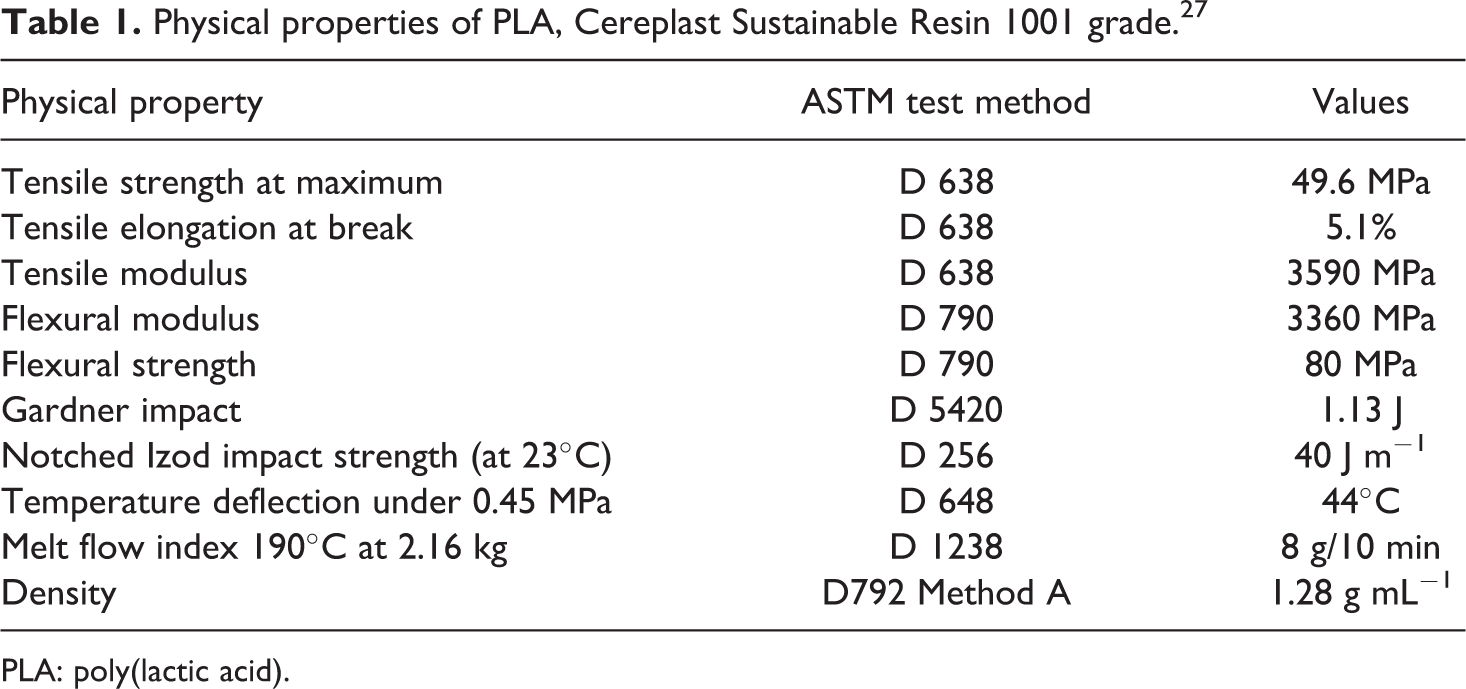
PLA: poly(lactic acid).
Sample preparation
Samples were compounded according to the ratios shown in Table 2 after drying overnight. They were prepared by melt-mixing using a Brabender Plastograph with a mixing volume of 55 cm 3 . The mixing temperature was 180°C at a rotational speed of 60 r/min for 12 min. This was followed by hot melt pressing at 180°C under 50 bar for 5 min in order to obtain 140 × 140 × 2 mm square sheets.
Sample compositions of PLA/EG composites.
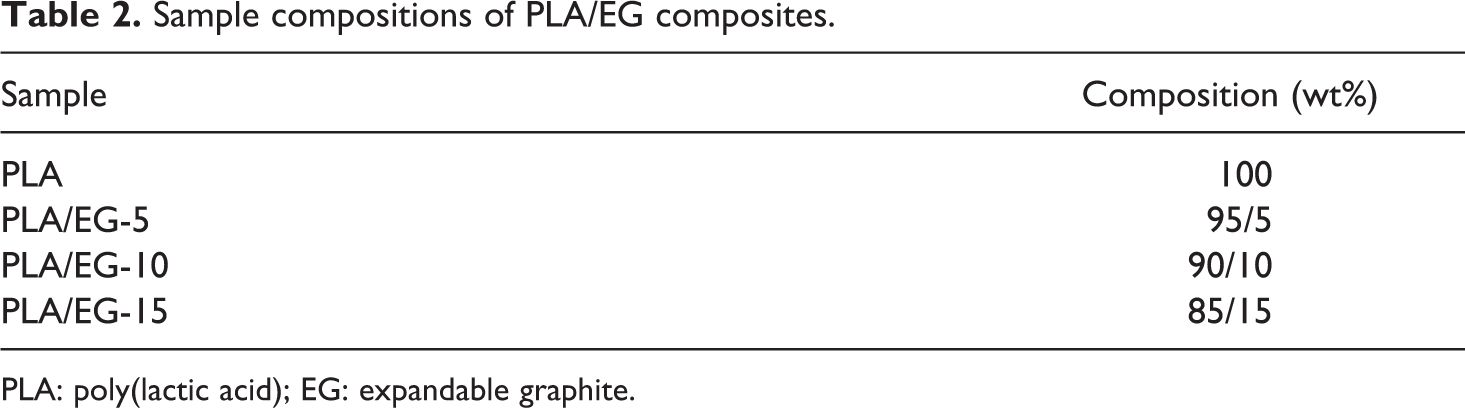
PLA: poly(lactic acid); EG: expandable graphite.
Sample analysis
The crystalline structures of EG and PLA/EG were determined through XRD. A D8 Advance diffractometer (BRUKER AXS, Germany) with position sensitive detector (PSD) Vantec-1 detectors and Cu Kα
radiation (λ = 1.5406 Å = 0.15406 nm), a tube voltage of 40 kV, a current of 40 mA and a V20 slit were used. The samples were scanned in locked couple mode with 2θ increments (2θ range of 0°–100°) in 0.5 s steps. The inter-layer distance (i.e. d-spacing) of the EG in the composites was calculated using the following Bragg’s diffraction equation:
20

DSC analyses were done on a Perkin Elmer Pyris-1 differential scanning calorimeter under nitrogen flow (20 mL min−1). Samples were held at 0°C for 1 min, heated from 0°C to 180°C at a heating rate of 10°C min−1, cooled at the same rate and then heated again under similar conditions. The peak temperatures of melting and crystallization, as well as the melting and crystallization enthalpies, were determined from the second scans in order to eliminate any thermal history effects. The results are reported as average values of three tests with standard deviations.
In order to determine the morphology of the samples, a TESCAN VEGA3 SEM was used, and the analysis was done at room temperature. The samples were prepared by immersion in liquid nitrogen followed by fracturing (i.e. cryo-fractured). The cryo-fractured samples were then coated with gold by sputtering for 60 s in order to produce conductive coatings onto the samples.
The dynamic mechanical properties of the samples were tested using a Perkin Elmer Diamond DMA dynamic mechanical analyser. The tests were performed in a bending (dual cantilever) mode at a frequency of 1 Hz and a heating rate of 3°C min−1, under nitrogen atmosphere. The samples were heated from −90°C to 130°C.
Results and discussion
X-ray diffraction
The X-ray diffraction (XRD) results for the investigated composites are shown in Figures 1 and 2. The corresponding data are summarized in Table 3. EG exhibits diffraction peaks with different intensities within a 2θ range of 24°–30° (Figure 1(a)). From these, three reflection peaks are noted. Firstly, a strong peak is observed at 2θ = 25.8°, which is related to an interlayer distance of 0.35 nm. Since EG consists of an acid (H2SO4) intercalated within its layers, 17 this major peak is attributed to the acid-intercalated layers of EG. 29 Secondly, a peak shoulder is observed at 2θ = 26.6° with a d-spacing of 0.34 nm (Table 3) between the graphite sheets. This is due to the stacking of single layers of graphite with a (002) basal reflection. 3,4,12,17 Finally, a broad peak at around 2θ = 28.1° with a d-spacing value of 0.33 nm is also noted. PLA shows different peaks at 2θ = 9.5°, 16.6°, 19.0° and 28.7° (Figure 1(b)). The second and third peaks (i.e. 2θ = 16.6° and 19.0°), respectively, correspond to d-spacing values of 0.27 and 0.24 nm, with (200/110) and (203) basal reflections. Both are attributed to the stable α-form of PLA with an orthorhombic crystalline structure. 30 –32 The other diffraction peaks at 2θ = 9.5° and 28.6° are related to the additives derived from starch and other renewable resources (see ‘Materials’ section). 20 Additionally, it is observed that the XRD diffractogram of PLA consists of a broad halo within a 2θ range of 10°–26° which is attributed to the amorphous structure of the PLA matrix. 20,33,34
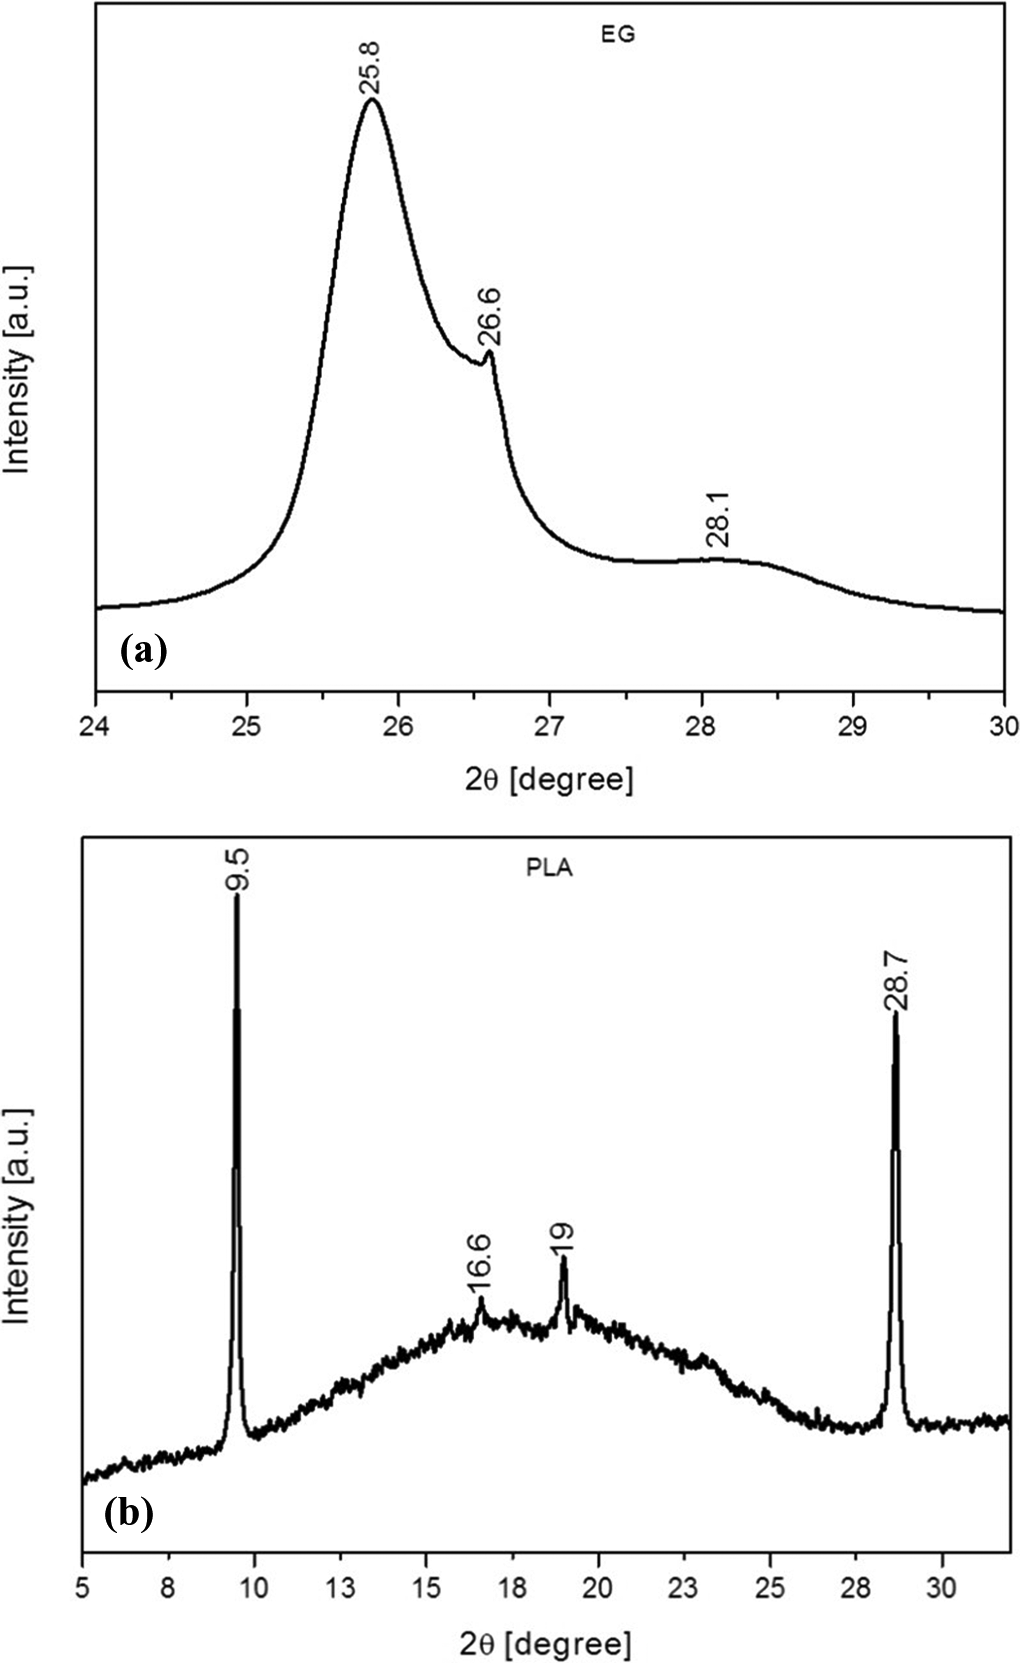
X-ray diffraction spectra of (a) EG and (b) PLA. EG: expandable graphite; PLA: poly(lactic acid).
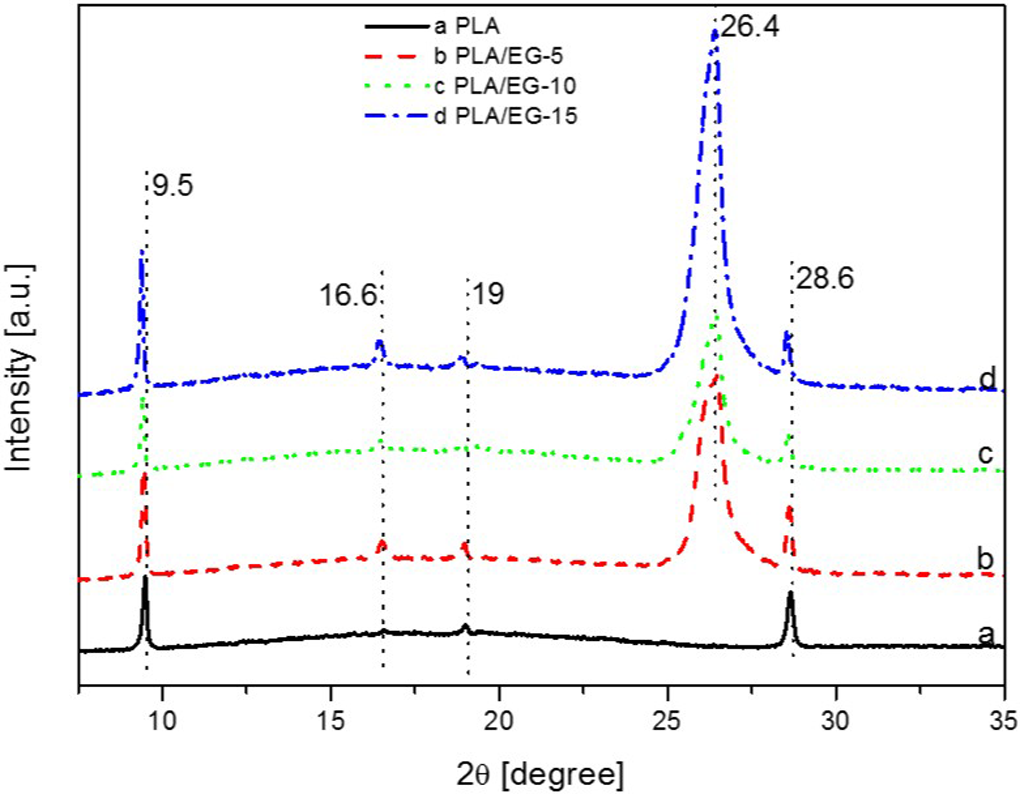
X-ray diffraction spectra of PLA/EG composites. PLA: poly(lactic acid); EG: expandable graphite.
Basal spacing of neat EG, PLA and PLA/EG composites.
PLA: poly(lactic acid); EG: expandable graphite
The XRD patterns of the PLA/EG composites are shown in Figure 2. It can be seen that they are characterized by a broad halo (i.e. 2θ range of between 10° and 26°) and several diffraction peaks. The existence of a diffraction peak at 2θ ≈ 26.5°, in addition to those attributed to PLA (i.e. 2θ = 9.4°, 16.5°, 19.0° and 28.7°), is related to the EG in the PLA matrix. Generally, the peak at 2θ ≈ 26.5°, due to EG occurs at the same position in all the composites. This suggests that the melt-mixing process could not separate the graphite layers, thus the majority of them still exist in the aggregate structure (i.e. EG-layered stacks). Similar findings were reported by Fukushima et al. 3 and Narimissa et al. 12 in their studies of melt-processed PLA/nano-filler composites. In the case of the EG component of the composites, some peaks (especially 2θ = 25.8° and 28.1°) are absent after melt-mixing, which suggests that the acid intercalated layers may have arranged themselves into agglomerates that are distributed throughout the matrix. As seen from Table 3, there was generally no change in the 2θ angles of the PLA/EG composites with respect to the neat materials. The diffraction peak intensities related to EG from the PLA/EG composites increased at high EG loadings in the order: EG-10 < EG-5 < EG-15 (Figure 2). From the results, it is concluded that melt-mixing of EG with PLA did not separate the graphite layers and that they were still present in an aggregate form in the composites.
Scanning electron microscopy
The scanning electron microscopy (SEM) images of the cryo-fractured surfaces of neat PLA and the PLA/EG composites at different magnifications are shown in Figures 3 and 4. The PLA consists of various additives and/or components (Figure 3). These additives are in different shapes and sizes with varying degrees of interfacial adhesion with the matrix. Firstly, there are micro-spheres that are fairly well distributed in the PLA matrix, as indicated with arrows in Figure 3(a). Figure 3(b) shows that there is a reasonably good interfacial adhesion between the micro-spheres and the matrix (indicated with an arrow). Secondly, platelet-like materials of different sizes are also recognized (Figure 3(c)), and although there are some gaps between these and the matrix, some level of adhesion can be seen. Thirdly, some droplet-like morphology with good interfacial adhesion and an even distribution are observed (see arrows marked 1 in Figure 3(d)). This is attributed to the presence of starch-derived additives in Cereplast PLA. 20,27 Lastly, little bead-like materials in circular formations (as indicated with arrows marked 2 in Figure 3(d)) are observed. These are attributed to the presence of silicon-based materials (i.e. glass). Such silicon-based materials were identified by Chapple et al. 20 in their study of the fire resistance, thermal and mechanical properties of PLA/starch/clay composites.
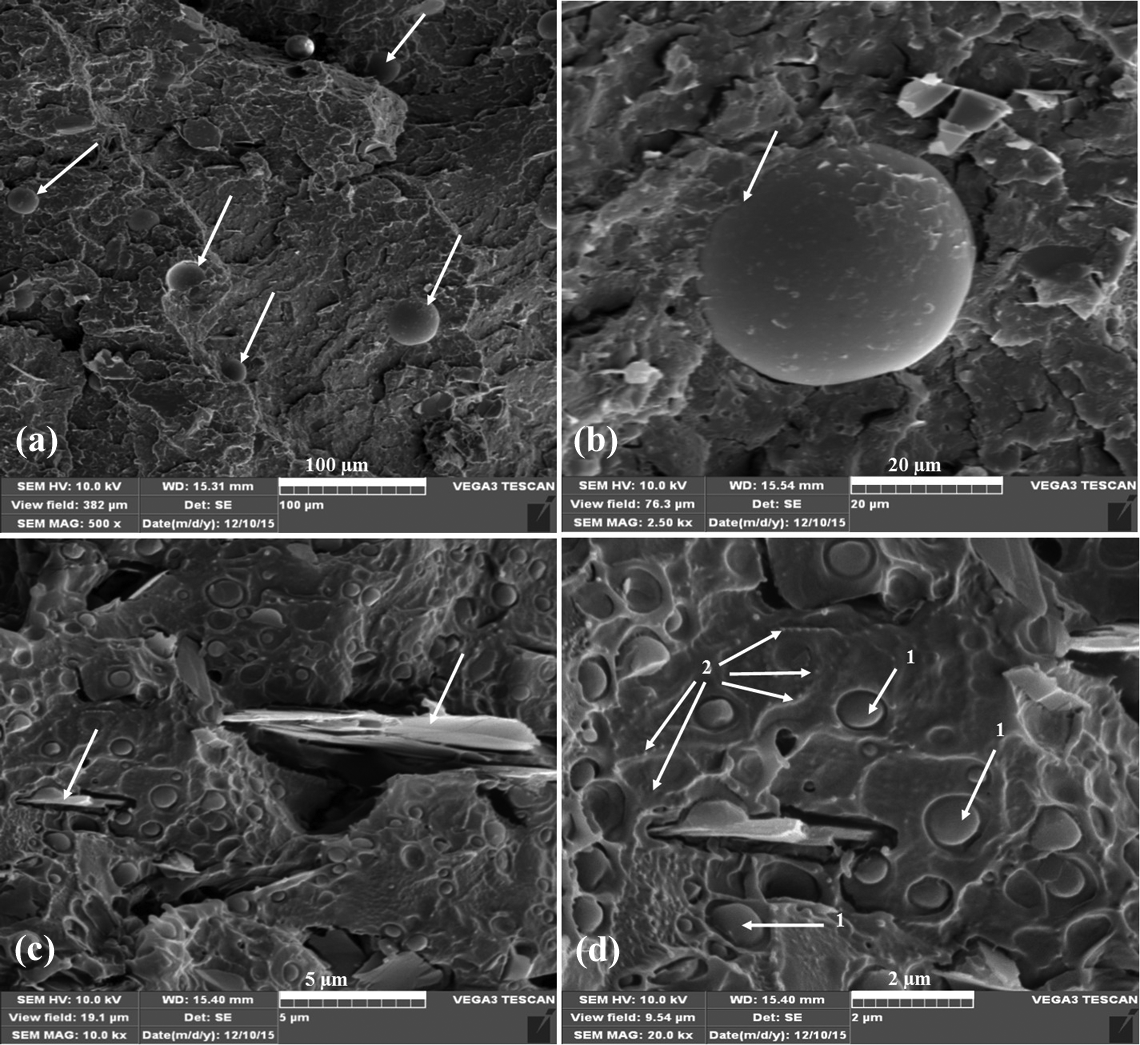
SEM micrograph of cryo-fractured PLA/EG composites at various magnifications. SEM: scanning electron microscopy; PLA: poly(lactic acid); EG: expandable graphite.
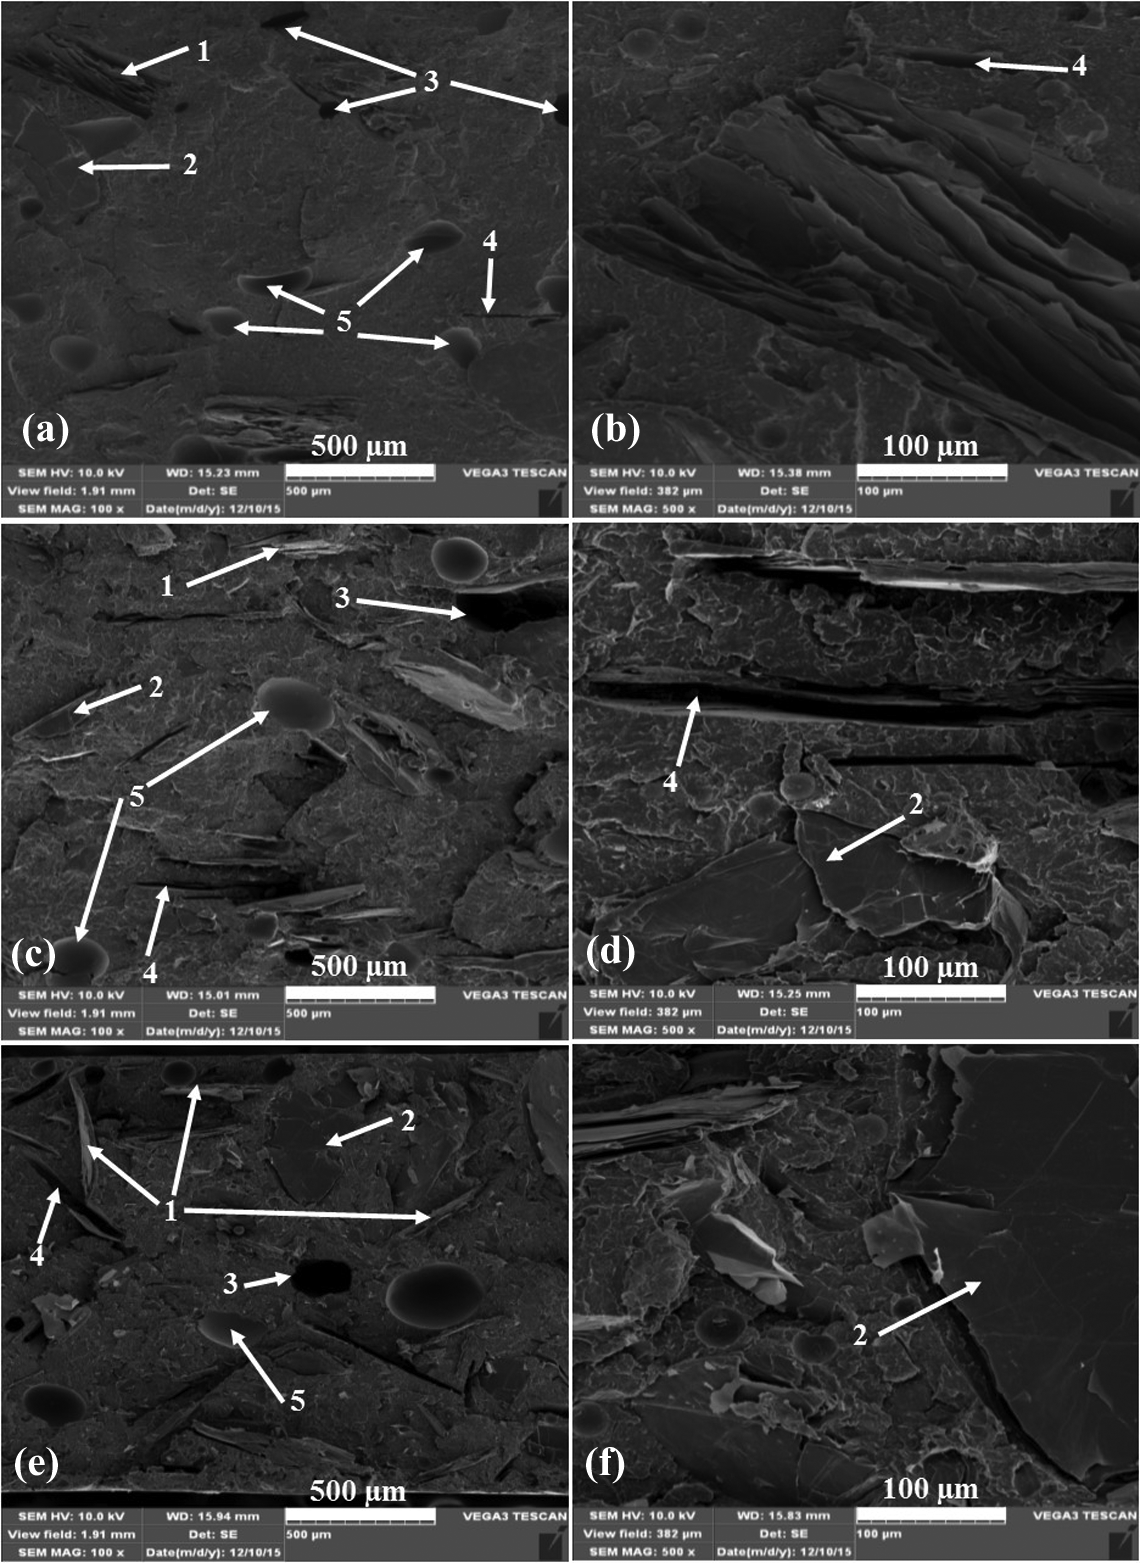
SEM micrographs of cryo-fractured surfaces of PLA/EG composites at different magnifications. SEM: scanning electron microscopy; PLA: poly(lactic acid); EG: expandable graphite.
Figure 4 shows the SEM images of the PLA/EG composites with varying EG contents at different magnifications. Generally, the incorporation of EG into PLA shows stacks of graphite layers that exist in the polymer matrix. Specifically from the figure, a number of factors can be alluded to. Firstly, the incorporation of EG into PLA shows a composite surface with EG filler-layered stacks for all the compositions (see arrows marked 1 in Figure 4(a, c and e)). This was also observed in the XRD results (discussed in ‘X-ray diffraction’ section). Although these aggregates are dispersed in the polymer matrix (especially at 10 and 15 wt% EG), there is generally a lack of uniformity in the EG dispersion. Secondly, the EG filler exists in different orientations in the PLA matrix. A normal-to-surface orientation is shown by arrows marked 1, while the parallel-to-surface orientation is indicated by arrows marked 2 throughout Figure 4. Thirdly, there is an existence of holes on the composite surfaces (see arrows marked 3 in Figure 4(a, c and e). Similar findings were reported by Tang et al. 18 for PLA/EG composites at 20 wt% EG content. This was attributed to the fact that EG particles were large and presented poor compatibility with PLA. 18 Fourthly, EG filler pull-outs are evident from the cryo-fractured surfaces of the composites, and these increased in frequency with the filler loading (see arrows marked 4 in Figure 4(a, c, d and e). This suggests the existence of poor interfacial adhesion between EG and PLA. 18 Lastly, the micro-spherical materials are still observed in the PLA/EG composites, and they do not seem to be affected by the presence of EG. It can be inferred that although the EG-layered stacks were dispersed in the PLA matrix, the PLA/EG flame retardant composites show a lack of (i) uniform dispersion of EG, (ii) poor compatibility of EG particles with the PLA matrix, and thus (iii) poor interfacial adhesion between the PLA matrix and the EG filler.
Differential scanning calorimetry (DSC)
The differential scanning calorimetry (DSC) results of the PLA/EG flame retardant composites are presented in Figure 5, while data obtained from these analyses are summarized in Table 4. The data are presented as the average values of three tests (with standard deviations). The degree of crystallinity (Xc) was calculated according to the following equation:
where ΔH
m and
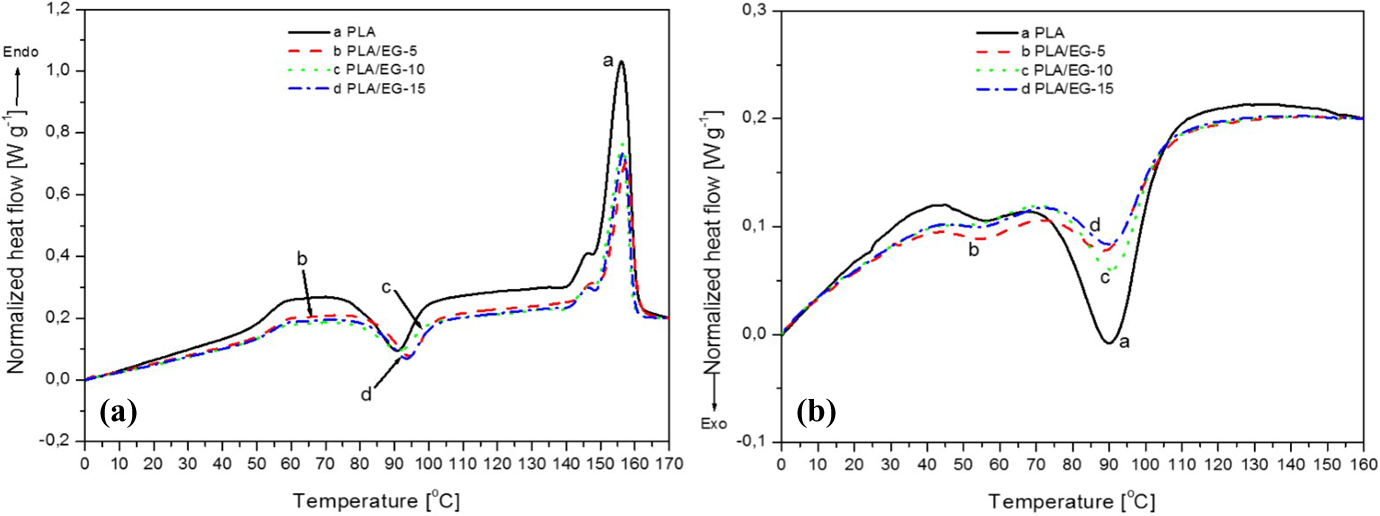
DSC curves of PLA and PLA/EG composites, (a) heating and (b) cooling. DSC: differential scanning calorimetry; PLA: poly(lactic acid); EG: expandable graphite.
DSC data of PLA/EG bio-based polymer composites.
a T m, T cc and T c are peak temperatures of melting, cold-crystallization and cooling, ΔH m, ΔH cc and ΔH c are enthalpies of melt, cold-crystallization and cooling from experiments, while ΔH m n, ΔH cc n and ΔH c n are normalized enthalpies of melt, cold-crystallization and cooling; and X c is crystallinity degree in percentages. Superscript letters b and c, respectively, denote the melting temperature and shoulder peak of PLA. The normalized enthalpies (ΔH m n ΔH cc n and ΔH c n) were calculated by dividing the experimental enthalpy by weight fraction (wt.%) of the polymer in a specific composition. DSC: differential scanning calorimetry; PLA: poly(lactic acid); EG: expandable graphite.
The heating and cooling curves of PLA and the PLA/EG composites are presented in Figure 5. On heating, PLA shows endothermic and exothermic thermal transitions within the experimental temperature range. The first endothermic transition is observed around 53.5°C. This is due to the glass transition of the amorphous phase of the semicrystalline PLA. 22 The second (exothermic) transition at around 89°C, relates to the cold-crystallization of PLA. The endothermic peak observed at 157°C is associated with the melting of the PLA crystallites. There is also a peak shoulder at 145°C, which is related to the melting of smaller crystallites within the amorphous regions of the polymer. These would melt first due to an excess of free energy associated with the disordered chains that emerge from the ends of the ordered crystallites, which is relatively bigger for the smaller crystallites. 20 –23 Chapple et al. 20 observed the double melting phenomenon for Cereplast PLA/clay composites and attributed this to the melting of crystallites that have different sizes and/or order of perfection. Fukushima et al., 22 however, reported that the dual endothermic peaks of PLA relate to different crystal structures of the α- and β-forms. The α-form is said to melt at higher temperatures, and it is the most common polymorph of PLA, while the latter form, melting at lower temperatures, relates to an imperfect crystal structure.
The same transitions are observed for the PLA/EG composites. From Table 4, it can be seen that the glass transition temperatures (T gs) are slightly higher for the composites. This suggests that the presence of EG micro particles in the amorphous phase of PLA have a slightly stiffening effect, thus lowering the polymer chain mobility. On the other hand, the melting temperatures (T ms) for the peak shoulder and the maximum melting peak are consistently within the ranges of 144–146°C and 157–158°C, respectively. These values are well within the experimental error, as seen from Table 4. Similar findings were reported by Narimissa et al. 12 in their study of the influence of nano-graphite platelet concentration on the onset of crystalline degradation in PLA composites.
The crystallization temperature (T
c; in the range of 91.4°C–91.8°C) of the PLA/EG composites is the same as that of PLA, within experimental error. On the other hand, the cold-crystallization temperatures (T
ccs) of the PLA/EG composites are higher than that of PLA. The observed crystallization enthalpy (ΔH
c) of the PLA/EG composites is lower than that of neat PLA, while the normalized crystallization enthalpy (ΔH
c
n) for the composites is higher than for neat polymer. Furthermore, it is observed that the experimental cold-crystallization enthalpy (
The normalized melting enthalpy (
Dynamic mechanical analysis
The dynamic mechanical analysis (DMA) results of PLA and the PLA/EG composites are shown in Figures 6 to 8, while the data are summarized in Tables 5 and 6. The storage modulus (E′) curves of the samples are shown in Figure 6(a) and the data tabulated in Table 5. It can be seen that the E′ decreases with increasing temperature due to increases in the free volume as the samples pass through various regions. These regions include (i) sub-glass transition, (ii) glass transition, (iii) rubbery plateau, (iv) cold crystallization and (v) pre-melting regions. For PLA, at temperatures below −80°C, the polymer molecules are tightly compressed. As the sample warms up and expands, a γ-transition with subsequent decline in E′ is observed. This is due to the increased free volume and localized bond (bending and stretching) movement and side chain movement. At temperatures between −40°C and −25°C, another transition is noted. This is due to the movement of the whole side chains and localized groups of backbone atoms that now have sufficient space to move and the material has developed some toughness. This transition is known as the β-transition and is the glass transition of a secondary component present in PLA. As discussed in ‘X-ray diffraction’ and ‘Scanning electron microscopy’ sections, the PLA used in this study contains various additives, including starch. 20 Consequently, this transition is related to the starch component present in PLA. At around 50°C, there is a transition accompanied by an exponential drop in E′ up to approximately 65°C. This relates to the glass transition of PLA, and it is due to the polymer chains in amorphous phase beginning to coordinate large-scale motions. After this, a rubbery plateau is reached between 65°C and 120°C, within which a slight increase in E′ accompanied by a transition peak is noted between 87°C and 97°C. This is attributed to the cold-crystallization transition. 21,35,36 This was also observed in the DSC (discussed in ‘Differential scanning calorimetry’ section).
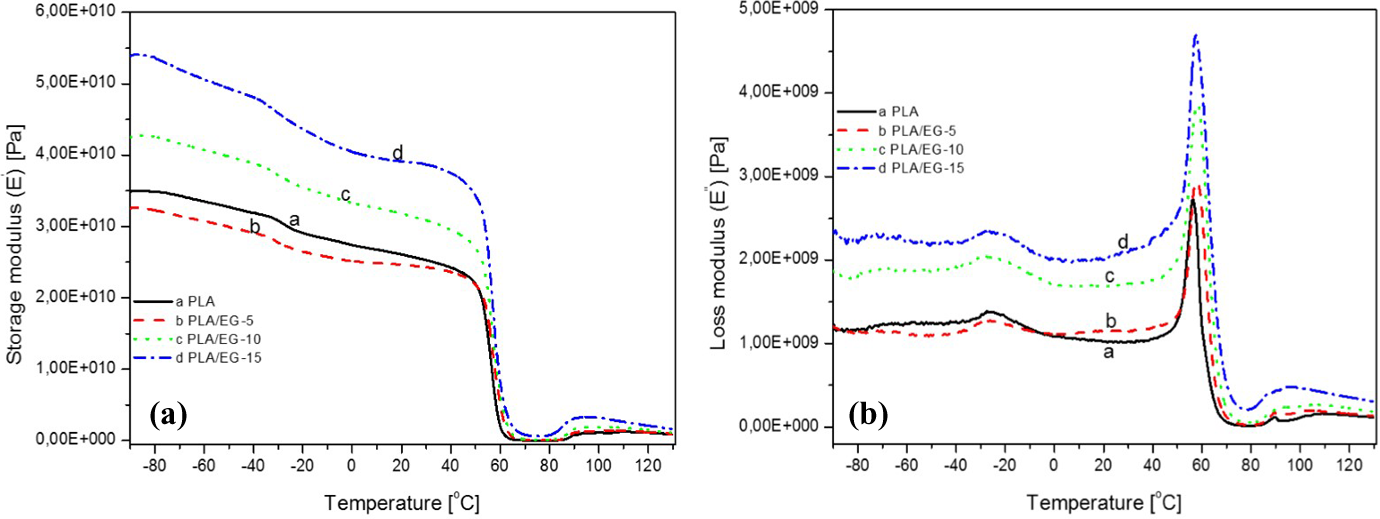
Temperature dependence of (a) storage modulus (E′) and (b) loss modulus (E″) of PLA and the PLA/EG composites (2). PLA: poly(lactic acid); EG: expandable graphite.
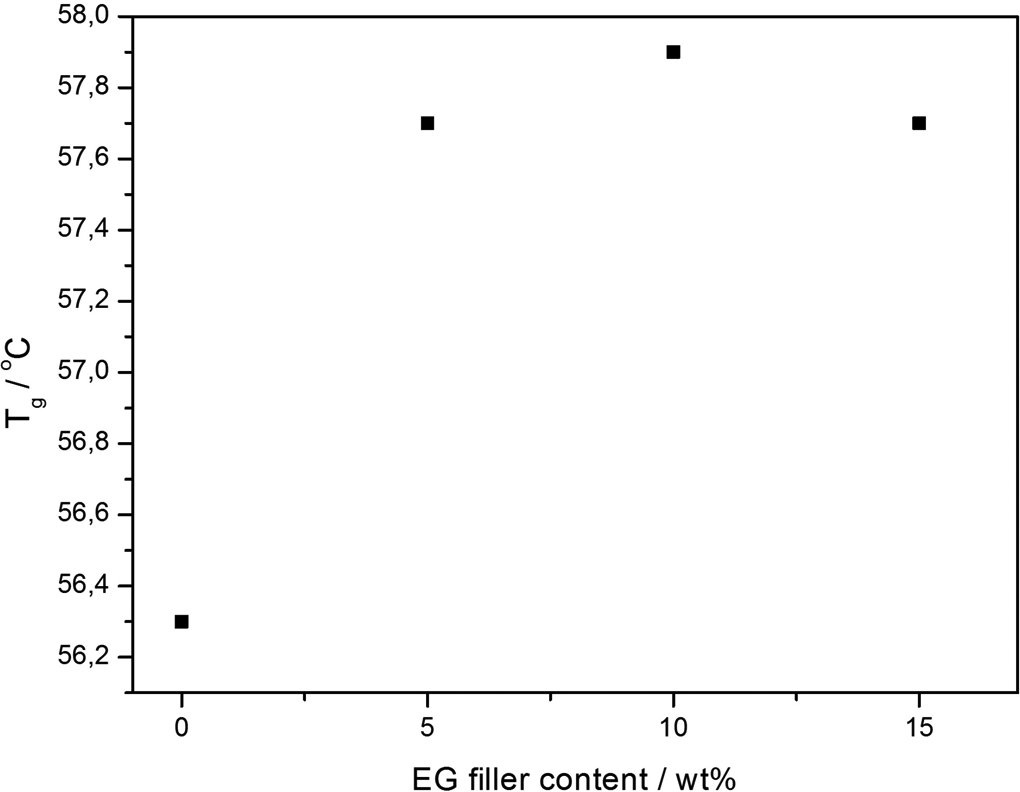
The dependence of glass transition temperature (T g) on EG content obtained from loss modulus. EG: expandable graphite.
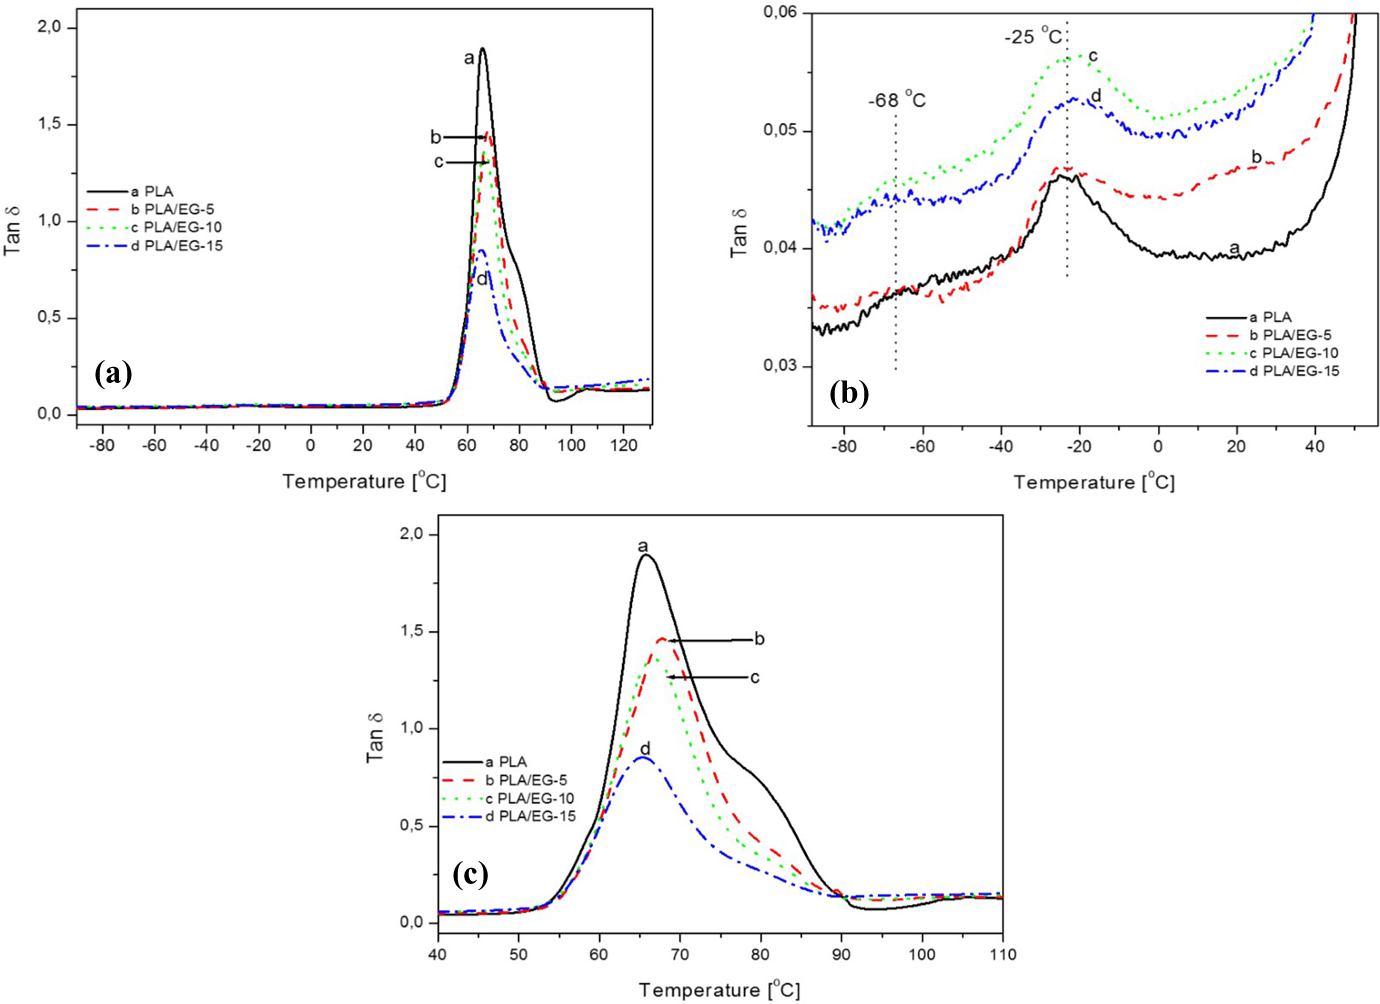
Temperature dependence of damping factor of PLA and PLA/EG composites (a), (b) below the glass transition and (c). PLA: poly(lactic acid); EG: expandable graphite.
Storage modulus (E′) value of PLA and PLA/EG composites at different temperatures.
PLA: poly(lactic acid); EG: expandable graphite.
Transition temperature values obtained from loss modulus (E″) and damping factor (tan δ) curves of PLA and the PLA/EG composites.
PLA: poly(lactic acid); EG: expandable graphite.
The PLA/EG composites exhibit similar transitions to the PLA in the E′ curves as observed in Figure 6(a). Generally, the presence of EG micro-filler particles in PLA resulted in an increased storage modulus throughout the experimental temperature range (Table 5). This is attributed to the reinforcing effect by EG and the restricted movements of the polymer chains in the presence of EG micro-particles. 22 Similar findings were reported by Fukushima et al. 37 in their study to evaluate the effect of different nanoparticles on the thermal and thermo-mechanical properties of PLA.
In the sub-glass transition region of the loss modulus (E″) curves (Figure 6(b)), a transition around −27°C (Table 6, see T 1) is observed that is due to the glass transition of the starch component (see XRD, SEM and DSC discussions in ‘X-ray diffraction’, ‘Scanning electron microscopy’ and ‘Differential scanning calorimetry’ sections, respectively). As seen in Table 6, the peak temperature values of this transition alternate between −26°C and −28°C in the presence of EG. A transition peak is also observed around 57°C (Table 6, see T 2). Finally, a transition between 85°C and 100°C, due to the cold-crystallization process, is also observed (see DSC discussion in ‘Differential scanning calorimetry’ section).
In this study, the relaxation temperature which can be associated with the glass transition (T g) was taken at the maximum peak of the loss modulus. From Figure 6(b), the transition peak observed around 57°C is attributed to the T g of PLA and/or PLA/EG composites. The effect of EG filler loading on this transition is better observed from Figure 7. From this, it can be seen that there is only a slight increase in T g from 0 to 5 wt% EG, and then the value remains fairly constant as the filler loading was further increased (see Table 6). This confirms that the EG filler only weakly interacted with the PLA matrix (see XRD and SEM discussion in ‘X-ray diffraction’ and ‘Scanning electron microscopy’ sections) and only had a slight immobilization effect on the polymer chains (see DSC discussion in ‘Differential scanning calorimetry’ section), which was independent of the filler content in the investigated range. Huda et al. 38 also reported similar findings from PLA/recycled newspaper fibre composites. It was reported that the T g (obtained from loss modulus) of the composites shifted to higher temperatures. This was associated with the decreased mobility of the polymer matrix chains due to the presence of the fibre.
The damping factor (tan δ) is shown in Figure 8, and the peak transition values are tabulated in Table 6. Various transitions are observed between −68°C and −25°C (Figure 8(b)) as well as around 66°C (Figure 8(a) and (c)). The transitions observed at low temperatures are due to the presence of other additives derived from renewable resources with the transition around −25°C, related to the starch component in PLA. All the samples show peaks between 65°C and 68°C, and these are related to the glass transition of PLA (Figure 8(c), Table 6). Furthermore, PLA shows a shoulder peak at temperatures above 80°C which is related to the cold crystallization transition of PLA, and this diminished with the addition of EG. This is as a consequence of (i) decrease in polymer fraction as a function of EG filler in the composites and (ii) reduced overall crystallinity of the composites in the presence of EG micro-filler which did not favour the crystallization of PLA polymer chains from the melt as reported from DSC results (see ‘Differential scanning calorimetry’ section). The PLA/EG flame retardant composites are generally characterized by high storage and loss moduli.
Conclusions
The effect of EG on the morphology, structure, thermal and the dynamic mechanical properties of melt-mixed flame retardant PLA/EG composites was investigated. It was found that the graphite layers still existed in aggregate form (i.e. EG-layered stacks) with a lack of EG single layers dispersion in the composites because of poor interfacial adhesion between EG and the PLA matrix. The presence of EG in PLA showed no changes in the melting and crystallization temperatures. The presence of EG micro-particles also gave rise to reduced melting enthalpy and crystallinity of PLA in the composites, indicating the fact that their immobilizing effect dominated over their nucleating effect. The PLA/EG composites showed increasing storage moduli with increasing filler content, which was due to the inherent stiffness of the filler rather than to significant interaction between the filler and polymer. The glass transition, from the loss modulus, showed only a slight increase that did not depend on EG content. These results suggest that the incorporation of the commercial EG into PLA gave stiffened materials with preservation of some of the thermal properties (i.e. melting and crystallization temperatures) of injection moulding grade Cereplast PLA.
Footnotes
Acknowledgements
The financial assistance of the National Research Foundation towards this research is hereby acknowledged. Opinions expressed and conclusions arrived at are those of the authors and are not necessarily to be attributed to the NRF. Acknowledgements are also extended to colleagues and researchers for their undivided attention and support.
Declaration of Conflicting Interests
The author(s) declared no potential conflicts of interest with respect to the research, authorship, and/or publication of this article.
Funding
The author(s) disclosed receipt of the following financial support for the research, authorship, and/or publication of this article: The authors received the financial support from National Research Foundation for the research, authorship, and/or publication of this article.