
Abstract
Powder-mixed polypropylene (PP)–graphite binary composites exhibit an electrical percolation threshold at 10 wt% graphite signifying insulator-semiconductor transition. Three conducting fillers such as carbon black (CB), sonicated expanded graphite (s-ExGr), and carbon nanofiber (CNF) are mixed with PP-7 wt% graphite binary composites. The electrical percolation threshold has been found to have inverse relation to the aspect ratio of second conducting fillers in hybrid composites. The aspect ratio of second conducting fillers varies in the order CB < ExGr < CNF. The electrical percolation threshold is found to vary for the hybrid composites as 2.2 wt% for CB addition, 0.75 wt% for ExGr addition, and 0.2 wt% for CNF addition in the PP-7 wt% graphite binary composites. When the aspect ratio of second conducting fillers increases, they reduce the barrier for the charge transport. The second conducting fillers occupy the interspace of graphite and alternating current studies show that the effective dielectric constant increases with the concentration of second conducting filler in the hybrid composites. The composites are characterized by transmission electron microscopy and scanning electron microscopy. Melt-crystallized PP-7 wt% graphite-CNF composites exhibit higher percolation threshold due to decrease in the polymer viscosity which increases the interparticulate distance.
Keywords
Introduction
Electrically conducting polymer composites (CPCs) have tremendous scope due to their increasing demand in EMI shielding devices, 1 –4 sensors, 5 anticorrosion coatings, 6 and so on. Polymer-based composites offer better advantage over metal or ceramic-based composites as they are easy to process, lead to cost saving, and result in light weight of the end product. Each application requires certain level of electrical conductivity of composites. For binary composites in which one phase is insulating polymer, the conductivity can be achieved by proper selection of conducting fillers such as graphite, metal fiber, and so on. The electrical conductivity varies nonlinearly in binary composites with the addition of conducting fillers. There exists a particular concentration of filler in binary composites at which the electrical conductivity shoots up to many orders is known as the electrical percolation threshold (ϕc). 7,8 This critical concentration is found to vary with the particle size, orientation of fillers, dispersion of fillers, and processing routes along with the type of polymer matrix chosen in the binary composite. Jing et al. 9 have correlated aspect ratio and degree of dispersion of carbon nanotube (CNT) to the electrical percolation threshold in CNT-reinforced epoxy matrix. They developed an analytical model based on interparticular distance concept. However, the discussions pertain to binary composite. Zie-Min et al. have studied the relation between the aspect ratio of CNT with the electrical percolation threshold in CNT based binary composites. Thermoplastic elastomer has been used as the polymer matrix. Huang et al. 11 have studied ultrahigh-molecular-weight polyethylene–graphene nanosheets composites and reported very low electrical percolation threshold of 0.07 vol%. However, they made the binary composite by hot compression at 200°C. The effect of processing conditions such as operating conditions, screw profile, and feeding sequence of the ingredient in twin screw extruder have been correlated to surface resistivities in polyether block amide thermoplastic elastomer/PA 12-carbon black (CB) composites. Jose et al. 12 have reported processing parameters such as mixing temperature, time, and speed on the electrical resistivity of LDPE-CB and iPP-CB melt-mixed composites. They have identified optimal processing conditions through the lower standard deviation in the electrical resistivity values. Carneiro et al. 13 have investigated the processing conditions for CB-thermoplastic composites so as to get better conductivity when the composites were twin screw extruded. For easy processing, it is desirable to make the percolation threshold as low as possible as otherwise the flow properties of the composite will be affected to a greater extent. In this regard, nanofillers such as CNT, 14,15 CNF, 16,17 graphene, 18 –20 expanded graphite (ExGr), 21 and so on, are being focused. In many cases, the cost of nanofillers is much higher and using them in large quantities will increase the cost of the composite too. So it is worth to use the costly nanofillers along with the cheap conventional fillers to make polymer composite which might ensure good cost reduction. In this regard, hybrid composites are extensively being focused.
The effect of aspect ratio of fillers in binary polymer composites to understand electrical properties is reported. 22,23 Silva et al. 24 have simulated the electrical conductivity of CNT-polymer composites and shown that the high aspect ratio filler increases the electrical conductivity. In a similar fashion, hybrid composites were made for application such as fuel cell bipolar plates with polypropylene (PP), graphite, and CB where very high loadings of graphite and CB were employed just to make the composites highly conducting. 25 Du et al. 26 have prepared composites in which carbon fillers were mixed with epoxy matrix. They have used CB and ExGr as fillers and 50 wt% of fillers were added in order to achieve higher electrical conductivity. Radhakrishnan et al. 27 have shown that in PES-38 wt% graphite, very small amount of CB (5 wt%) addition results in significant reduction of electrical percolation threshold. In our group, we have investigated the effect of addition of CB in PES-7 wt% graphite composite nearer to electrical percolation threshold and obtained reduction in ϕc when hybrid composites were made by solution blending technique. 28 Although reports related to reduction in the concentration of fillers to retain a particular value of electrical conductivity when hybrid composites are employed are available in the literature, to the best of our knowledge, no systematic work related to the effect of aspect ratio of second conducting fillers in hybrid composites on the electrical properties is reported. Hence, a thorough study has been carried out to understand the influence of aspect ratio of second conducting filler on the electrical percolation and reported.
Experimental
Materials
Isotactic PP (SM85 N, supplied by IPCL, Baroda presently taken over by Reliance Industries Limited, Pune, Maharashtra, India) with MFI-8-12 as specified elsewhere 29 has been used for making composites. Natural graphite better than 200 mesh and conducting CB are procured from Carbon enterprises (Pune, Maharashtra, India). ARCI (Hyderabad, India) has kindly provided ExGr with approximate expansion ratio approximately 100. CNF (PR-24-XT-HHT) was procured from Pyrograf products Inc. (Cedarville, Ohio, USA).
Synthesis of PP powder
The PP granules are first dissolved in hot xylene at 140°C and then cooled to room temperature overnight so that gel is formed. Then the gel is precipitated in excess acetone with rigorous stirring to yield PP powder. The powder is repeatedly washed with acetone and dried in vacuum.
Synthesis of PP-graphite-X (X = CB, ExGr, CNF) by powder mixing route
Powder mixed PP-graphite binary composites are prepared first by mixing the required amount of PP powder and graphite in a mortar with the help of a pestle for 15 min. This is to identify the electrical percolation threshold in binary composites. Hybrid composites with CB are made by first mixing appropriate amount of CB in PP binary composite for 10 min. According to the weight fraction calculation, the required amount of graphite is mixed with PP-CB composites for another 10 min. In a similar fashion, required amount of ExGr in 50 ml acetone after sonicating for 5 min in an ultrasonicator is added to PP powder in acetone and sonicated further for 3 min. The resultant mixture, that is, PP-ExGr is poured in a petri dish and dried. To this dried mixture, required amount of graphite is added as a third component and mixed for 10 more minutes.
The same procedure is followed for making hybrid composites with CNF. Hard discs of composites with diameter 13 mm are made by applying 3-ton load on a single-ended die for 3 min using a hydraulic press. These hard discs are used for electrical measurements.
Synthesis of PP-graphite-CNF melt-crystallized samples
The powder mixed PP-7 wt% graphite-X wt% CNF (X = 1, 3, 5, 7, 10) pellets are kept in between glass slides and then melted at 180°C by keeping them on a hot plate. After melting, the samples are immediately transferred to water at room temperature. Before electrical measurement, the surface of the sheets is polished slightly using emery paper. The through thickness electrical resistance is measured as described below.
Electrical measurement
DC resistance of different composites prepared is measured with Keithley System Electrometer (Model: 6514; Bangalore, India) by applying a constant load (8 kg/cm2) to reduce contact resistance. Platinum electrodes of area 1 cm2 have been used for direct current (DC) measurement. The conductivity of a particular composition has been calculated from the average values of resistances obtained from three different hard discs of the same composition. In the insulating regime, standard deviation in conductivity lie around 4% and in the conducting regime 2% variation in conductivities observed. This shows that the filler has been very well distributed in the PP matrix. AC measurements are carried out in a specially constructed cell with gold-plated electrodes of area 1 cm2 as contact electrodes using Alpha A high-performance frequency analyzer, Novocontrol (Germany). Few alternating current (AC) measurements are also done with Solatron impedance analyzer with dielectric interface SI 1266. The frequency scan range is 0.01 Hz to 10 MHz.
SEM and TEM analysis
The cross section of PP-ExGr and PP-CNF is etched in hot xylene and the surface structures are seen in scanning electron microscopy (SEM, Model: SEM Leica 440, Germany). The structure of CB after sonicating in acetone for 3 min and as received ExGr particles are seen under SEM and pictures are taken. The sonicated ExGr particles in acetone are seen in transmission electron microscopy (TEM, Model JOEL—1400×) by taking a drop of the solution and transferring it to copper grid to observe nanostructures.
Results and discussion
DC conductivity results of PP-graphite binary and PP-graphite-X (X = CB, ExGr, CNF) powder mixed hybrid composites
Figure 1 depicts the variation of through-plane conductivity (Pdr) with the addition of different weight fraction of graphite in PP matrix. It can be clearly seen that the insulator to semiconductor transition starts at 10 wt% graphite loading below which the binary composite acts as an insulator. This is due to the fact that there may not be enough contact between the filler particles. The nonlinear variation of electrical conductivity is understood in terms of percolation theory. 30 When the contact between filler particles is not established, the composites behave as insulators. There exists saturation in electrical conductivity above 50 wt% graphite loading due to saturation in electrical contacts between filler particles. One composition below the percolation threshold is chosen, that is, PP-7 wt% graphite to study the effect of second conducting filler on the electrical percolation.
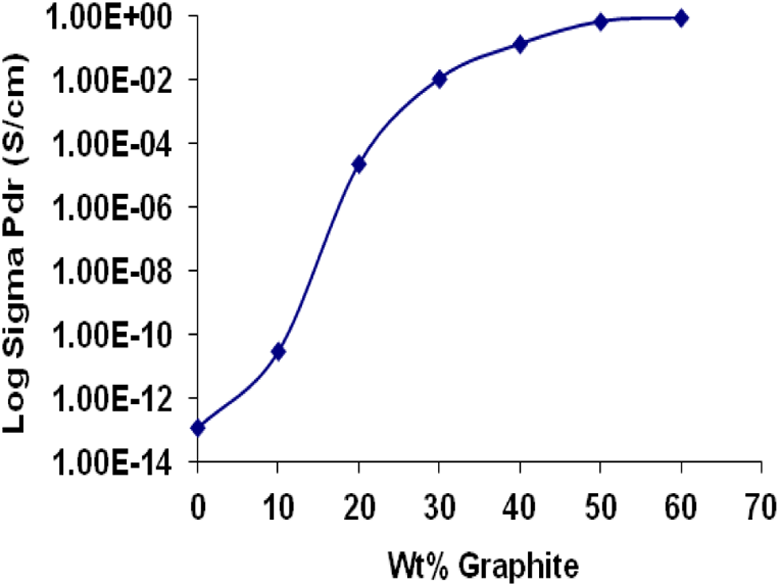
Through-plane conductivity of powder mixed PP-graphite composites.
Figure 2 clearly depicts the through-plane electrical conductivity variation of hybrid composites with CB as the second conducting filler. The conductivity variation in hybrid composites is also understood in terms of percolation theory. Insulator–semiconductor transition is clearly visible as above 2.2 wt% CB loading in PP-7 wt% graphite, the electrical conductivity shoots up. Hence, the percolation threshold of this hybrid composites is identified at 2.2 wt% CB. It should be noted that the percolation threshold in hybrid composites is reduced when compared to that of PP-graphite binary composites. This is due to the fact that CB particles decrease the barrier for the charge transport between graphite particles. 28 The electrical conductivity of CB particles lies in semiconducting range. The enhancement in the electrical conductivity in hybrid composite nearer to the percolation threshold cannot be attributed to CB dispersion alone as the PP-CB binary composites exhibit a percolation threshold at 5 wt% CB as shown in Figure 2(a). Hence it is due to the decrease in the interparticular distance between the conducting particles, that is, graphite and CB. On comparing Figures 1 and 2, it is quite evident that the conductivity value obtained at 3 wt% CB loading in PP-7 wt% graphite approximately matches with that of 20 wt% graphite loading in binary composites. Thus the hybrid composites are effective in reducing the overall filler loading. In a similar fashion when sonicated ExGr is mixed with PP-7 wt% graphite, the electrical percolation threshold decreases to 0.7 wt% ExGr as shown in Figure 3(a). Binary PP-ExGr composites exhibit higher percolation thershold approximately 4 wt% ExGr. Hence in this case also only dispersion of 0.7 wt% ExGr in PP in hybrid composites would not have resulted in the enhancement in the conductivity nearer to the percolation threshold, as below 4 wt% ExGr, the composites act as insulator. Hence reduction in the interparticular distance for the charge transport is the reason for low percolation threshold in hybrid composites.
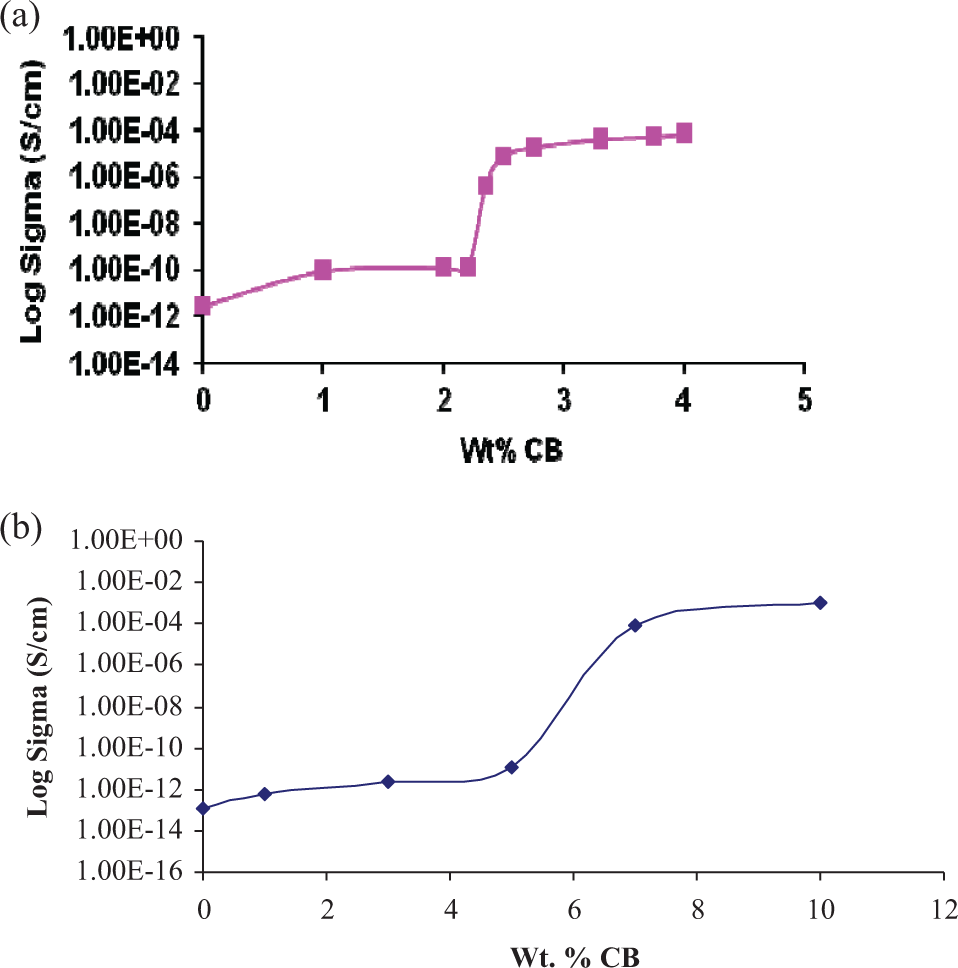
DC electrical conductivity variation in (a) PP-7 wt% graphite-CB with respect to CB concentration and (b) PP-CB powder-mixed composites.
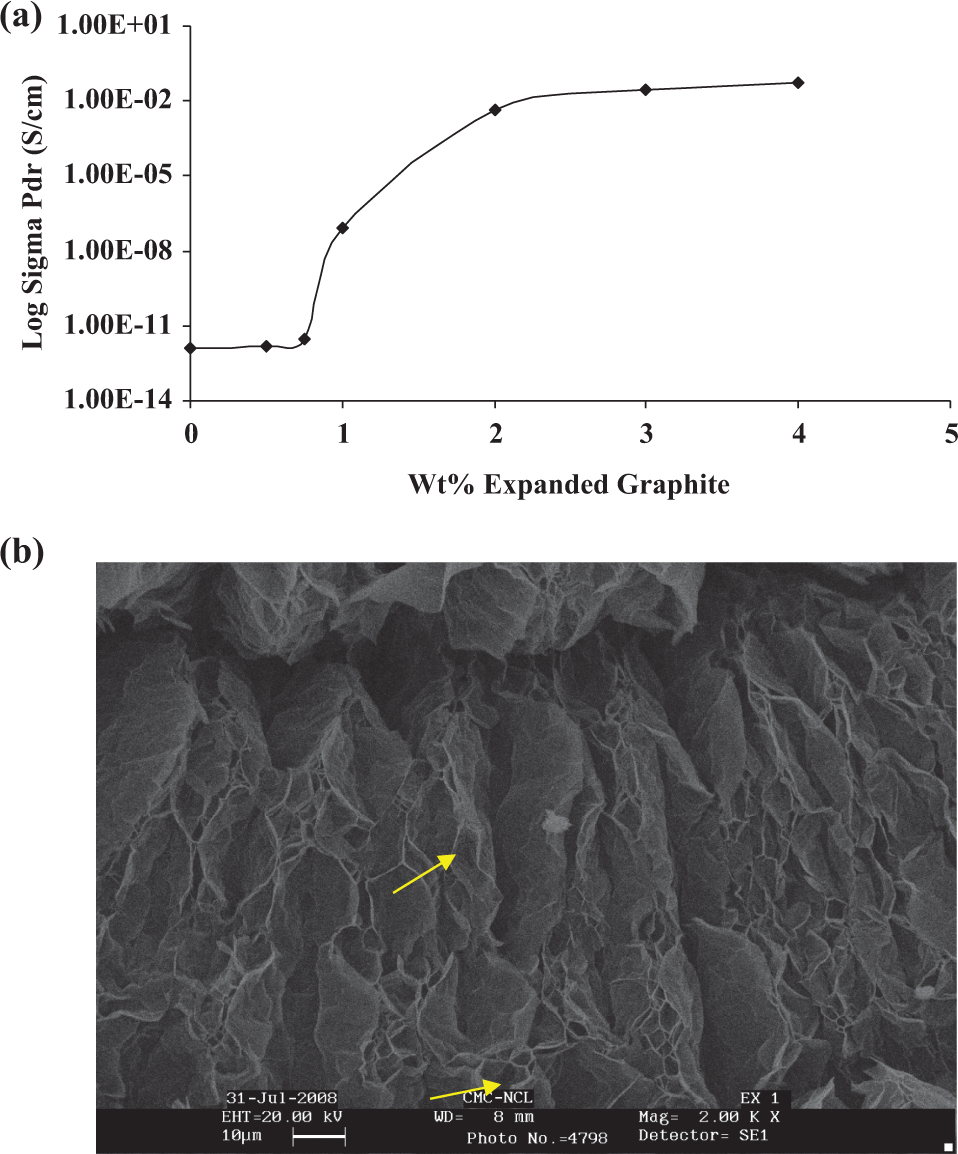
(a) Through plane conductivity of PP-7 wt% graphite-ExGr hybrid composites (b) SEM picture of expanded graphite particles.
ExGr particles have pores with larger size as shown in Figure 3(b). Sonication process destroys porous structure and results in the production of high aspect ratio graphite nanosheets. The interparticular contacts between these high aspect ratio nanosheets improves a lot at low loading itself and hence the electrical percolation threshold is decreased when compared to CB added hybrid composites. The formation of graphite nanosheets will be proved in the TEM analysis section. One can also notice that the value of electrical conductivity obtained for 2 wt% ExGr loading in PP-7 wt% graphite matches with the value obtained for ∼40 wt% graphite in PP. So in this case also, using high aspect ratio fillers in small amount in conventional cheap fillers, reduces the overall filler amount to attain a particular value of electrical conductivity. The nonlinear variation of electrical conductivity in hybrid composites is accounted well by the percolation theory.
When CNF is mixed with PP-7 wt% graphite, the electrical percolation threshold decreases further to less than 0.2 wt% CNF as shown in Figure 4. Saturation in DC conductivity occurs above 1 wt% CNF loading. As explained previously, the variation in electrical conductivity can be understood in terms of percolation theory where the contact between the fillers is accounted for the nonlinear variation of electrical conductivity. The value of electrical percolation threshold for three different fillers in PP-7 wt% graphite is depicted in Table 1 which implies clearly that the aspect ratio of CNF should be the maximum followed by ExGr and CB.
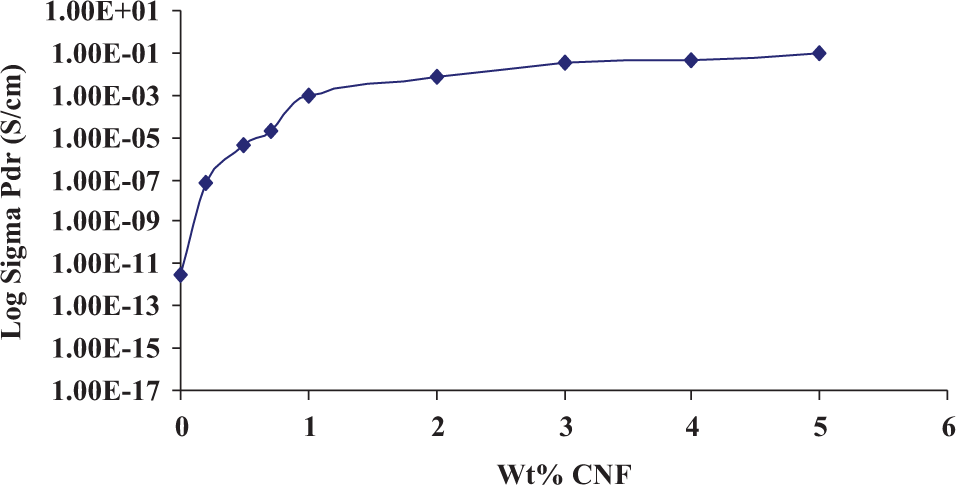
DC conductivity variation with respect to CNF concentration in PP-7 wt% graphite powder mixed samples.
Percolation threshold variation with respect to second conducting filler addition in PP-7 wt% graphite.
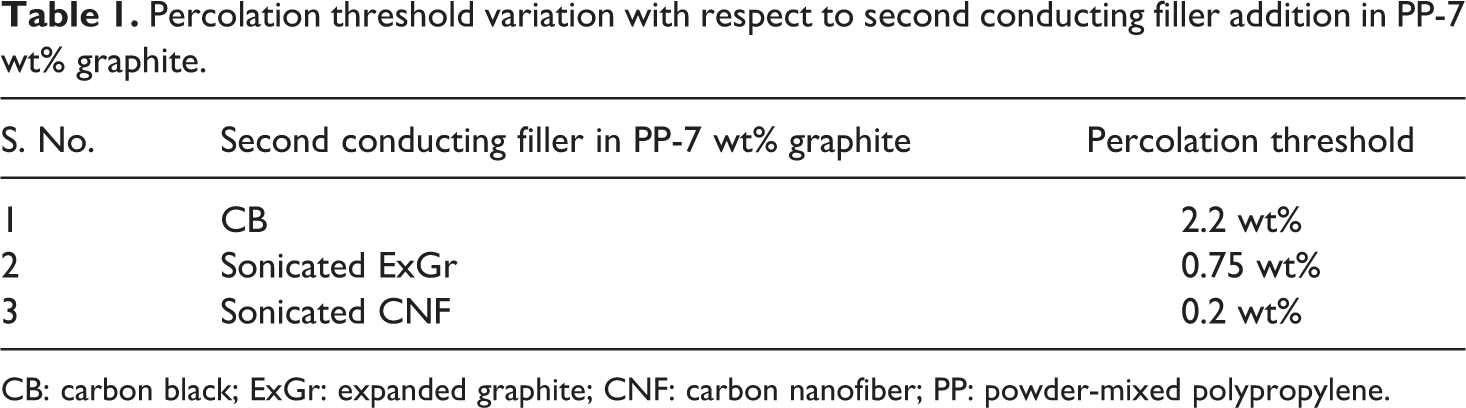
CB: carbon black; ExGr: expanded graphite; CNF: carbon nanofiber; PP: powder-mixed polypropylene.
Melt-crystallized PP-graphite-CNF composites
The DC conductivity variation of melt-crystallized PP-7 wt% graphite-X wt% CNF (X = 1, 3, 5, 7) is shown in Figure 5. It can be seen that below 1 wt% CNF, the composites exhibit insulating behavior. The percolation threshold can be identified at 1 wt% CNF as above that loading the conductivity starts increasing. On comparing the results of melt-crystallized PP-7 wt% graphite-X wt% CNF composites with that of powder mixed ones, the percolation threshold in the former case is higher than that of the samples prepared by the second route. This is due to the fact that at 180°C, the melt viscosity of the polymer is decreased which results in enhanced interparticular distance.
DC conductivity variation in melt-crystallized PP-7 wt% graphite-CNF composites.
SEM and TEM analysis
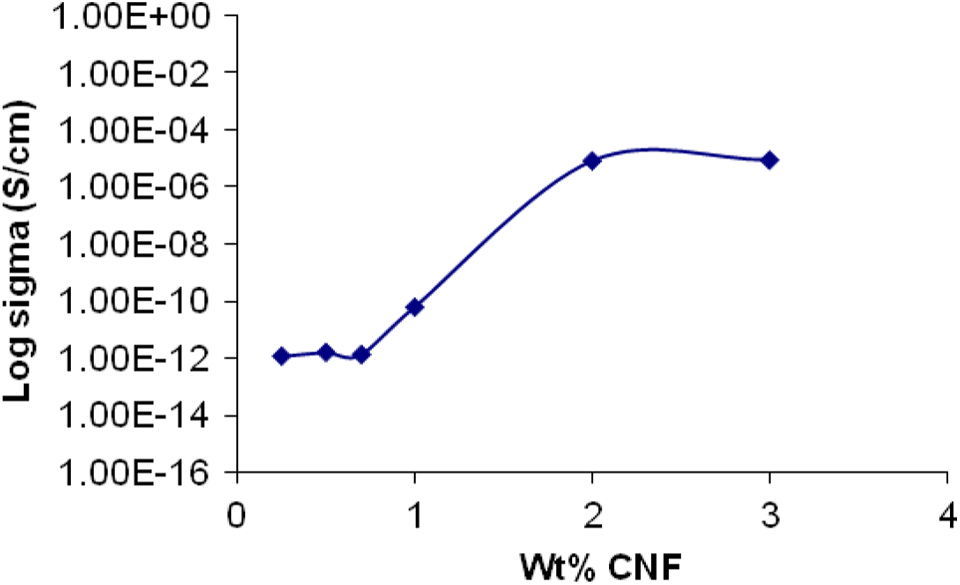
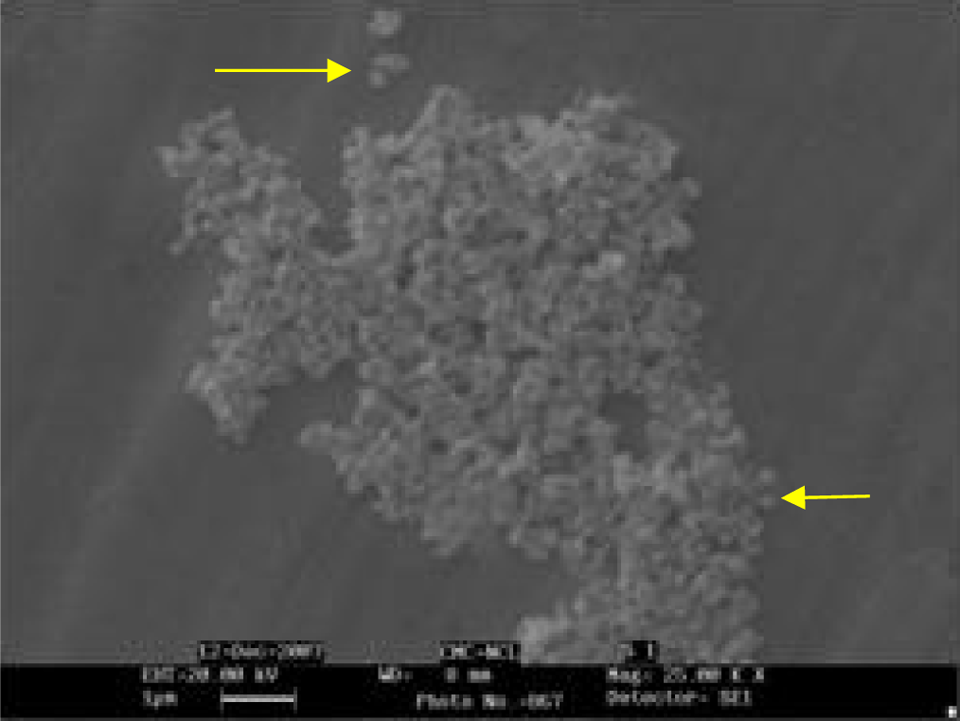
In order to find out the aspect ratios of second conducting fillers SEM pictures of CB particles and cross section of PP-1 wt% ExGr are taken and shown in Figure 6 and 7(a) respectively. One can easily see that there are agglomerations of CB (as indicated by arrows) with approximate size of 300 nm and aggregates of 90 nm size and hence the aspect ratio of CB is calculated to be around 3.3. In a similar fashion, one can clearly observe 2 µm length agglomerated graphite nanosheets from Figure 7(a) and thickness to be around 30 nm from the TEM picture shown in Figure 7(b). Hence the aspect ratio of ExGr is taken to be 63. Before addition of sonicated ExGr to the polymer, the TEM pictures are taken. Even from SEM pictures, ExGr thickness can be clearly found out. The graphite nanosheets are indeed agglomerated which is evident from the SEM picture.
SEM picture of CB.
(a) SEM picture of cross section of PP-1 wt% expanded graphite composite in the polymer matrix (b) TEM picture of sonicated expanded graphite particle.
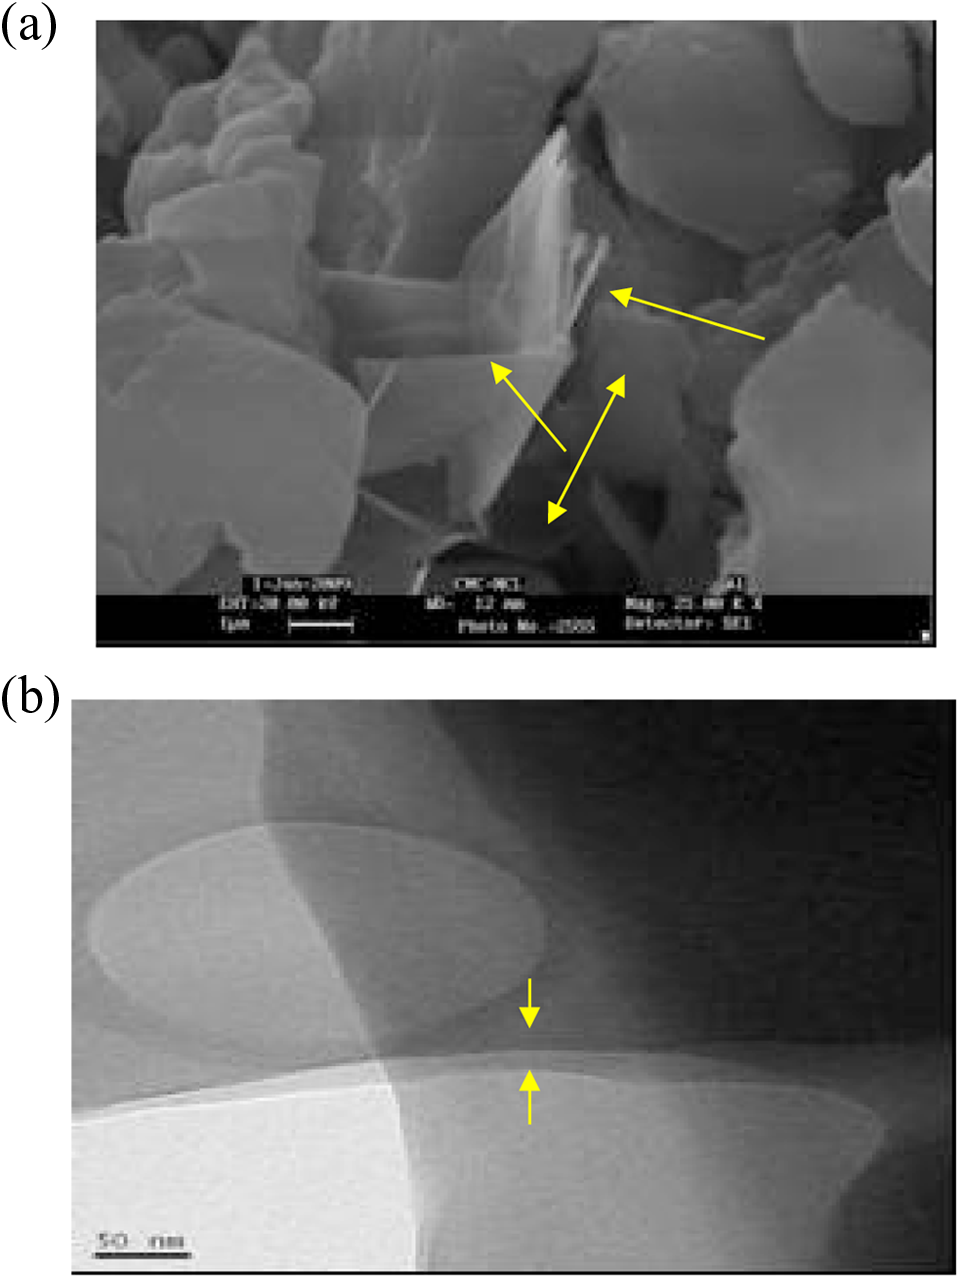
Figure 8(a) and (b) shows the SEM pictures of cross section of PP-7 wt% CNF after etching in hot xylene. From the SEM pictures, one can clearly see the length of the CNF runs around 8 µm (average value) and diameter to be around 90 nm. Hence the aspect ratio of CNF is taken to be approximately 89. Also SEM pictures show that many nanofibers are curled and buried in the polymer matrix. The long nanofibers are indicated by arrows. The values are obtained after averaging the length and diameter of at least 10 CNFs from different SEM pictures. Although the values of aspect ratio of second conducting fillers are the best estimates, their validity is revealed through the electrical conductivity data. It is quite evident that the aspect ratio of CNF is the highest followed by the graphite nanosheets and then CB particles.
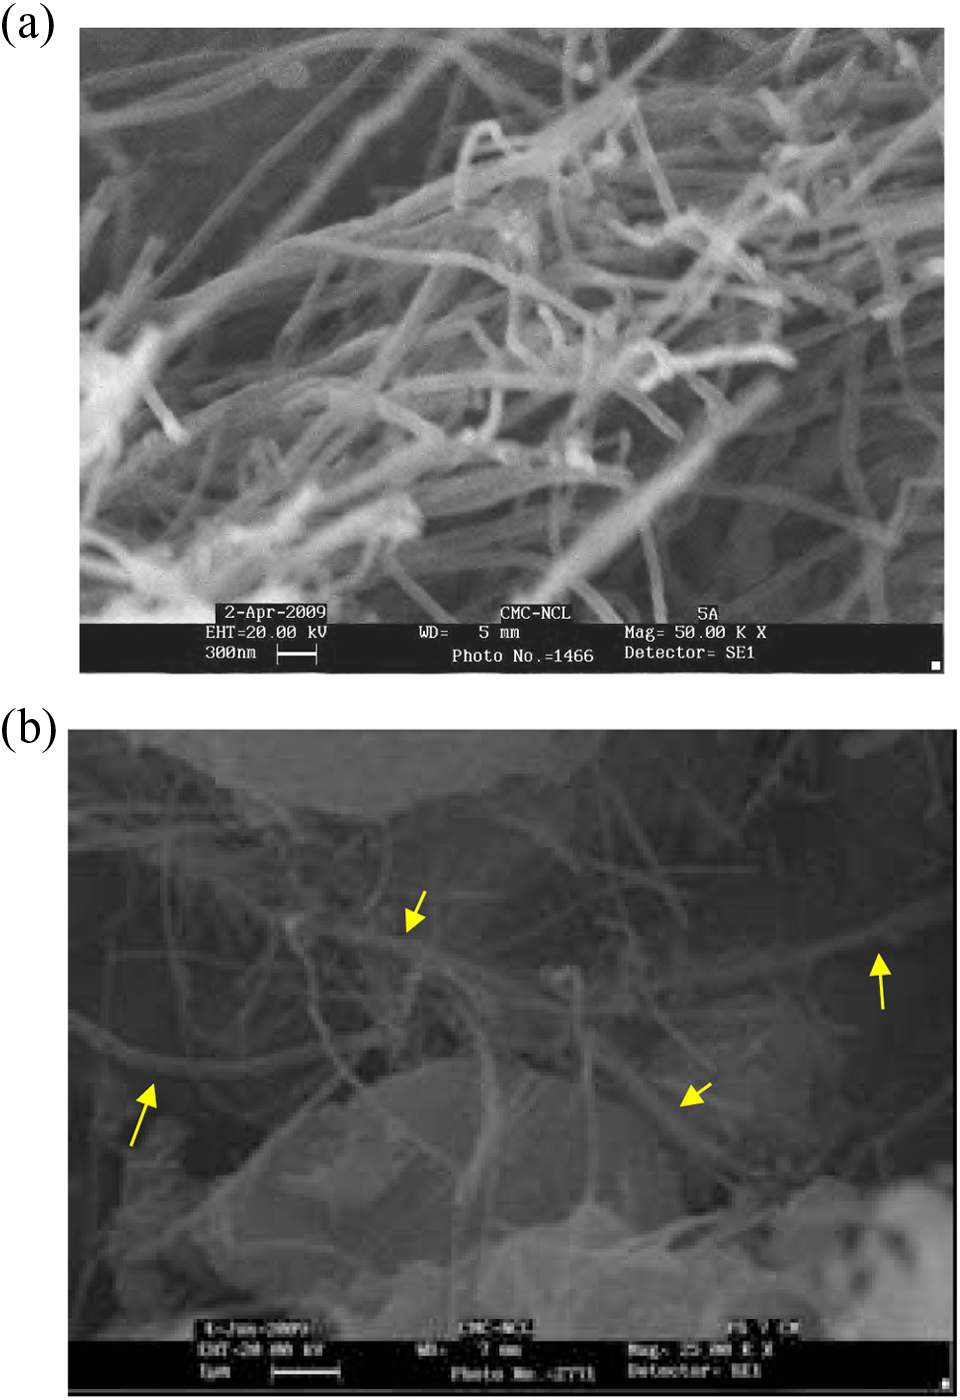
(a and b) SEM pictures of cross section of PP-7 wt% CNF.
The values of aspect ratio can be correlated to the variation in the electrical percolation threshold in PP-7 wt% graphite-based hybrid composites. The percolation threshold decreases with respect to aspect ratio of second conducting fillers. This is depicted in Figure 9. When the aspect ratio of fillers increases, the interparticle distance between fillers for charge transport is decreased. In the composite system, graphite particles are separated by polymer which is an insulator and offers barrier for the charge transport. When the intergraphite space is occupied by the second filler, the barrier for the charge transport is decreased and hence better conduction results. This kind of result has been published earlier also. 28
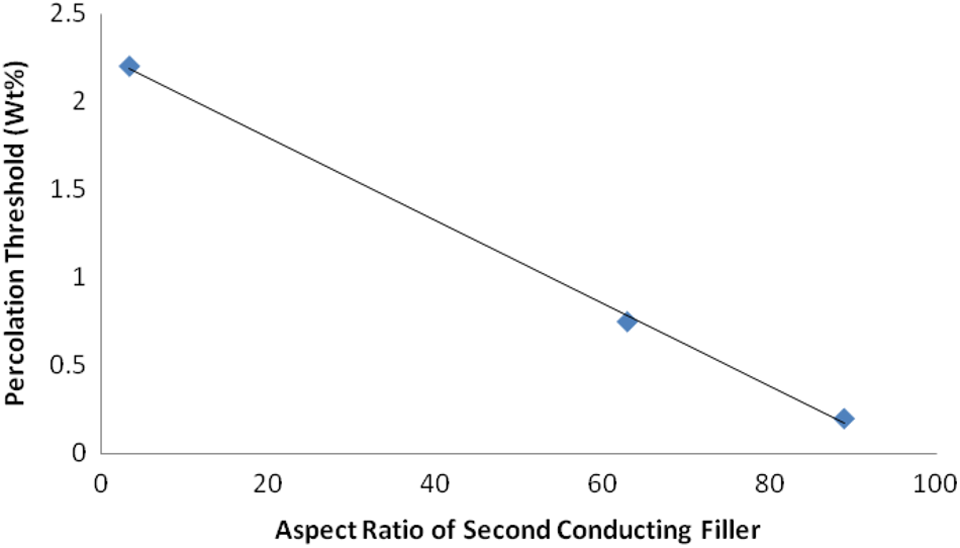
Percolation threshold variation with respect to aspect ratio of second conducting filler.
AC behavior of PP-graphite-X (X = CB, ExGr) hybrid composites
The DC conductivity results clearly demonstrate that the charge transport becomes easier across conducting particles when the aspect ratio of second conducting filler is increased. This also implies that the interparticular distance for the charge transport is reduced. This should eventually lead to increase in junction capacitance with respect to concentration of second conducting fillers. 21,28,31
As discussed above, when the aspect ratio of second conducting filler increases, the interparticular distance decreases which should result in enhancement in the effective dielectric constant. This is due to the fact that the two conducting fillers in between polymer matrix can be thought of as parallel-plate capacitor with dielectric in between. When the capacitance increases, it should eventually result in increase in effective dielectric constant. In order to prove this, frequency-dependent effective dielectric constant for two different hybrid composites, one with CB as the second conducting filler and the other with sonicated ExGr in PP-7 wt% graphite is shown. It is clear from Figures 10 and 11 that increasing the concentration of either CB or ExGr increases the effective dielectric constant at low frequency, that is, at 0.1 Hz. The effective dielectric constant for PP-7 wt% graphite-2.2 wt% CB is vary less more than six orders when compared to 2.35 wt% CB addition in PP-7 wt% graphite. On the contrary, less loading of ExGr compared to CB, that is, 1.5 wt% increases effective dielectric constant more than five orders than what has been obtained for 0.75 wt% ExGr in PP-7 wt% graphite at 0.1 Hz. With increase in the addition of second filler, the effective dielectric constant increases at 0.1 Hz. The effective dielectric constant decreases with increase in frequency for a particular concentration of second conducting filler in PP-7 wt% graphite and after certain frequency it stays more or less constant.
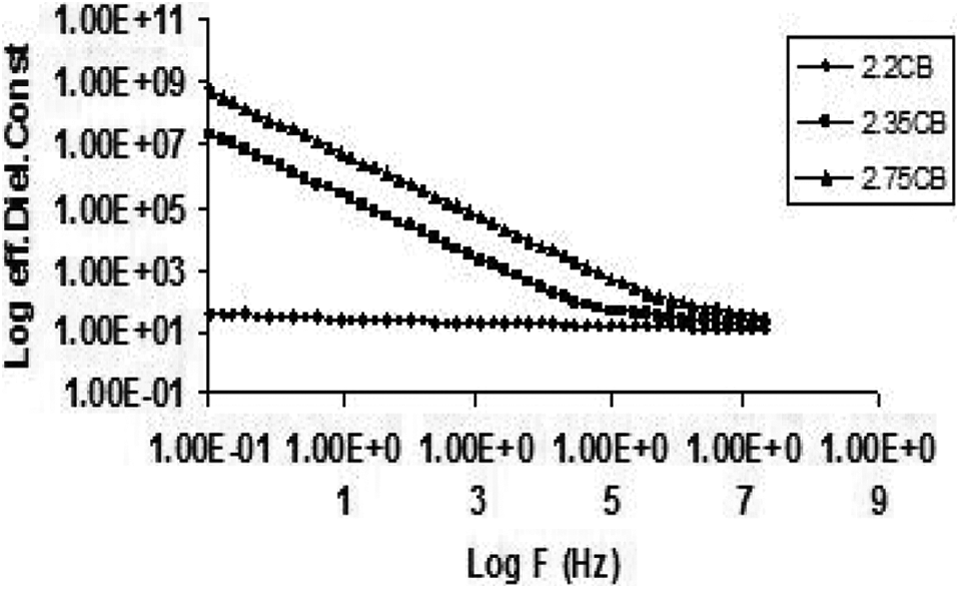
Effective dielectric constant variation in PP-7 wt% graphite-X wt% CB (X = 2.2, 2.35, 2.75).
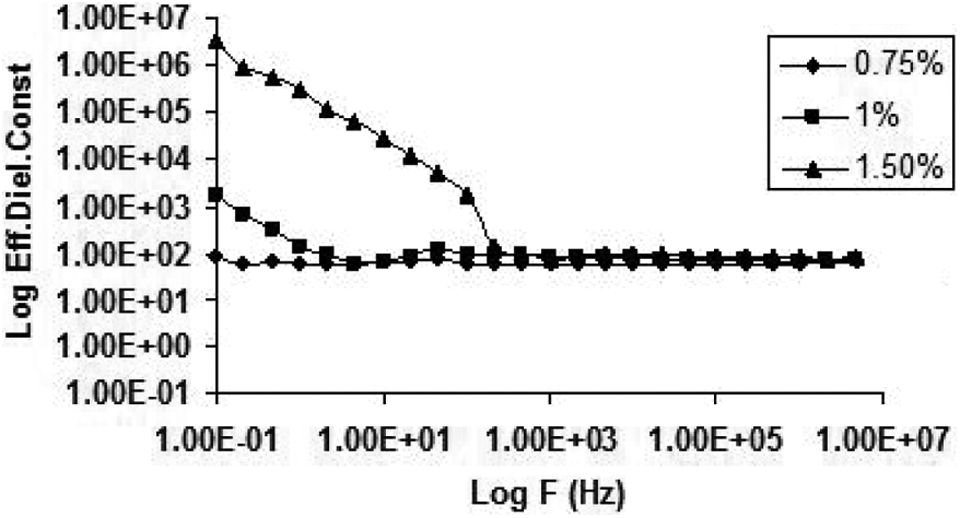
Effective dielectric constant variation in PP-7 wt% graphite-X wt% ExGr (X = 0.75, 1, 1.5).
Conclusions
Powder mixed PP-graphite-X (X = CB, ExGr, CNF) hybrid composites are made and the DC electrical resistance has been measured with respect to the various loadings of second conducting filler in PP-7 wt% graphite. The electrical percolation threshold varies with respect to the aspect ratio of second conducting fillers. The aspect ratio varies in the order CB < ExGr < CNF. Increase in the aspect ratio reduces the interparticular distance and hence the barrier for the charge transport. The second conducting fillers predominantly occupy intergraphite space and the AC measurements clearly show that the effective dielectric constant increases to a greater extent for high aspect ratio second conducting filler. Thus hybrid composites are very effective in reducing the total amount of fillers required to match a particular value of electrical conductivity. Melt-crystallized PP-7 wt% graphite-CNF samples exhibit higher percolation threshold than the powder mixed ones due to decrease in the melt viscosity of the polymer at 180°C.
Footnotes
Acknowledgment
The authors thank the Director, NCL, for allowing them to carry out few experiments and completion of this work.
Declaration of Conflicting Interests
The author(s) declared no potential conflicts of interest with respect to the research, authorship, and/or publication of this article.
Funding
The author(s) received no financial support for the research, authorship, and/or publication of this article.