
Abstract
The reversible nonlinear electrical conductive properties of high-density polyethylene composites filled separately with carbon black (CB), ethylene-vinyl acetate copolymer, and carbon fiber (CF) were measured using a four-electrode method. It was found that these composites presented significant reversible nonlinear electrical conductive behavior under these experimental conditions; the correlation between the current density and the electrical field intensity was linear in a bi-logarithmic coordinate system; both the crossover current density and the conductivity were approximately a linear function of the conductivity in a bi-logarithmic coordinate system; there was a synergic effect in the electrical conductivity percolation threshold between the CB and CF in the matrix, and the percolation threshold decreased with increasing the Brunauer–Emmett–Teller specific area of the CB.
Introduction
Reversible nonlinear electrical conductive behavior is an important property of conductive polymer materials. 1,2 Basic characterizations of reversible nonlinear electrical conductive of materials are: electrical current density (J) is not a linear function of electrical field intensity (E); electrical conductivity is not a constant, while it has dependence on electrical field. 3 –7 In a case of low electrical field intensity, the J-E relationship presents linear correlation. With increasing the electrical field intensity, the J-E relationship will vary from linearity to nonlinearity. In this case, the electrical field is called as crossover electrical field (Ec). When the electrical field intensity is further enhanced, the electrical conductivity increases slowly, and is up to a saturated state. The zone with high electrical field intensity is a Joule nonreversible breakdown zone. For a high electric conductivity specimen, when the electrical conductivity is over percolation threshold, a crossover electrical field can be presented around the Joule nonreversible breakdown zone.
With increasing the electrical field intensity, the J-E relationship will start to deviate the linearity zone from the crossover point (Jc, Ec), and it will enter into a reversible linear zone. Aharony 8 and Chakrabarty et al. 9 found a scaling correlation between crossover electrical current density (Jc) and linear electric conductivity (σ0) after they studied the reversible nonlinear electric conductive behavior around the percolation threshold. High-density polyethylene (HDPE) is usually prepared as an electric conductive material by means of filling with electric conductive fillers such as carbon black (CB) and carbon fiber (CF). Liang and Yang 10 studied the resistivity relaxation behavior of HDPE/CB conductive composites and found that the relaxation of resistivity of the composites was monotonic, and it could be described by an exponential form above melting temperature. In addition, they investigated the effect of CF content and size on the electric conductive properties of reinforced HDPE composites. 11 The results showed that both the HDPE composites filled with short-cut CF with large length–diameter ratio lf/df and the HDPE composites filled with triturated CF with small lf/df presented obvious conductive percolation behavior. More recently, Liang 12 investigated the effects of heat treatment on the conductivity of HDPE/CB composites and found that the effects of annealing temperature of specimens on the resistivity, conductivity, and the positive temperature coefficient (PTC) intensity of the composites were significant; the resistivity and the PTC intensity of the composites varied with increasing the number of thermal cycle, while the variation became small after the third thermal cycle.
To improve the toughness of the HDPE conductive composites, HDPE is usually blended with thermoplastic elastomer. Ethylene-vinyl acetate copolymer (EVA) is a kind of thermoplastic elastomer. However, there have been relatively few studies on the reversible nonlinear electrical conductive behavior of HDPE composites (including HDPE/EVA composites) filled with CB and CF. The objectives of this study are to investigate the effects of CB and CF on the reversible nonlinear electric conductive behavior of HDPE composites and HDPE/EVA composites to understand the mechanisms of the reversible nonlinear electrical conductivity behavior and to provide useful data for further development of the HDPE conductive composites.
Experimental
Materials
Two kinds of conductive fillers used in this study were a short-cut CF and three nanometer CBs. The short-cut CF with trademark SY-DQCF-02 was supplied by the Nantong Shenyou Carbon Co. Ltd. (China), the length was 2 mm, the diameter was 7 μm, and the density was 1760 kg/m3. The three CBs were also selected as the electric conductive fillers, for which the trademarks were Vulcan XC-72, L6, and N293, respectively. The partial physical and chemical properties and the suppliers are summarized in Table 1. It should be noted that DBP means dibutyl phthalate absorption number and Brunauer–Emmett–Teller (BET) specific area means the particle-specific area determined by the BET method. The HDPE with trademark 5000 S supplied by the Daqing Petrochemical Petro China Co. (Daqing, China) was served as the matrix; the density and melting index were 954 kg/m3 and 0.9 g/10 min (190°C, 2.16 kg), respectively. The EVA with trademark EVA14-2 was supplied by the Dongfang Petroleum Chemical Co. Ltd. (Beijing, Chin). The density and melting index were 935 kg/m3 and 2 g/10 min, respectively, and the VA content was 14 wt%.
The partial physical and chemical properties of the three CBs.
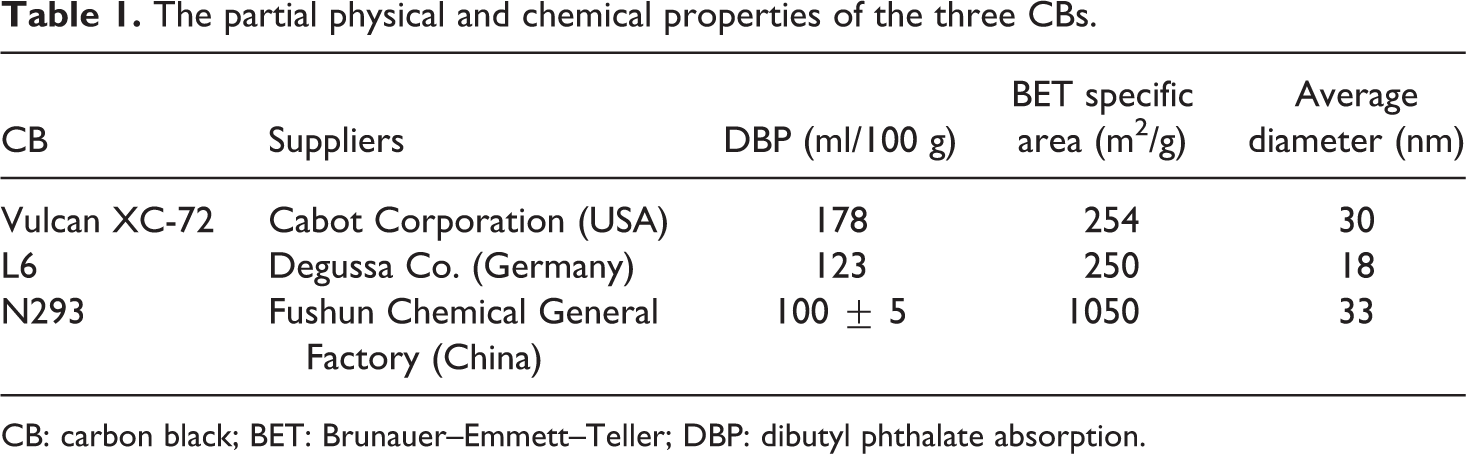
CB: carbon black; BET: Brunauer–Emmett–Teller; DBP: dibutyl phthalate absorption.
Preparation
For the HDPE/CB systems, the CB weight fraction range was from 8 wt% to 20 wt%. For the HDPE/CF systems, the CF weight fraction range was from 10 wt% to 20 wt%. For HDPE/CB/CF systems, the CF weight fraction range was from 5 wt% to 15 wt%, while the CB weight fraction was 10 wt%. For HDPE/EVA/CB systems, the EVA weight fraction range was from 10 wt% to 100 wt%, while the CB weight fraction was 18 wt%. The HDPE, CB, CF, and EVA with designed weight fractions were melt-mixed in a Brabender mixer (Plasti-Corder) under given conditions (mixing time 8 min and mixing temperature 155°C) to prepare four conductive HDPE composite systems: HDPE/CB composites, HDPE/EVA/CB composites, HDPE/CF composites, and HDPE/CB/CF composites. 10 –12 The mixer was supplied by the Brabender Co. (Germany). Then the composites were put into a plate curing machine with model of QLB 400 × 400 × 2 (The Wuxi First Rubber Machinery Factory, China) to prepare the specimens with different operation conditions under 160°C and the pressure of 10 MPa for 10 min. The specimens were the circular sheets with diameter of 100 mm and thickness of 2 mm.
Electrical property measurement
The current density and electrical field intensity of the specimens for the HDPE conductive composites were measured using a four-electrode method under room temperature. A digital universal meter with model UT58C was used to measure voltage; and then a digital universal meter with model UT58A was used to measure the electrical current, to avoid the Joule’s effect. 10 –12
Results and discussion
J-E characterization curves of HDPE/CB composites
The J-E curve of conductive polymer composites can be described by the following empirical equation 6

where b is a positive integer, which is an adjustable fitting parameter, and σ1 and σb are the linear electrical conductivity and the nonlinear electrical conductivity, respectively. These parameters can be obtained by means of a data fitting method. It can be seen that parameter b is an important index for characterizing the nonlinear property of the electrical conductivity of polymer composites.
Figures 1 to 3 show the J-E characterization curves of the HDPE/Vulcan XC-72 conductive composites with different Vulcan XC-72 weight fractions, the HDPE/L6 conductive composites with different L6 weight fractions, and the HDPE/N293 conductive composites with different N293 weight fractions, respectively. It can be seen in Figures 1 to 3 that the relationship between the current density and the electrical field intensity of the three HDPE/CB composites is linear in a double logarithmic coordinate system; this indicates that the electrical conductivity of these three HDPE/CB conductive composites has strong nonlinear characteristics. It can also be seen that when the weight fractions of Vulcan XC-72 and L6 are higher than 12 wt%, the current density of the composites increases considerably with increasing CB weight fraction (see Figures 1 and 2). While for the HDPE/N293 systems, the current density of the composites increases considerably with increasing CB weight fraction when the CB weight fraction is higher than 10 wt% (see Figure 3). It means that the percolation threshold of the HDPE/Vulcan XC-72 composites and the HDPE/L6 composites is around 14 wt%, while the percolation threshold of the HDPE/N293 composites is about 12 wt.%. The difference in the percolation threshold could be attributed to the BET specific area of the CBs. This is because that the more the BET specific area of the CBs, the more is the electrical conductive network channels in the composites under the same CB concentration. It can be seen in Table 1 that the BET specific area of N293 is much greater than that of Vulcan XC-72 and L6. Thus the percolation threshold of the HDPE/N293 composites is lower than that of the HDPE/Vulcan XC-72 composites and the HDPE/L6 composites. 10 –12 In addition, in Figures 1 to 3, the solid lines are obtained by means of a data fitting method; in this case, the fitting parameter b = 2.
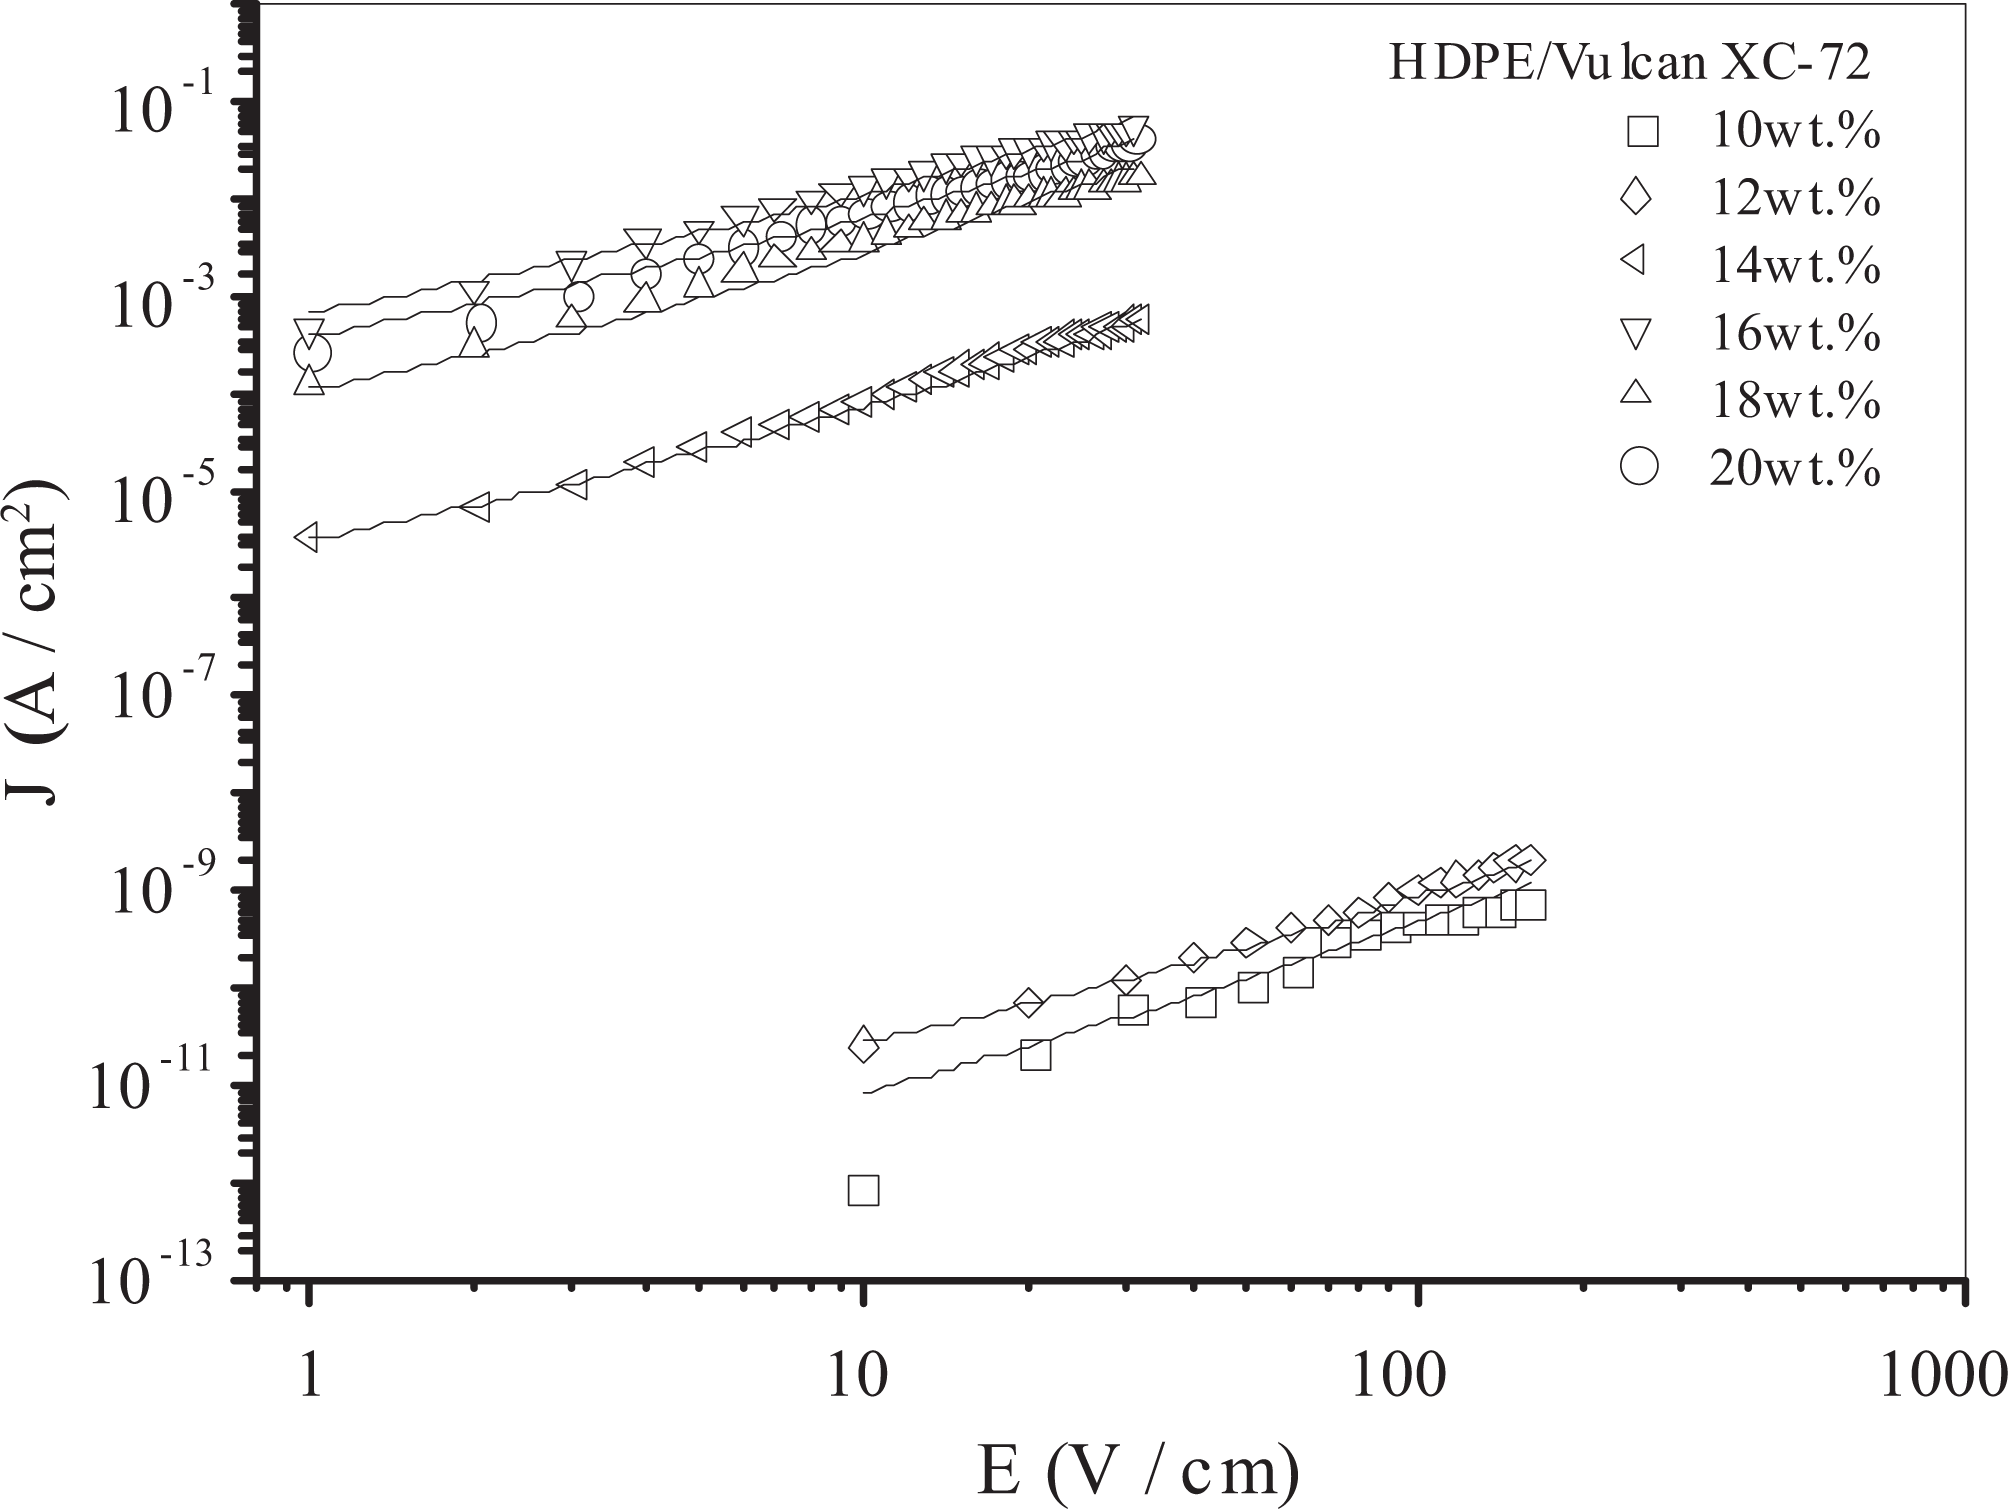
J-E characterization curves of HDPE/Vulcan XC-72 composites. J: electrical current density; E: electrical field intensity; HDPE: high-density polyethylene.
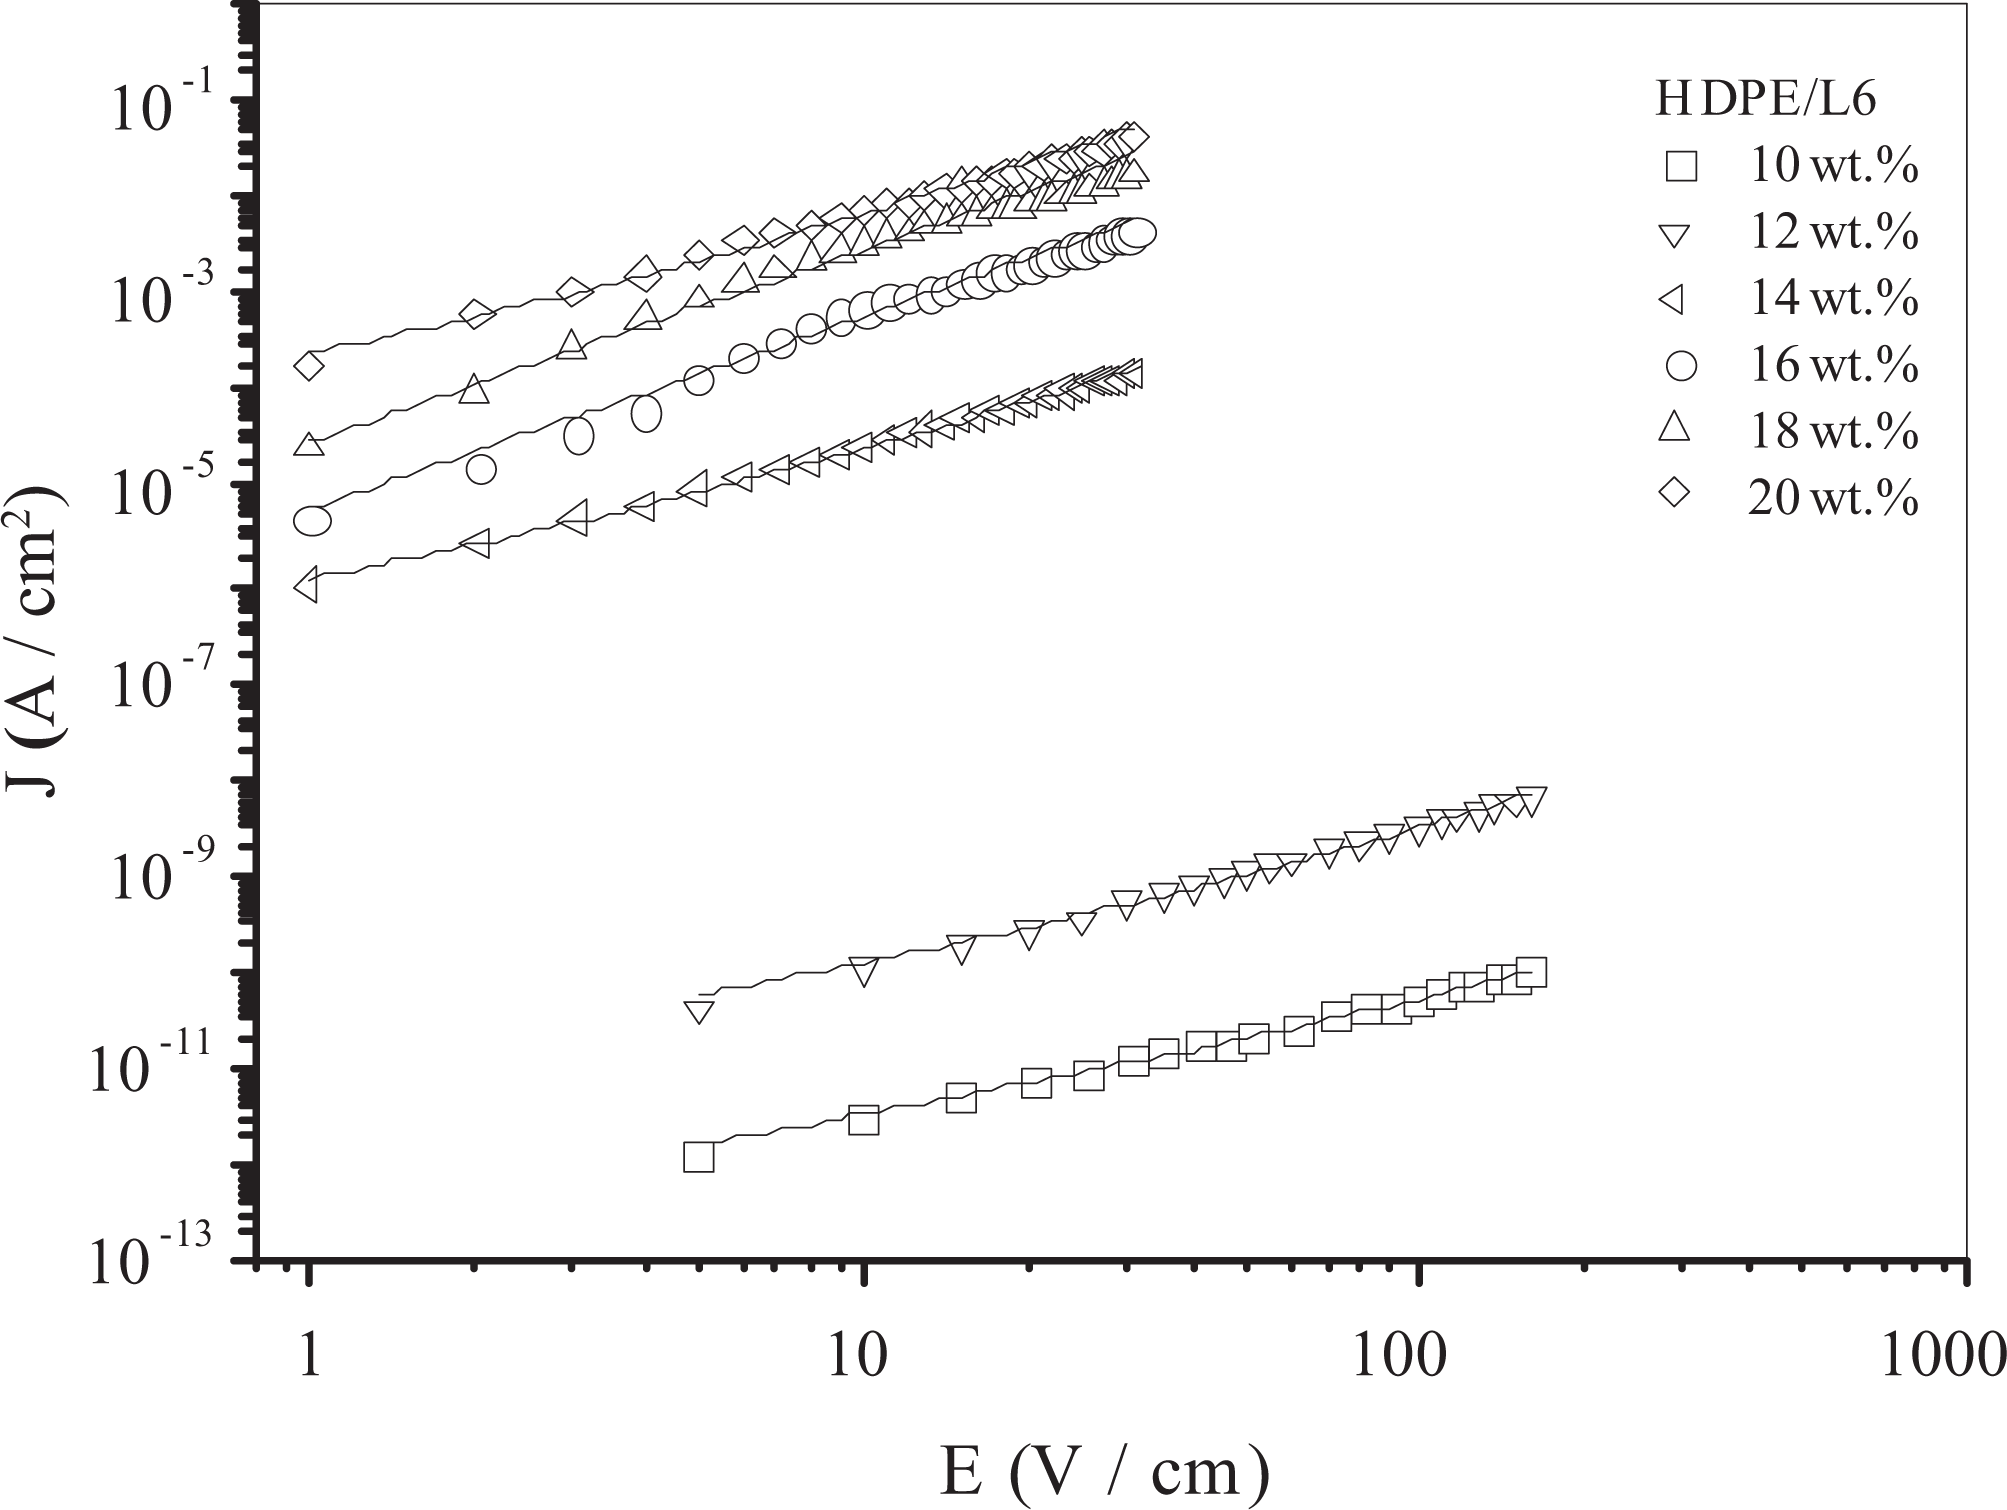
J-E characterization curves of HDPE/L6 composites. J: electrical current density; E: electrical field intensity; HDPE: high-density polyethylene.
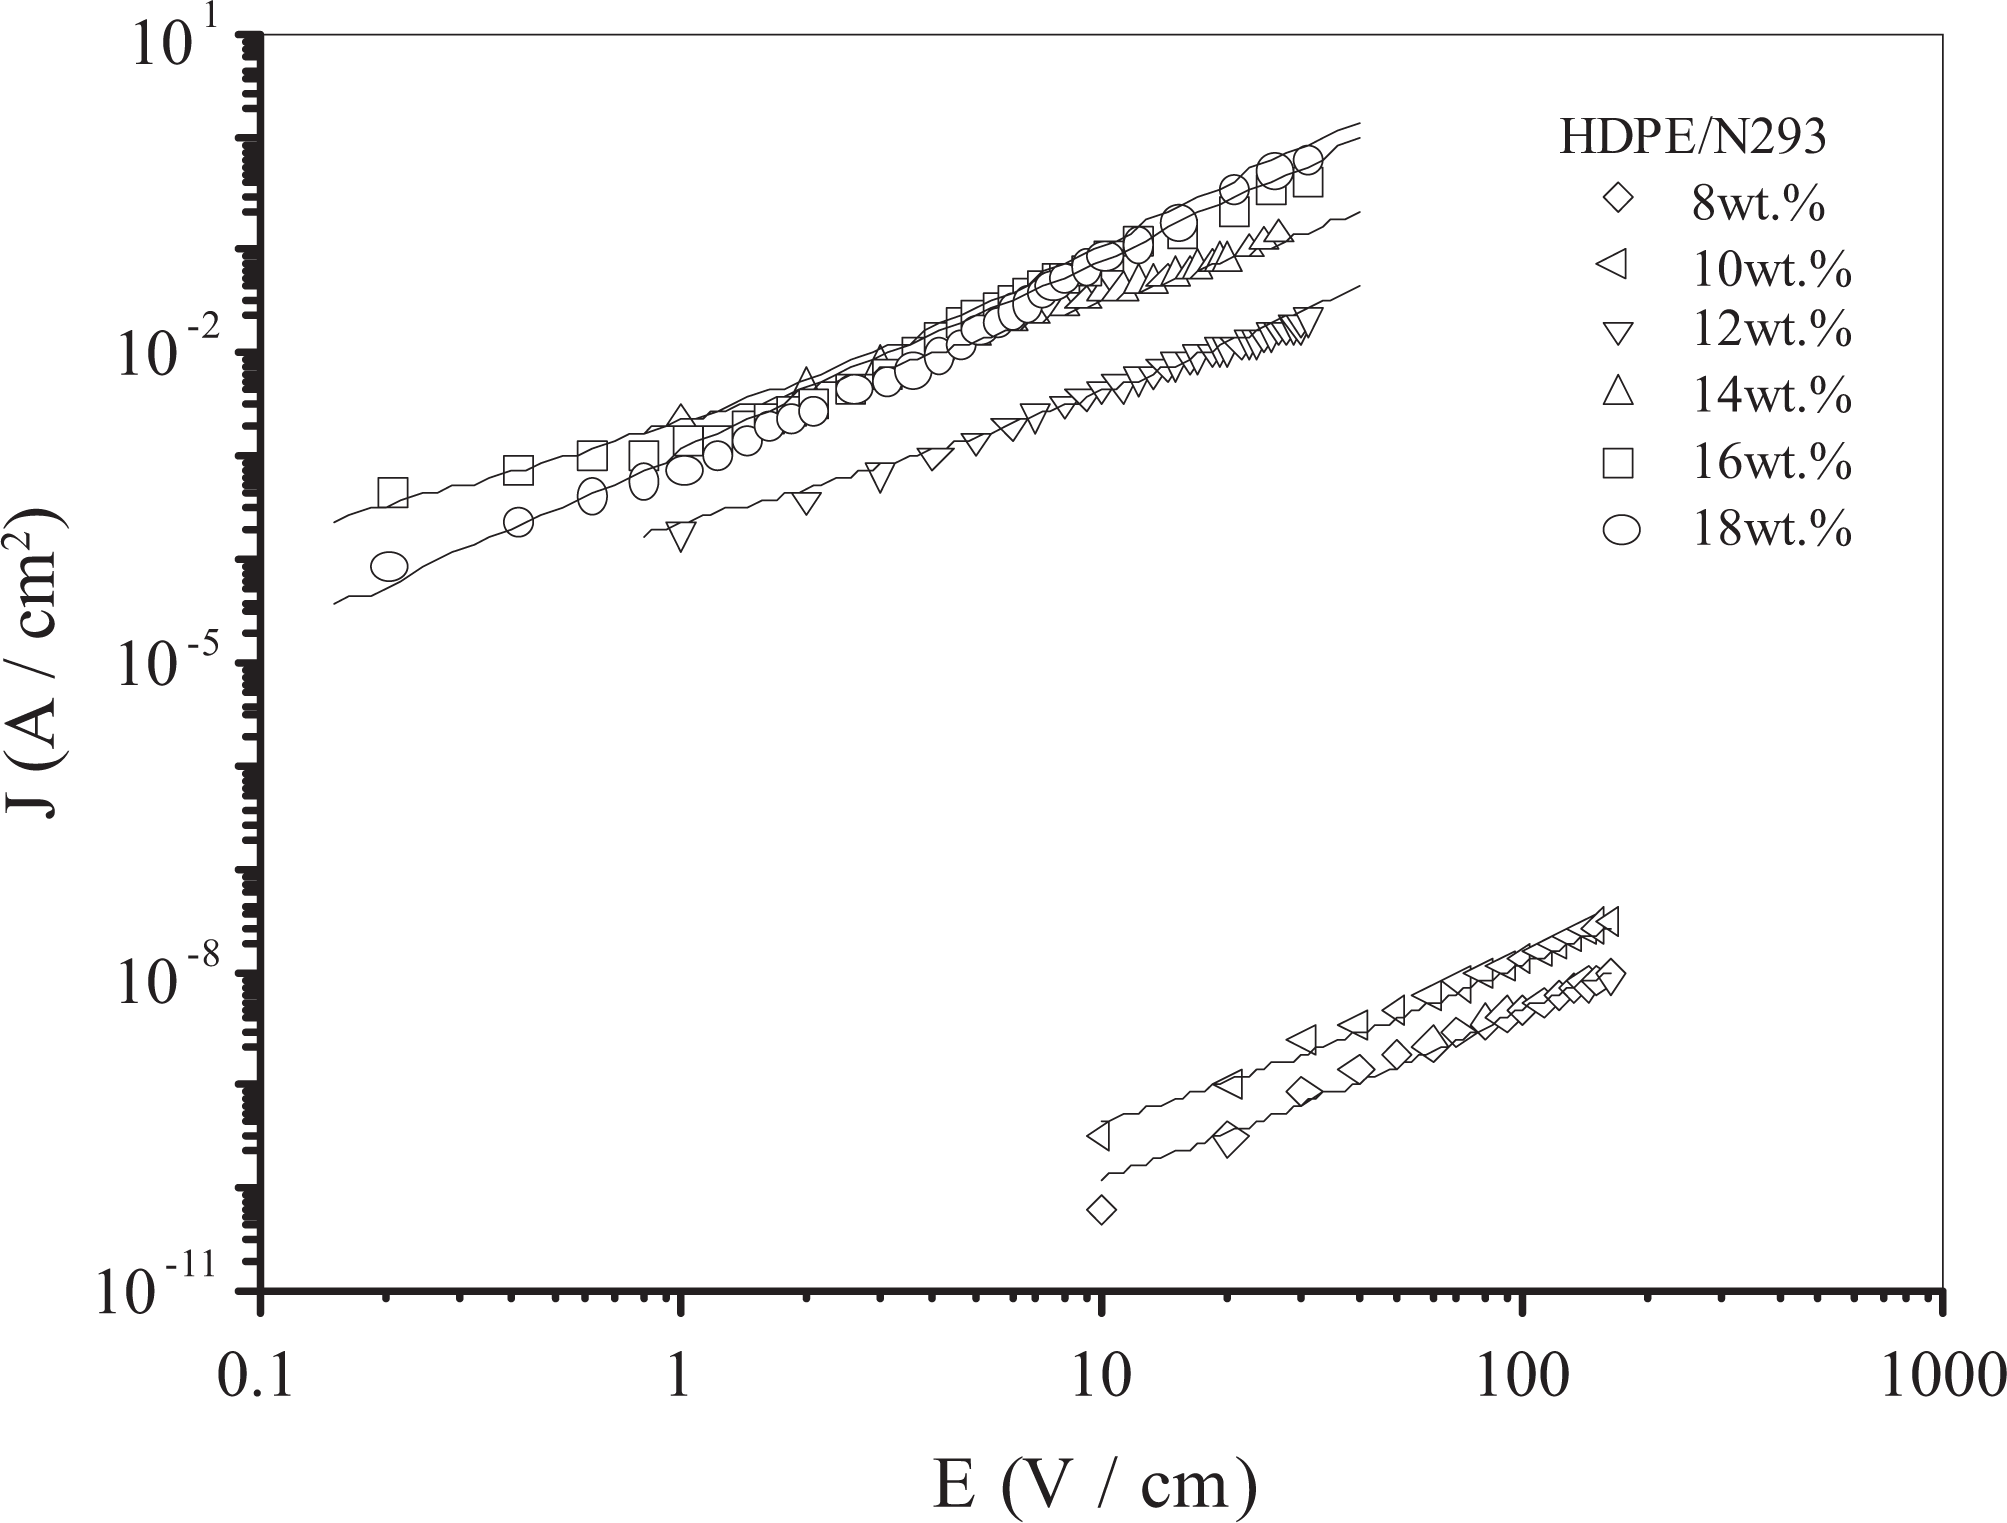
J-E characterization curves of HDPE/N293 composites. J: electrical current density; E: electrical field intensity; HDPE: high-density polyethylene.
J-E characterization curves of HDPE/EVA/CB composites
Figure 4 demonstrates the J-E characterization curves of the HDPE/EVA/CB ternary conductive composites with different EVA weight fractions and the Vulcan XC-72 weight fraction of 10 wt%. It can be found that the correlation between the current density and the electrical field intensity of the HDPE/EVA/CB composites is almost linear in a bi-logarithmic coordinate system; this illustrates that the electrical conductivity of the ternary conductive composites presents roughly nonlinear characteristics. When EVA weight fraction is 40 wt%, the current density of the composites is up to a maximum. It means that there is appreciate composition for the electrical properties of the HDPE/EVA/CB ternary conductive composites. Moreover, the solid lines in Figure 4 are obtained also using a data fitting method; in this case, the fitting parameter b = 2.
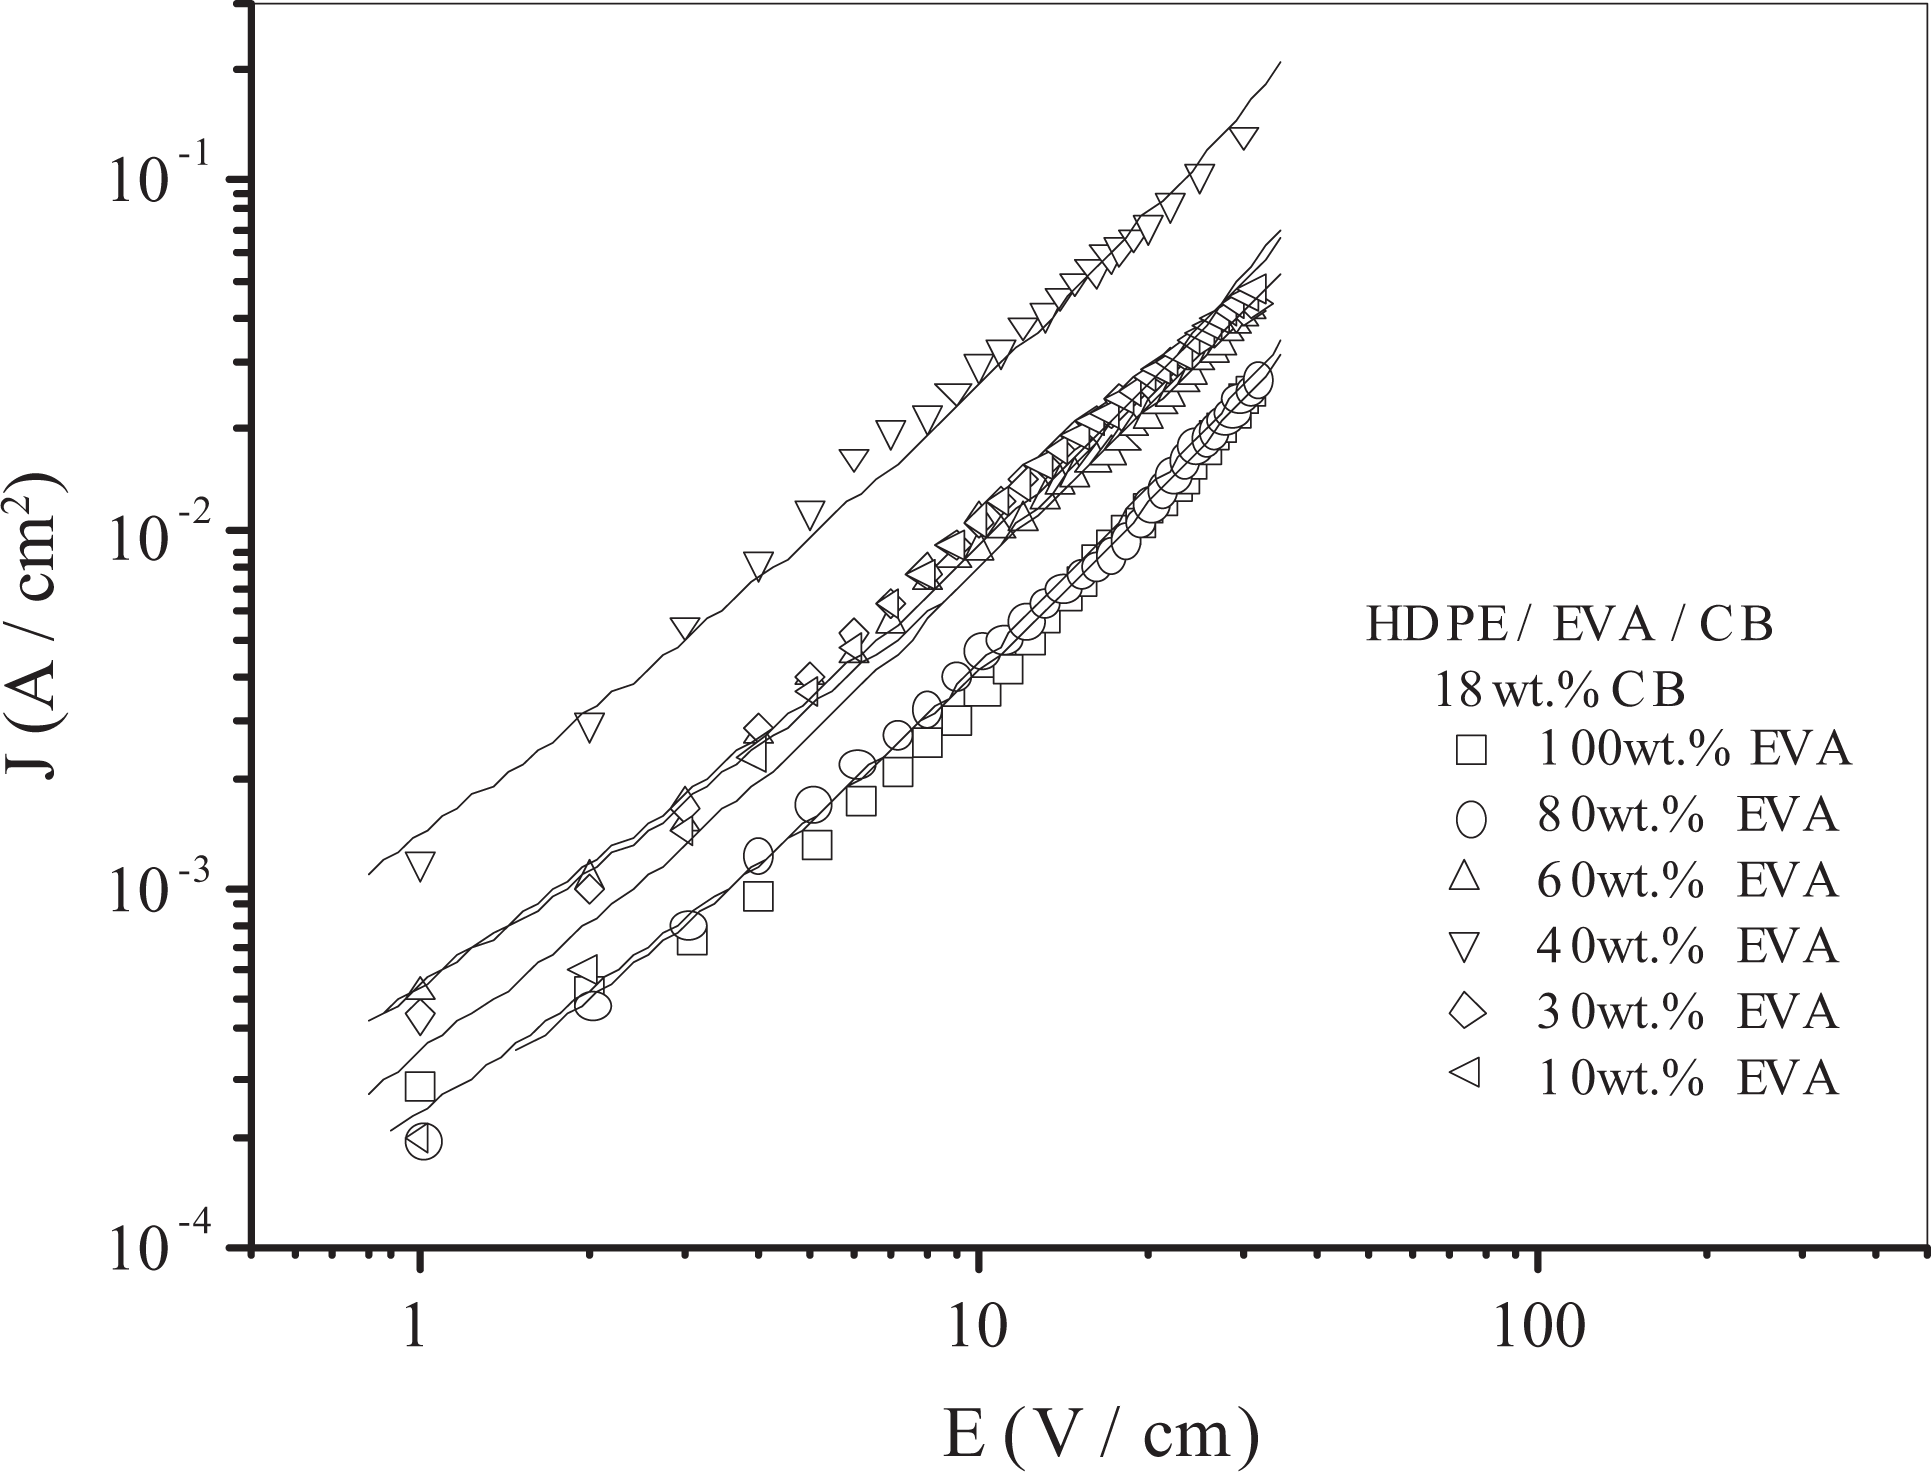
J-E characterization curves of HDPE/EVA/CB composites. J: electrical current density; E: electrical field intensity; HDPE: high-density polyethylene; EVA: ethylene-vinyl acetate copolymer; CB: carbon black.
It can also be seen in Figure 4 that the current densities of the composites do not monotonously increase with increasing CB weight fraction. In other words, the HDPE/EVA/CB ternary conductive composites have no obvious percolation threshold value. This is very different from those for the HDPE/CB composite systems (see Figures 1 to 3). This is because that the obvious electrical conductive network channels are difficultly to form in the HDPE/EVA/CB ternary conductive composites owing to loading the EVA.
J-E characterization curves of HDPE/CF composites
Figure 5 shows the J-E characterization curves of the conductive HDPE/CF composites with different CF weight fractions. It can be observed that the electrical current density of the HDPE/CF conductive composites is a linear function of the electrical field intensity in a double logarithmic coordinate system; this demonstrates that the electrical conductivity of the conductive composites illustrates nonlinear characteristics. When CF weight fraction is higher than 12 wt%, the current density of the composites increases considerably with increasing CF weight fraction. As discussed above, it indicates that the percolation threshold of the HDPE/CF systems could be around 14 wt% CF. Furthermore, the solid lines in Figure 5 are determined by means of a data fitting method; under the experimental conditions, the fitting parameter b = 2.
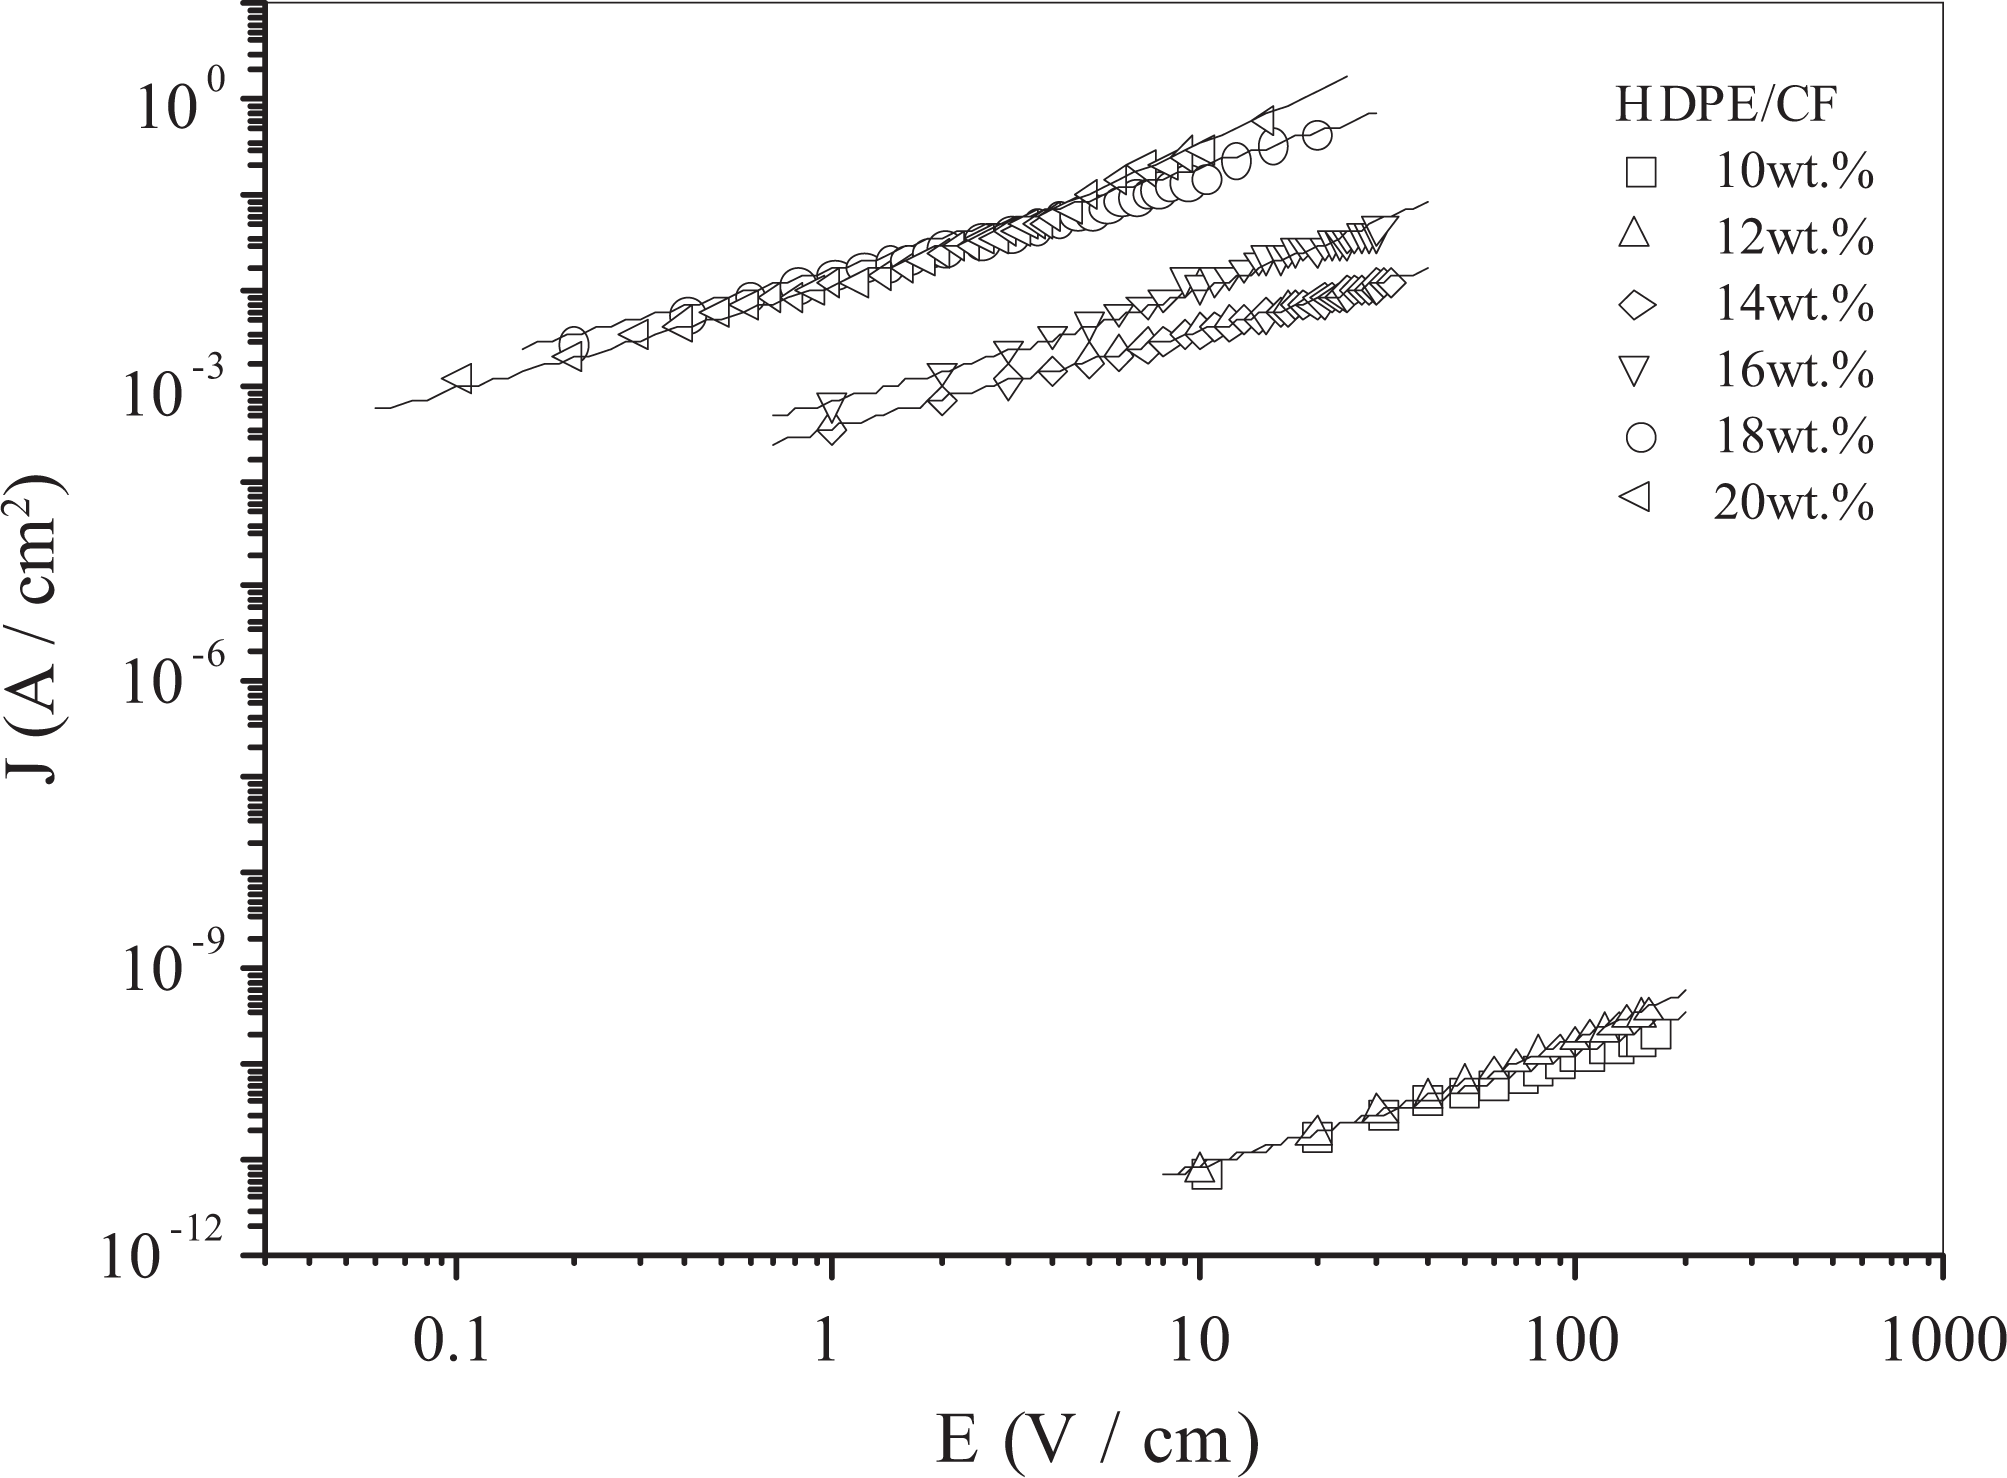
J-E characterization curves of HDPE/CF composites. J: electrical current density; E: electrical field intensity; HDPE: high-density polyethylene; CF: carbon fiber.
J-E characterization curves of HDPE/CB/CF composites
Figure 6 displays the J-E characterization curves of the HDPE/CB/CF conductive composites with different CF weight fractions and the Vulcan XC-72 weight fraction of 10 wt%. It can be seen that the current density of the HDPE/CB/CF conductive composites is almost a linear function of the electrical field intensity in a bi-logarithmic coordinate system; this presents that the electrical conductivity of the conductive composites also displays nonlinear characteristics. Moreover, the current density of the composites increases considerably with increasing CF weight fraction when CF weight fraction is higher than 5 wt%. In other words, the percolation threshold of the HDPE/CB/CF systems could be around 7 wt% CF. It illustrates that the percolation threshold of the HDPE/CB/CF systems can be reduced due to loading CB. It could be attributed to the synergic effect between the CB and CF in the HDPE matrix. This is because that the CB and CF will overlap or bridge each other in the matrix, thus the electrical conductive network channels formed by the CB and CF in the HDPE matrix will be more than those for the HDPE composites only filled with the CF under the same conditions. Similarly, the solid lines in Figure 6 are determined by means of a data fitting method; under the experimental conditions, the fitting parameter b = 2.
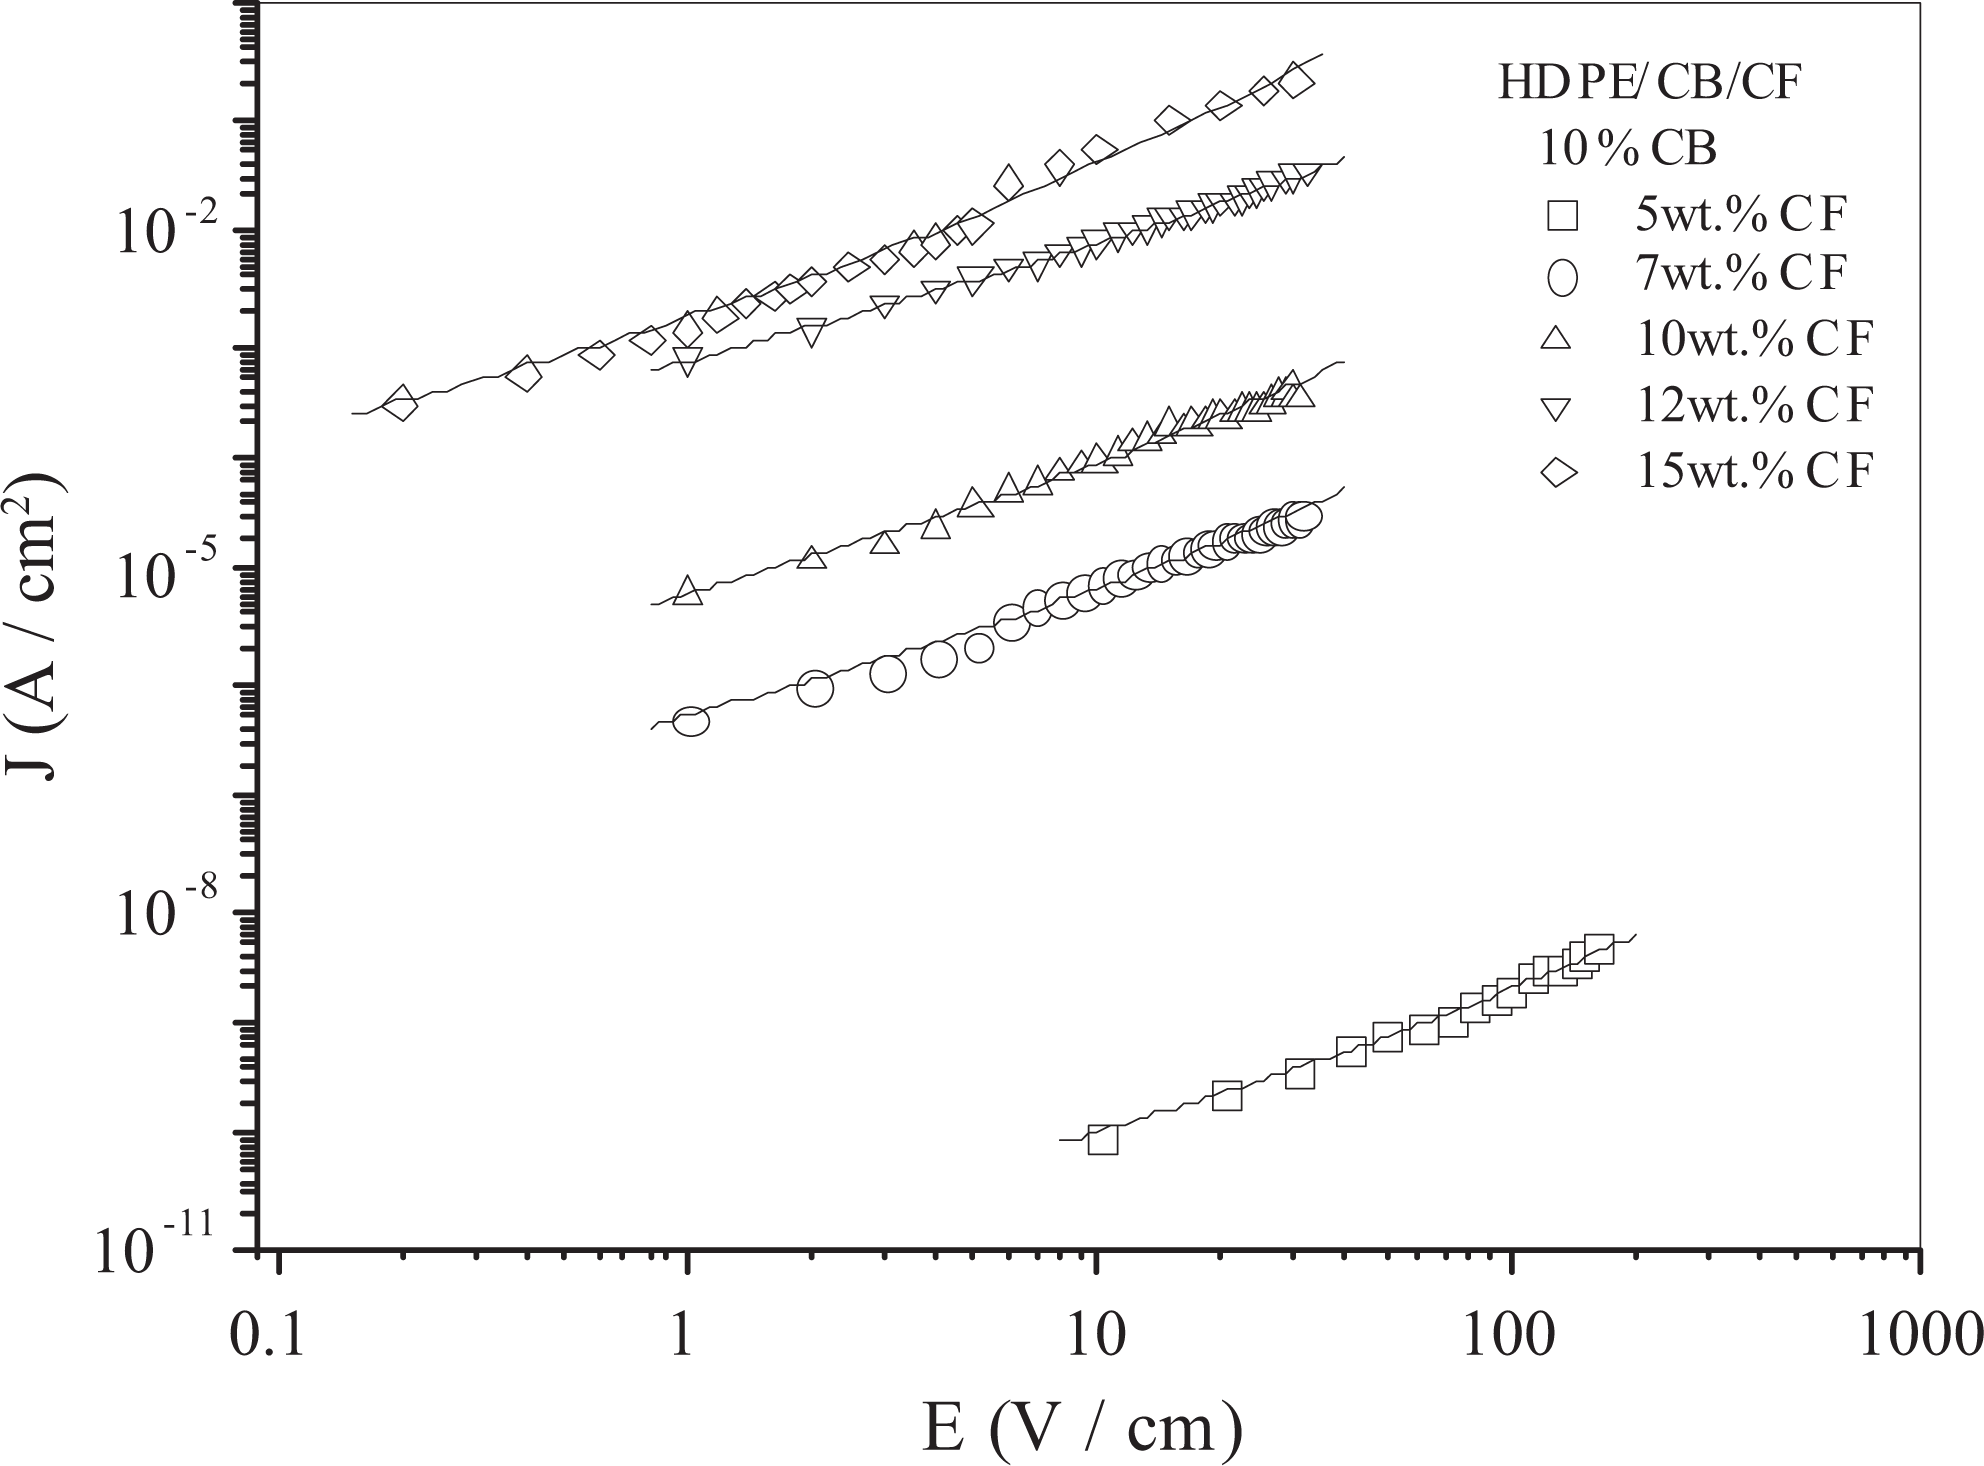
J-E characterization curves of HDPE/CB/CF composites. J: electrical current density; E: electrical field intensity; HDPE: high-density polyethylene; CB: carbon black; CF: carbon fiber.
It can also be seen from the results shown in Figures 1 to 6 that the reversible nonlinear electric conductive behavior of these HDPE conductive composites can be described well using equation (1). In addition, when the applied voltage is decreased to some level, the relationship between the current and voltage will come back to the linear response area, to present the reversible nonlinear electrical conductive properties of the composites.
Crossover current density
The two items at the right side of equation (1) are the contribution of linear electrical conductivity and nonlinear electrical conductivity of materials. In general, a nonlinear transformation occurs only when the contributions of the linear electrical conductivity and nonlinear electrical conductivity are equivalent. Therefore, at the intersection point, from equation (1), the crossover current density (Jc) can be given by

As to conductive polymer composites, linear conductivity σ1 and nonlinear conductivity σb in equation (1) can be obtained by means of a curve fitting method. Thus, the crossover current density can be determined using equation (2). Plotting the crossover current density Jc of the HDPE/CB composites with different CB weight fractions against linear conductivity σ1 and nonlinear conductivity σb in a bi-logarithmic coordinate system, we found that both the relationship between Jc and σ1 and the relationship between σb and σ1 are linear or roughly linear, as shown in Figures 7 to 9. Figures 7 to 9 display the relationship between Jc and σ1 as well as the relationship between σb and σ1 of the HDPE/Vulcan XC-72 composites, the HDPE/L6 composites, and the HDPE/N293 composites, respectively. It can be seen that both the crossover current density and the nonlinear conductivity of the three HDPE/CB composites are almost a linear function of σ1. Figure 10 presents the correlation between Jc and σ1 as well as the correlation between σb and σ1 of the HDPE/EVA/CB composites with different EVA weight fractions. It can also be found that the crossover current density and the nonlinear conductivity are approximately a linear function of σ1.
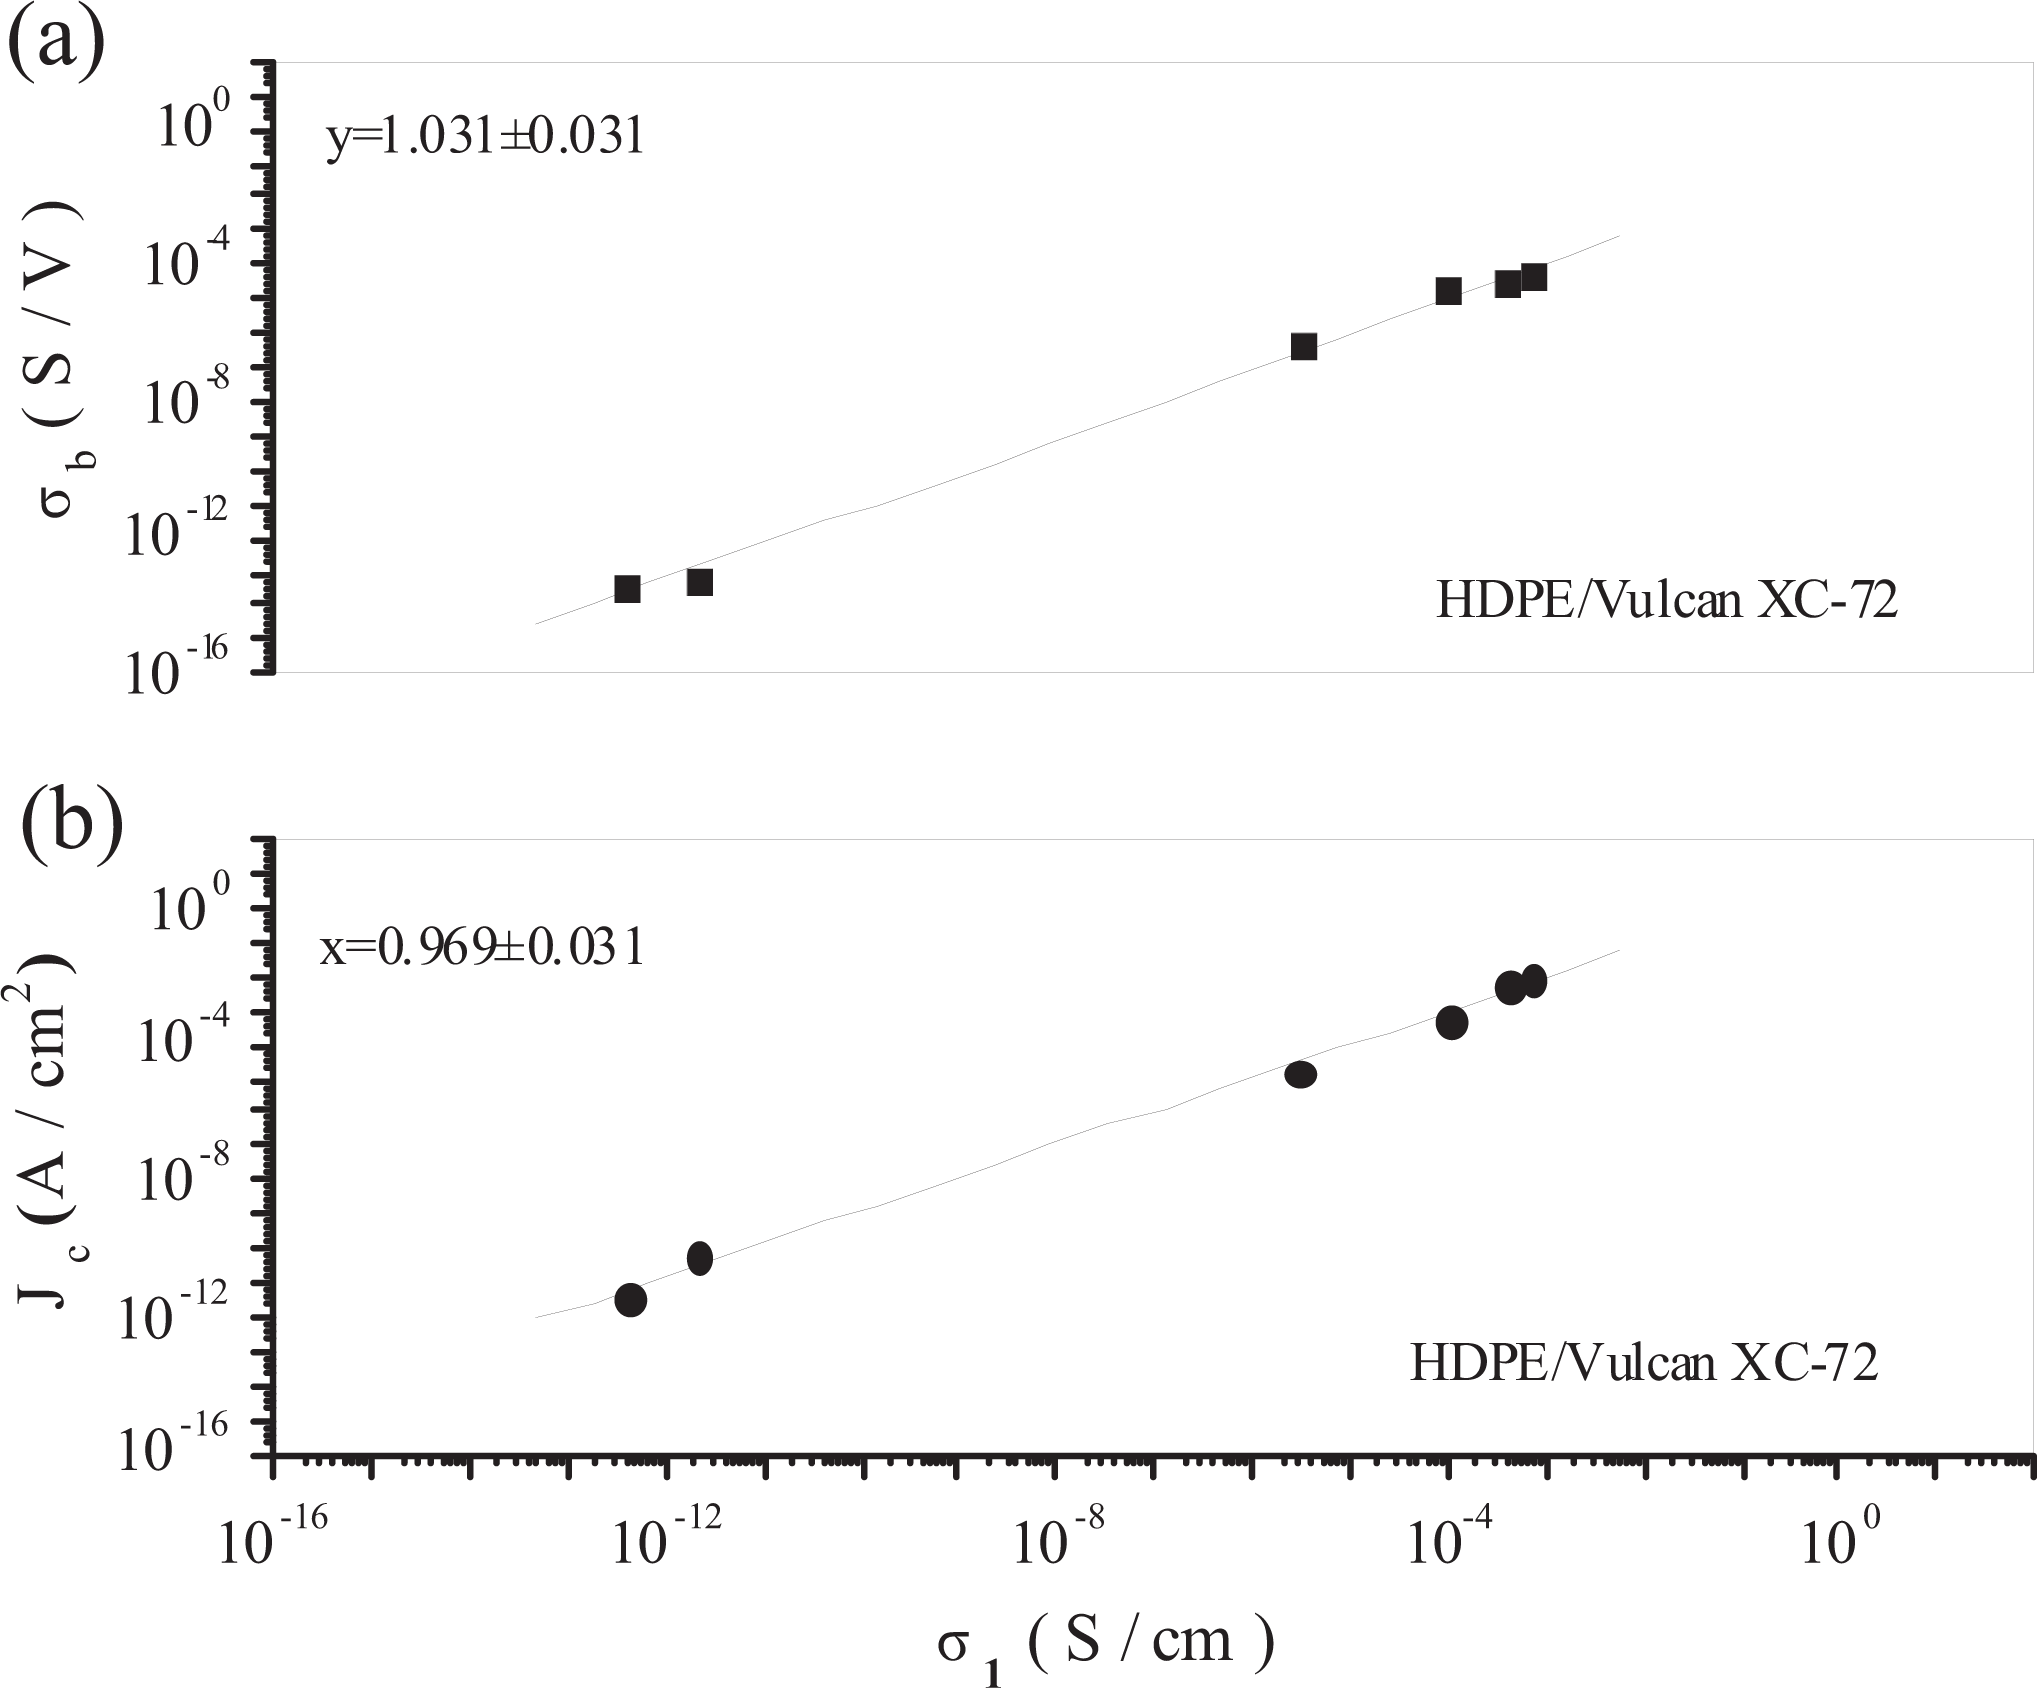
Relationship between Jc, σb, and σ1 of HDPE/Vulcan XC-72 composites. HDPE: high-density polyethylene.
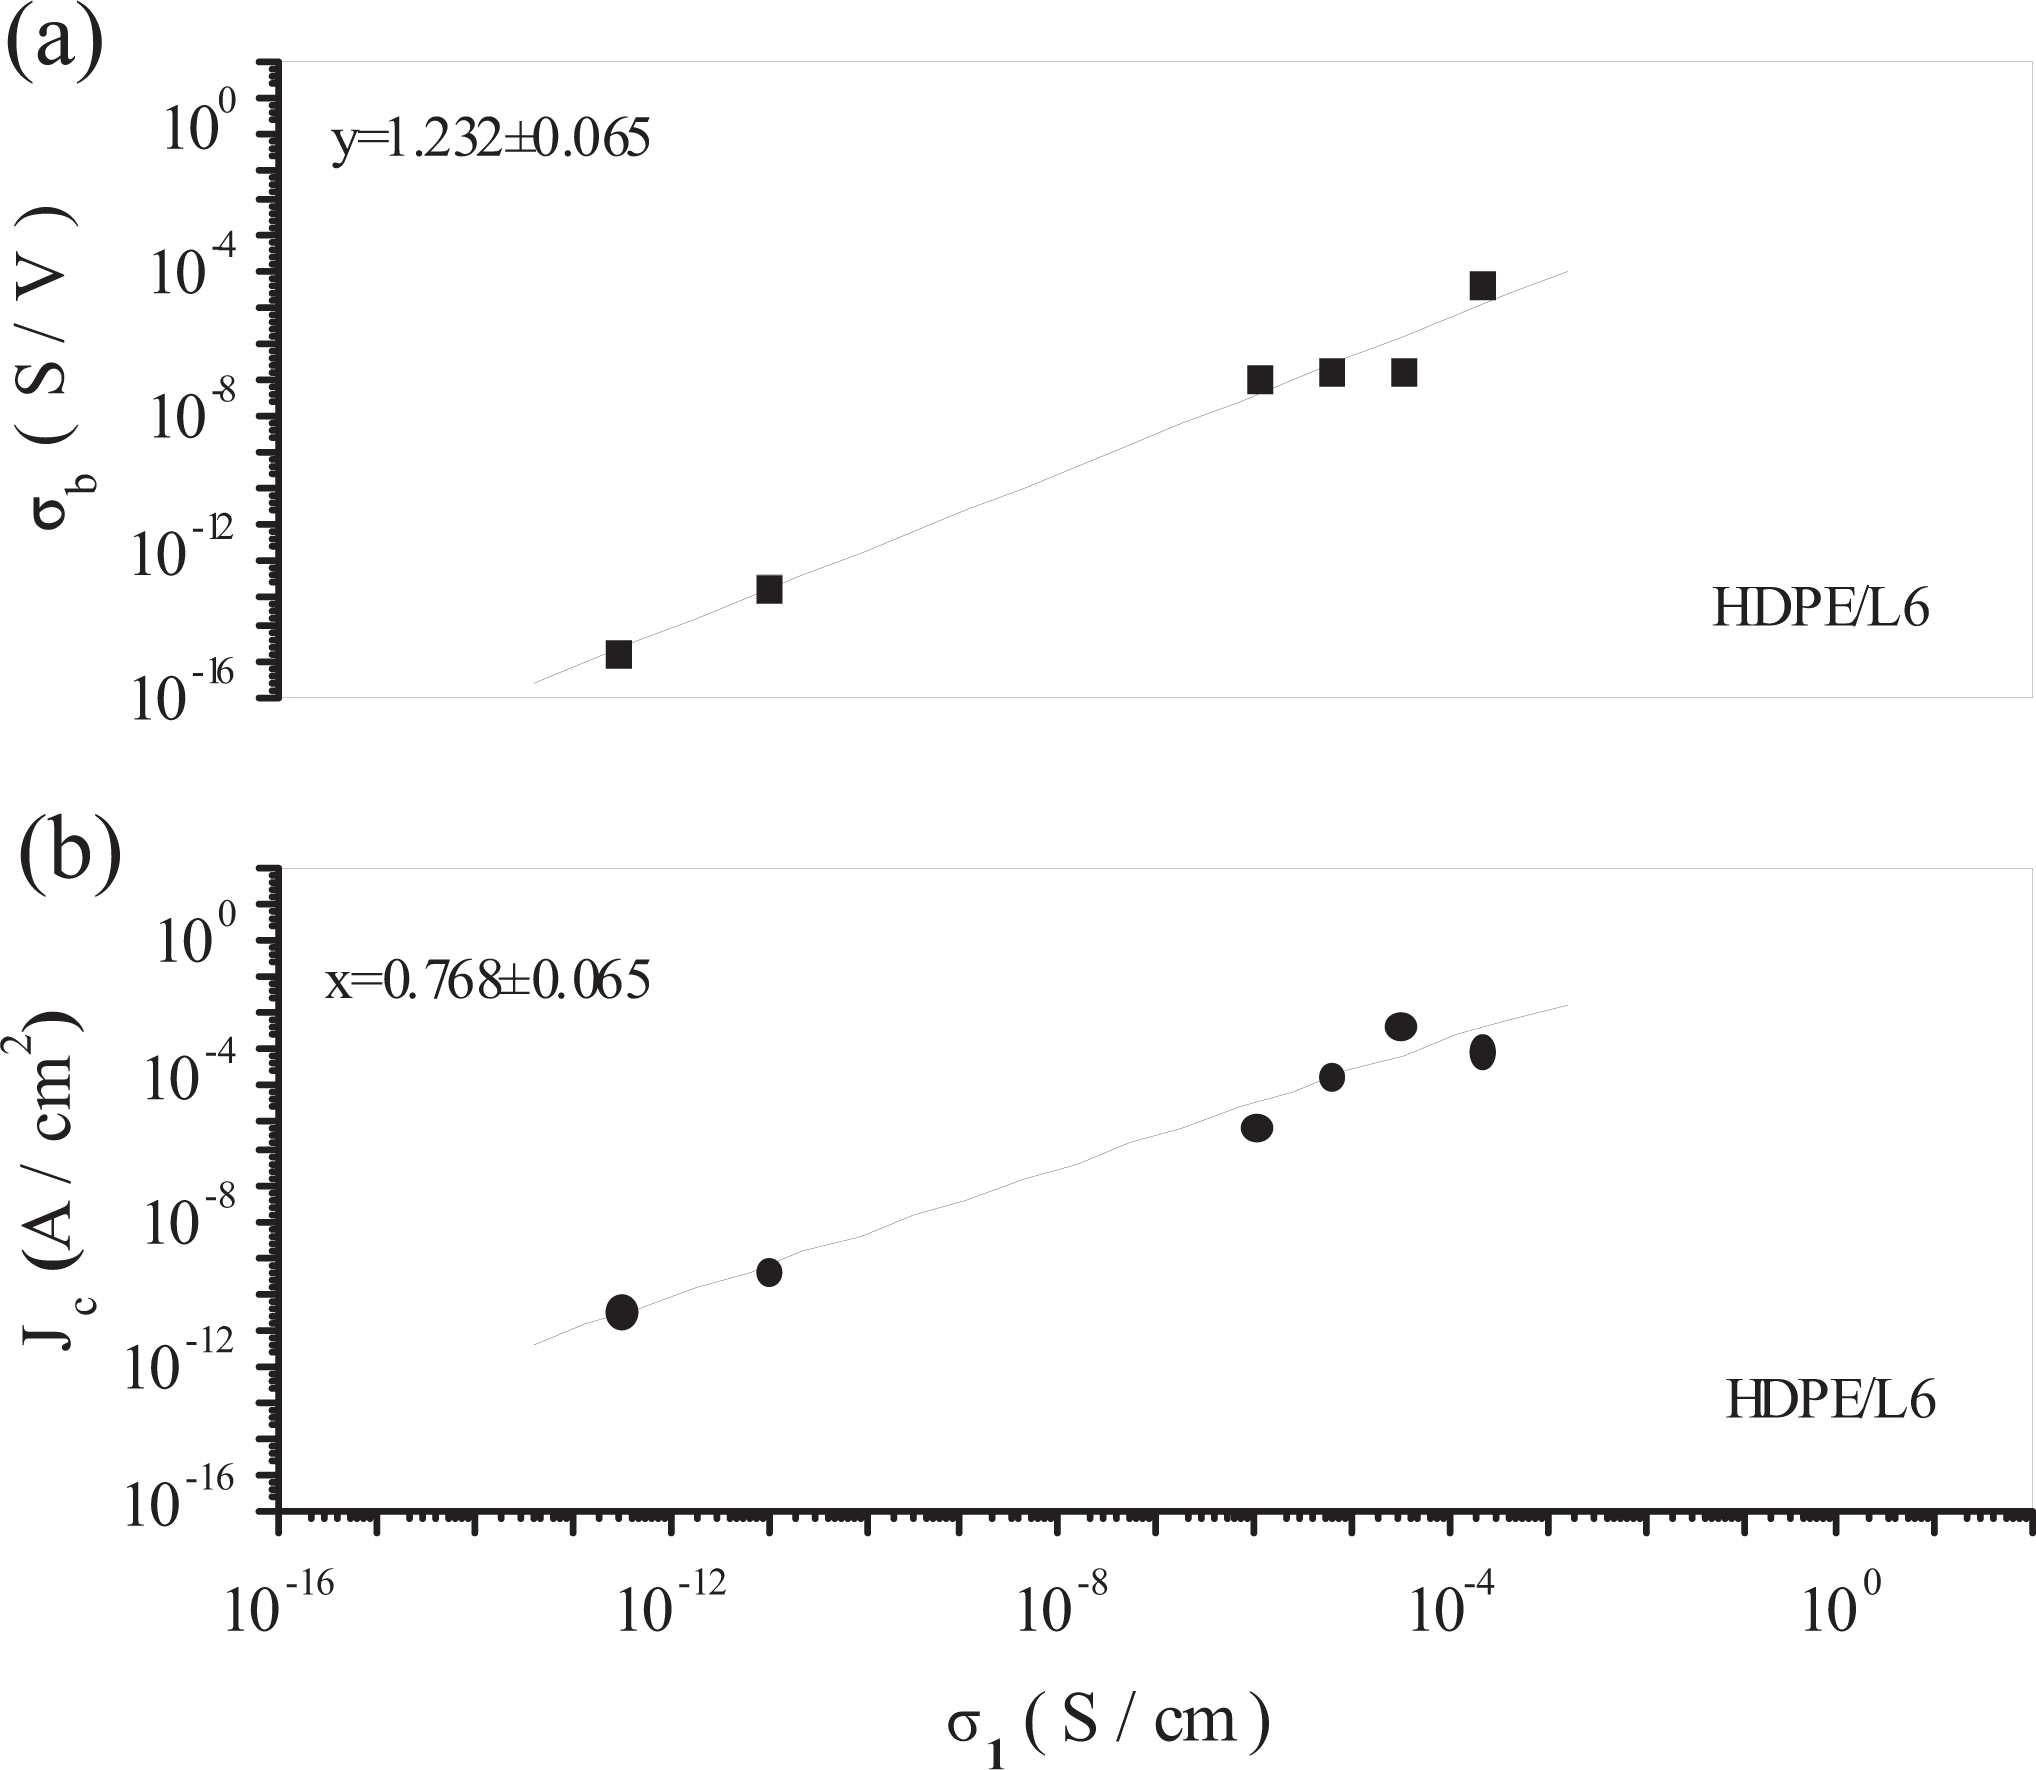
Relationship between Jc, σb, and σ1 of HDPE/L6 composites. HDPE: high-density polyethylene.
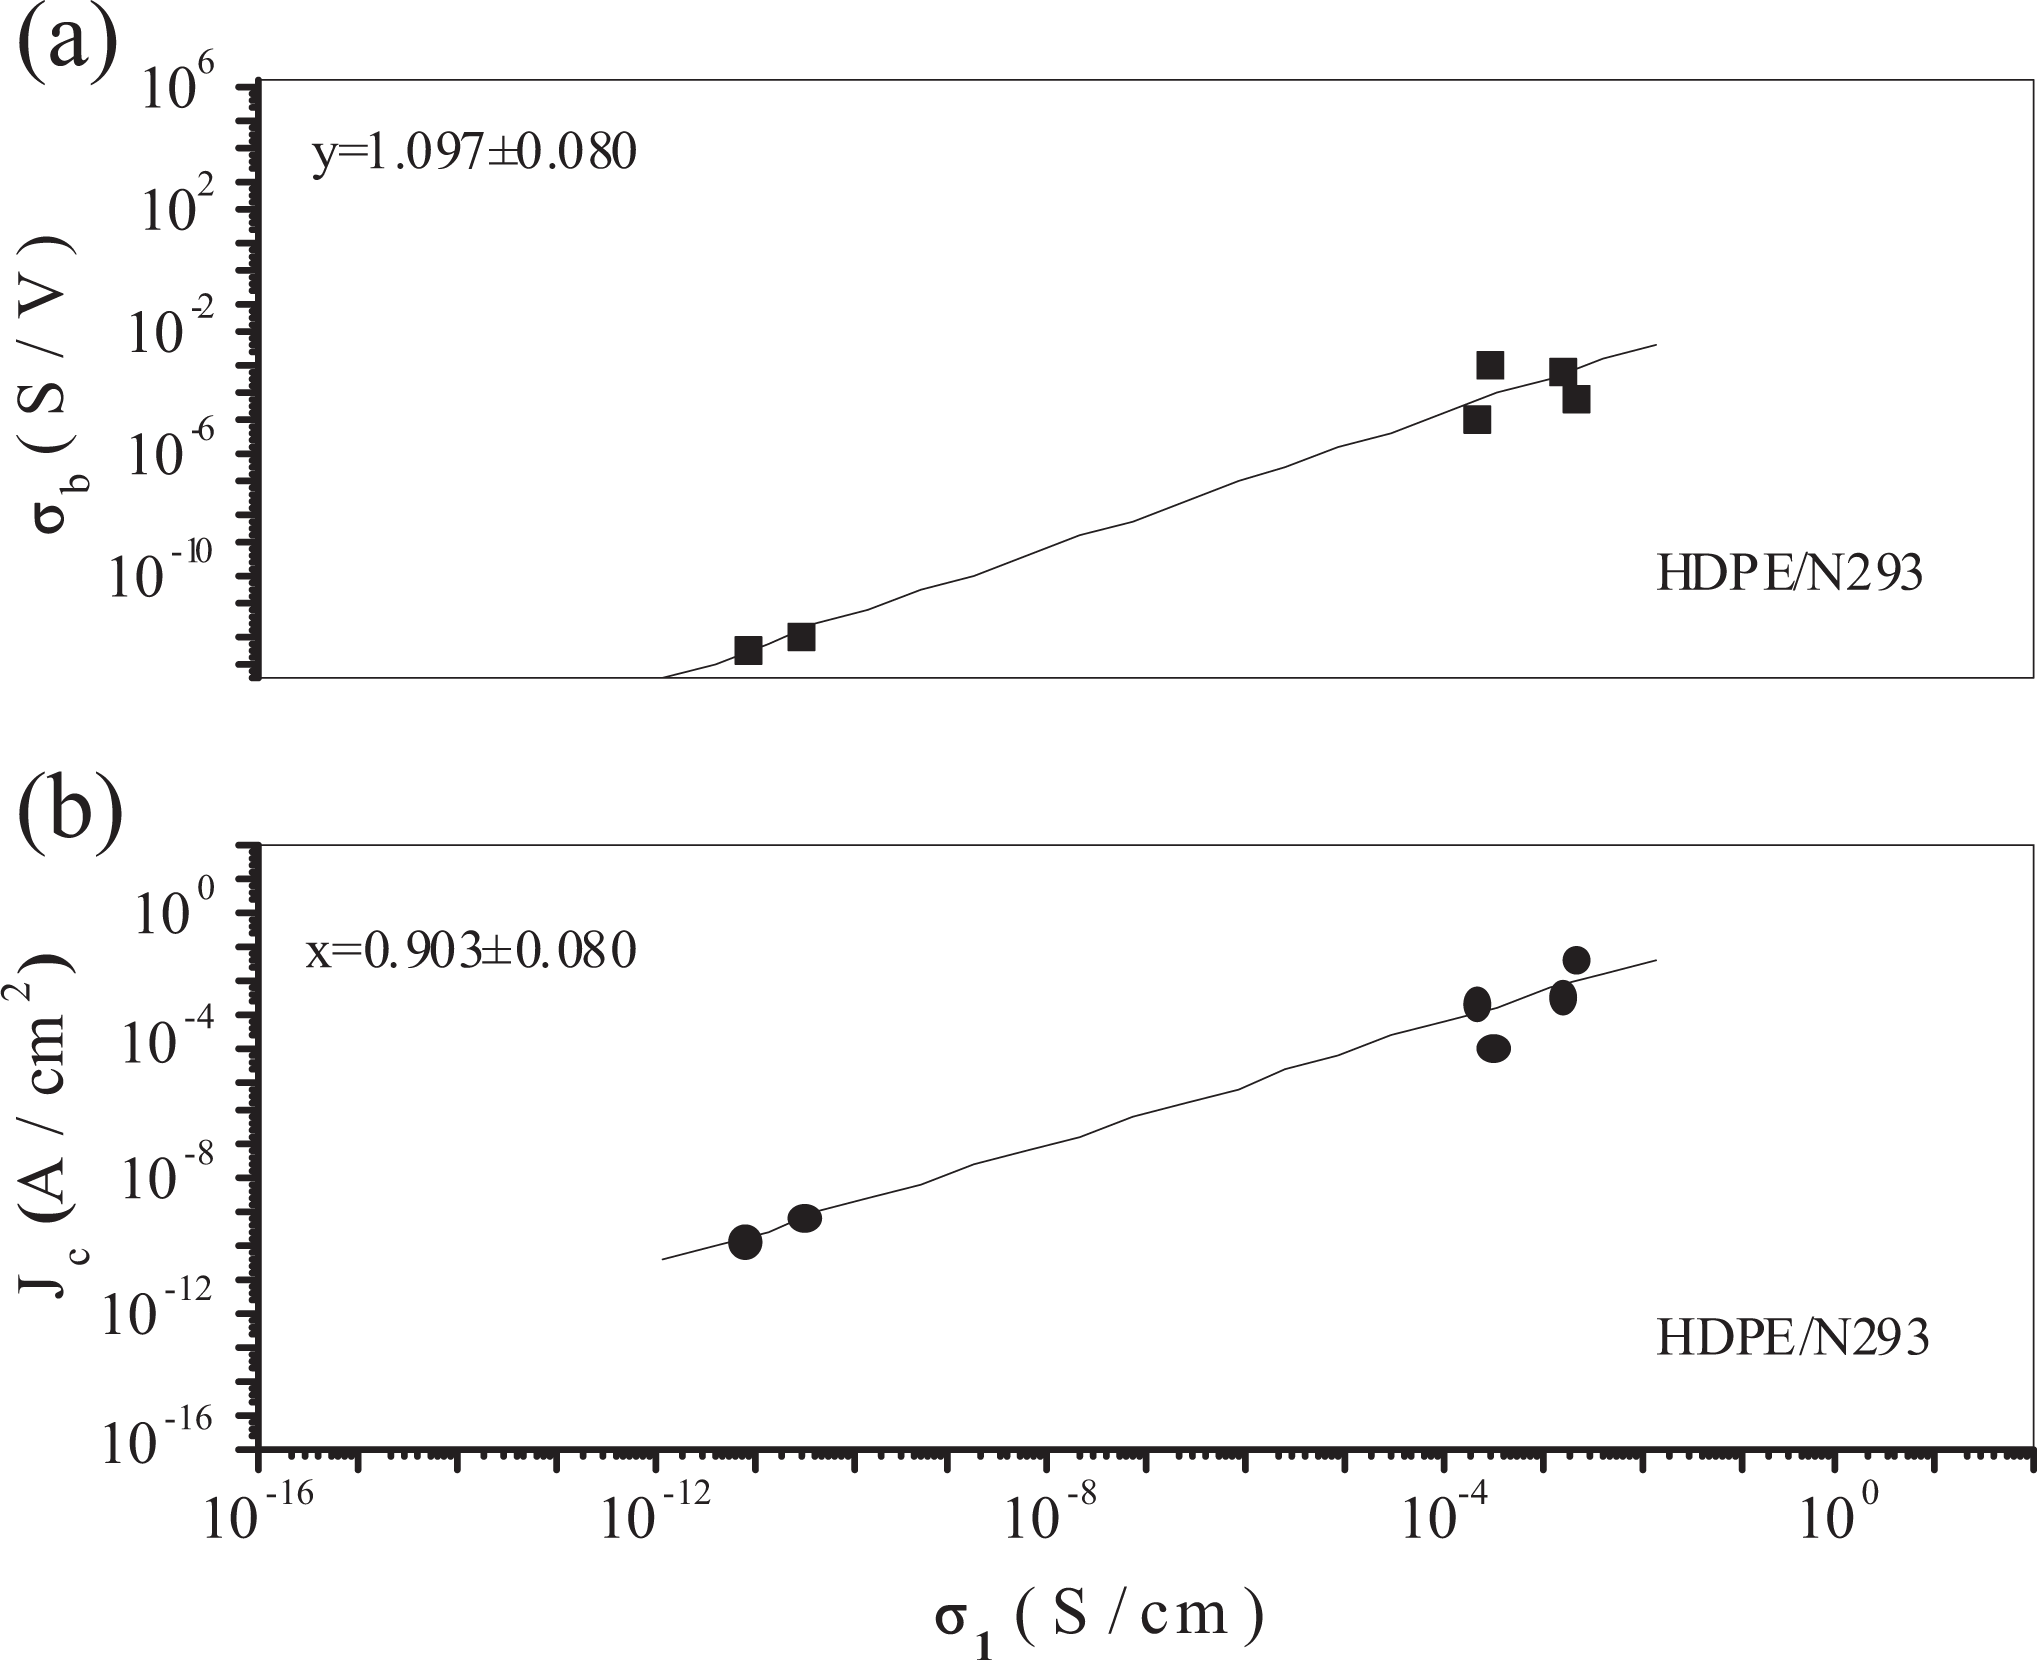
Relationship between Jc, σb, and σ1 of HDPE/N293 composites. HDPE: high-density polyethylene.
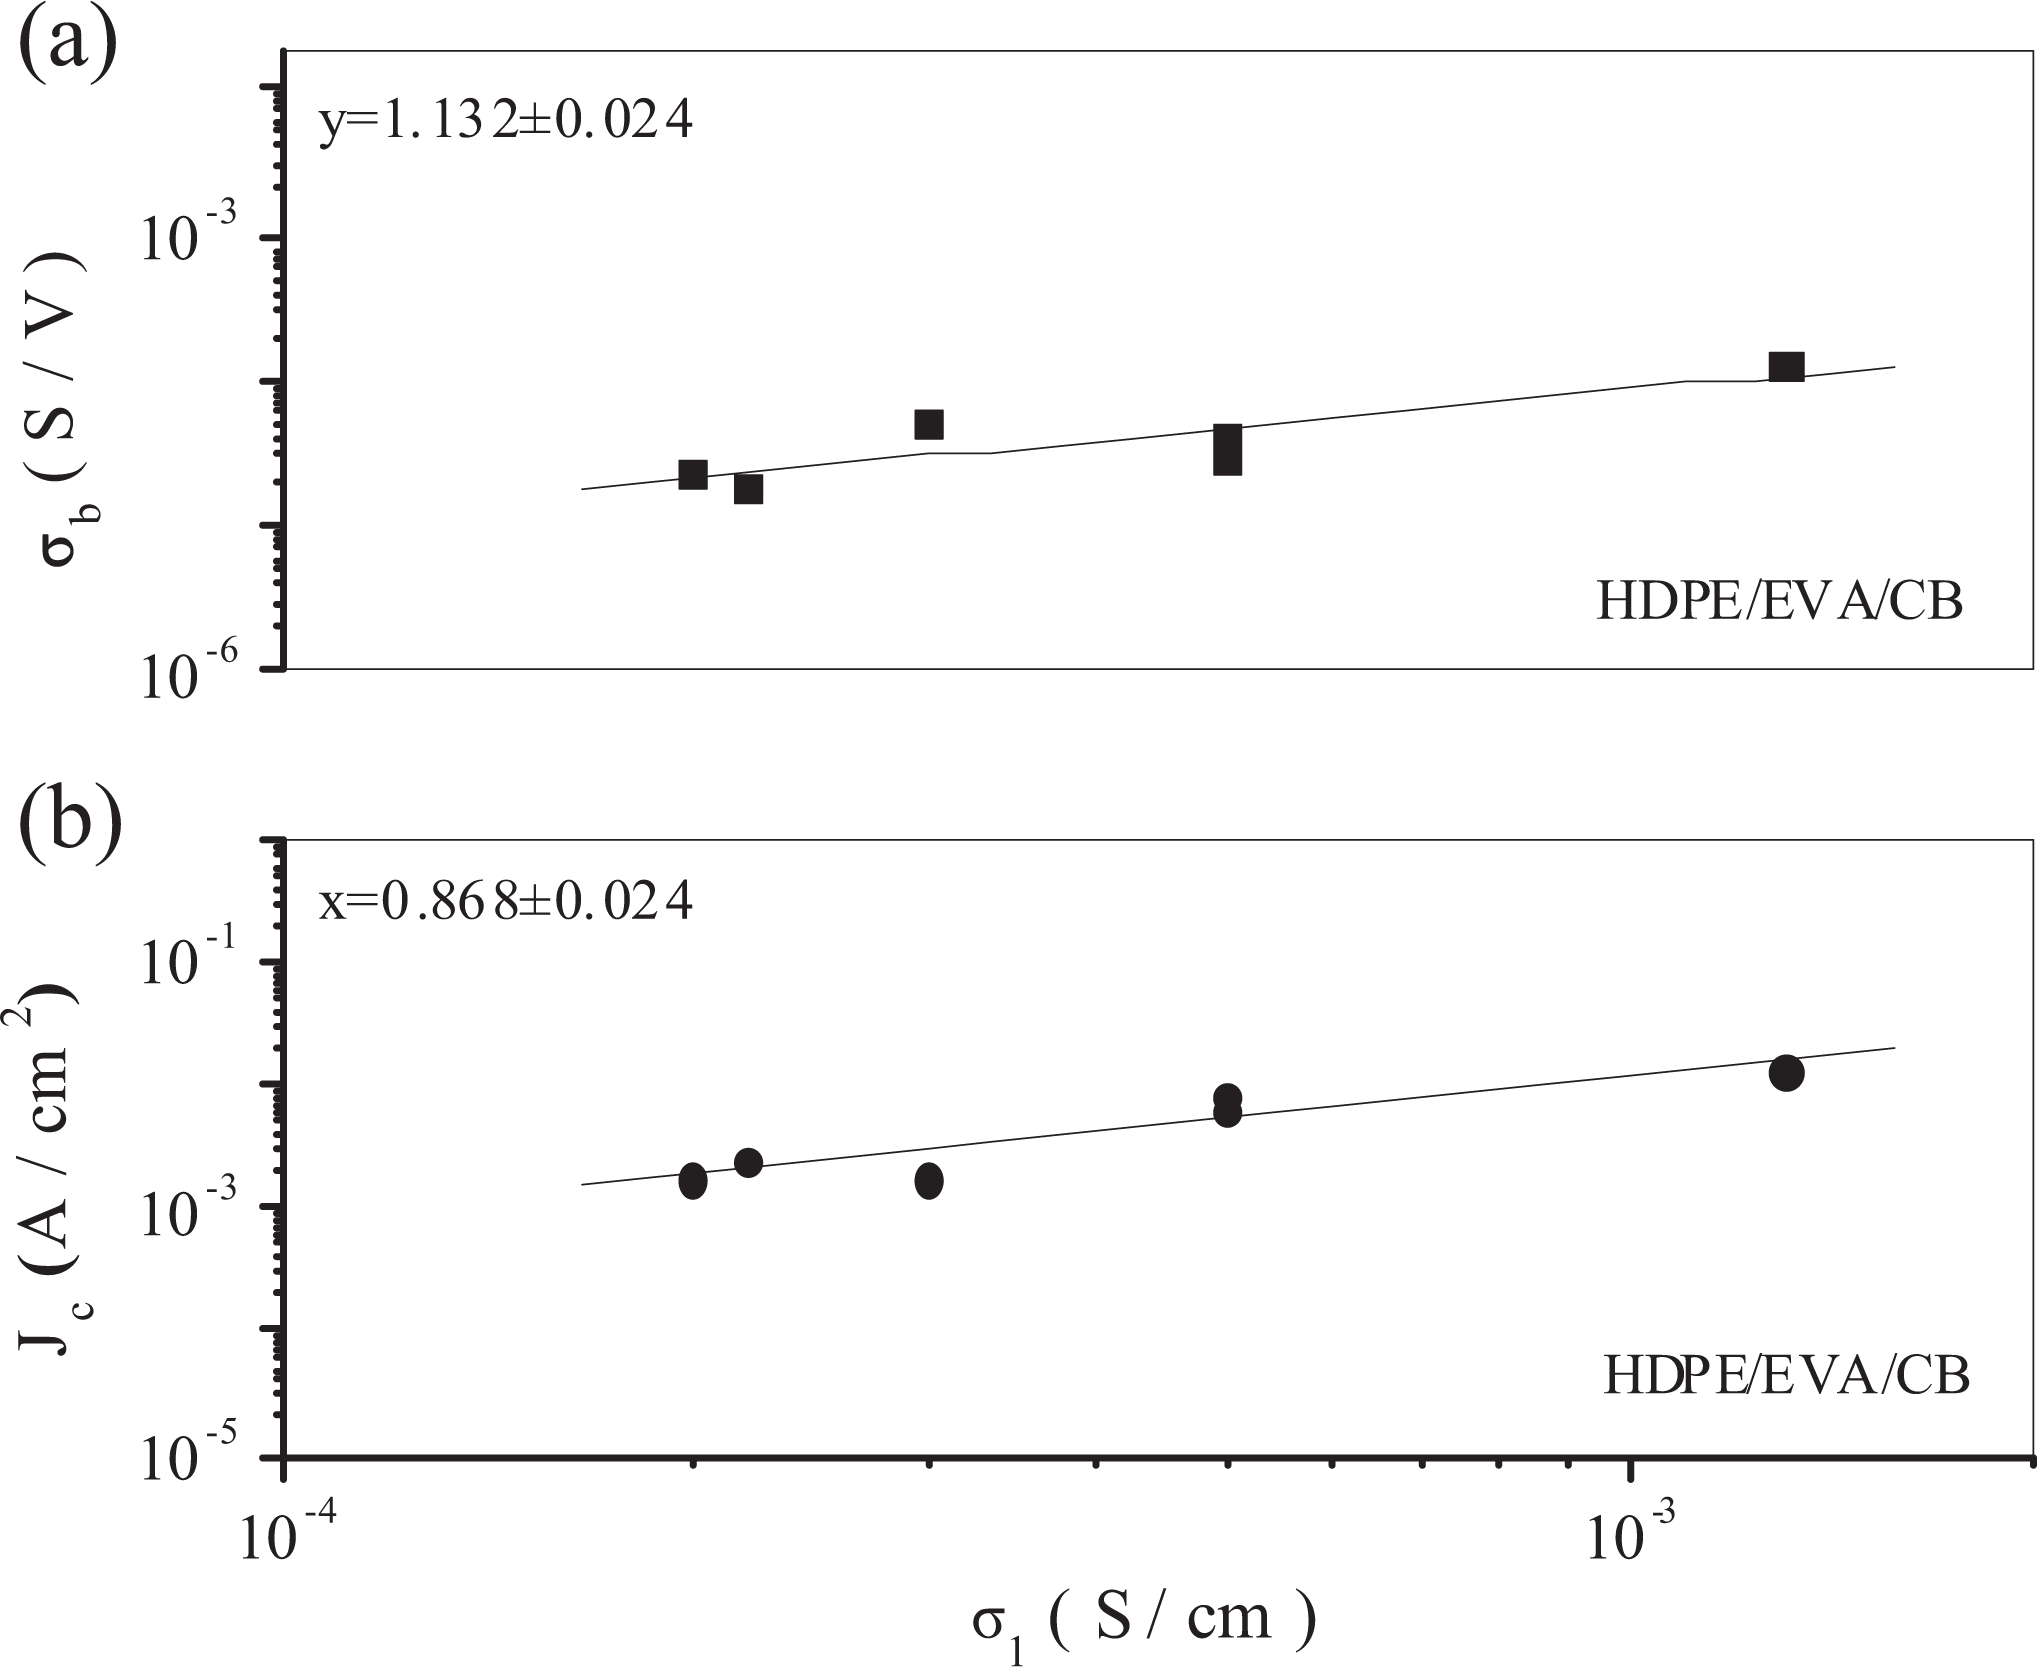
Correlation between Jc, σb, and σ1 of HDPE/EVA/CB composites. HDPE: high-density polyethylene; EVA: ethylene-vinyl acetate copolymer; CB: carbon black.
Similarly, plotting the crossover current density Jc of the HDPE/CF composites with different CF weight fractions against the linear conductivity σ1 and the nonlinear conductivity σb in a bi-logarithmic coordinate system, we found that both the relationship between Jc and σ1 and the relationship between σb and σ1 are approximately linear, as shown in Figures 11 and 12. Figures 11 and 12 demonstrate the correlation between Jc and σ1 as well as the correlation between σb and σ1 of the HDPE/CF composites and the HDPE/CB/CF composites, respectively. It can be seen that the crossover current density and the nonlinear conductivity for the two HDPE composites filled with CF composites are almost a linear function of σ1.
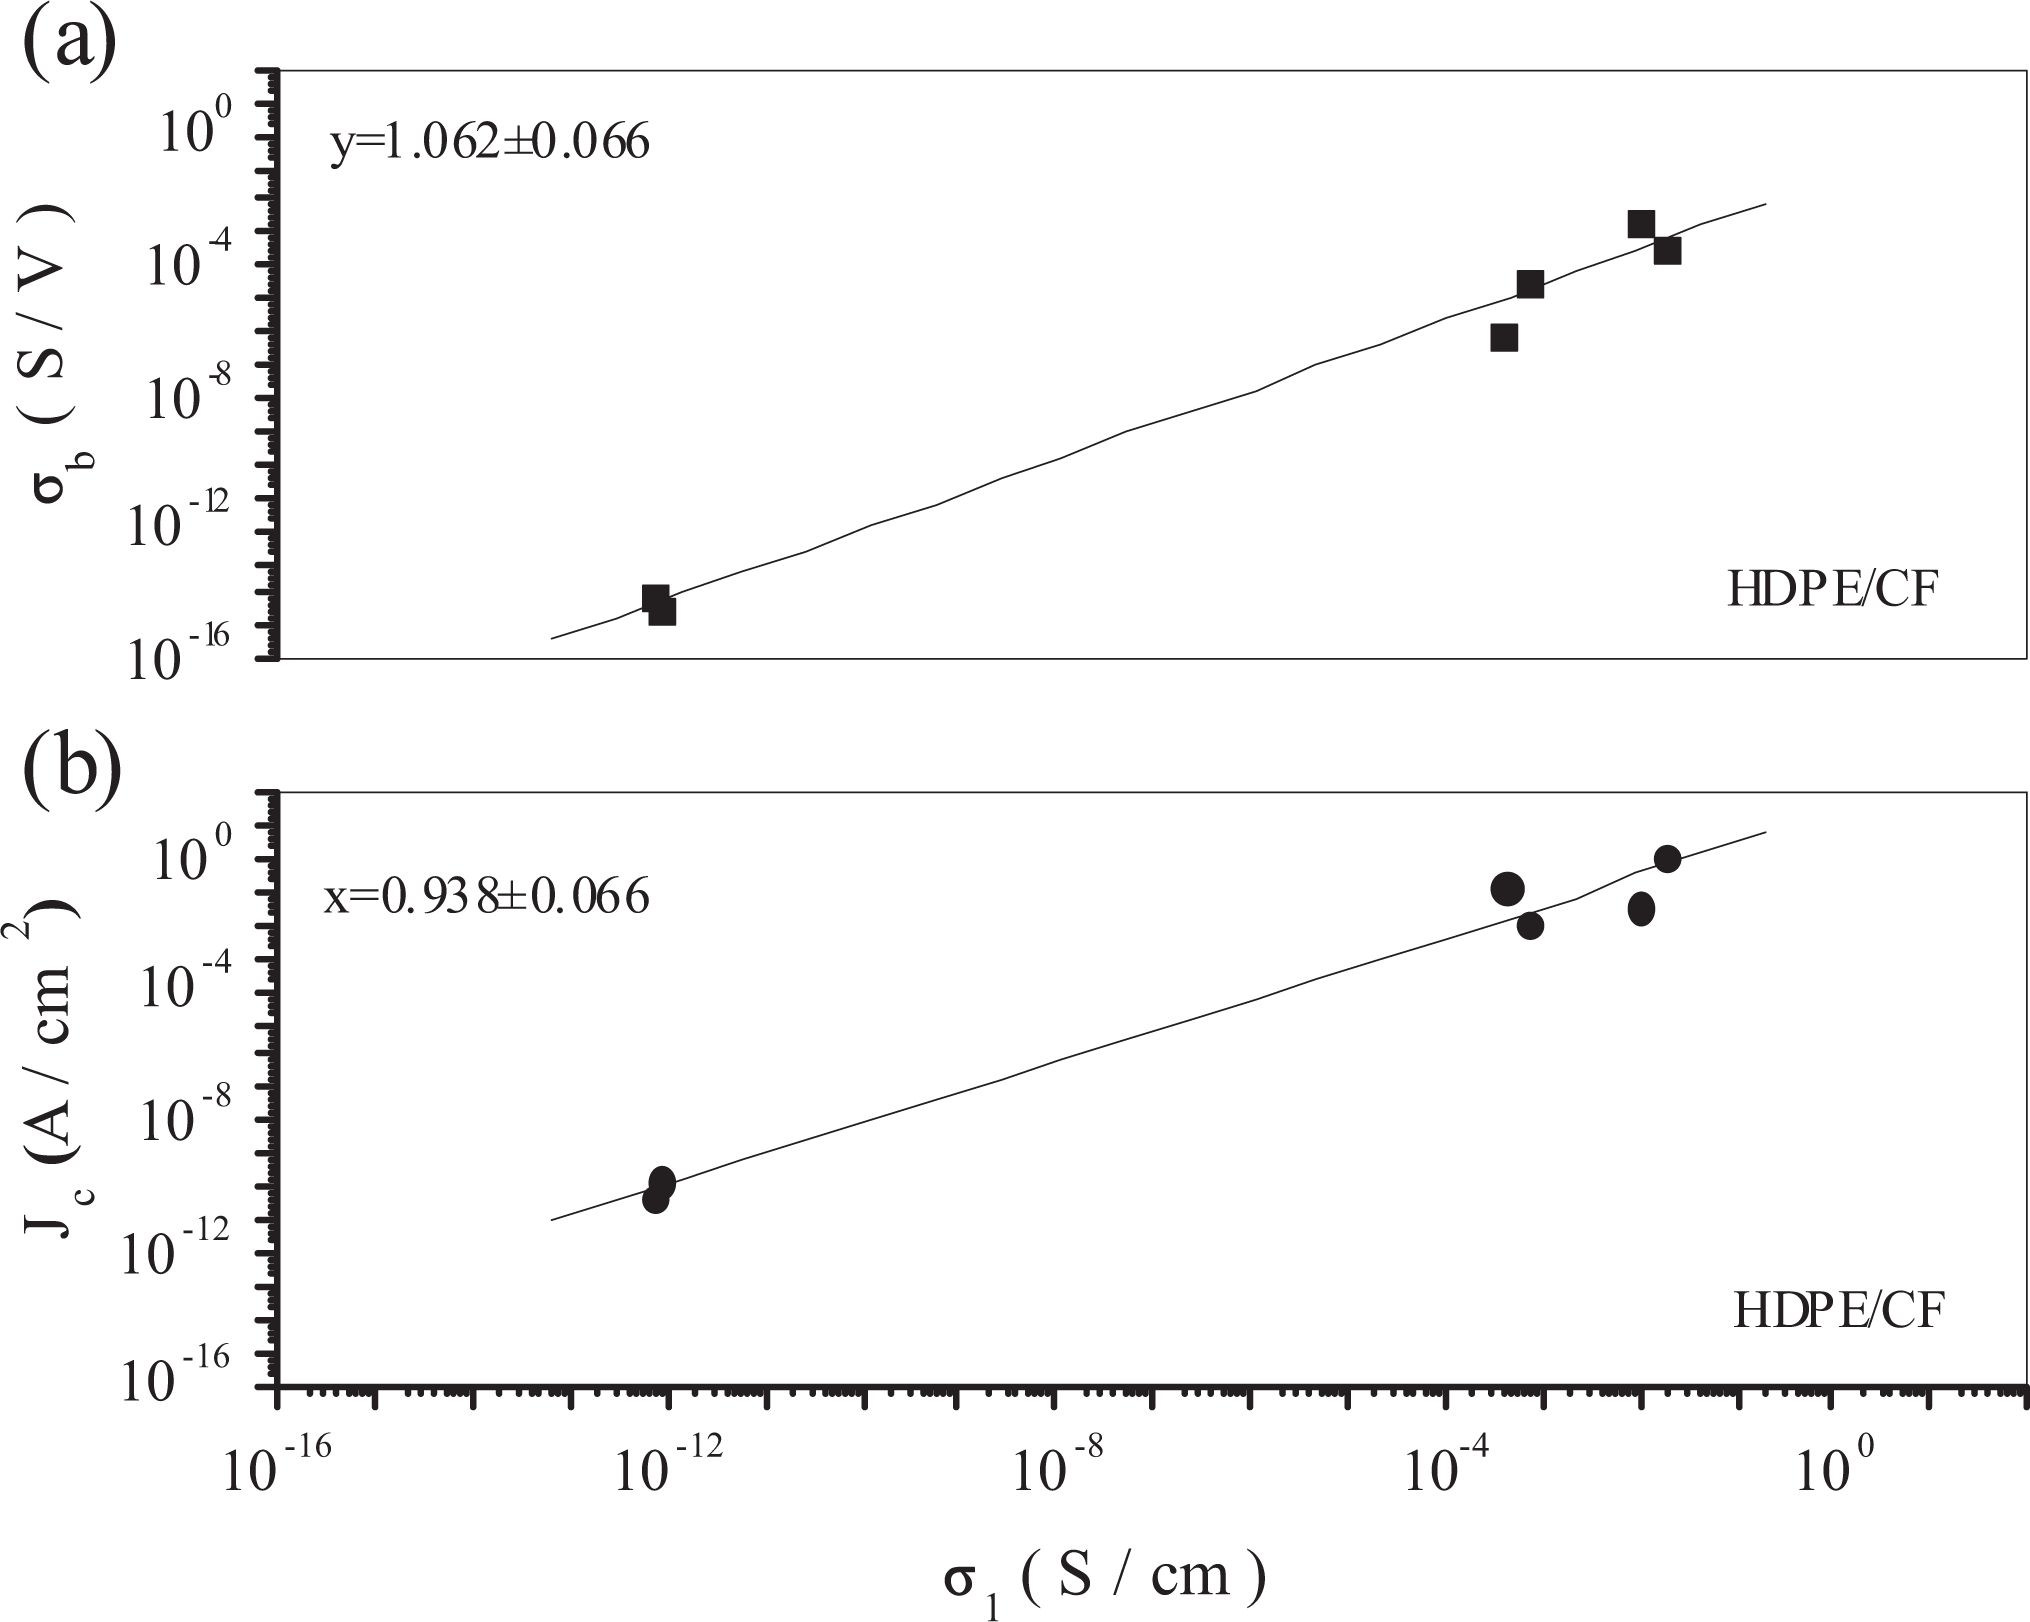
Relationship between Jc, σb, and σ1 of HDPE/CF composites. HDPE: high-density polyethylene; CF: carbon fiber.
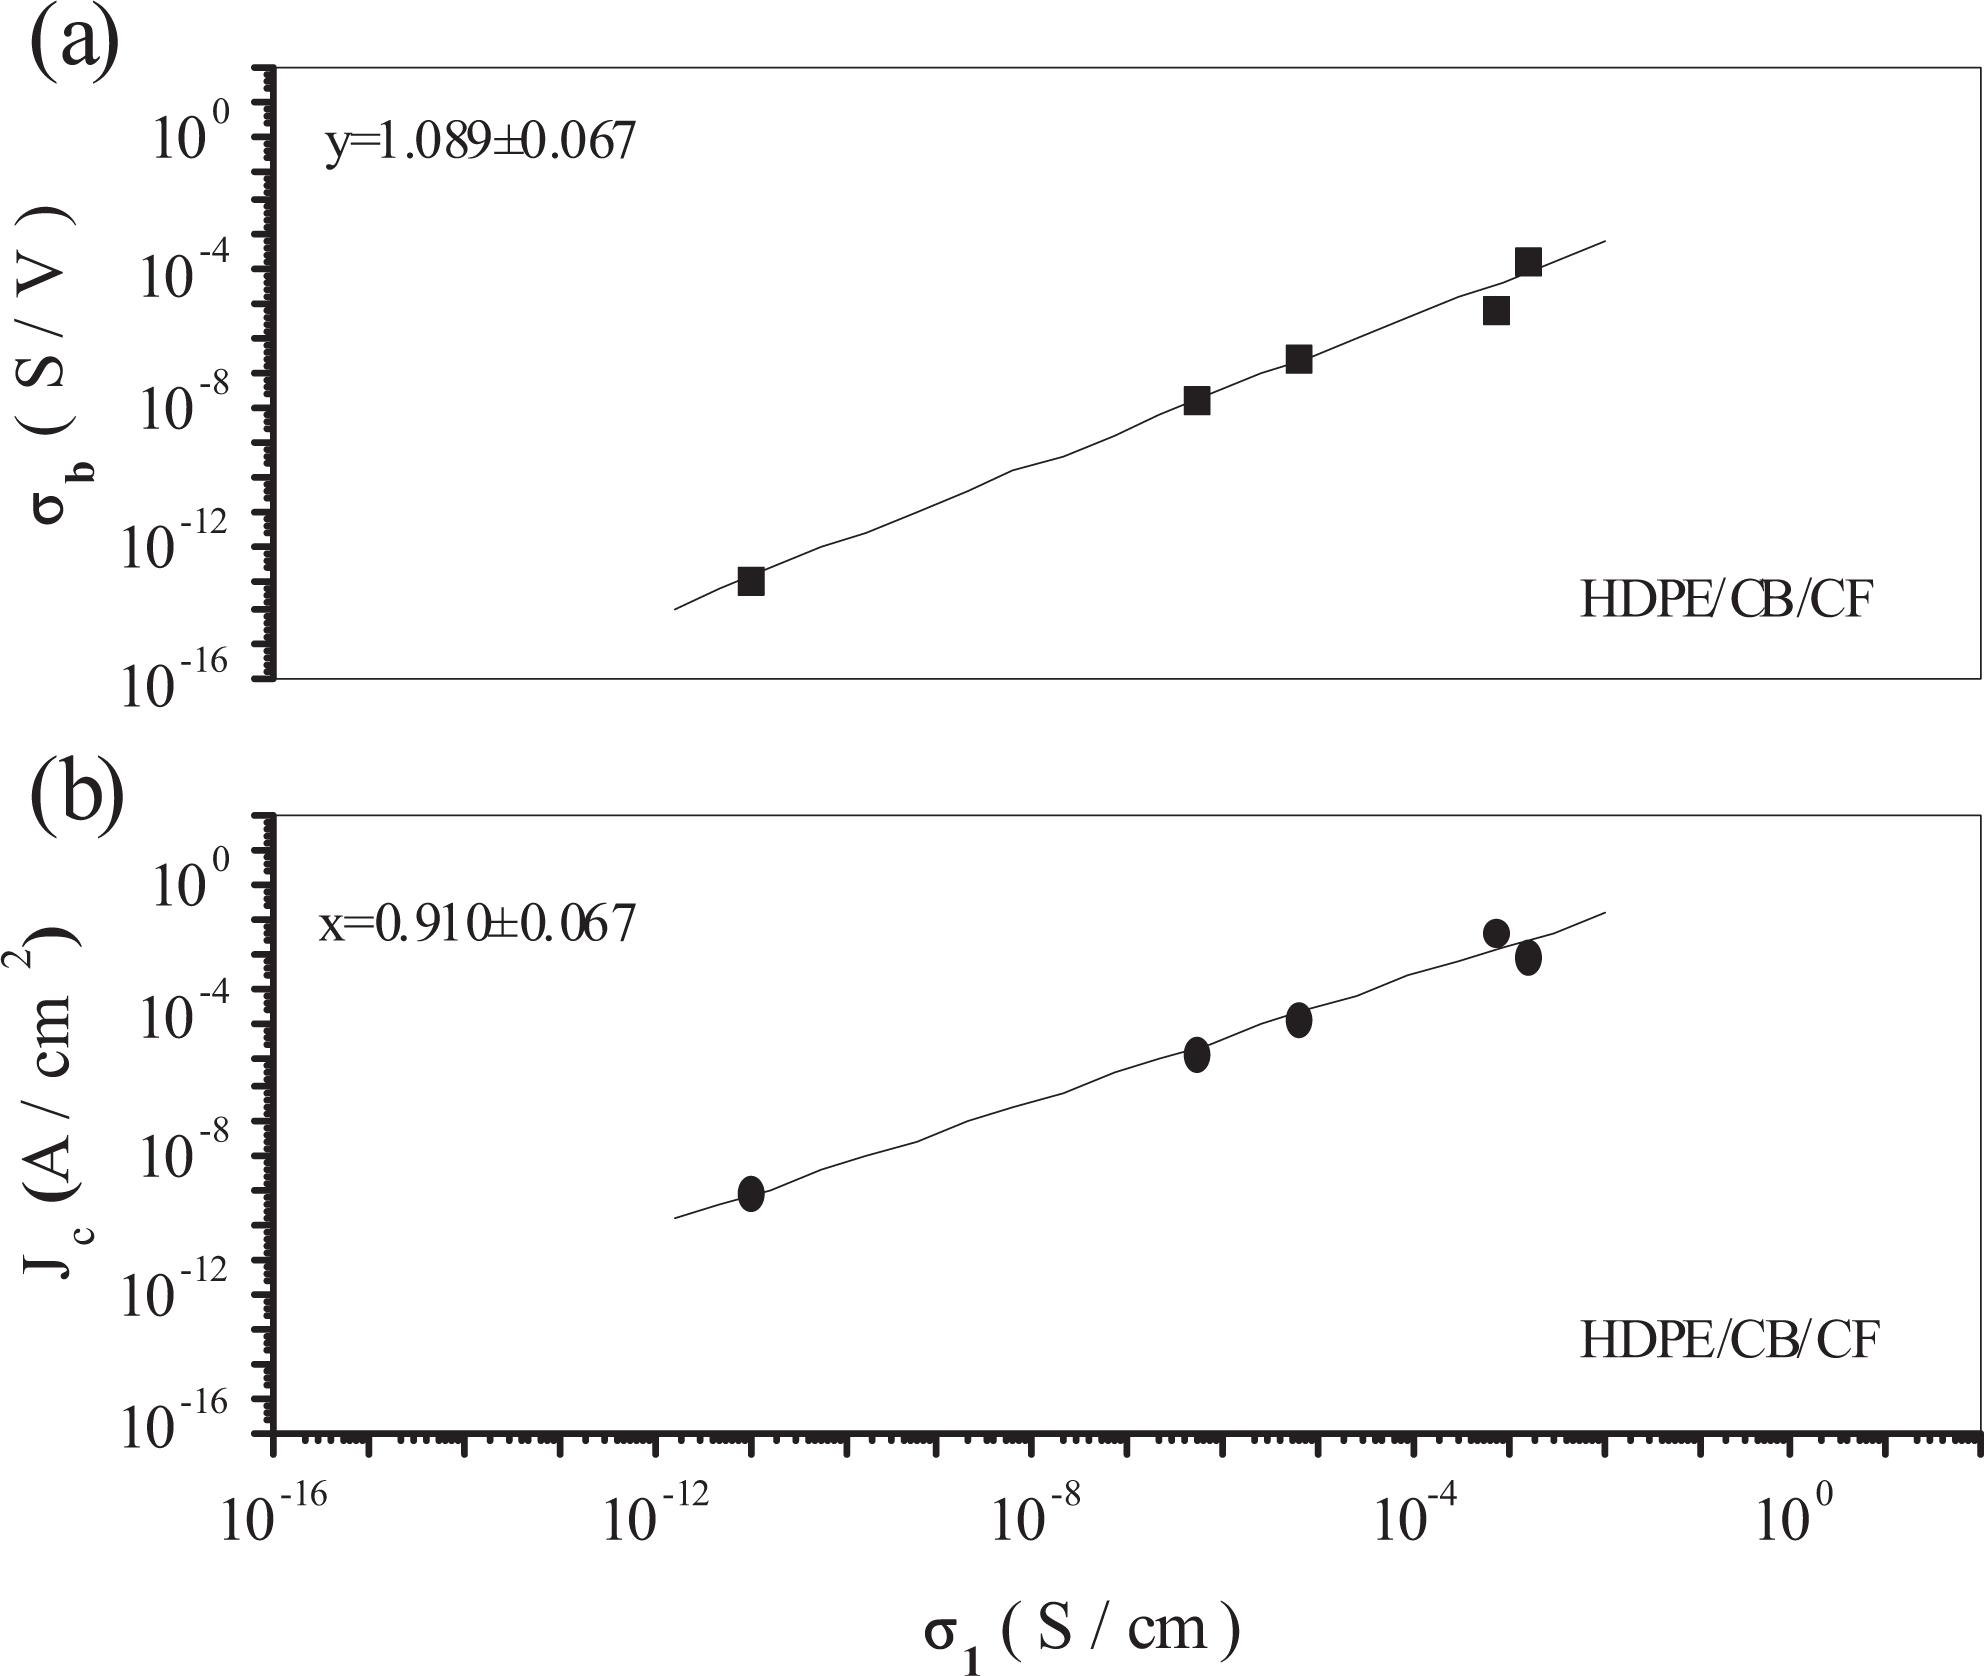
Correlation between Jc, σb, and σ1 of HDPE/CB/CF composites. HDPE: high-density polyethylene; CB: carbon black; CF: carbon fiber.
Discussion
It can be seen in Figures 7 to 12 that the crossover current density and the nonlinear conductivity are approximately a linear function of the linear conductivity in a bi-logarithmic coordinate system; it means that the electrical conductive properties of these HDPE composites have obvious nonlinear behavior under these experimental conditions. These reversible nonlinear electrical conductive properties of these HDPE composite systems related closely to the concentration and the electrical conductive properties of the CB particles and the CFs.
As to material structure, the reversible nonlinear transport of disorder composite systems has two ways: the first is an electrical conductive component itself is nonlinear, it still exhibits nonlinear behavior even the conductive properties are away from the percolation threshold of the composite system, such as the HDPE/CB composites, the HDPE/CF composites, and the HDPE/CB/CF composites (see Figures 1 to 3, 5, and 6); the second is an electrical conductive component itself is linear, the macroscopic conductance of the composite system is linear even when the concentration of the electrical conductive component is lower than the percolation threshold. But because an additional electrical conductive path exists, when the conductive component concentration is close to the percolation threshold, the electrical conductive properties of the composites became nonlinear and can be significantly enhanced, 13 –17 such as the HDPE/EVA/CB composites (see Figure 4). These two forms of nonlinearity can be enhanced in case of near the percolation threshold. For a polymer/conductor composite, there are usually many electrical conductive zones which are isolated by very thin conductive insulation layers in the composite systems of isolation. Therefore, when the new conducting channels are formed due to quantum tunneling or electronic transitions, the electrical current can be increased significantly, and it could be one of the main reasons that the reversible nonlinear conductive behavior is produced for this type of polymer composite material.
Conclusions
The electrical conductive properties of the four HDPE composite systems, including HDPE/CB, HDPE/EVA/CB, HDPE/CF, and HDPE/CB/CF composites, presented obvious reversible nonlinear electrical conductive behavior under these experimental conditions. It was found that the relationship between the current density and the electrical field intensity was linear in a bi-logarithmic coordinate system; both the crossover current density and the nonlinear conductivity were approximately a linear function of the linear conductivity in a bi-logarithmic coordinate system. These reversible nonlinear electrical conductive properties of the four HDPE composites depend, to a great extent, upon the concentration, the size, and the electrical conductive properties of the conductive fillers. The electrical conductivity percolation threshold of the HDPE/CB composites decreased with increasing the BET specific area of the CB. There was a synergic effect in the electrical conductivity percolation threshold owing to the overlap and the bridge behavior between the CB and the CF in the HDPE matrix. These findings should be helpful for the development of the HDPE conductive composites.
Footnotes
Acknowledgment
The author thank Dr Q. Q. Yang from the South China University of Technology for his help in the experiments.
Declaration of Conflicting Interests
The author(s) declared no potential conflicts of interest with respect to the research, authorship, and/or publication of this article.
Funding
The author(s) received no financial support for the research, authorship, and/or publication of this article.