
Abstract
Early stage crystallization kinetics of polypropylene (PP)/clay composites is studied using rheometery. Relaxation modulus of composites is measured at low frequencies near liquid–solid transition. Small amplitude oscillating shear flow is applied at low frequencies to obtain relaxation modulus. Relaxation modulus of polymeric materials at the liquid–solid transition follows
Introduction
Most of polymer processing techniques such as injection molding, fiber spinning and film blowing involve a phase transition from melt to solid. 1 –3 During the solidification, definite ordered structure, which is called “crystal”, is formed. 1 –3 Crystallization causes a significant change in the rheological behavior of polymer melt which affects the processing parameters of polymer melt. 4 –6 A number of investigations have been carried out to study the effect of crystallization on the rheological behavior of polymers. 1 –7 Lambreti et al. 1 proposed an analytical technique which shows the relationship between the complex viscosity and the degree of crystallinity of isotactic polypropylene (iPP). They produced a master curve for viscosity as a function of crystal content in polymer melt. Titomanlio et al. 3 investigated the relationship between viscosity and crystallinity of iPP at two different crystallization temperatures. They coupled differential scanning calorimetery (DSC) results with rheological measurements and eliminated time parameter. It helped to find a relationship describing the change in the viscosity as a function of crystal content.
Review of the literature reveals that the viscosity of polymer melt is highly sensitive to the change in crystal content. 1 –7 Therefore, rheological parameters can be used as direct evidence for investigating the early stage of crystallization. Pogodina and Winter 8 made an improvement to Avrami equation for iPP containing small amount of crystal (below 2%) using rheometry.
Pogodina et al. measured critical gel point, using small amplitude oscillatory shear (SAOS) experiments. Gel point is an indication of inception of nucleation, as the solid network begins to form. 1,8 Relaxation modulus (G(t)), for the transition from liquid- to solid-like behavior that takes place at the critical gel point, is given by 8 :

where λ 0 is the time to crossover to a different regime (at the beginning, details of chemical structure like glass transition and entanglements become important and liquid–solid transition has no immediate effect on the rheology), s is the gel stiffness, n is the relaxation exponent, and t is the time. All linear viscoelastic parameters at the gel point are predicted by equation (2).

The relaxation exponent, having a value between 0 and 1, is obtained from equation (3), where tan δ is frequency independent and is measured at low frequency:

As it was mentioned, any change in crystal content causes an extensive change in rheological parameters of the polymer melt. 1,4,8,9 Frequency sweep test takes a long time which is comparable to polymer gel time. Therefore, performing a frequency sweep test at the crystallization temperature results in inconsistent amount of crystal during the measurement. Thus, the rheological measuring temperature must be suitably chosen to ensure that crystalline content remains unchanged during the test. Acierno and Grizzuti 10 employed a novel technique namely, “inverse quenching.” This technique allows to perform rheometry while the crystal content remains unchanged. They run the test at the temperature where crystallization growth rate approached zero. Using DSC results the temperature where crystallization growth rate is negligible namely “equilibrium temperature” were found. Equilibrium temperature locates at the upper limit of crystallization temperature range where crystallization growth rate is trivial and also it is sufficiently lower than melting temperature to retain crystals from remelting. Coppola et al. 11 employed inverse quenching technique to study the critical gel point of isotactic poly(1-butene) by rheometry. They found that critical gel network of polymers which were crystallized at higher crystallization temperatures were softer and relaxe faster.
Polymer composites attract lots of attention due to their outstanding mechanical, thermal, and electrical properties. 12 –14 Therefore, in the last decade, many investigations have been done on polymer composites. Addition of nanofillers to polymer integrates new properties to neat polymers like enhanced mechanical properties or electrical conductivity. 12 –16 Physical and chemical properties of polymer matrix play a key role in the final properties of the product. Crystallization of semi-crystalline polymers might be favorable to mechanical properties or reveal a deleterious effect on electrical properties. Therefore, for optimizing product properties, it is crucial to be aware of the crystallization kinetic of polymeric composites. However, crystallization data for polymer composites is limited due to the experimental difficulties. Addition of clays to polymer matrix enhances modulus of polymer melt and results in a plateau at low frequencies. This plateau is an indication of network formation in polymer composites. Therefore, clay network at highly concentrated polymer composites overcomes the critical gel influence on storage and loss modulus at low frequencies. Thus, it is difficult to study the early stage of crystallization in polymer composites by rheometry.
Mizra et al. 17 studied the crystallization kinetics of PP/clay composites using DSC, but the technique is not precise for examination of the nucleation stage. They reported that the Avrami equation cannot predict the crystallization behavior of PP/clay. Clay particles act as a nucleating agent for crystallization of PP. 18,19 Therefore, neglecting the nucleating role of clay causes a large deviation of Avrami equation from empirical data. So, it is essential to study the early stage of crystallization using a proper technique.
Masamichi et al. 20 used small X-ray scattering for direct observation of the crystal nucleation in polyethylene, induced by nucleating agent. They used a nucleating agent to increase the nuclei number and compared scattering intensity of samples with and without nucleating agent. They claimed that the mechanism of the crystallization induction in polymers is a nucleation and growth rather than phase separation process. However, Masamichi et al. did not specify what portion of formed crystals are due to nucleating agents. It is essential to evaluate the nucleating effect of clays in order to modify Avrami equation for polymer composites.
In this study, we measured gel point parameters of iPP samples which are slightly filled with clay (Cloisite 20A) to study the nucleating effect of clay in polymer melt. We employed rheometry to monitor the change in rheological parameters of polymer composite as crystallization process proceeded. One major feature of rheological measurements is the high sensitivity of rehological parameters to microstructural changes. This allows to study the early stage of network formation. 8,11 Clay loading was chosen sufficiently low to make sure that no network is formed due to clay particles interconnection.
Experimental
Commercial grade of iPP was supplied from Aark Petrochemical Co. (Islamic Republic of Iran, V30 S with melt flow index rate of 16 g/10 min). Clay (Cloisite 20A) was purchased from Southern Clay Products (Gonzales, Texas, USA). Composites of iPP/clay containing 0.05, 0.1, 0.3, and 0.6 wt% of clay content were prepared using batch mixer. All samples were melt mixed at T = 190°C with rotor speed of 80 r min−1 for 15 min.
Rheological measurements were performed using a strain/stress-controlled rheometer, USD 200 PaarPhysica. Disk-like samples with 25 mm diameter and 1 mm thickness were placed between the parallel plates. Applied strain was set 1% to avoid shear-induced crystallization. Frequency sweeps from 0.05 to 300 Hz were performed to measure loss and storage modulus.
All samples went through the same thermal cycle except different crystallization times that they experienced before rheometry. First, samples were annealed at T = 240°C in order to melt all crystals. Then, they were cooled down to the crystallization temperatures (T = 138 and 141°C, cooling rate was 12°C min−1). After crystallizing for different time periods, samples were heated up to the temperature that crystallization growth rate was negligible (T eq = 157°C). Rheological measurements were carried out isothermally at the equilibrium temperature (T eq = 157°C) to be sure that crystal content remains constant during the measurements. Scanning electron microscopy (SEM) images were taken at 25 kV to investigative clay dispersion in polymer. Polymer composites samples for SEM were prepared by freeze and fracture method in liquid nitrogen.
Results and discussion
SEM image of iPP filled with 0.6 wt% of clay is shown in Figure 1. As shown, clay particles are well distributed and partially intercalated inside polymer matrix. Better dispersion of clay enhances the interface between clay and polymer molecules. Therefore, better dispersion of clay enhances the nucleating effect of nanoparticles. 21 However, clusters of clay still can be seen in Figure 1. It is hard to achieve a good dispersion without clay surface coating/functionalization or adding compatibilizer. 16,22,23 Another method for better intercalation of clays is using ultrasonic mixer in solution mixing process. However, solution mixing method is not favorable for a large-scale production due to high cost, impurity, and environmental pollution. Therefore, in the present study, clay was mixed with the polymer using an internal batch mixer.
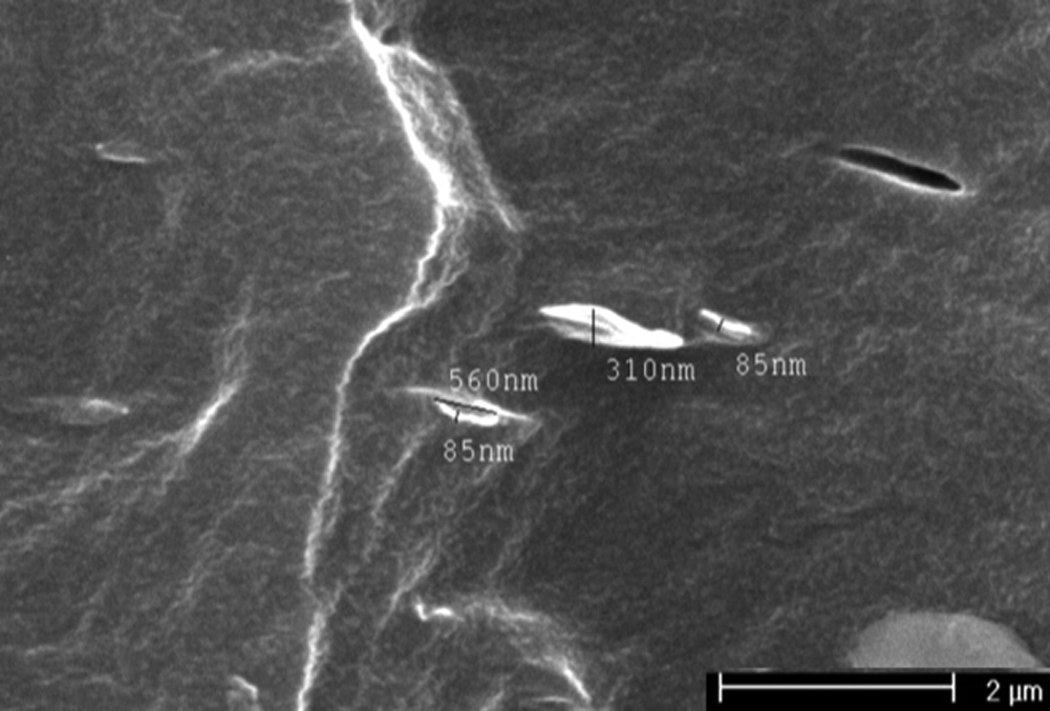
SEM image of iPP/clay 0.6 wt%. SEM: scanning electron microscopy; iPP: isotactic polypropylene.
Rheological measurements were carried out on samples at a temperature higher than crystallization temperature which is called equilibrium temperature (T eq) where crystal growth rate is negligible. 10 Equilibrium temperature is high enough to minimize crystallization growth rate while is far enough below melting point to avoid crystals remelting. Equilibrium temperature was estimated as T eq = 157°C using linear growth rate equation for G values close to zero. Equation for iPP relaxation modulus is given as 24 :

Equation (4) is resulted from the DSC data for iPP samples filled with different contents of clay. Equilibrium temperature for composites expected to be higher than the unfilled polymer. Nucleating agents induce crystallization in polymers, thereby shift crystallization temperature to higher temperatures. Crystallized samples were heated up to the equilibrium temperature, and rheological measurements were carried out. Viscosity and modulus of polymer melt are very sensitive to crystal content. 1 –4,11 Thus, rheometry is a proper technique to study nucleation stage of polymer crystallization. 1,8,11 Measuring gel time in polymer compounds with different filler loading is an indication of nucleation. Figure 2 shows storage modulus and damping factor for iPP samples filled with 0.05 wt% of clay at different crystallization times. Figure 2(a) shows an increase in storage modulus as the crystallization time increases. Increase in storage modulus at low frequencies is a sign of a network formation. As crystallization proceeds, the crystal content increases. Damping factor (tan δ) as a function of frequency at different crystallization times indicates a transition from liquid-like behavior to solid-like behavior while crystallization proceeds. For a certain crystallization time, tan δ versus frequency gives a plateau at low frequencies, which is associated with the gel time. 8 According to equation (3), gel time is the time taken for the network formation to begin, and tan δ is frequency independent when measured at low frequencies. To find the gel time, polymeric samples are crystallized for a specific period of time and damping factor is obtained as a function of frequency.
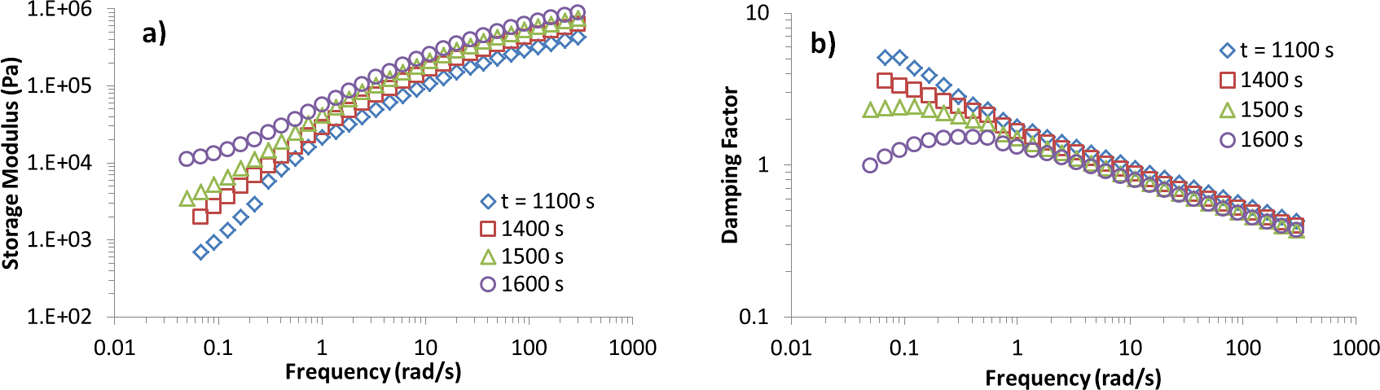
(a) Storage modulus and (b) damping factor as a function of frequency at different crystallization times for iPP/clay 0.05 wt%. iPP: isotactic polypropylene.
Gel times for composite samples loaded with different amount of clay are presented in Figure 3. As clay concentration increases, gel time decreases, which is a result of more nuclei formation in polymer matrix. Higher amount of clay increases interfacial area in polymer matrix; and consequently, number of available sites for nucleation increases and more nuclei are formed. Hence, amplified crystallization rate at higher filler loading resulted in lower gel time. Moreover, higher filler loading integrated more solid phase to the gel network. As clay concentrations increased to 0.6 wt%, gel network formation at low crystallization temperature (T C = 138°C) was too fast to be measured. Therefore, crystallization was carried out at higher temperature (T C = 141°C), where nucleation rate and thus gel formation is significantly slower. However, as Figure 3 shows, for iPP/clay 0.6 wt%, gel time increased because of the decrease in the extent of undercooling (or increase in crystallization temperature). Figure 3 also shows that increase in crystallization temperature decreases nucleation rate and growth rate of nuclei.
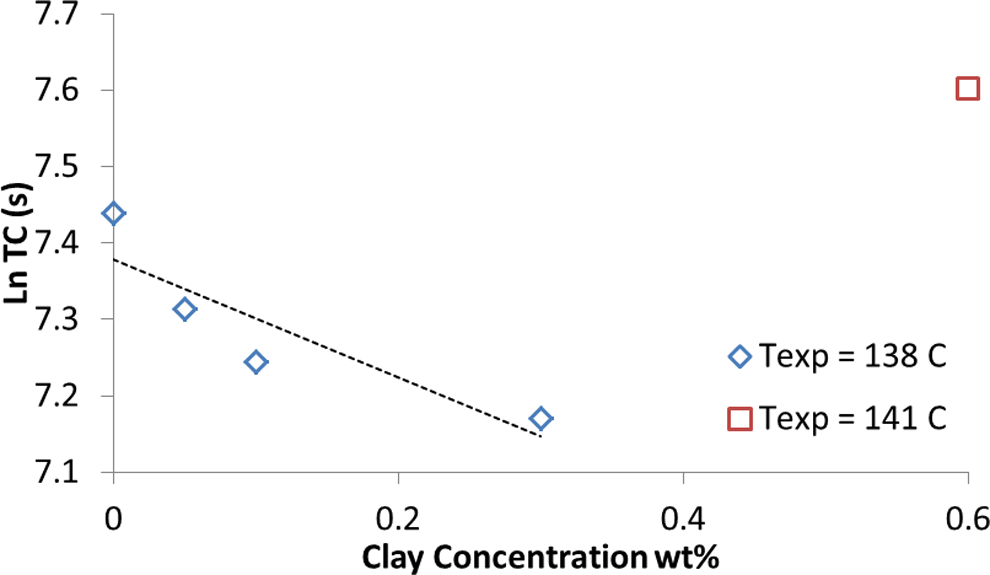
Gel time for different clay concentration.
After locating gel point for iPP/clay samples, rheological parameters at gel point were used to calculate critical gel parameters. Critical gel point parameters (n and s) were calculated using equations (2) and (3) and are presented in Figure 4. As graphs show, the relaxation exponent increases for higher clay concentrations, while the gel stiffness decreases, exponentially. 8,11 Increase in relaxation exponent and decrease in gel stiffness associated with decrease in gel time. More filler loading increased the number and decreased the size of nuclei. In other words, gel parameters indicated that the critical gel becomes softer and relaxes faster under load. 8,11 Gel parameters for iPP/clay 0.6 wt% show an increase in the relaxation exponent and gel stiffness. Higher crystallization temperature and clay concentration show the same effect on gel stiffness. At low undercooling (ΔT = T ref−T C), critical gel becomes softer and more fragile, which is reflected in the increase in n value (Figure 4(a)) with the simultaneous decrease in s value (Figure 4(b)).
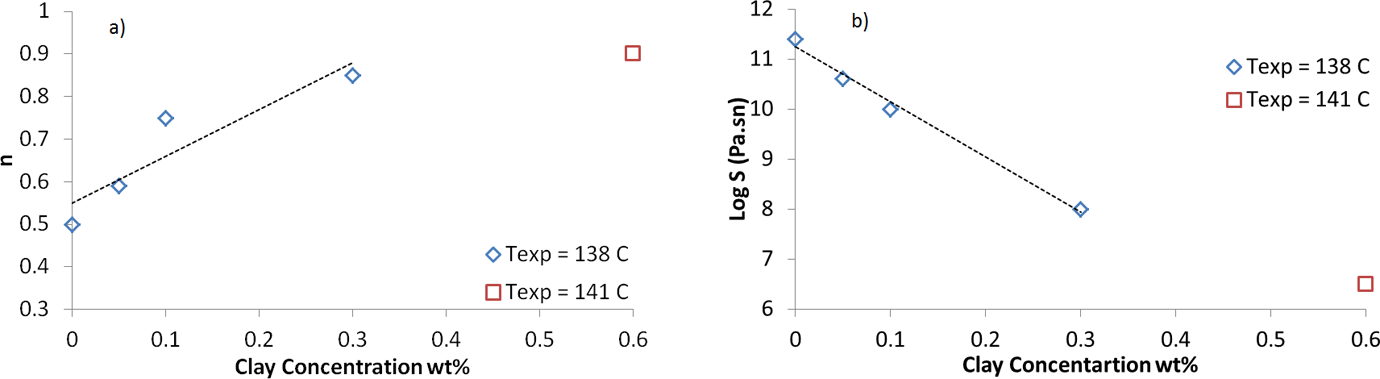
Critical gel point parameters: (a) relaxation exponent and (b) gel stiffness.
Gel time corresponds to polymer crystallization time and, therefore, it can be used to modify Avrami crystallization model for iPP/clay composites. Avrami equation could be written in the following form:
where n is Avrami parameter, t is the crystallization time, x t is the relative crystallinity, and t A is the Avrami time. The relative crystallinity for Avrami time is 0.63 for iPP.

where k is constant. Avrami draws a direct relationship between relative crystallinity and the degree of undercooloing. Pogodina and Winter 8 proposed an equation for Avrami time as a function of undercooling. They used Kim’s 24 experimental data to evaluate their model.
In this work, Avrami time is modified to improve Pogodina and Winter’s model by including clay concentration. Avrami time is modified for iPP/clay composites using gel time results. Equation (7) is an improvement to the Avrami time proposed by Pogodina and winter. 8 The logarithm of the critical gel time versus the degree of undercooling and clay concentration in Figure 3 may be approximated by a simple exponential decay: 25

where a, b, and b′ are constants and are estimated at 0.074, 0.1, and 0.118 K−1, respectively. Equation constants, a and b, were calculated from Rodriguez DSC data for iPP/clay 4 wt% 26 and b′ from Kim’s DSC data. 22 Experimental and predicted crystallinity for iPP/clay 4 wt% and iPP/clay8 wt% (crystallized at T C = 125°C) are presented in Figure 5. Experimental data were taken from Misra et al.’s work. 17 Avrami equation modified using rheological parameters of iPP/clay samples that were slightly crystallized (X C < 2%). Avrami time constants were obtained by curve fitting on DSC experimental data for neat iPP crystallized at different temperatures 24 and iPP samples filled with 2 and 6 wt% of clay. 26 The modified Avrami model is examined to predict experimental crystallinity values of Misra et al.’s work. 17 Results in Figure 5 indicate that the proposed equation is capable of predicting crystallization behavior of PP clay composites up to 90% relative crystallinity.
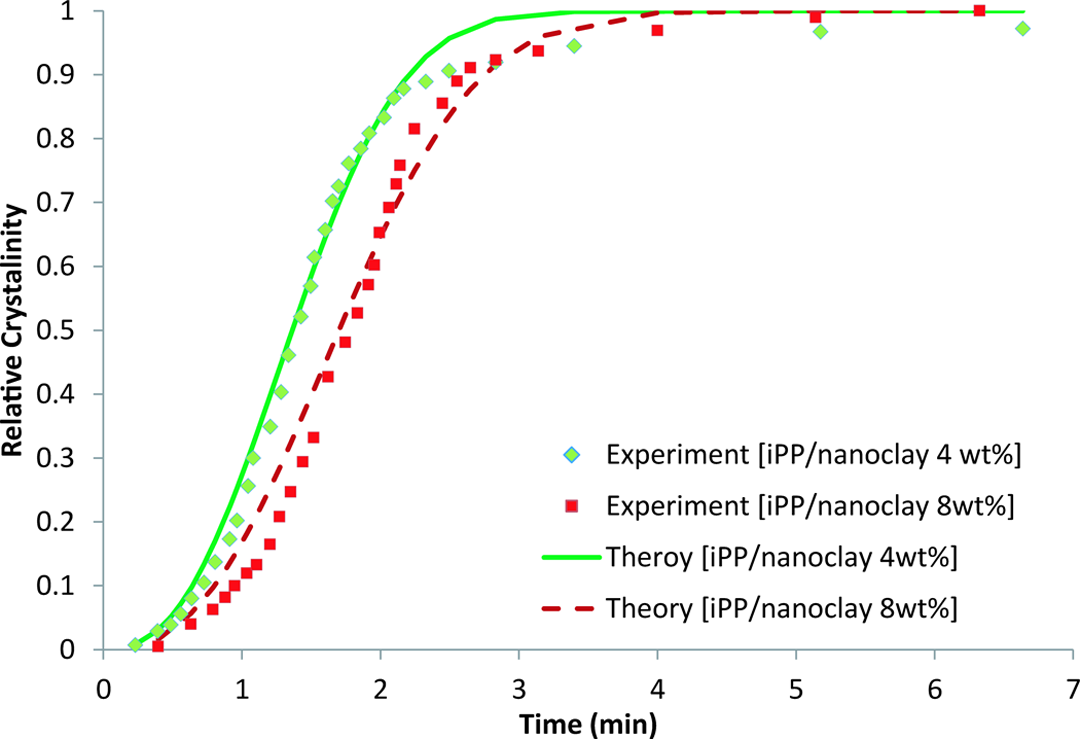
Relative crystallinity for iPP/clay 4 wt% and iPP/clay 8 wt%. iPP: isotactic polypropylene.
Complex viscosity of iPP/clay with different clay loading at different crystallization times are presented in Figure 6. Viscosity increases by crystallization time due to the growth of solid crystalline phase. Viscosity, however; decreases by increase of filler loading, which can be attributed to the “ball bearing effect” phenomenon. 27 Due to ball bearing effect, in polymer composites filled with small amount of clay, viscosity decreases, as clay concentration increases. While in concentrated samples, viscosity increases, as filler loading increases. Polymer chains that slip on the clay surfaces dominate the effect of clay particles on enhancement of viscosity, leading to a decrease in polymer viscosity. There is also possible plasticizing effect by clay sheets, which reduces viscosity of polymer melt. 28,29
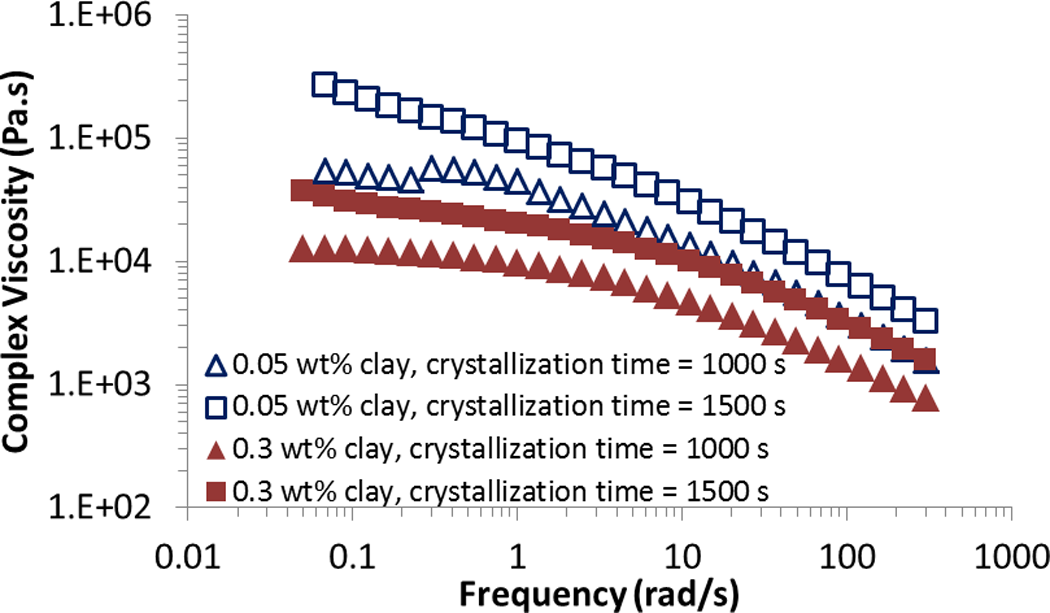
Complex viscosity as a function of clay concentration at different crystallization times.
Conclusions
The liquid–solid phase transition (physical gelation process) of iPP is directly related to the early stage of crystallization or, in other words, nucleation. Nucleation in iPP in the presence of clay is investigated using rheometry. Decrease in the gel time was observed at higher clay concentration and low crystallization temperature. Avrami equation is modified to include both effects of clay concentration and undercooling. Evolution of critical gel parameters indicated that the gel became softer and relaxes faster under applied forces at higher clay concentrations. There is a good agreement between predicted crystallinity by modified Avrami equation and the experimental results for filled polymer composites.
Footnotes
Acknowledgments
The authors would like to acknowledge Dr Nazockdast, Amir Saadat, and Tannaz Ebrahimi in Department of Polymer Engineering for their help with rheometry.
Declaration of Conflicting Interests
The author(s) declared no potential conflicts of interest with respect to the research, authorship, and/or publication of this article.
Funding
The author(s) received no financial support for the research, authorship, and/or publication of this article.