
Abstract
In the current work, the influence of filler particle size on the performance of the composites was studied. Some physical parameters were measured for linear low-density polyethylene (LLDPE) films reinforced with silicon dioxide (SiO2) powder. Samples filled with SiO2 of different particle sizes and concentrations were prepared. It was found that fillers with small size caused an increase in mechanical properties of LLDPE at lower concentration than that of particles with bigger size. This was confirmed experimentally by measuring different physical parameters such as yield strength, coefficient of thermal expansion, thermal conductivity, melting temperature, and structural morphology. Therefore, filler sizes ranged from nano to micro could help in reducing the amount of the usage of filler, which could overcome the recycling problems of the filled polymers without affecting the end-use properties of the composite. Illustrations are given using figures, images, and tables.
Introduction
Addition of rigid particles to polymers could result in a number of desirable effects; for example, an increase in mechanical stiffness, a reduction in coefficient of thermal expansion (CTE), and improvement in creep resistance and fracture toughness. Young's modulus for filled polymers (i.e. composites) results from interaction between the properties of the composite constituents, such as matrix, reinforcement (fillers), and the interfacial region. Mechanical properties of particulate composites are dependent on a number of parameters, such as size, shape, aspect ratio, and dispersion of the reinforcing particles. 1 –9
Fu et al. 10 investigated the effect of particle size, particle/matrix adhesion and particle loading on stiffness, strength, and toughness. Range of filler sizes, from micro to nano, was used and their aspect ratio was fixed at unity. They found that the composite strength and toughness are strongly affected by all three factors, especially particle/matrix adhesion. This was expected because strength depends on effective stress transfer between filler and matrix. They also suggested that stiff particles affect the strength of composites in two ways: weakening effect due to the stress concentration and the reinforcing effect since they could act as barriers to crack growth. In some cases, the weakening effect is predominant and thus the composite strength is lower than the matrix alone; and in other cases, the reinforcing effect is more significant and the composites will have strength higher than the matrix.
Cho et al. 11 studied the effect of particle size on elastic modulus, tensile strength, and particle/matrix debonding for vinyl ester resin using two types of particles such as glass beads and spherical alumina (Al2O3). The mean size of glass beads was 500, 200, 70, and 6 μm in diameter. The mean size of Al2O3 particles was 70, 20, and 3 μm and 50 nm and 15 nm in diameter. The tensile strength of the composites enhanced with decreasing particle size. They also found that all composites failed by debonding at particle/matrix interface.
In this study, silicon dioxide (SiO2) powder with different sizes (33, 58, 92, 145, and 199 μm) was used as reinforcement for linear low-density polyethylene (LLDPE). The influence of filler particle size and the weight fraction on mechanical, thermal, and structural properties of LLDPE/SiO2 composites were investigated.
Experimental
Materials
The polymer used in this study was LLDPE (LLD3505U; Egyptian European Company (EEC), Cairo, Egypt). Melting temperature of LLDPE is in the range of 110–125°C. Its ignition temperature and relative density were 350°C and 0.915–0.940 g cm−3, respectively. Five sizes of SiO2 were used as filler (Merck KGaA Co., Darmstadt, Germany, molar mass = 60.08 g mol−1 and ignition temperature 900°C). The average diameter of SiO2 particles was 33, 58, 92, 145, and 199 μm (denoted as S33, S58, S92, S145, and S199, respectively).
Particulate composite preparation
Samples preparation was divided into two stages.
Composite constitutes blending
In this stage, the LLDPE powder was mixed with SiO2 of different particle sizes and with different concentrations for each size. SiO2 with weight fractions of 2, 4, 6, 8, and 10 wt% was added to 5 g of LLDPE using methylene chloride as the dispersing medium. The mixture was then agitated for 30 min using a magnetic stirrer to ensure better distribution of the filler and also to prevent the aggregation of filler particles. Afterward, the mixture was casted in Petri dish and left for 6 h to dry at 60°C in an electrical oven.
Film formation
The purpose of this stage was to convert the above mixture (LLDPE/SiO2) into a film with a certain thickness (approximately 0.5 mm). The blend composition was placed between two very smooth iron plates coated with hard chrome. The plates are inserted into compressor hot press and the temperature was adjusted at 125°C using a temperature controller. After melting for approximately 15 min, it was pressed to 0.5 mm thickness. The plates were cooled quickly with cold water bath and then the film was removed. All specimens were annealed at 60°C for 3 h to remove any frozen internal stresses before any measurement.
LLDPE/SiO2 composites were prepared with different weight factions (2, 4, 6, 8, and 10 wt%) and particle sizes (i.e. S33, S58, S92, S145, and S199). Table 1 summarizes the codes, compositions, and weight fractions of the prepared composites in the current study.
Sample codes representing filler concentration and particle size.
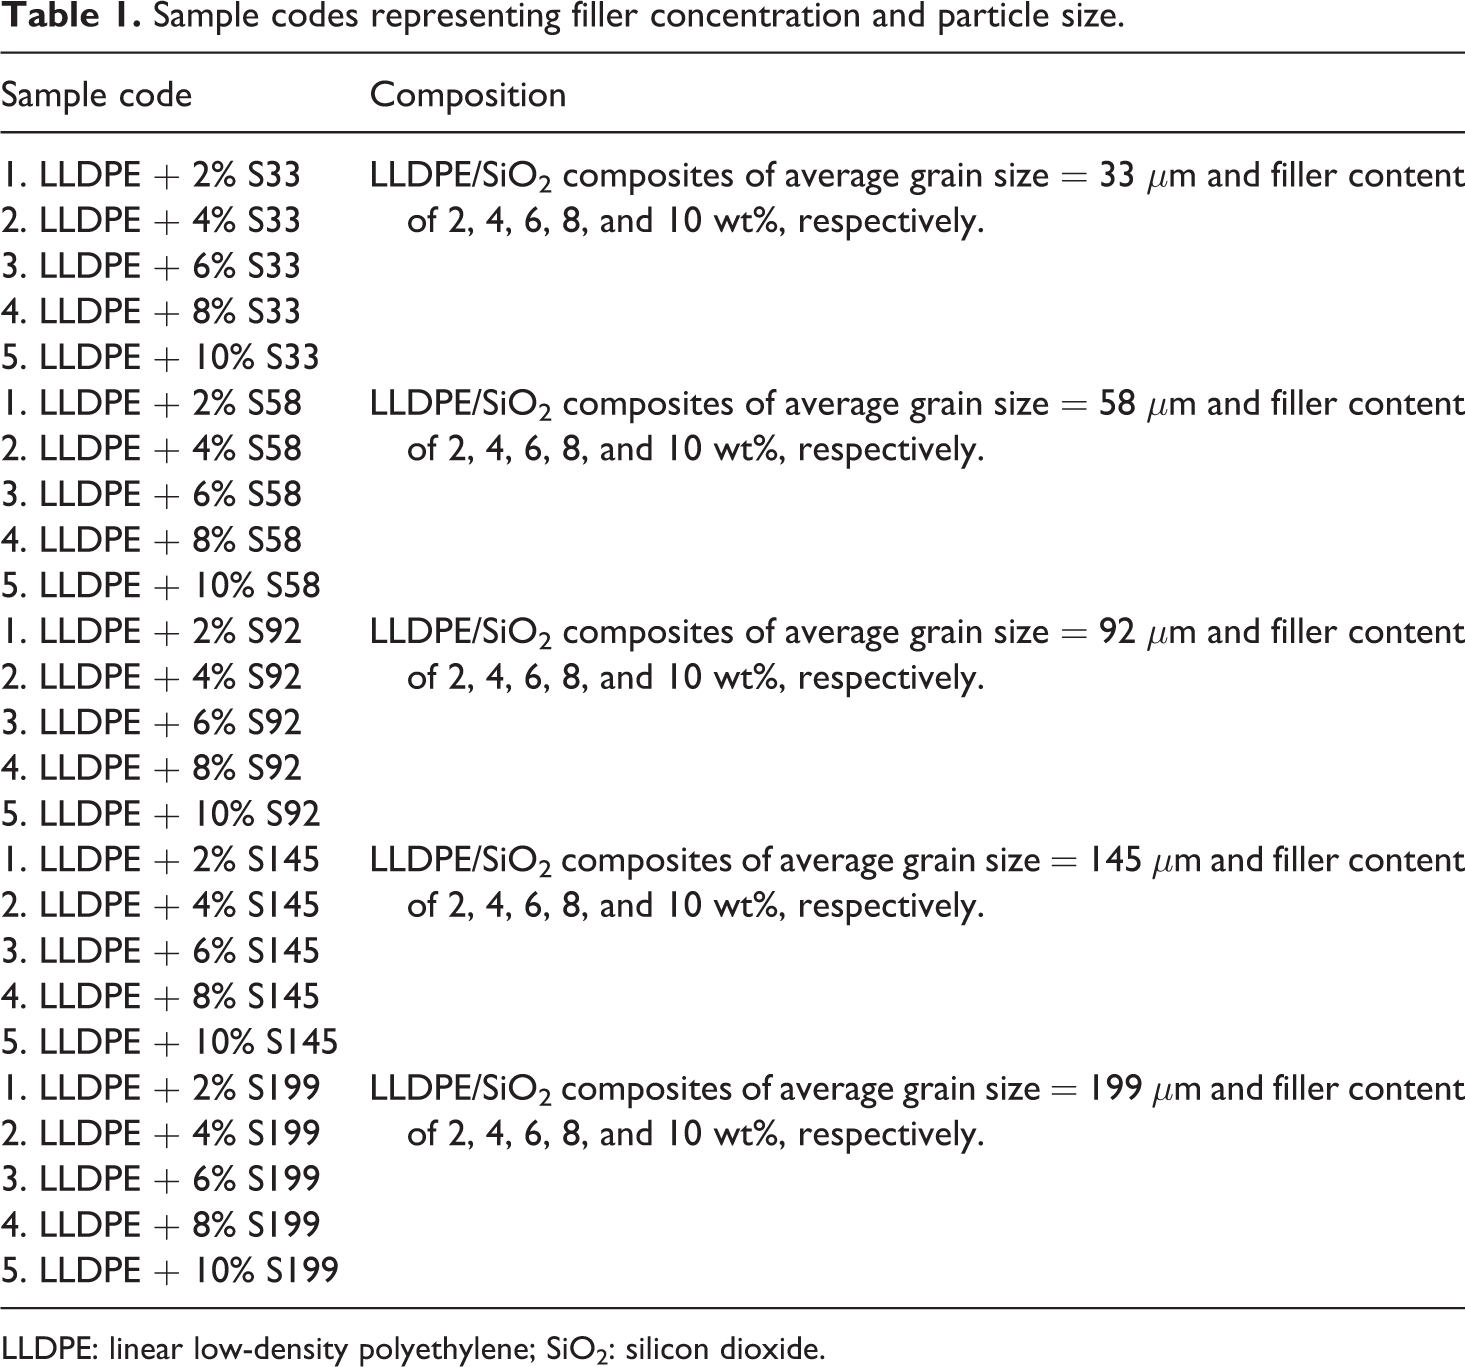
LLDPE: linear low-density polyethylene; SiO2: silicon dioxide.
Characterization methods
Tensile test
The tensile measurements were carried out at room temperature (approximately Tr = 25°C) using a locally designed stress–strain testing machine. A load cell of 1 kN was used and the crosshead speed was 0.144 mm s−1. The test was carried out for four independent replicates in this study and the average was determined. Yield strength was determined as the maximum tensile stress before the start of plastic deformation (see Figure 1).
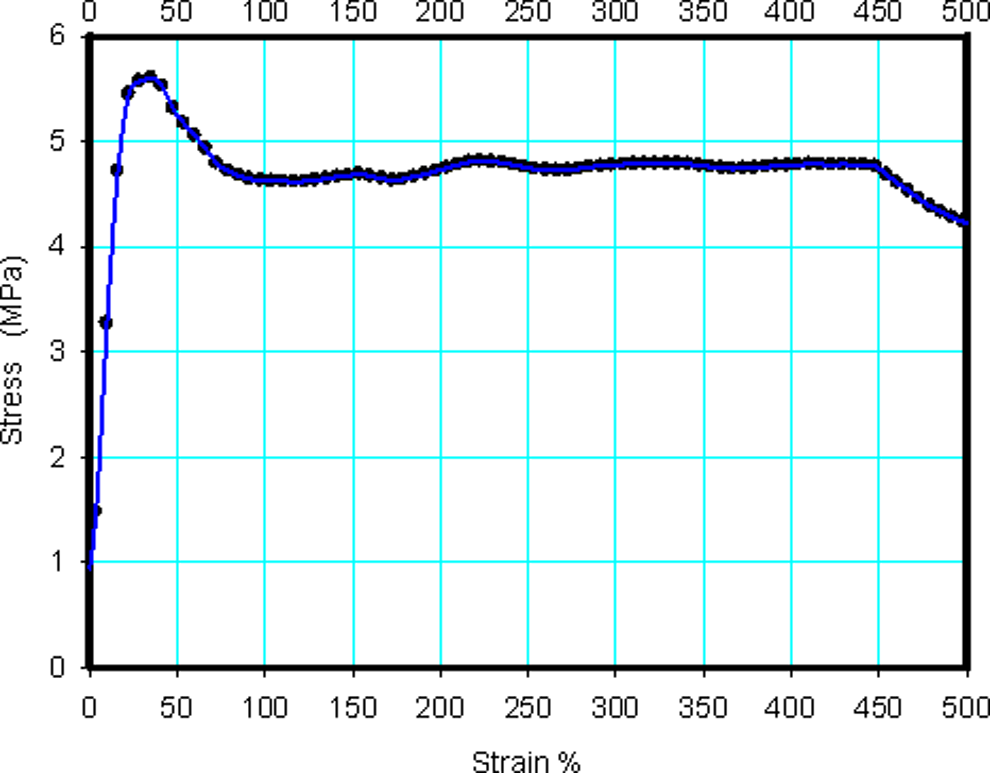
Stress–strain curve obtained from the tensile tester for pure LLDPE sample. LLDPE: linear low-density polyethylene.
Thermal expansion
Linear expansion coefficients (α) of the samples were measured using a technique designed by El-Tonsy. 12,13 This technique has been previously discussed and used for thin films of polymeric and metallic materials.
In dilatometry, the linear expansion coefficient α(T) is given by the well-known formula:

Melting properties
Melting temperatures of the samples were measured using differential thermal analyzer that was locally designed, manufactured, and calibrated using standard materials such as benzoic acid (Tm = 123°C) and tin (Tm = 231.9°C). 14 The accuracy of this technique was estimated to be about ±1%. The differential thermal analysis (DTA) trace will be presented as the difference in temperature between the specimen and empty pan against the sample temperature.
Thermal conductivity
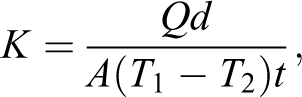
The through-plane thermal conductivity was measured at 80°C using thermal conductivity analyzer that was built based on Lee disc method (see Figure 2). This setup was calibrated using standard materials such as copper and silicate glass thin sheets. The expected error of this setup was estimated as ±4%. This technique was based on the use of steady-state thermal conditions. In order to determine the thermal conductivity, it is necessary to induce and measure the heat flux that passes through the specimen. With static methods, which are employed for measuring the thermal conductivity of polymers, specimens used are commonly made of flat, relatively thin, or cylindrical. In the simplest case of a flat specimen whose surface has constant temperature, thermal conductivity is given by the following equation:
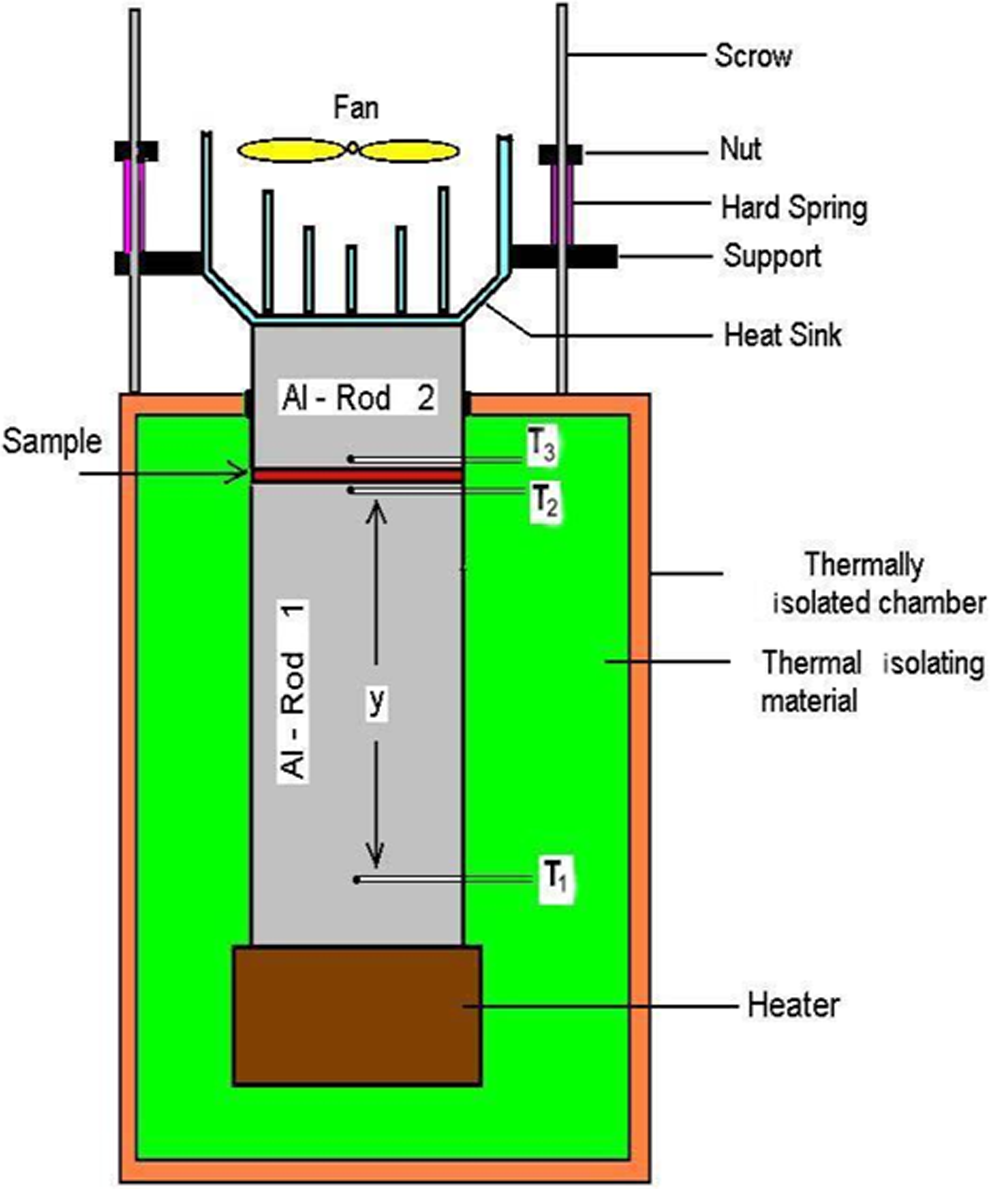
A schematic diagram of the system used for the measurement of thermal conductivity coefficient (K).
Results and discussion
Mechanical properties of the composites
Figure 3 shows the dependence of yield strength of the LLDPE/SiO2 composites on the filler fraction. Yield strength of the prepared composites was seen to increase with increasing the filler content and maximum value was obtained at specific weight fraction, which was varied based on the particle size. Afterward, the mechanical properties of the composites decreased gradually at higher content of SiO2.
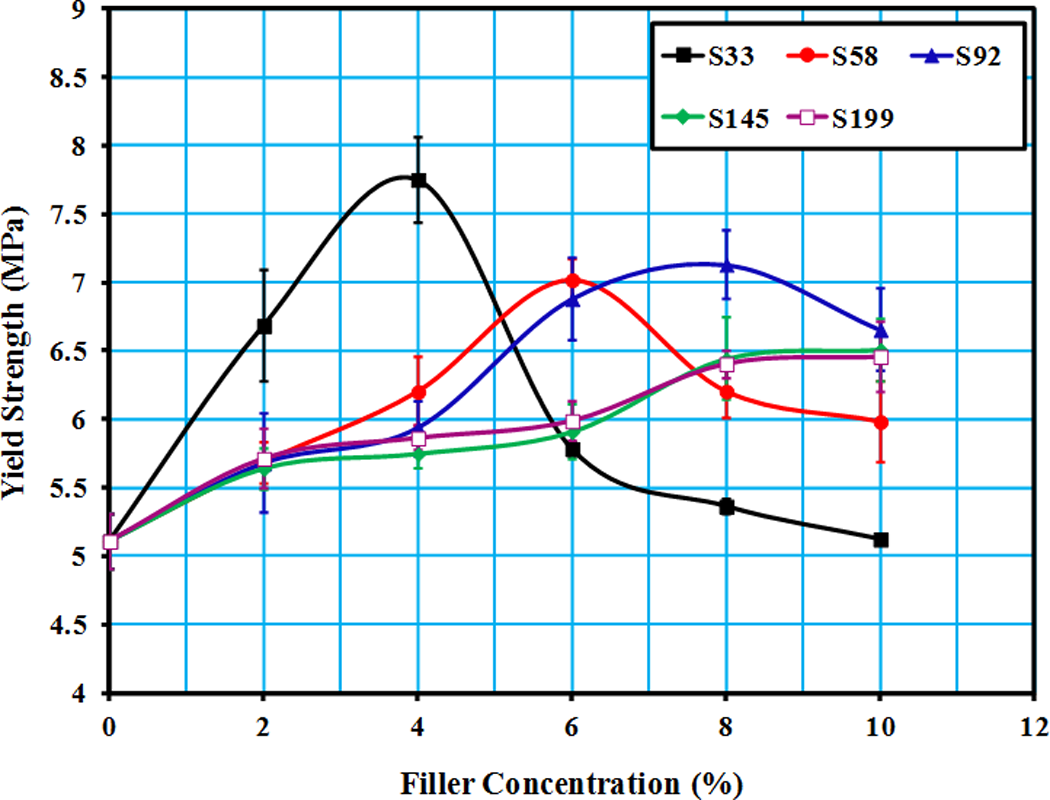
Change in yield strength against SiO2 content of LLDPE/SiO2 composites. The tensile test was conducted at Tr. SiO2: silicon dioxide; LLDPE: linear low-density polyethylene; Tr: room temperature.
Yield strength is a key property for designing products or parts. Fillers are commonly added to increase the yield strength of the polymer (reinforcement effect). Polymers interact with the filler surface forming an interphase layer at the boundaries with the particles. The thickness of the interphase can be varied widely based on polymer and fillers types. 15 Polyamides as an example of polar polymers are capable to chemically interact with groups on the filler surface, and this will produce strong polymer–filler interface and consequently obtain high mechanical properties. In contrast, nonpolar polymers such as polyethylene and polypropylene have weaker interface with inorganic fillers such as glass and ceramic particles. 16
The increase in the mechanical properties of LLDPE/SiO2 composites was suggested to be due to the filler interaction between the polymer chains (i.e. cross linking effect), providing localized regions of enhanced strength, which in turn can retard the growth of cracks or cavities. The decrease in yield strength for the composites after tipping point was attributed to agglomeration of the particles, which would weaken the interfacial adhesion and reduce the number of debonding/voiding sites within the composites. 17
Polymer composites are usually composed of two or more distinctive phases that exhibit an interface. The possible interactions between inorganic components and polymer matrices are hydrogen bonds, π interactions, van der Waals, or electrostatic forces. 18 A chemical bonding between the filler particles and the polymer matrix could be achieved using a dual functional compound, which is able to react with the filler surface and also cross-link into the polymer matrix (i.e. coupling agents). 16,19 In this study, no coupling agents were used and consequently the chemical bonding at filler–polymer interfaces is not expected. The bonding between SiO2 particles and LLDPE was suggested to be only attributed to physical entanglement and mechanical adhesion. 20
Local stress maxima developed around heterogeneities may initiate various micro-mechanical deformation processes in polymers and polymer composites. The basic deformation mechanisms of neat polymers are shear yielding and crazing, while polymer–filler debonding is the dominating deformation process in particulate-filled polymers. Number of debonded particles and the size of the formed voids have direct influence on the macroscopic properties of composites.
The aggregation tendency of fillers usually increases with decreasing particle size, and extensive aggregation would lead to insufficient homogeneity and lower mechanical characteristics compared to polymers alone. Aggregated filler particles act as crack initiation sites (i.e. crack tip). 21 This could be the reason for decreased yield strength after a certain concentration of SiO2.
Generally, recalling Figure 3, it is found that fillers with smaller size cause increase in mechanical properties of LLDPE at lower concentration than particle of bigger sizes. This behavior of composites is conventionally attributed to the enhanced energy absorption as a result of the longer path, which the crack has to go through because it has to bypass the numerous tiny particles; whereas larger particles act as stress concentrators. 22 Furthermore, size of the voids created within the composites decreases with decreasing filler size. Therefore, it was expected that the composites with smaller filler size would have higher tensile properties in comparison to composites with bigger sizes. 23 It was also reported that large particles could easily debond from the matrix and lead to the premature failure of the part under loading. 21
Thermal expansion of the composites
Polymers commonly exhibit high-thermal expansion in comparison with metals and ceramics. Accurate, continuous, and wide range setup was designed for measuring the absolute linear CTE of polymer thin films. CTE could provide a good knowledge of macro- or even micro-molecular behavior of the polymeric system when subjected to a thermal field. Thermal expansion of solids is associated with the inharmonic nature of the atomic vibrations. Therefore, automatic and continuous recording of CTE of LLDPE alone and LLDPE/SiO2 composites were applied in order to obtain more details about thermal changes in the molecular structure of the material due to the existence of filler. 13
The linear expansion coefficients of LLDPE/SiO2 composites were conducted at 80°C. Figure 4 shows the change in linear expansion coefficient (α) versus particle size and filler content. From Figure 4, it can be seen that the addition of filler to the polymer matrix leads to significant decrease in the CTE. This was attributed to the big mismatch in thermal expansion coefficient between LLDPE and SiO2, namely 16–20 × 10−5 and 0.5 × 10⁻⁶°C−1, respectively. 24,25
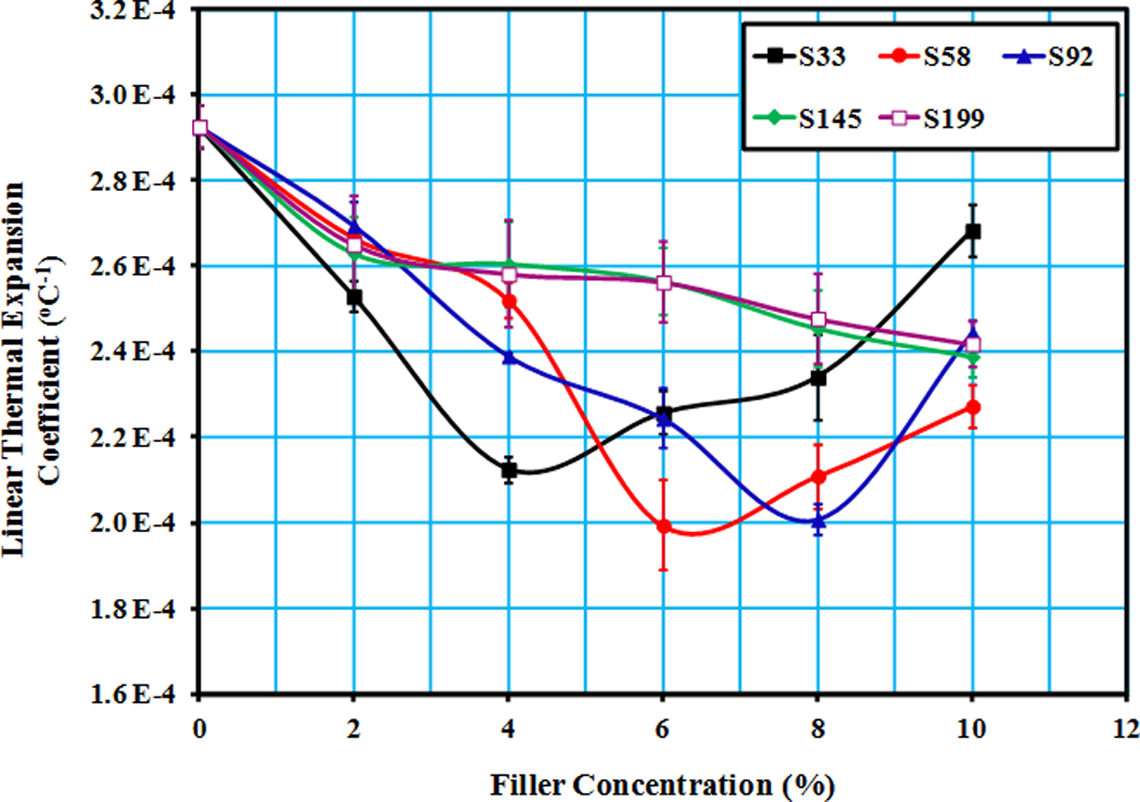
Change in linear thermal expansion coefficient of LLDPE/SiO2 composites versus filler weight fractions and sizes. LLDPE: linear low-density polyethylene; SiO2: silicon dioxide.
The minimum value of thermal expansion (turning point) of the S33 composite was observed at the weight fraction of 4 wt%. Values of filler content at the turning point were dependent on the particle sizes. The turning points were seen at 6 and 8 wt% for particle sizes S58 and S92, respectively, and no turning points were seen for bigger filler sizes, S145 and S199.
Figure 5 shows the measured thermal strain of LLDPE reinforced with SiO2 of average size 92 μm (S92).
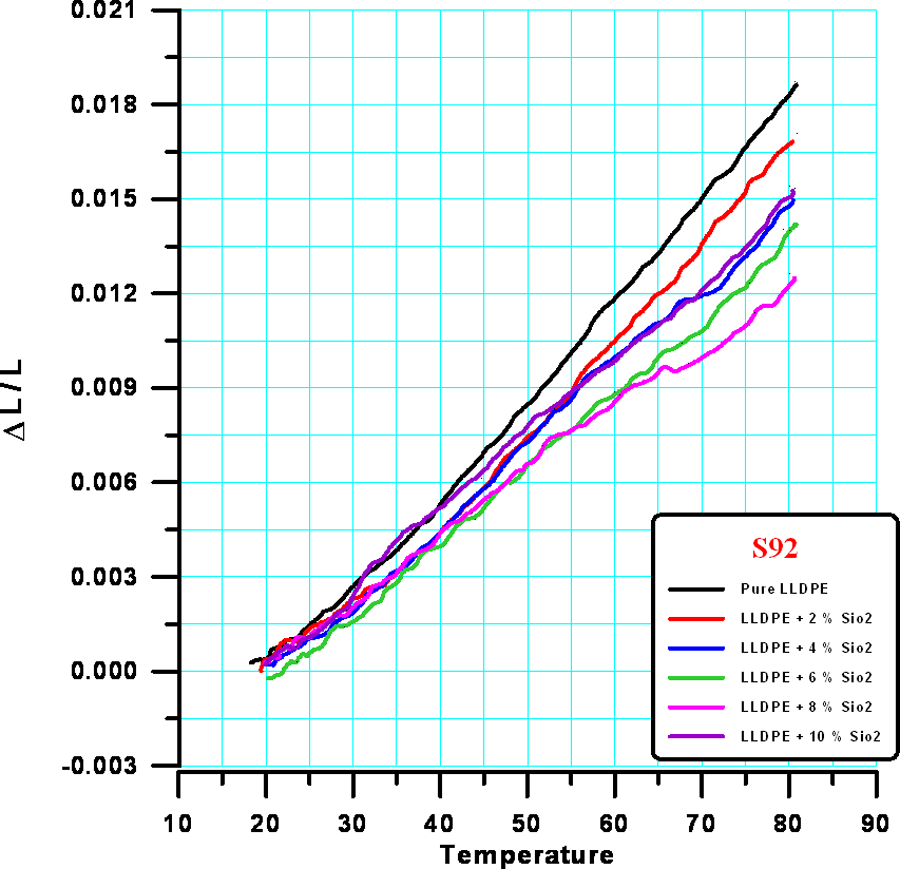
Thermal strain of LLDPE reinforced with SiO2 of average size for S92. LLDPE: linear low-density polyethylene; SiO2: silicon dioxide.
From Figure 4, it can be concluded that the filler particle size and content play important roles in controlling thermal expansion of composites. In addition, a good correlation was observed between thermal expansion and mechanical properties. Linear thermal expansion coefficient of the composites reached the minimum values at filler content equivalent to maximum values of yield strength.
Most of the polymers have coefficients of thermal expansion at least an order of magnitude greater than mineral fillers. Thus, mineral-filled composites have lower coefficients of expansion than unfilled polymers and rule of mixtures could be applied unless strong bonding occurs between filler and polymer. 16 This might explain the reduction in thermal expansion of composites with increasing filler content up to a certain limit.
As can be seen from Figure 4, after the thermal expansion coefficient of LLDPE/SiO2 composites reached its lowest value, it started to increase with increasing filler content. This increase in thermal expansion might be ascribed to an increase in the amount of microscopic voids with increasing filler content and size. During the test, the applied thermal stress inside the voids due to an increase in temperature (i.e. the thermal expansion of voids) might be another reason for the increase in thermal expansion of the composites. 26
Melting properties of the composites
Melting properties of polymers depend strongly on the strength of the chain interaction forces, where the melting point is shifted toward higher temperatures by increasing chain interaction force, similar to the effect of filler addition to polymers. Conversely, the melting point shows a shift toward lower temperatures by weakening the chain interaction force (plasticization effect), which occurred by the addition of plasticizer to polymers. 27,28 Figure 6 shows change in melting temperature of LLDPE/SiO2 composites having different filler size and concentrations. This figure showed similar trend to Figure 1, which indicates that melting temperature and yield strength of LLDPE/SiO2 composites were well correlated.
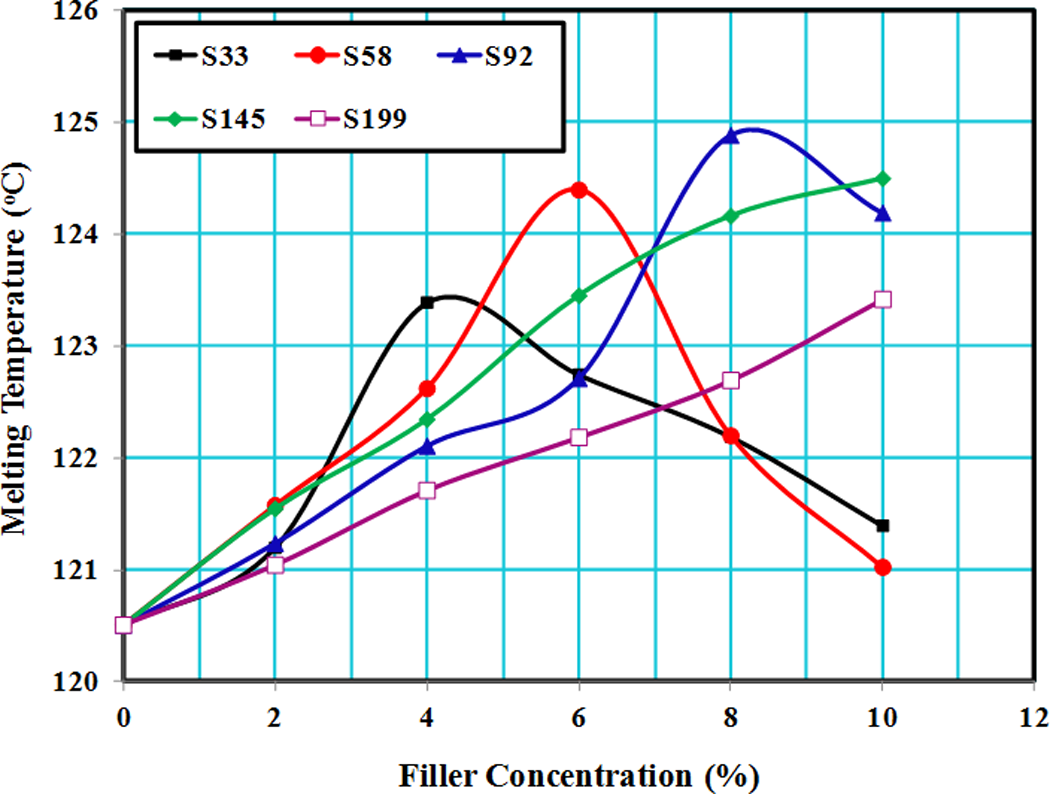
Change in melting temperature of LLDPE/SiO2 composites having different filler sizes and concentrations. LLDPE: linear low-density polyethylene; SiO2: silicon dioxide.
From Figure 6, it is clear that adding 4 wt% SiO2 for S33 to LLDPE caused the shift in melting temperature of LLDPE to higher values compared to composites with other concentrations of the same particle size. The highest shift for sizes S58 and S92 composites was obtained at filler content of 6 wt% and 8 wt%, respectively. For the composites of sizes S145 and S199, the shift in melting point increased continuously with increase in filler content. This shift toward higher temperature confirmed the filler role in the enhancement of mechanical properties. DTA thermograms of LLDPE/SiO2 composites of size S58 can be seen in Figure 6.
Thermal conductivity of the composites
Figure 7 shows coefficients of thermal conductivity (K) of LLDPE/SiO2 composites as a function of both filler particle size and filler concentration. Thermal conductivity of LLDPE increased with increasing filler concentration and decreasing particle size. Since SiO2 has higher thermal conductivity than the polymeric matrix (LLDPE), it was expected that the thermal conductivity of the composites will increase by the addition of the fillers. A nonlinear increase was seen in thermal conductivity with increasing filler weight fraction. 29
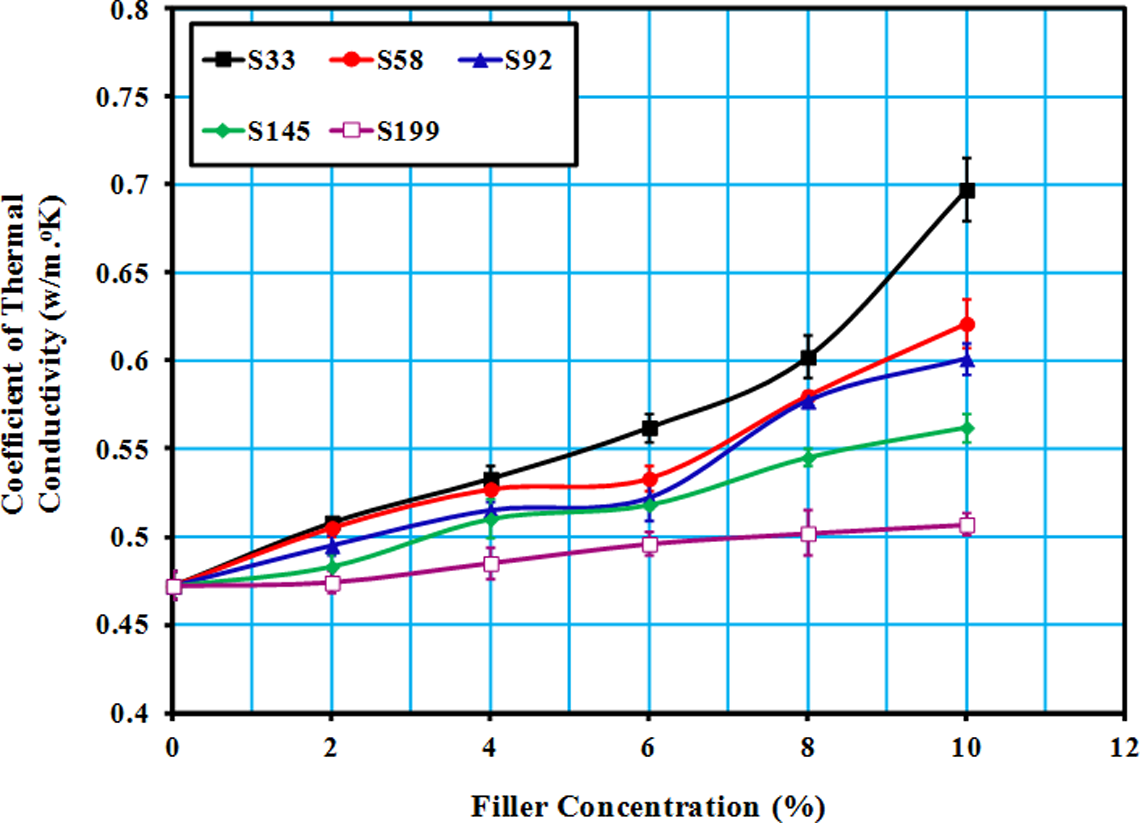
Thermal conductivity coefficient (K) against concentration of SiO2 filler in LLDPE. SiO2: silicon dioxide; LLDPE: linear low-density polyethylene.
The fillers of smaller sizes can form thermal conductive filler pathway easier than large particles. Furthermore, the size of voids decreases with decreasing particle size. 23 Thus, thermal conductivity of composites with smaller sizes was greater than that for LLDPE reinforced with larger particles.
Morphology of the composites
Figure 8 shows optical polarizing microscopic images of two necking area of LLDPE/SiO2 composite samples of different filler sizes and contents after tensile testing. Figure 8(a) and (c) demonstrates the growth of voids under tensile stress during the test. Moreover, the bigger particles showed larger voids. Figure 8(b) and (d) shows the conversion of the voids into a crack parallel to the axis of the applied stresses, which would lead to the failure of polymer sample.
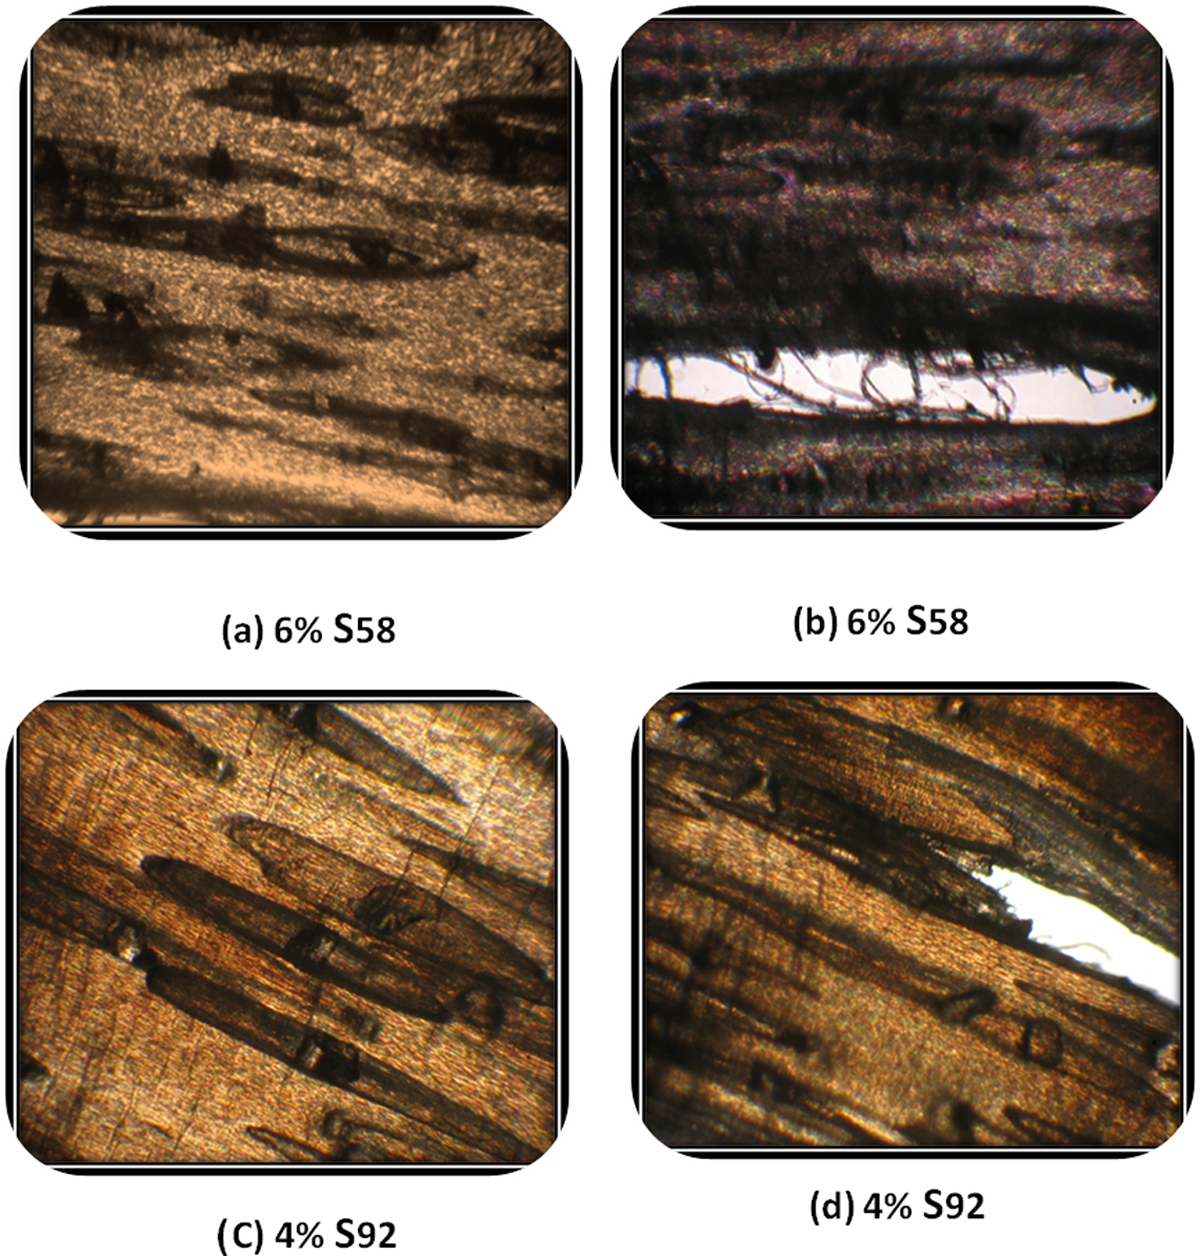
Optical polarizing microscopic images of LLDPE/SiO2 composites after tensile testing. LLDPE: linear low-density polyethylene; SiO2: silicon dioxide.
Figure 9 shows optical polarizing microscopic image of the composite specimens at failure edge. The interfacial crack of smaller particles requires higher applied stress to grow because the energy release rate decreases as the particle size decreases for the same applied stress. 11 This could explain the differences in mechanical properties of composites with different sizes and fractions.
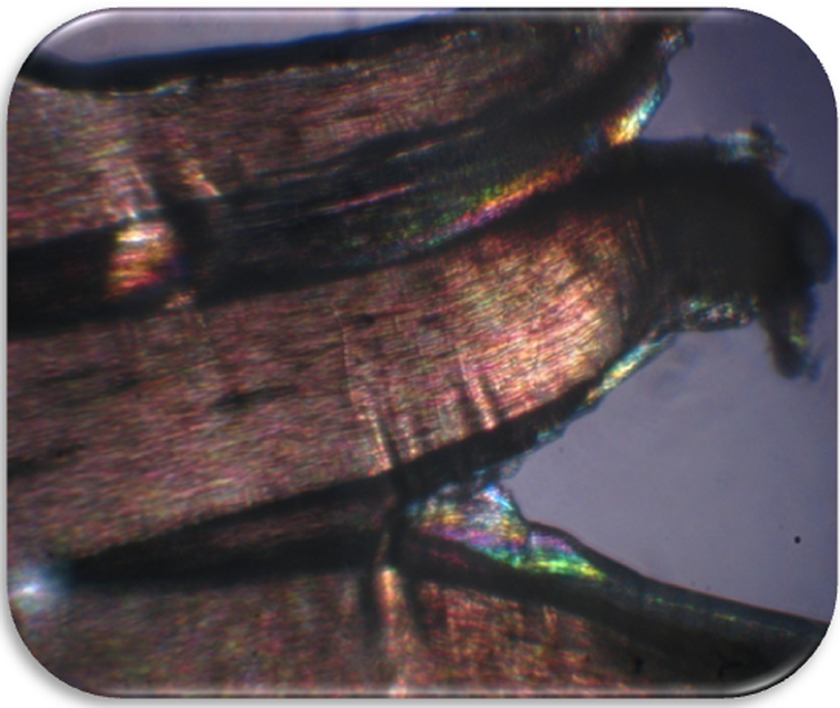
Optical microscopic image of the failure process via crack growth.
Conclusions
The mechanical properties (yield strength) and thermal properties of LLDPE/SiO2 composites with SiO2 filler of different size ranging from 33 µm to 199 µm were investigated. The major findings can be drawn as follow:
Filler with smaller particle size causes increase in mechanical properties of LLDPE at lower concentration than that for particles of bigger size. This could reduce the amount of used filler and consequently simplify the recycling process of filled polymers without affecting the end-use properties of the polymer composite. As decrease in the linear expansion coefficients was observed with increasing filler concentration in particular for SiO2 of small sizes. Thermal conductivity of LLDPE increased with increasing SiO2 concentration and decreasing particle size. Good correlation between change in mechanical and thermal properties against filler size and content was also observed for the produced composites.
From the above results and considerations, we conclude that the practical importance of these values provides acceptable evaluations of structural morphology parameter changes for LLDPE.
Footnotes
Declaration of Conflicting Interests
The author(s) declared no potential conflicts of interest with respect to the research, authorship, and/or publication of this article.
Funding
The author(s) received no financial support for the research, authorship, and/or publication of this article.