
Abstract
Composites based on ethylene vinyl acetate (EVA) copolymers with 18% and 28% VA contents and empty fruit bunch (EFB) fibre were reported in this study. The EVA-EFB composites were prepared by melt mixing using a Brabender plastograph mixer. Scanning electron microscopy (SEM) results show an improved extent of interfacial adhesion between the polymer and the fibre, with an increase amount of VA in the copolymers. Differential scanning calorimetry (DSC) results reveal that the melting and crystallization enthalpies decreased significantly with increasing VA content, while the presence of EFB fibre had very little influence on the melting and crystallization behaviour of both EVA18 and EVA28. Thermogravimetric analysis (TGA) results show that EVA18 is more thermally stable than EVA28 due to the higher amount of VA in EVA28, and the decomposition of EFB fibre seems to be retarded when it is incorporated into the EVA copolymers. Dynamic mechanical analysis (DMA) results show that both the storage modulus and loss modulus decrease significantly with an increase in VA content, and that these two properties observably increased with the incorporation of the fibre. The glass transition temperature also increased observably with increasing fibre loading, and decreased with an increase in the VA content. The stress and strain at break showed a similar decrease with increasing fibre content for both EVA18 and EVA28, while Young’s modulus increased much more significantly with increasing fibre content for EVA28. Generally, it seems as if the improvement in interaction between EVA28 and EFB was not significant enough to overcome the inherent weak properties of EVA28.
Keywords
Introduction
The incorporation of lignocellulosic fibre as a reinforcing component in polymer composites is widely investigated as an alternative to glass and carbon fibre–reinforced composites. The use of natural fibres as lignocellulosic filler in the production of thermoplastic composites can give rise to high specific stiffness and strength, improved mechanical properties, and ease of processability.1–3 The advantages of lignocellulosic fillers over their inorganic counterparts include lower densities, greater deformability, less abrasiveness to expensive moulds and mixing equipment, biodegradability, and lower material cost.4–6 Despite these advantages, the primary drawback associated with the use of natural fibres as reinforcement in thermoplastics is the lower processing temperatures needed because of the possibility of lignocellulosic degradation as well as the volatile emissions that could affect the composite properties. Another disadvantage of using natural fibres as reinforcement is their hydrophilic nature which gives rise to reduced compatibility between the fibre and the matrix and which leads to poor mechanical properties of the natural fibre–reinforced composites.7,8 This disadvantage has been overcome by the pretreatment of fibres, either by physical or by chemical means, as well as by the addition of compatibilizers into the composites.
Research on the application of natural fibres in polymer composites such as jute, sisal, coir, ramie, pineapple, bamboo, kenaf, coconut, hemp, and flax have been reported by many researchers.1–8 Since lignocellulosic-based fillers are derived from renewable resources, lignocellulosic fibres were investigated as reinforcing agents because of their availability and properties. Empty fruit bunch (EFB) fibre is another example of such lignocellulosic materials. EFB is a by-product derived from an oil palm tree called Elaeis guineensis. EFB is a cheap, biodegradable, nontoxic, and widely utilized natural fibre and abundantly available in Malaysia and in the tropical forests of West Africa. 9 EFB is used as a raw material in various applications including power generation, composites formulation, and in the paper making industry. A number of researchers reported work done on EFB/polymer composites.10–17 Studies on EFB fibre–reinforced polypropylene (PP) composites showed that the tensile strength of the composites decreased, while the tensile modulus increased with increasing EFB filler loading.10,13 In the case of glycidyl methacrylate treatment of EFB and ultraviolet radiation curing of EFB-unsaturated polyester composites, however, both the tensile strength and modulus increased noticeably with increasing EFB content. 11 An investigation of the effects of chemical treatment on oil palm EFB–reinforced high-density polyethylene (PE) composites also showed improved tensile strength and modulus of the composites. 15
The objective of this study was to investigate the composites based on EVA copolymers and Malaysian EFB fibre, to study the effects of the fibre and vinyl acetate (VA) contents of the ethylene vinyl acetate (EVA) copolymers on the thermal and mechanical properties of the composites, and to explain these properties in terms of the observed morphologies. EVA copolymers with two different VA contents (18% and 28% VA) were, respectively, mixed with different amounts of Malaysian EFB fibre.
Materials and methods
EVA-460 and EVA-260 were manufactured and supplied in granule form by Plastamid, Elsie River, South Africa. EVA-460 contains 18% by weight of VA with a butylated hydroxy toluene (BHT) antioxidant thermal stabilizer. It has a melt flow index ([MFI] 190°C/2.16 kg) of 2.5 g/10 min (American standard test method [ASTM] D1238-ISO 1133), T m of 88°C, vicat softening point of 64°C, and a density of 0.941 g cm−3. EVA-260 contains 28% by weight VA with a BHT antioxidant thermal stabilizer. It has an MFI (190°C/2.16 kg) of 6.0 g/10 min (ASTM D1238-ISO 1133), T m of 75°C, vicat softening point of 46°C, cloud point in paraffin wax of 66°C, softening point ring and ball of 154°C, brittleness temperature of −100°C, and a density of 0.955 g cm−3.
The EFB fibre was obtained from palm oil mills in Malaysia. Its particle size is less than 150 μm and bulk density is in the range of 0.75–0.90 g cm−3.
The EFB fibres were sieved through a 150-μm pore size sieve and kept in an oven at 105°C overnight for moisture reduction. The composites were prepared by a melt mixing process using a Brabender plastograph internal mixer (Brabender, Duisberg, Germany). The mixing speed was 30 rpm at a temperature of 120°C for 10 min. The samples were melt pressed at 120°C and 50 bars for 5 min into 100 mm × 100 mm × 2 mm square sheets using a hot hydraulic press. These conditions were set in order to ensure film production efficiency and to avoid bubbles in the film. All the test samples were then cut from the sheets for different analyses.
Scanning electron microscopy (SEM) analyses were carried out in a Shimadzu SSX-550 Superscan SEM (Tokyo, Japan). The surfaces of the samples were coated with gold using a BioRAD Sputter Coater for 135 sec at 120 μm probe size, the probe current was 0.02 nA, the lateral resolution 2.0 μm, and the alternate current (AC) voltage 5.0 keV. The images were then captured by standard photography.
Differential scanning calorimetry (DSC) analyses were carried out under nitrogen flow (20 ml min−1) using a Perkin Elmer Pyris-1 DSC (Waltham, MA, USA). The sample weights were in the range of 5–10 mg, and they were heated from 25 to 180°C at a heating rate of 10°C min−1. The cooling and second heating were also performed under the same conditions. For all the samples, the onset and peak temperatures of melting and crystallization, as well as the melting and crystallization enthalpies were determined from the second scan.
TGAs were done under flowing nitrogen atmosphere at a constant rate of 20 ml min−1 using a Perkin Elmer TGA 7 thermogravimetric analyser (Waltham). The samples, weighing 5–10 mg each, were heated from 30 to 600°C at a heating rate of 10°C min−1.
The viscoelastic properties of the composites were studied using a Perkin Elmer Diamond dynamic mechanical analysis ([DMA] Waltham). The samples were analysed at −90 and 90°C at a heating rate of 5°C min−1 in the bending mode at a frequency of 1 Hz.
The tensile properties were investigated using a Hounsfield H5KS tensile tester (Redhill, UK) at a cross-head speed of 10 mm min−1. The samples had a gauge length of 24 mm and a thickness of 2 mm. The tensile modulus and stress and elongation at break of the samples were calculated from the stress–strain curves. At least five specimens were tested for each sample and the mean values and standard deviations are reported.
Fourier transform infrared (FTIR) spectroscopy was performed using a Perkin Elmer precisely multiscope connected to a Perkin Elmer Spectrum 100 FTIR spectrophotometer. The samples were scanned 32 times over a 400–4000 cm−1 wave number range at a resolution of 4 cm−1. The FTIR spectra were recorded in the transmittance mode.
Results and discussion
Morphology
The SEM micrographs of the different EVA/EFB composites are shown in Figures 1 and 2. Figure 1 shows the SEM micrographs of the EVA18/EFB composites. Figure 1 shows a few fibre pull-outs creating holes with smooth walls in the EVA matrix. There is no intimate contact between the EVA18 and the EFB, because Figure 1b shows the presence of a void around the fibre. This is reflected in the tensile properties discussed in the section below. Figure 1a further shows small fibre agglomerations and contact between different fibres in the polymer matrix. There is also evidence of fibre disorientation and differences in fibre sizes in the composites, which may affect the efficiency of stress transfer. 18
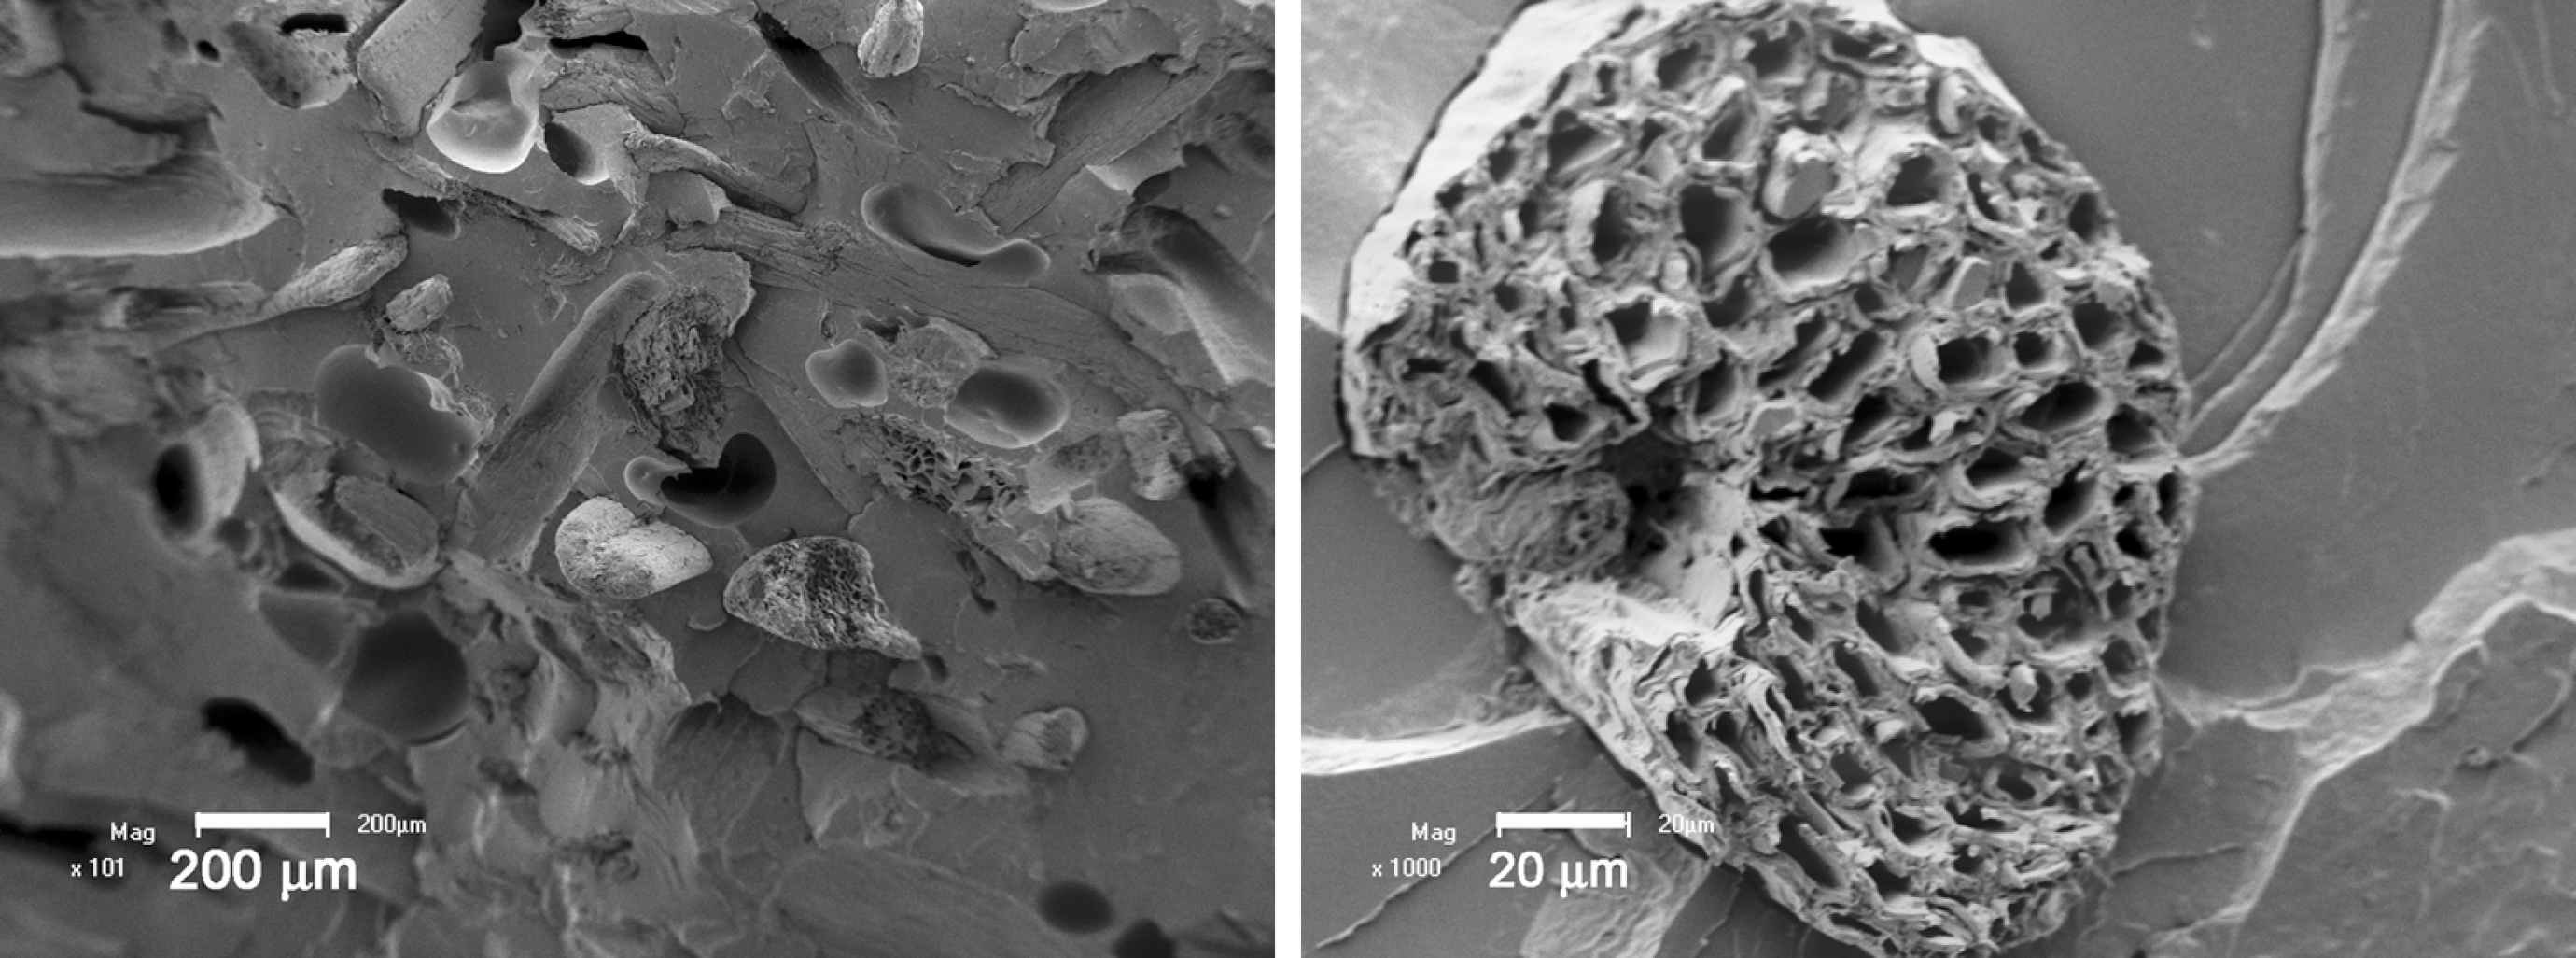
Scanning electron microscopy (SEM) micrographs of ethylene vinyl acetate (EVA)18/empty fruit bunch (EFB) composites.
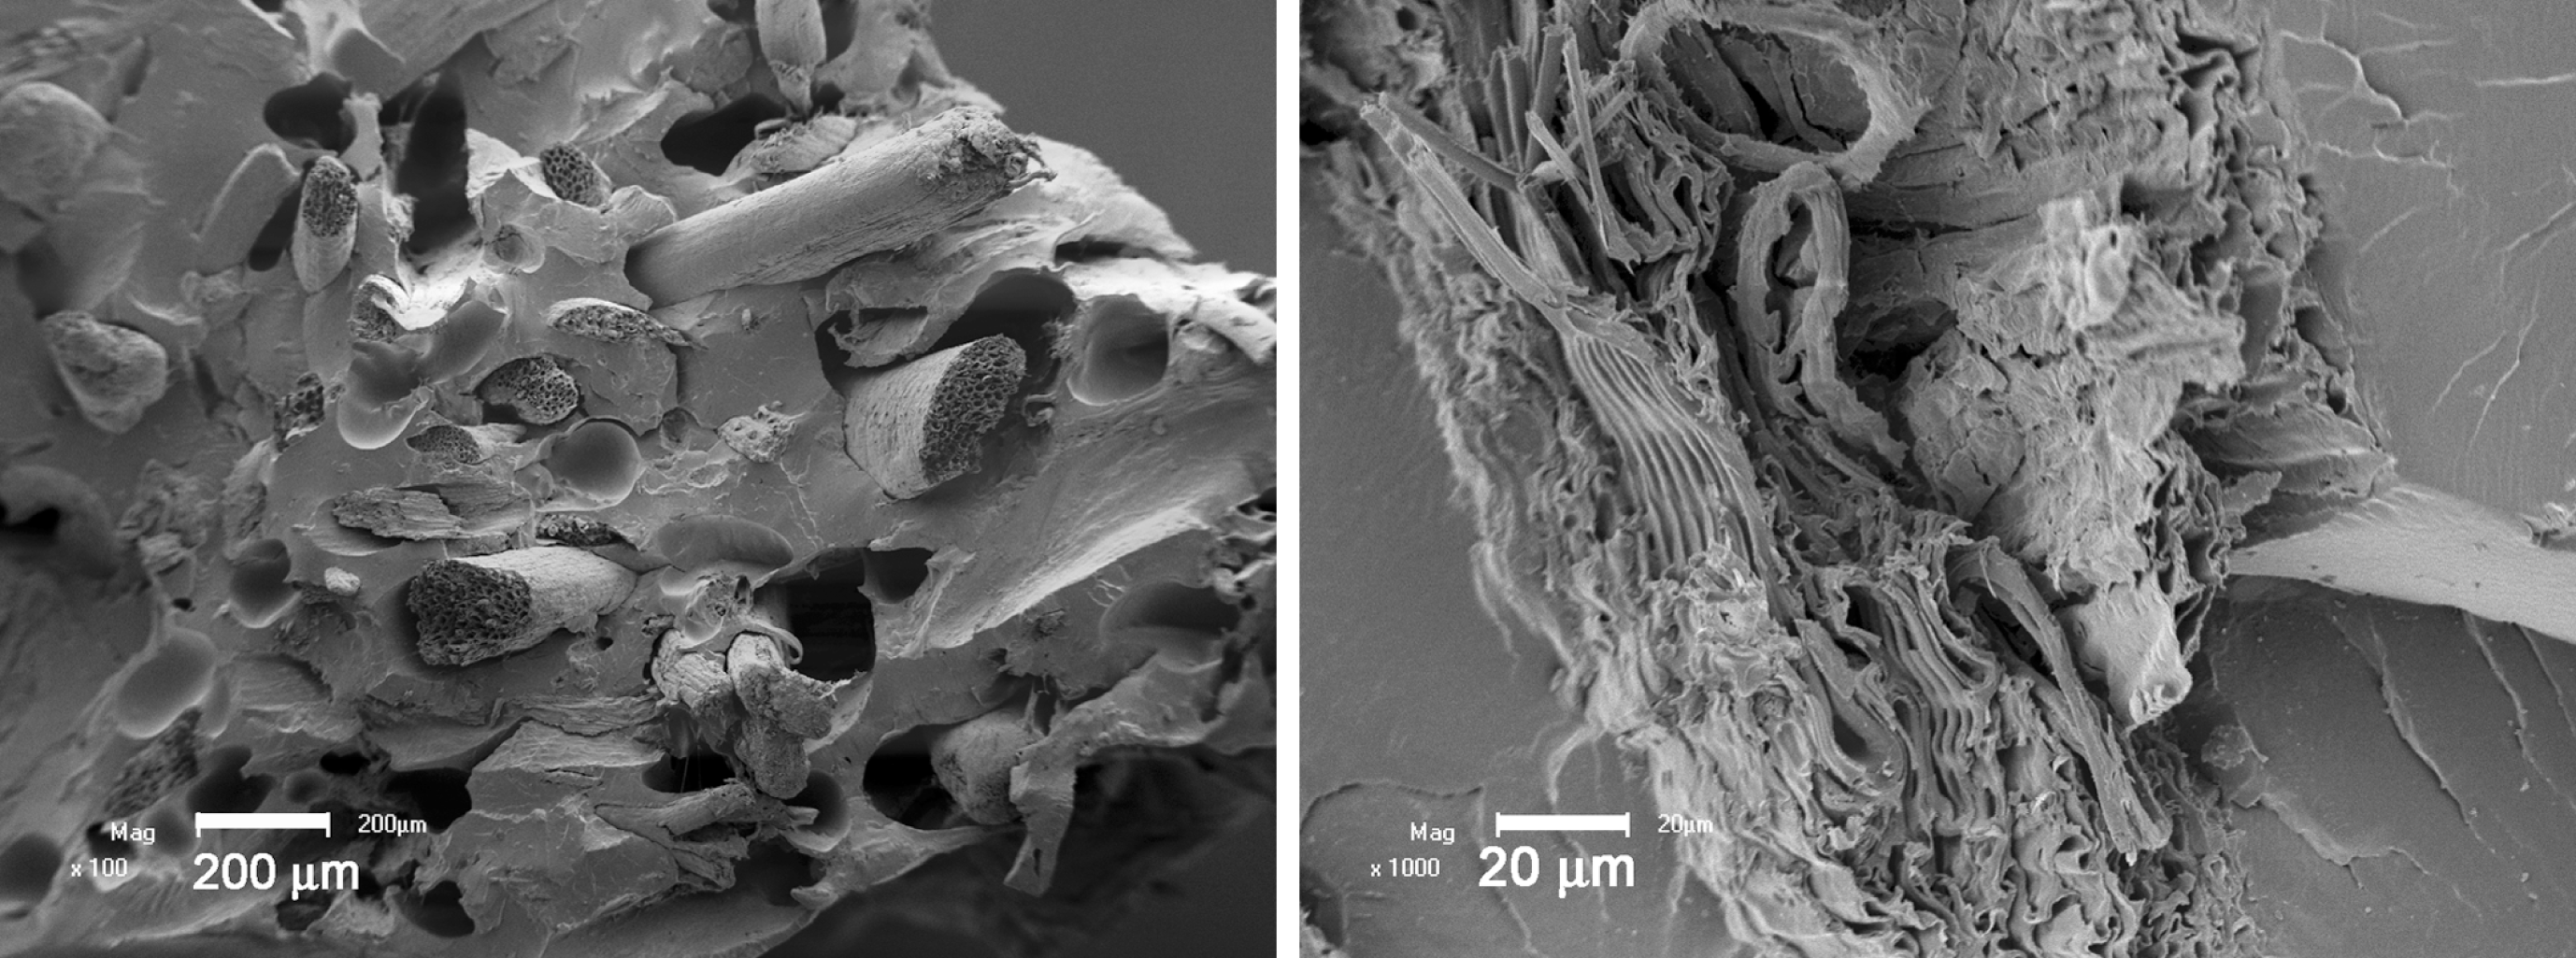
Scanning electron microscopy (SEM) micrographs of ethylene vinyl acetate (EVA)28/empty fruit bunch (EFB) composites.
The SEM micrographs of the EVA28/EFB composites are presented in Figure 2. It is clear from Figure 2 that (i) there are little or no voids around the fibres, (ii) there is almost no fibre pull-outs resulting from the fracturing of the composites, and (iii) there are fibre bending, twisting, and fracturing on the composites’ fracture surfaces. There are also indications of EVA28 adhering to the EFB surfaces. All these observations indicate that the compatibility between these components is improved, which is mainly due to an increase in the number of VA groups that interact with the –OH groups on the EFB fibre surface.17,19
Figure 3 shows the FTIR spectrum of the pure EVA18, the EFB fibre, and the EVA18/EFB composites. The spectrum of the EFB fibre shows a broad characteristic peak around 3430–3300 cm−1, which indicates the presence of O–H stretching. The bands at 2920, 2850, and 1496 cm−1 due to C=H stretching of methyl or methylene groups are also observed in the spectrum of the EFB fibre. The EVA18/EFB composite spectrum shows all the characteristic peaks for both pure EVA18 and EFB, and a slight shift in the peaks is observed. The peak at 1592 cm−1 is due to a C=C stretching, 20 and indicates that EFB contains fatty acids from lignin. The C=C peak at 1592 cm−1 in the 80/20 (w/w) EVA18/EFB composite is much less intense than that of EFB. The most probable reason for this is the smaller amount of fibre on the composite surface. There is a slight shift in the carbonyl peak, the C=O stretching vibration at 1727–1736 cm−1 in the EVA18/EFB composites. This may indicate an interaction between the carbonyl group of lignin and the methine (–CH) hydrogen of the EVA. 21 A slight increase in the intensity of the carbonyl peak at 1736 cm−1 is observed, which may be the result of additional carbonyl groups contributed by the EFB fibre. It is expected that the interaction between the VA carbonyl group and the EFB hydroxyl group may influence the position and intensity of the carbonyl peak in the composite spectrum. In this case there is an observable increase in the intensity of this peak, which is contrary to what one would expect, and there does not seem to be any change in the peak position. It seems as if it is not possible to conclusively confirm interactions between the polymer and the fibre from the FTIR results. The FTIR spectra for the EVA28-based samples are not presented here, since the only difference is a much more intense –C=O peak at about 1730 cm−1 for EVA28. As in the case of the EVA18 composites, interactions between the polymer and the fibre could also not conclusively be confirmed from these spectra.
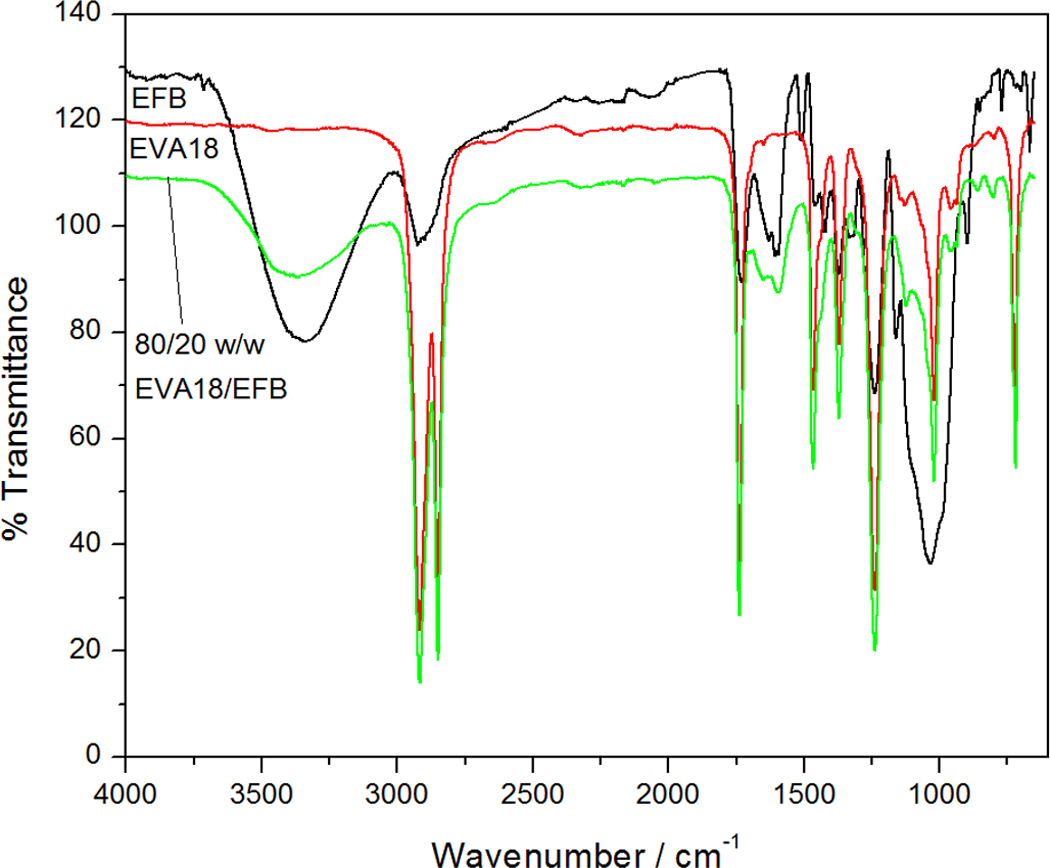
Fourier transform infrared (FTIR) spectra of empty fruit bunch (EFB), ethylene vinyl acetate (EVA)18, and EVA18/EFB composites.
Differential scanning calorimetry
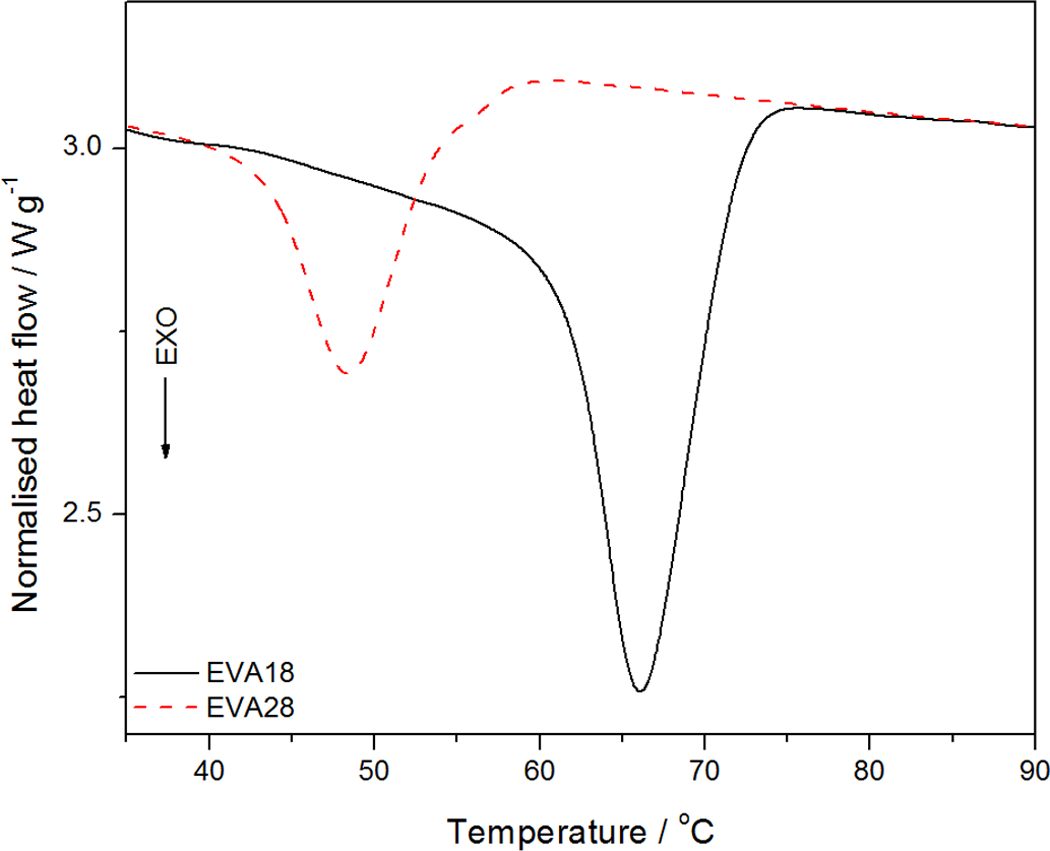
The DSC results of the pure EVA copolymers are presented in Figures 4 and 5. The peak temperatures of melting and crystallization, as well as the melting and crystallization enthalpies of all the samples are summarized in Tables 1 and 2. The heating curves in Figure 4 show endotherms with peak temperatures of melting at 87 and 73°C for EVA18 and EVA28, respectively. The melting temperature of EVA decreases significantly with an increase in VA content. This is due to the acetate branch points that reduce the packing and folding of the chains and inhibit the crystallization of the EVA backbone, 22 giving rise to reduced crystallinity. It is evident from Figure 4 that the melting peak of EVA18, which has the lowest VA concentration, is more resolved which indicates more crystal perfection. 23 The EVA28 sample has a melting peak that is less resolved due to more defects induced by the higher VA content. EVA18 has a melting enthalpy (which is directly related to the extent of crystallinity) of 20 J g−1, while EVA28 has a much lower melting enthalpy of 5 J g−1 (Table 1). This confirms the lower crystallinity of EVA28.
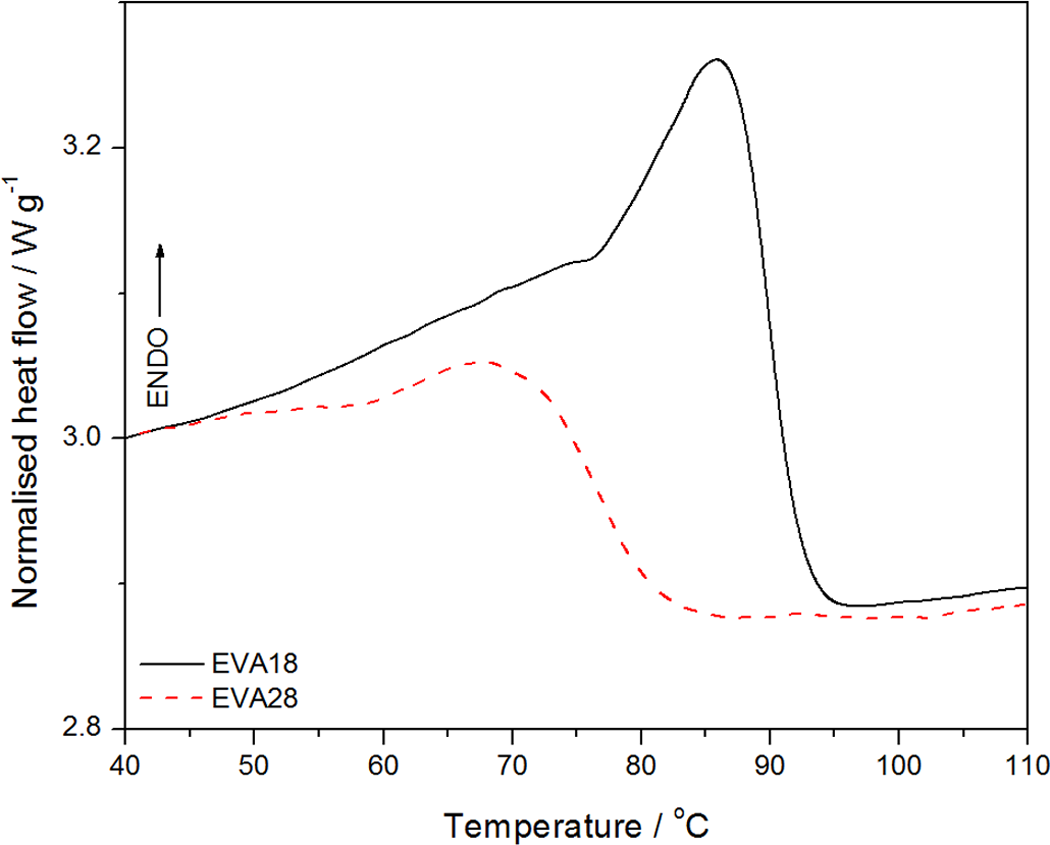
Differential scanning calorimetry (DSC) heating curves for the ethylene vinyl acetate (EVA)18 and EVA28 copolymers.
Differential scanning calorimetry (DSC) cooling curves for ethylene vinyl acetate (EVA)18 copolymer and EVA28 copolymer.
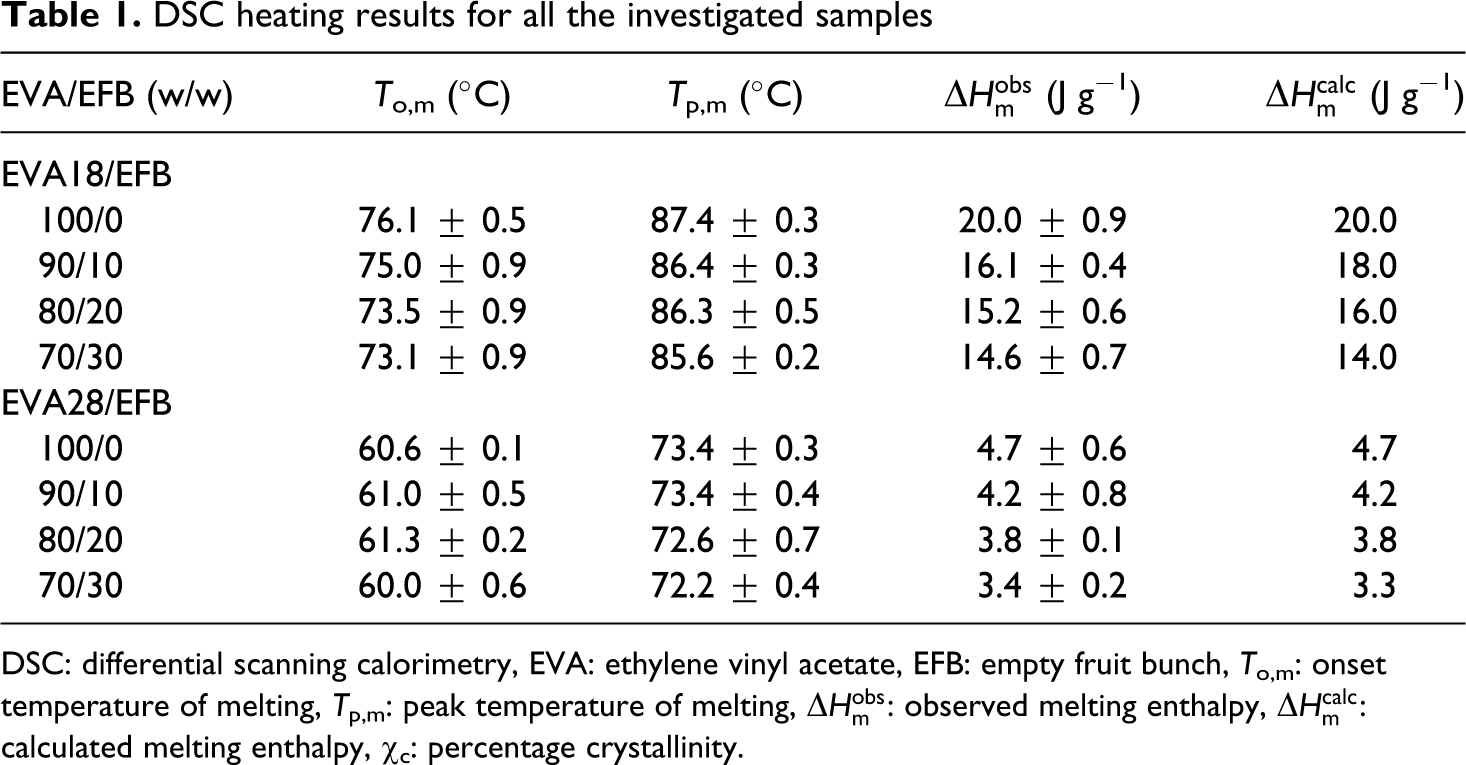
DSC heating results for all the investigated samples
DSC: differential scanning calorimetry, EVA: ethylene vinyl acetate, EFB: empty fruit bunch, T
o,m: onset temperature of melting, T
p,m: peak temperature of melting,
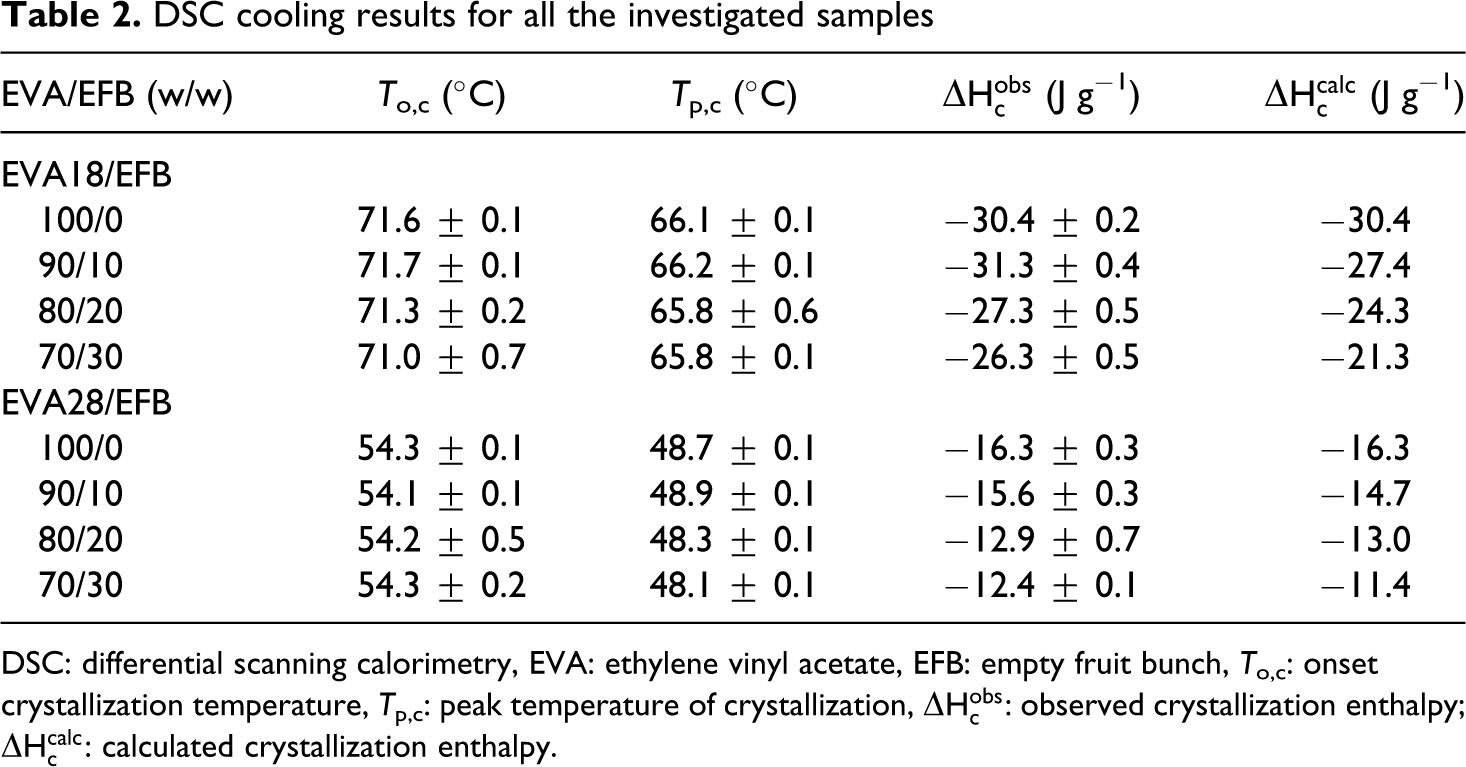
DSC cooling results for all the investigated samples
DSC: differential scanning calorimetry, EVA: ethylene vinyl acetate, EFB: empty fruit bunch, T
o,c: onset crystallization temperature, T
p,c: peak temperature of crystallization,
Figure 5 shows the DSC cooling curves of EVA18 and EVA28. The DSC curves show a single crystallization peak for both copolymers. The difference between the crystallization peaks of EVA18 and EVA28 is considerable, indicating that the VA content also influenced the crystallization behaviour of the polymers. EVA28 shows a single crystallization peak which is less intense than that of EVA18 and which appears at a lower temperature. This suggests that the VA groups reduce the stereoregularity of the PE backbone and restrict its crystallization. 24
The DSC heating curves of EVA18 and the EVA18/EFB composites show only one endothermic peak, similar to the one observed in Figure 4. The peak temperatures of melting show little change with increasing fibre content in the composites and could be regarded as being the same within experimental error (Table 1). This implies that the crystallite sizes were not observably influenced by the presence of EFB fibres or by increase in EFB fibre content. The observed melting enthalpy values are slightly different than the calculated enthalpies for the different composites. The calculated melting enthalpy values were determined according to Equation (1).

where ▵H
m,EVA is the experimentally observed melting enthalpy for the pure EVA, and
Thermogravimetric analysis
The thermogravimetric analysis (TGA) results of the EVA copolymers, EFB and the EVA/EFB composites, are shown in Figures 6 –8. The thermal stabilities of all the samples, summarized in terms of the temperatures at 10% and 70% mass loss, as well as the mass % residue at 600°C, are shown in Table 3. The TGA curves of the two EVA copolymers with different VA contents are shown in Figure 6. Both EVA18 and EVA28 show two degradation steps. The first step, which starts in the temperature range of 350–370°C, is attributed to the removal of the acetate groups. The second step around 443–470°C is due to the degradation of the PE backbone of the copolymer. 25 EVA18 is more thermally stable than EVA28 because of the larger amount of VA in EVA28, which increases the amorphous phase in the semicrystalline material. This is also clear from the T 10% and T 70% values for these two copolymers in Table 4. None of these copolymers show any residue at 600 °C.
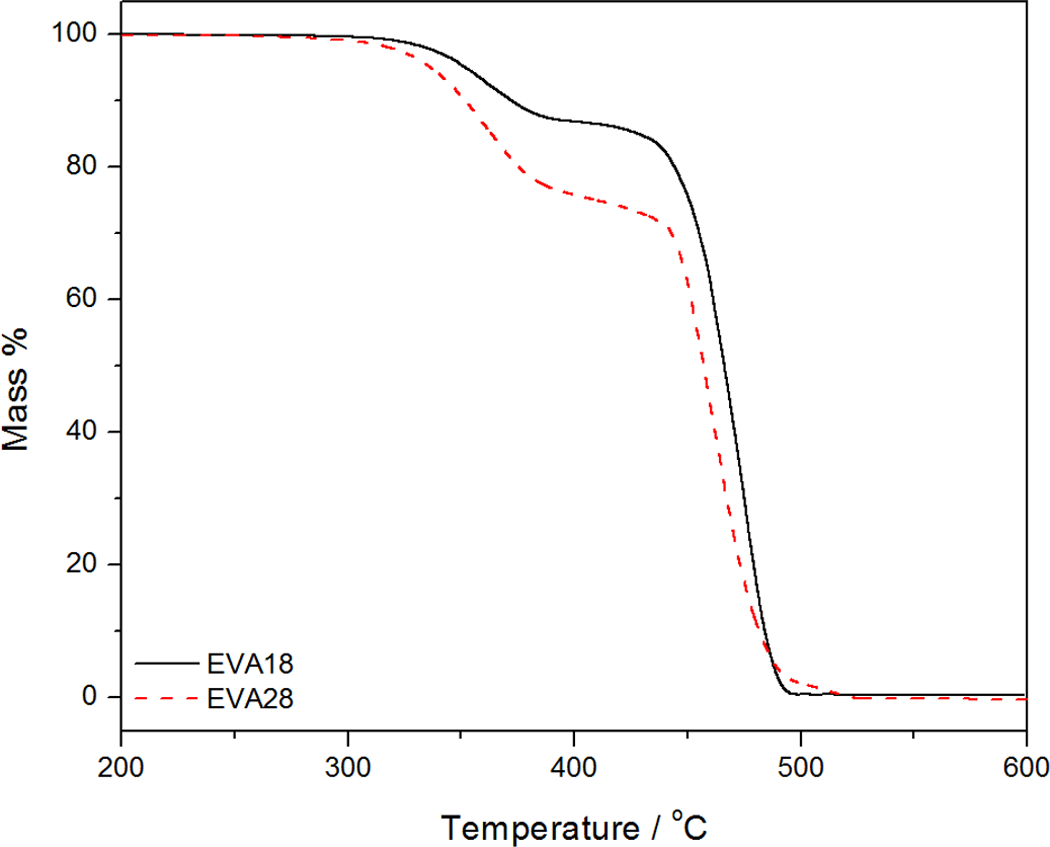
Thermogravimetric analysis (TGA) curves for the different ethylene vinyl acetate (EVA) copolymers.
TGA results for all the investigated samplesa
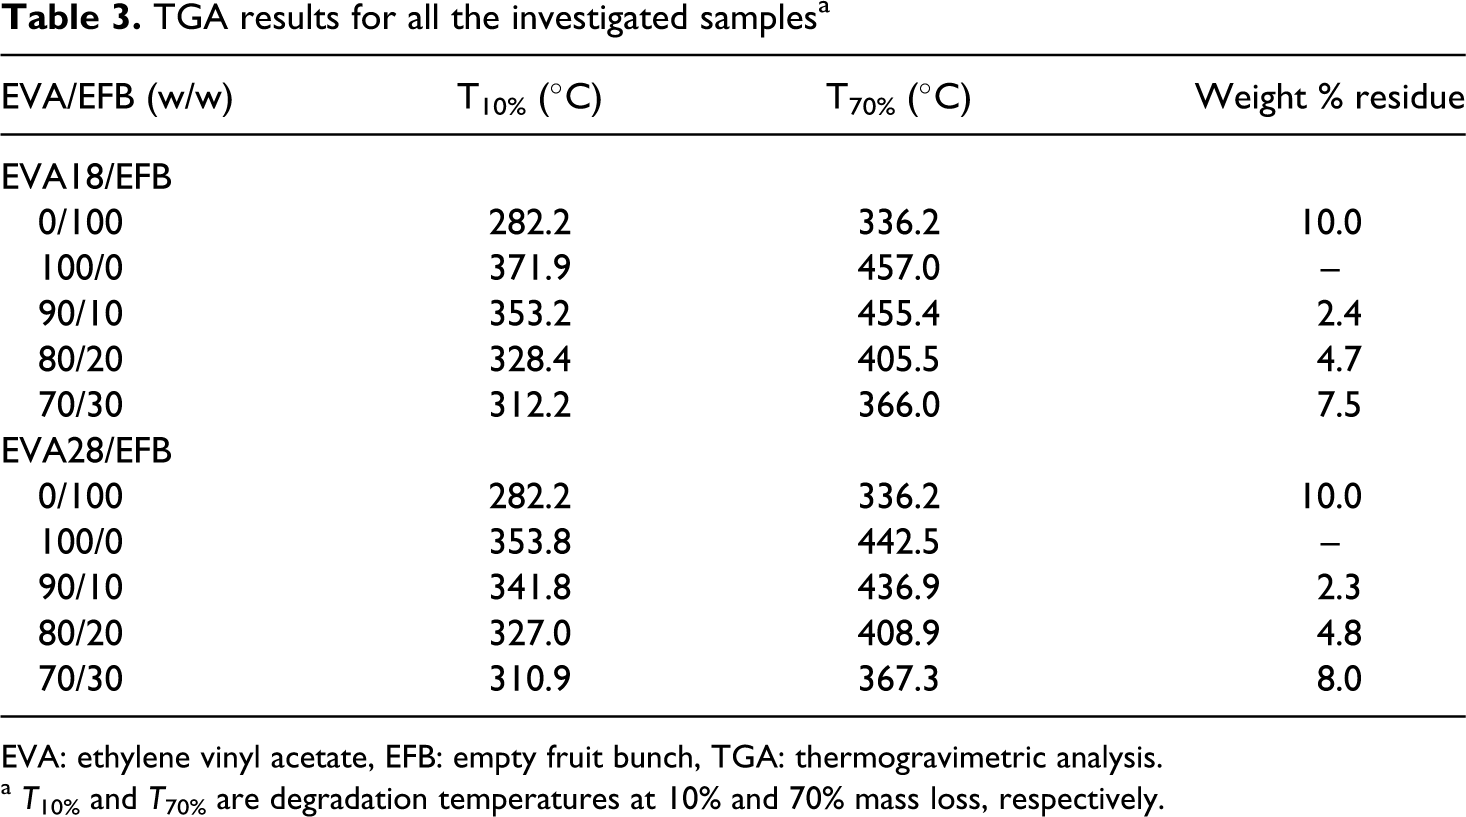
EVA: ethylene vinyl acetate, EFB: empty fruit bunch, TGA: thermogravimetric analysis.
a T 10% and T 70% are degradation temperatures at 10% and 70% mass loss, respectively.
Relaxation peak temperatures for the EVA copolymers and the EVA/EFB composites as determined from the tan δ curves
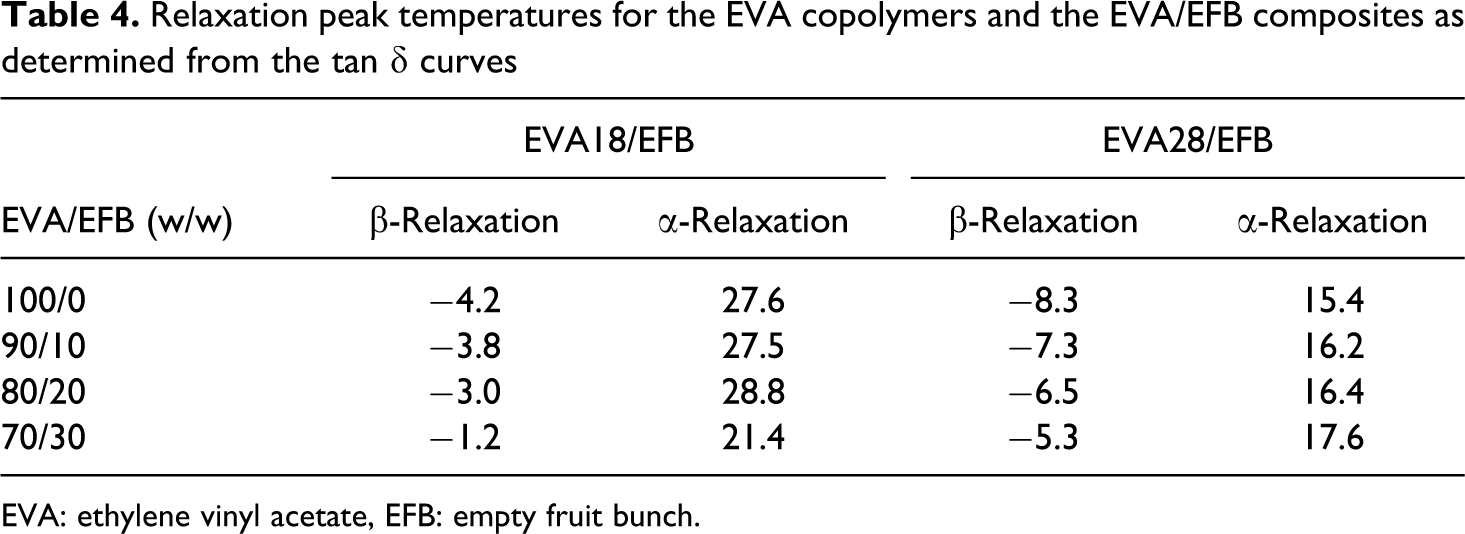
EVA: ethylene vinyl acetate, EFB: empty fruit bunch.
The TGA results of EVA18, EFB, and the EVA18/EFB composites are shown in Figure 7. It can be seen that the decomposition of EFB is characterized by four steps. The first step is related to the evaporation of water which occurs below 100°C. The second step starts at about 250°C and corresponds to the depolymerisation of hemicellulose, while the third step at about 350°C is due to the random cleavage of the glycosidic linkage of cellulose. The fourth step is a slow mass loss between 400 and 600°C and is associated with the degradation of lignin. 26 The EVA18/EFB composites also show four degradation steps. The first step corresponds to the evaporation of water, the second is an overlap of the removal of the acetate groups and the constituents of the EFB degradation in this temperature range, and the third step is due to the degradation of the PE backbone in EVA18. The fourth degradation step in the EVA18 composites at temperatures beyond 500°C is the same as the fourth step of EFB degradation. The presence of EFB generally decreases the thermal stability of the neat EVA samples. The first decomposition step, which is a combination of the deacetylation of EVA and fibre decomposition, moves to lower temperatures with increasing fibre content but still occurs at higher temperatures than the decomposition of pure fibre. The fibre decomposition seems to be retarded when mixed with EVA due to the higher thermal stability of the polymer. The slope of the decomposition step (which is equivalent to the rate of decomposition) between 450 and 500°C decreases with increasing fibre content. This is probably due to the presence of fibre char residue which seems to inhibit the EVA main chain degradation, or the diffusion of volatile degradation products out of the degrading sample.
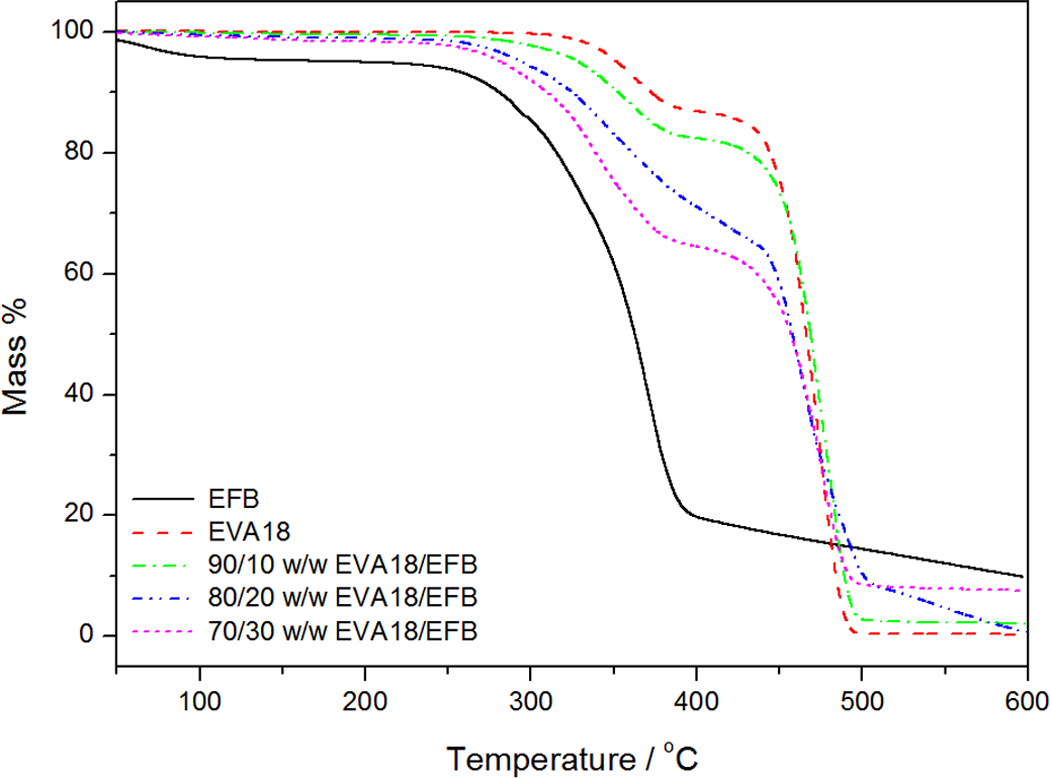
Thermogravimetric analysis (TGA) curves for empty fruit bunch (EFB), ethylene vinyl acetate (EVA)18, and the EVA18/EFB composites.
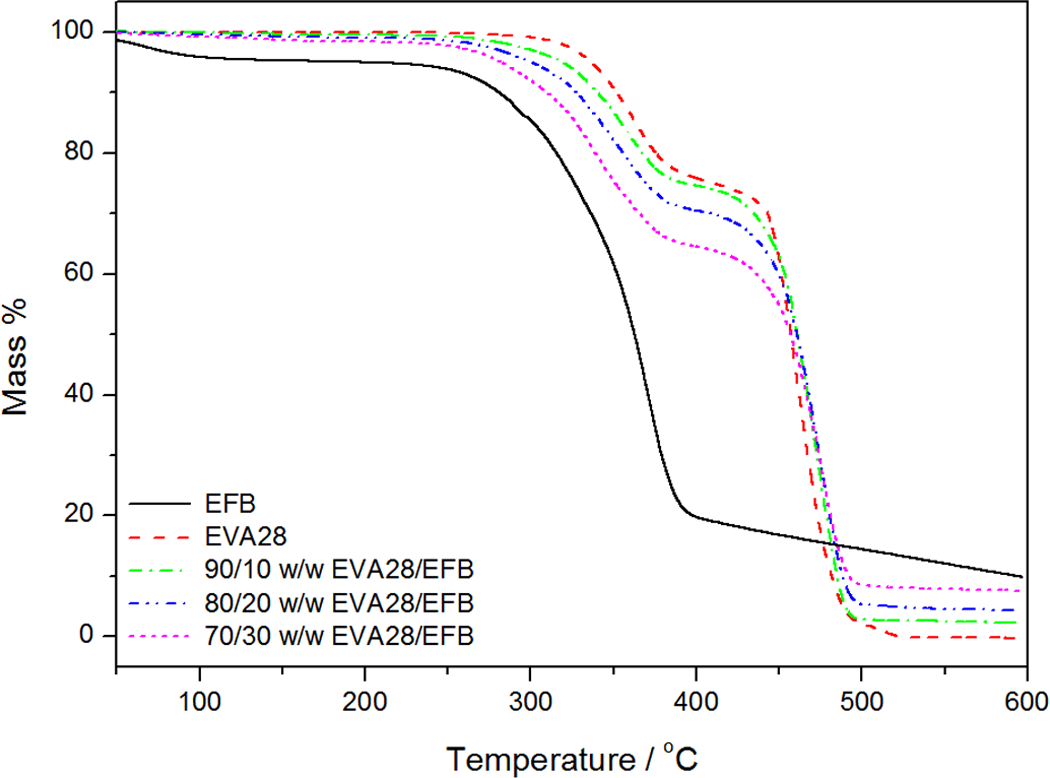
Thermogravimetric analysis (TGA) curves for empty fruit bunch (EFB), ethylene vinyl acetate (EVA)28, and the EVA28/EFB composites.
Figure 8 shows the TGA curves of EVA28, EFB, and the EVA28/EFB composites. The curves show the same degradation steps as were observed and explained for EVA18. There is not much of a difference in the decomposition rate of the last step between EVA28 and its composites; while in the case of EVA18, there was a clear decrease in the decomposition rate with increasing EFB content. The reason for this is not immediately apparent, but it could be related to polymer–fibre interactions that influenced either the mobility of free radicals formed during degradation or the rate of diffusion of volatile degradation products out of the degrading sample.
Dynamic mechanical analysis
Figure 9 shows the variation of tan δ with temperature for EVA18 and EVA28. A summary of the transition peak temperatures for all the investigated samples is shown in Table 4. EVA18 shows two distinct relaxations, a β-relaxation at −4.2°C and an α-relaxation at 28.0°C. The β-relaxation is attributed to the motion of chain segments of three or four methylene (–CH2) groups in the amorphous phase 27 and is known as the glass transition (T g). Below T g, the molecular chain segments are frozen, the damping is low, and little energy is stored for elastic deformations. In the rubbery region, the damping is high compared to the glassy state, because the molecular segments are free to move causing a decrease in stiffness, and excess energy is dissipated as heat. The α-relaxation is related to the motion of amorphous regions within the crystalline phase that is the reorientation of defect regions between crystals. 28 The α-transition can also reflect the relaxation of flexible chains of the VA groups present in the EVA copolymer chains. It can be seen from this figure that EVA28 has one well-resolved transition peak at about −8°C, which is the result of the glass transition in the polymer. The chain flexibility results in a lower T g because the energy for conformational changes is lower. The EVA28 seems to have more branching with more chain ends, resulting in more free volume that reduces the T g. The peak shoulder at approximately 15°C is due to the α-relaxation. There is a shift in the T g to lower temperatures (Table 4), with an increase in the VA content. This is explained in terms of the enhanced chain mobility of EVA due to the plasticizing effect of the flexible VA phase. The lower resolution and lower transition temperature of the α-peak in the EVA28 curve is related to the lower crystallinity of EVA28, since this relaxation is related to the amorphous material between the crystalline lamellae in a semicrystalline polymer.
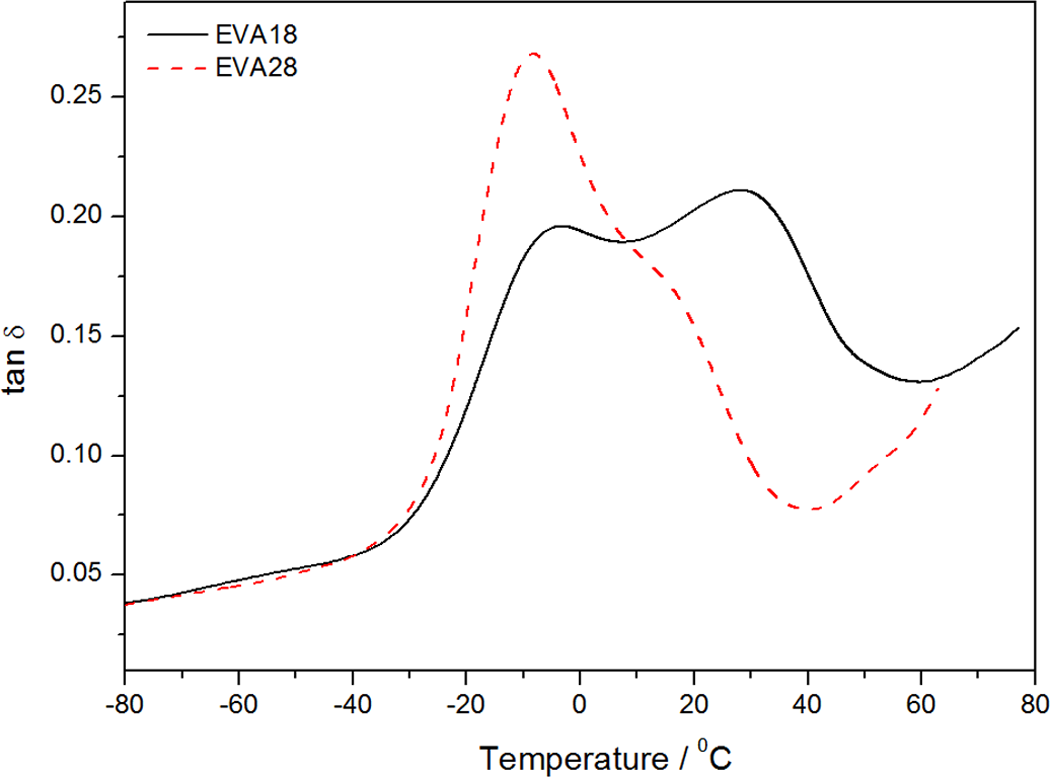
Comparison of tan δ as a function of temperature for pure ethylene vinyl acetate (EVA)18 and EVA28 copolymers.
Figure 10 shows the variation in tan δ with temperature for EVA18 and the EVA18/EFB composites. The T g of EVA18 is −4°C, and it observably increases with an increase in the EFB content (Table 4). This increase is due to the restricted chain mobility as a result of the interaction (however small) between the VA groups and the EFB fibre. There is a decrease in the total damping during the transitions with an increase in the EFB fibre content. This is due to the improved interfacial bonding of the EVA18/EFB composites which may be characterized by lower energy dissipation. 29 It was reported in the literature that the higher the damping at the interfaces, the poorer the interfacial adhesion. 30 The temperature of the α-peak, which is related to relaxations of the interlamellar amorphous polymer chains, is observably lower for the 30% fibre containing sample. This indicates that the crystallization of EVA on the fibre surfaces might have had an influence on the morphology and mobility of the interlamellar amorphous fraction of the polymer.
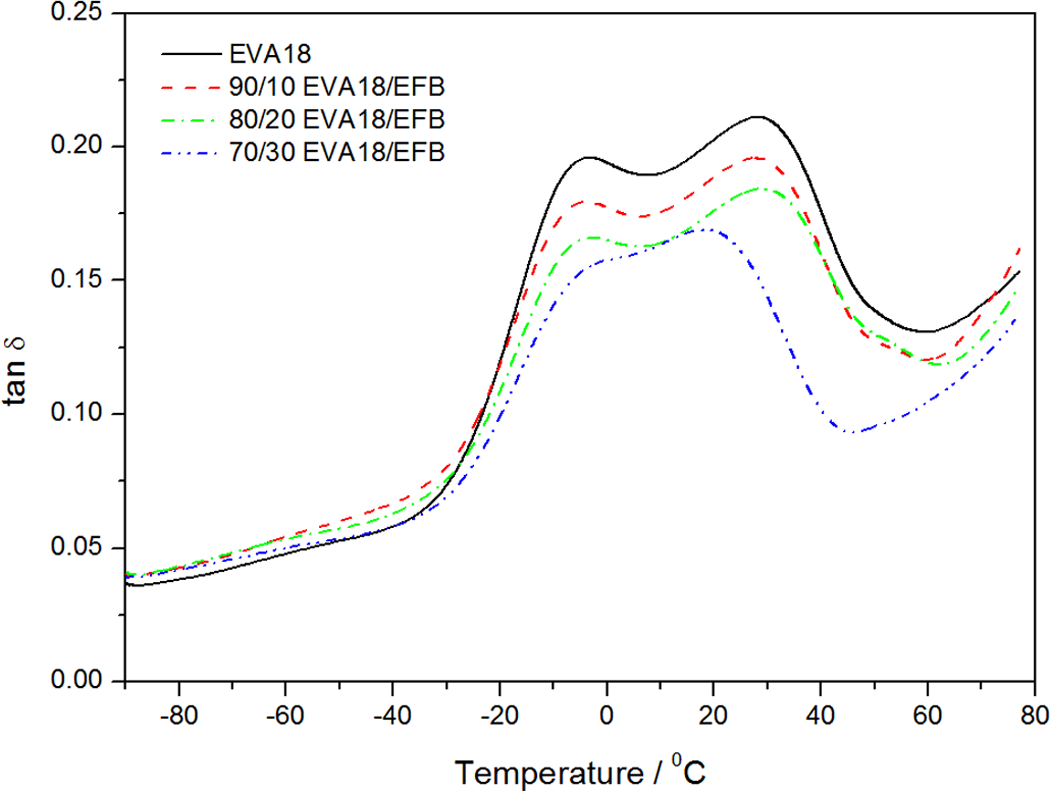
Dissipation factor as a function of the temperature for pure ethylene vinyl acetate (EVA)18 and the EVA18/empty fruit bunch (EFB) composites.
The variation of tan δ with temperature for EVA28 and the EVA28/EFB composites are shown in Figure 11. The glass transition temperature (T g) of EVA28 is around −8.0°C, which corresponds to the β-relaxation of the material. The T g generally increases with increasing fibre content in the composites. This could be explained in a similar way as for the EVA18 samples. However, the intensity of the β-relaxation peak decreases with increasing EFB content, which indicates that the energy dissipation of the system decreases due to the incorporation of EFB in the polymer matrix. 31 The reason for this has also been explained above. The α-relaxation is observed as a shoulder around 20–24°C and is associated with the crystalline fraction of the polymer. The α-relaxation peak in the curves for EVA28 and its composites is less intense than the β-relaxation peak, compared to the curves for EVA18 and its composites. This is due to the lower crystallinity of EVA28. At about 50°C, there seems to be a third relaxation, which may be related to the α′-relaxation. This has been explained as being the result of the slippage between crystallites during heating of the sample. 31
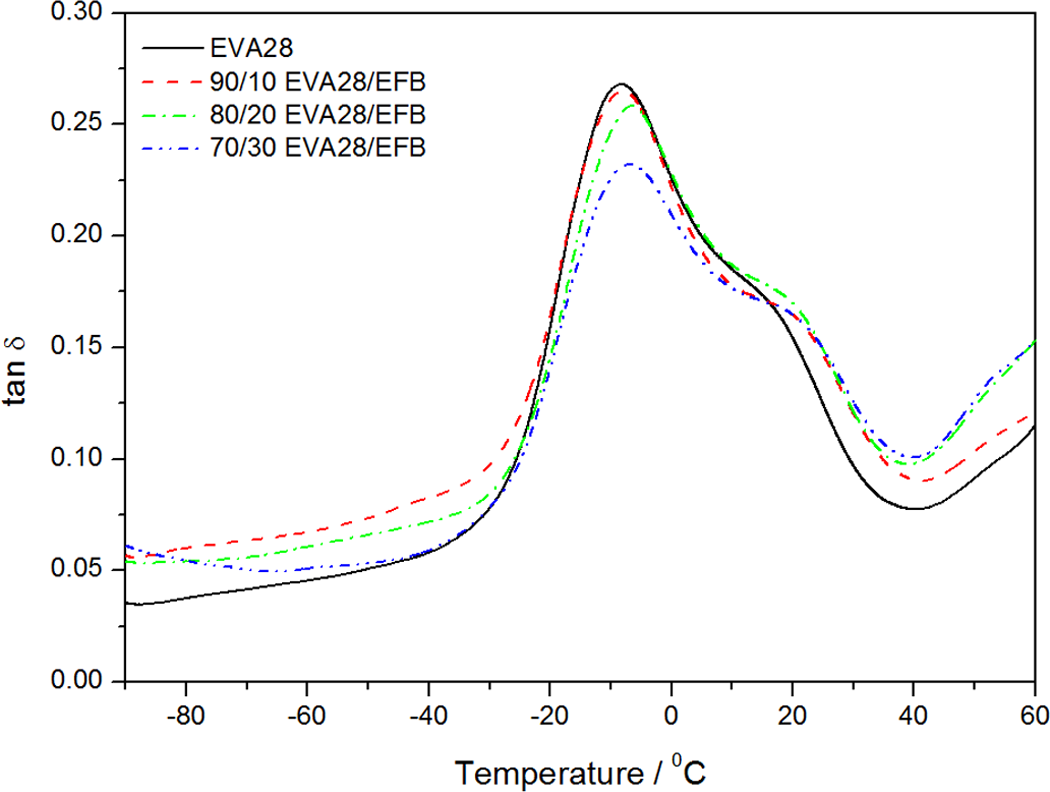
Tan δ as a function of the temperature for pure ethylene vinyl acetate (EVA)28 and EVA28/empty fruit bunch (EFB) composites.
Tensile properties
The tensile properties of all the investigated samples are summarized in Table 5. For the pure polymers, the EVA with lower VA content has a higher crystallinity and better mechanical properties such as stress at break and Young’s modulus but lower elongation at break. The main reason for the better tensile modulus and tensile strength at break values for EVA18 is its significantly higher crystallinity. EVA28 has a larger elongation at break value than EVA18 because of its larger amorphous fraction which increases the extent of chain flexibility, as a result of which the polymer chains can slip more easily and be oriented in the direction of the applied stress. Both these polymers show strain hardening, but this effect is more predominant in the case of EVA18. Since the rearrangement of the crystalline part of a semicrystalline polymer through a tilt, slip and twist process during drawing 32 is one of the main contributors to strain hardening, EVA18 is expected to show a larger extent of strain hardening because of its higher crystallinity. Both the EVA copolymers do not display a clear yield point and also no neck formation occurs during stretching (Figure 12). The incorporation of the EFB fibres observably reduced the strain hardening of the materials (Figures 13 and 14). This suggests that the interaction between the fibre and the polymer inhibited the orientation of the chains in the amorphous parts of the polymer and the reorientation of the chains in the crystalline parts.
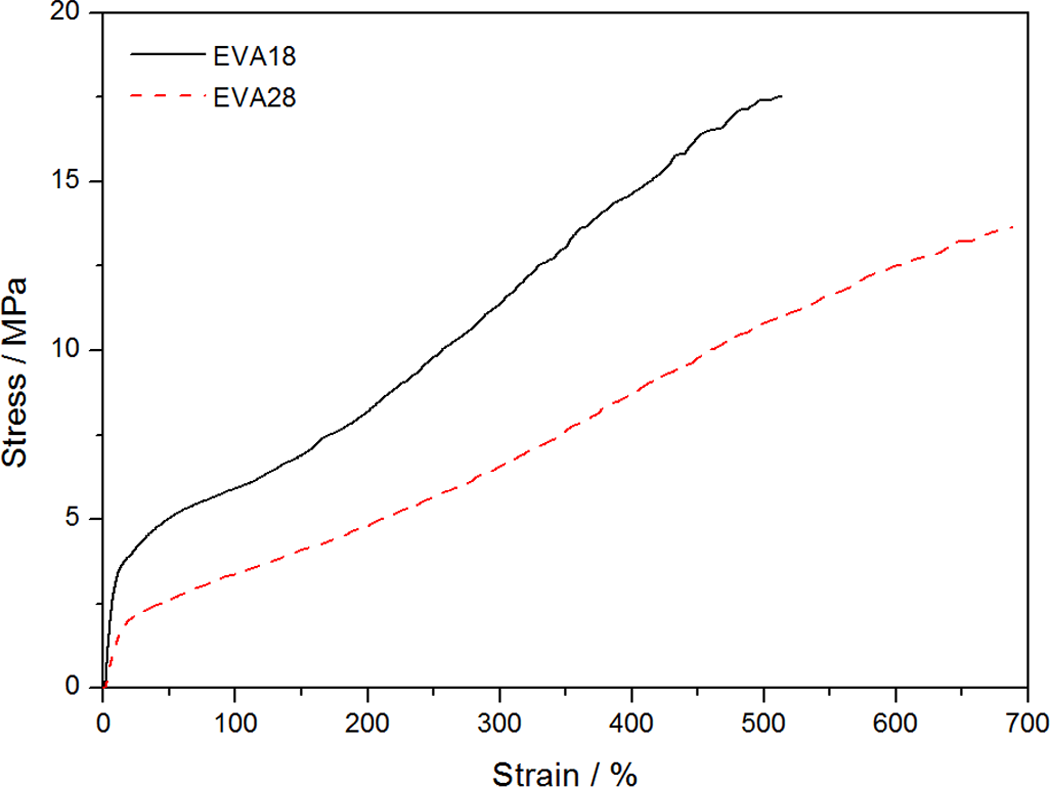
Stress–strain curves for ethylene vinyl acetate (EVA)18 and EVA28.
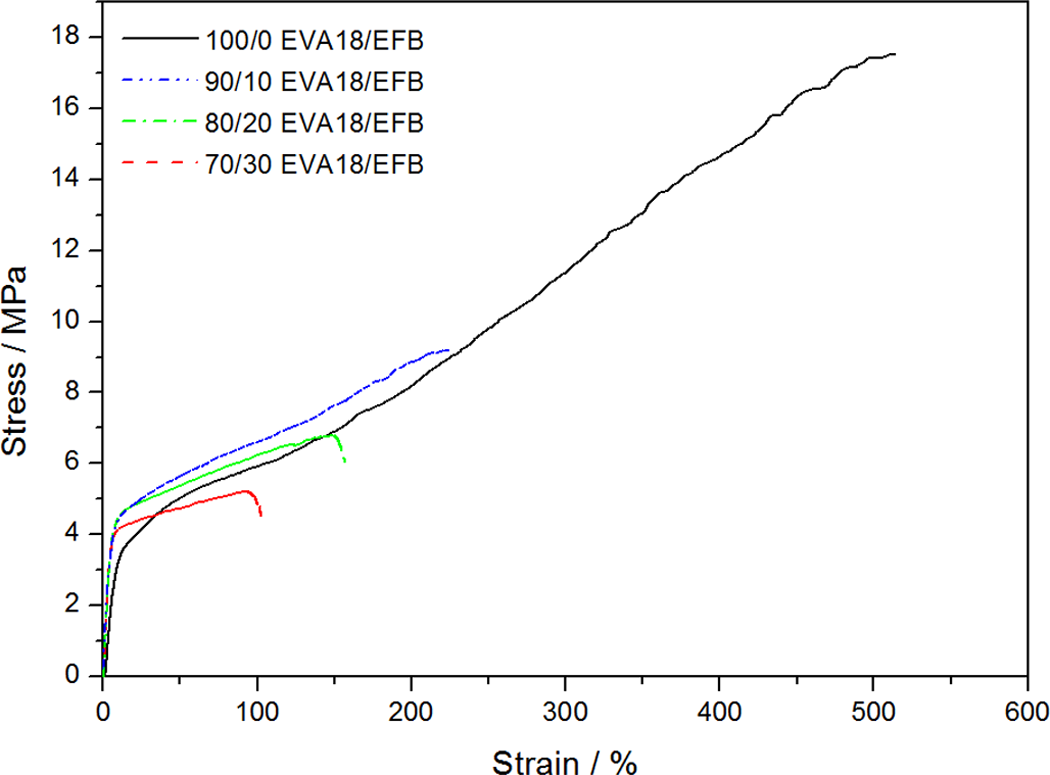
Stress–strain curves for ethylene vinyl acetate (EVA)18 and its composites.
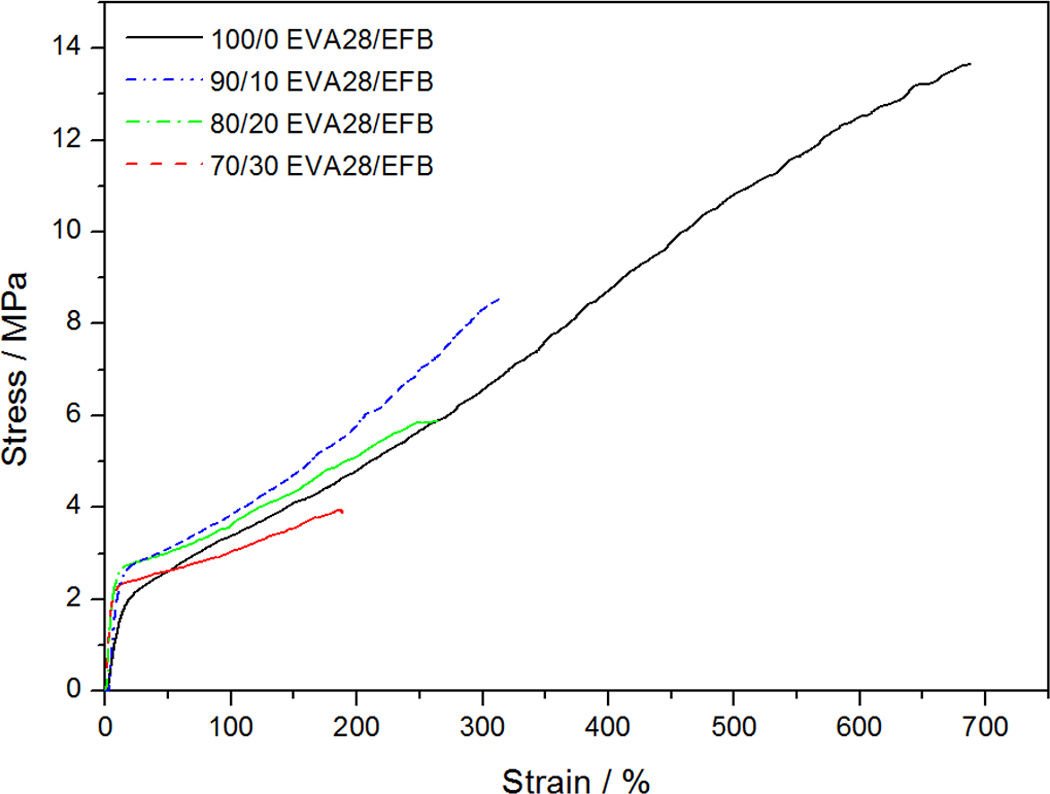
Stress–strain curves for ethylene vinyl acetate (EVA)28 and its composites.
Summary of tensile properties for all the samples
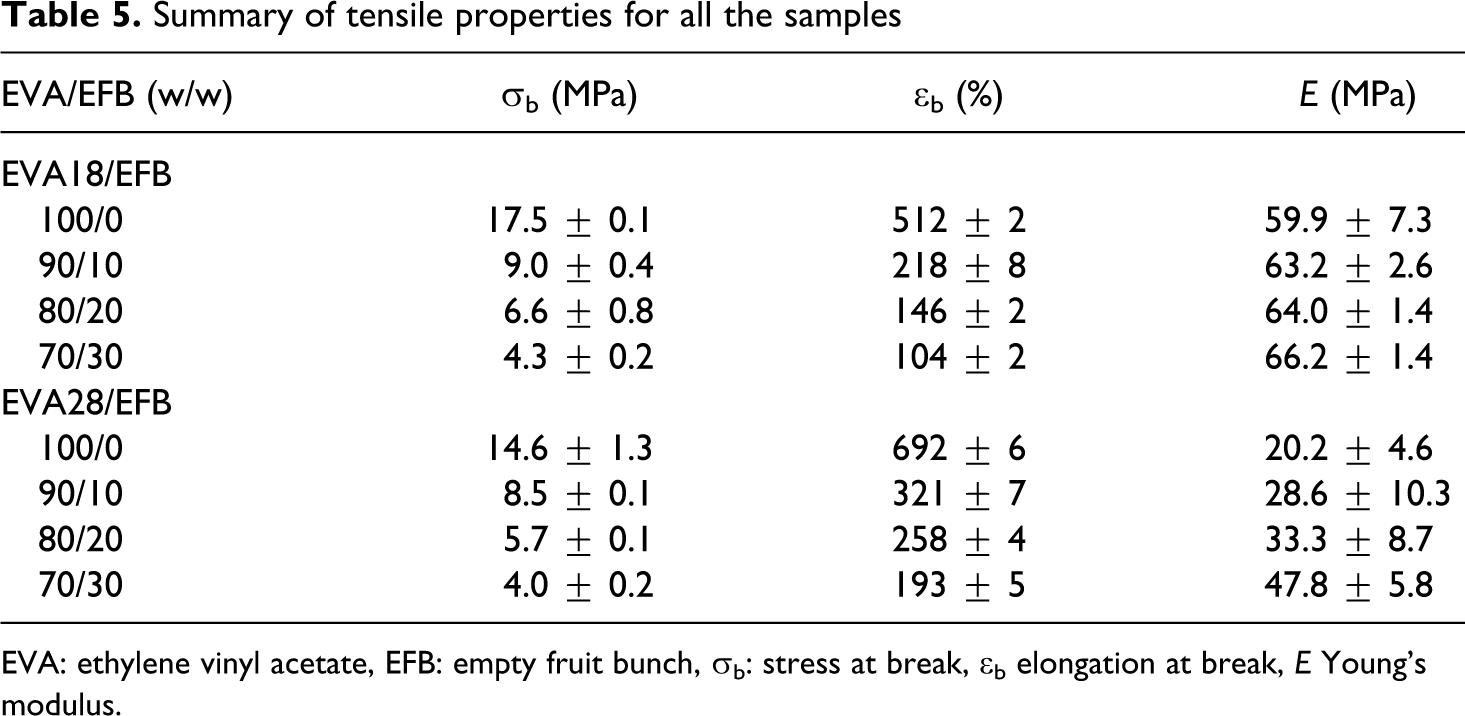
EVA: ethylene vinyl acetate, EFB: empty fruit bunch, σb: stress at break, ∊b elongation at break, E Young’s modulus.
The values in Table 5 show that the incorporation of EFB fibre significantly decreased the tensile stress at break of both the polymers. This could be associated with the fact that the dispersion and the length of the EFB fibre were not optimal in order to give good properties. Short fibres normally reduce the tensile strength at break, because they act as stress concentration points where cracks and crazes start to develop. The more the short fibres are, the higher is the possibility of crack propagation at lower stresses, giving rise to reduced tensile strengths at break. Another possible reason is the insufficient adhesion between the EFB fibre and the EVA copolymers, as observed from SEM. The presence and amount of fibre had a similar effect on the stress at break of EVA18 and EVA28, despite the differences in the VA content of the two polymers. The reason for this is not immediately apparent, but it is possible that the difference in the strength of the interactions between EVA18 and EFB and EVA28 and EFB is not significant enough to allow improved stress transfer between EVA28 and EFB.
The elongation at break shows a similar dependence on the EFB fibre content in the composites for both EVA18 and EVA28 (Table 5). It seems as if the possible improved interaction between EVA28 and the EFB fibre does not give rise to significantly improved stress transfer between the polymer and the fibre. The elongation at break decreases noticeably with increasing fibre content. The reasons for this are the same as those discussed above for the decreasing tensile stress at break with increasing fibre content.
The values in Table 5 show that EVA18 has a higher modulus than EVA28. Since Young’s modulus of neat polymers depends on the degree of crystallinity, it is expected that the EVA28 will have a lower modulus. The modulus of the EVA28 samples increases significantly with increasing EFB content, most probably because of an improved interaction between EVA28 and EFB, while that of the EVA18 samples increases only slightly. However, it seems as if the improvement in the interaction between EVA28 and EFB was not significant enough to overcome the inherent weak properties of EVA28. The most probable reasons for the slight increase in the case of EVA18 are (i) the insufficient wetting of the fibre by the polymer and (ii) the already high modulus of EVA18 as a result of its higher crystallinity.
Conclusions
Most of the reported results show that both EVA18 and EVA28 to some extent interacted with the EFB fibre, but this interaction has little effect on the thermal and mechanical properties of the composites. The thermal properties were mostly influenced by the extent of crystallinity of the polymer matrix. The differences between the interaction of the fibre with EVA18 and EVA28, respectively, were mostly evident in temperature shifts of the β- and α-relaxation peaks, the development of an α′-relaxation peak in the case of the EVA28 composites, and changes in the energy dissipation during these transitions.
The presence and amount of EFB fibre influenced the stress and strain at break of EVA18 and EVA28 in a similar way. Although EVA28 should interact more strongly with the fibre than EVA18, it could not be seen in the influence of the fibre on these properties. The influence of EFB on the Young’s modulus was more significant in the case of EVA28. It seems as if the improved interaction between EVA28 and EFB allowed enough stress transfer for the Young’s modulus to improve more significantly in this case.
In summary, it may be concluded that EVA18 seems to have better mechanical and thermal properties than EVA28. Although better interaction between EVA28 and EFB was expected, and observed in the SEM pictures, this interaction was not significant enough to produce composites with better properties than the comparable EVA18 composites, because of the inherent weak properties of EVA28. In this case, probably it is better to recommend the use of EVA18 for the preparation of EVA/EFB fibre composites.
Footnotes
Acknowledgements
The National Research Foundation and the University of the Free State in South Africa are acknowledged for financial support of this project. Prof Azman Hassan from the Department of Polymer Engineering at the University of Technology Malaysia is acknowledged for supplying the EFB fibre.
Funding
This research received funding from the National Research Foundation in South Africa.