
Abstract
Polyethylene (PE) nanocomposite samples were prepared with Cloisite 25 A, 30B, and 93 A and Nanofil 5 and 3000 nanofillers. The amount of modified Na+ montmorillonite (MMT Na+) was fixed to 5 wt%. For the compounding of PE matrix and nanofillers, two different compounding equipments were used, KO Kneader Buss and APV twin-screw extruder. In all samples, maleic anhydride-modified PE (PEMa) was added as a compatibilizer. The content of PEMa in mixtures was always 5 wt%. The level of MMT exfoliation in the nanocomposite systems was studied by X-ray diffraction and by transmission electron microscopy observations. The properties of samples were evaluated by dynamical mechanical analysis (E* modulus at 30°C) and by the measurement of tensile properties (stress and strain at break). Because of the possibility of usage of prepared materials in packaging industry, barrier properties were measured with focus on oxygen, carbon dioxide, and water vapor permeability. The influence of two different used compounding equipments on the prepared nanocomposite samples of PE nanocomposites was discussed.
Introduction
Nowadays, it is very well known that nanocomposite material represents a material in a polymer area, where filler particles in nano-sizes are homogenously dispersed in a polymer matrix. This type of fillers has taken a considerable position in preparing filled materials in the last decade either in polar polymer or in nonpolar, such as polyethylene (PE) or polypropylene. A study of polymer nanocomposites involves either the own preparation process or an observation of phenomena, which take place in nanocomposite properties. What is very important for filled materials generally is in the same way important for nanocomposites. Interactions between polymer matrix and filler particles have a significant importance in polymer/clay nanocomposites. Clay nanoparticles can have a function, for example, as a novel flame retardant [1–4] or they can cause increased dimensional stability. Later, also barrier properties are being studied [5–7]. Although some of these improvements can be achieved with conventional fillers (mineral or glass), the content has to be quite high (20–40 wt%) compared to typical 3–5% charge in case of nanoclay.
Layered nanoparticles come especially from minerals of the group of layered clays. Currently, one of the widely studied and used one is montmorillonite (MMT). Montmorillonite belongs to the group of the structure 2:1 minerals. Its structure is being described as one aluminium oxide octahedral layer sandwiched by two layers of silicon oxide [8,9].
The natural montmorillonite disintegration into individual platelets in nanoscale demands two main steps. The first one is a modification of MMT by an intercalation (organofilization) of certain organic compounds. Intercalation is an organic compound (i.e., octadecylamine [10,11] or quaternary ammonium salts [12]) insertion between MMT layers. When the distance of layers becomes higher, the molecular bonds become weaker and another step – compounding with polymer – than the energy for a layer separation is lower [13].
Two main modes of organofilization were published. The first one is based on the ion-exchange reaction where the inter-layer cations (usually sodium) are replaced with onium organocations. The most common onium ions are quartenary ammonium salts or acid salts of amines [14,15]. Another mode is based on the ion–dipole treatment, where organic molecules containing a sufficiently strong dipole (or more dipoles) coordinate to the sodium in the gallery space [16,17].
The mixing of modified montmorillonite with the polymer (compounding) is usually performed in melt in a screw compounder. To evaluate the nanocomposite morphology, two main expressions are used – intercalation and delamination, exfoliation, respectively. The intercalated level is the state wherein the nanocomposite well-ordered multi-layered structures are noticeable. The extended polymer chains are inserted into an interlayer. The delaminated or exfoliated state represents the structure with the individual silicate layers. They are homogenously dispersed in a polymer. Actually, in a polymer matrix, both structures can co-exist together [18].
Generally, the compounding equipment has a big influence on the montmorillonite particles exfoliation in either polar polymer matrix (PA) or nonpolar one (polyolefins). Unfortunately, the MMT exfoliation is not that simple, as it was expected. And the connection of highly polar nanofiller layers with nonpolar PE matrix brings extra problems. It is the reason, why studies concerning this topic have been published during several past year [7,19,20]. The better level of MMT exfoliation can be achieved by higher amount of energy brought in a system. This can be achieved by the starting of compounding in a single screw when one can study the effect of increasing screw speed. The next step could be twin-screw extruder or even special types of very high efficient extruders (with conic screws, etc.) [21].
Preparation of PE nanocomposites because of their high hydrophobicity also should be performed with a compatibilizer in order to improve the affinity of the modified MMT and a polymer matrix. Currently, maleic anhydride-modified polypropylene is being studied and widely used [20–23].
The aim of this study was to investigate the process of MMT exfoliation by transmission electron microscopy (TEM) and X-ray diffraction (XRD) in PE matrix when the two different types of compounding equipments were being used. Then, the mechanical properties were evaluated with focus on modulus by DMA, tensile strength, and barrier properties.
Experimental
Commercial modified MMT nanofiller, Cloisite 25A, 30B, and 93A, from Southern Clay Products, Inc., and Nanofil 5 from Südchemie Germany were used as nanofillers. Differences among individual nanofillers lie in the different types of intercalant agents (details can be found on the websites of above-mentioned companies). All samples were prepared with 5 wt% of MMT. The polymer/clay composites were compounded with KO Buss kneader D = 30 mm, L/D = 18, at the temperature of 180°C and in twin-screw laboratory extruder APV MP19-25TC from APV Baker, D = 19 mm, L/D = 25 at the same conditions. After pelletization of the strands, the pellets of mixtures were pressed into the sheets. The achieved level of exfoliation of the prepared sheets after a compounding process was measured by XRD. Compounded samples were analyzed by XRD powder diffractometer (INEL) equipped with the curved position sensitive detector CPS 120 (120° 2θ), reflection mode with a germanium monochromator (Cuα1 radiation). Samples were placed in a holder and exposed for 2000 s.
The data of DMA measurement.
Transmission Electron Microscopy
For the transmission electron microscopy (TEM; JEM 200CX), the specimens were cut using Leica cryo-ultramicrotome at sample temperature −100°C and knife temperature −50°C to obtain ultra-thin sections with the thickness approximately 50 nm and an acceleration voltage of 100 kV was used.
Barrier Properties
PE/Cloisite nanocomposite-molded films with the thickness about 50 µm were used for the measurement carried using the device for gas permeability with a pressure pickup LMP 150 (made in Tesla Rožnov, Czech republic), at the temperature 25°C and the hypertension 0.4–0.6 MPa. On this device, oxygen and carbon dioxide permeability coefficient measurements were carried out.
The water vapor permeability was measured in the agreement with the ASTM E 95-96 – Standard Test Methods for Water Vapor Transmission of Materials. Out measurement was carried out at 30°C and 50% relative humidity.
Discussion
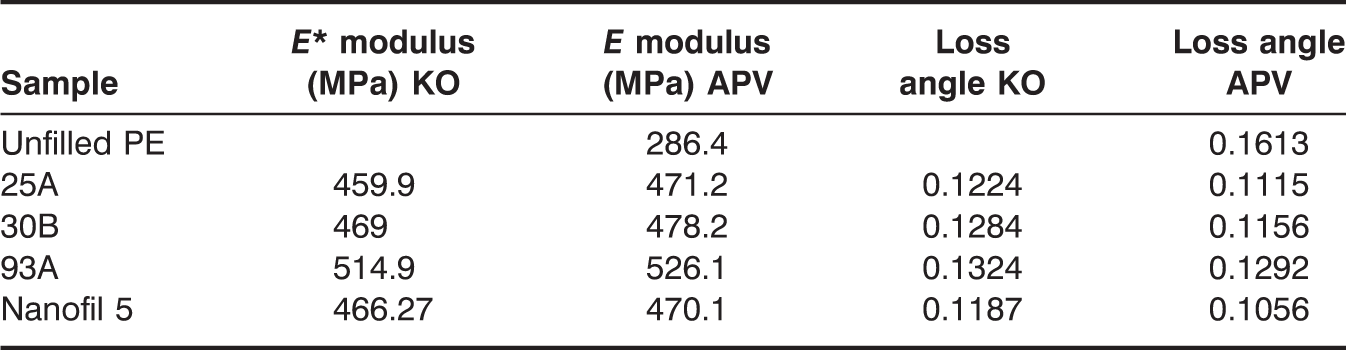
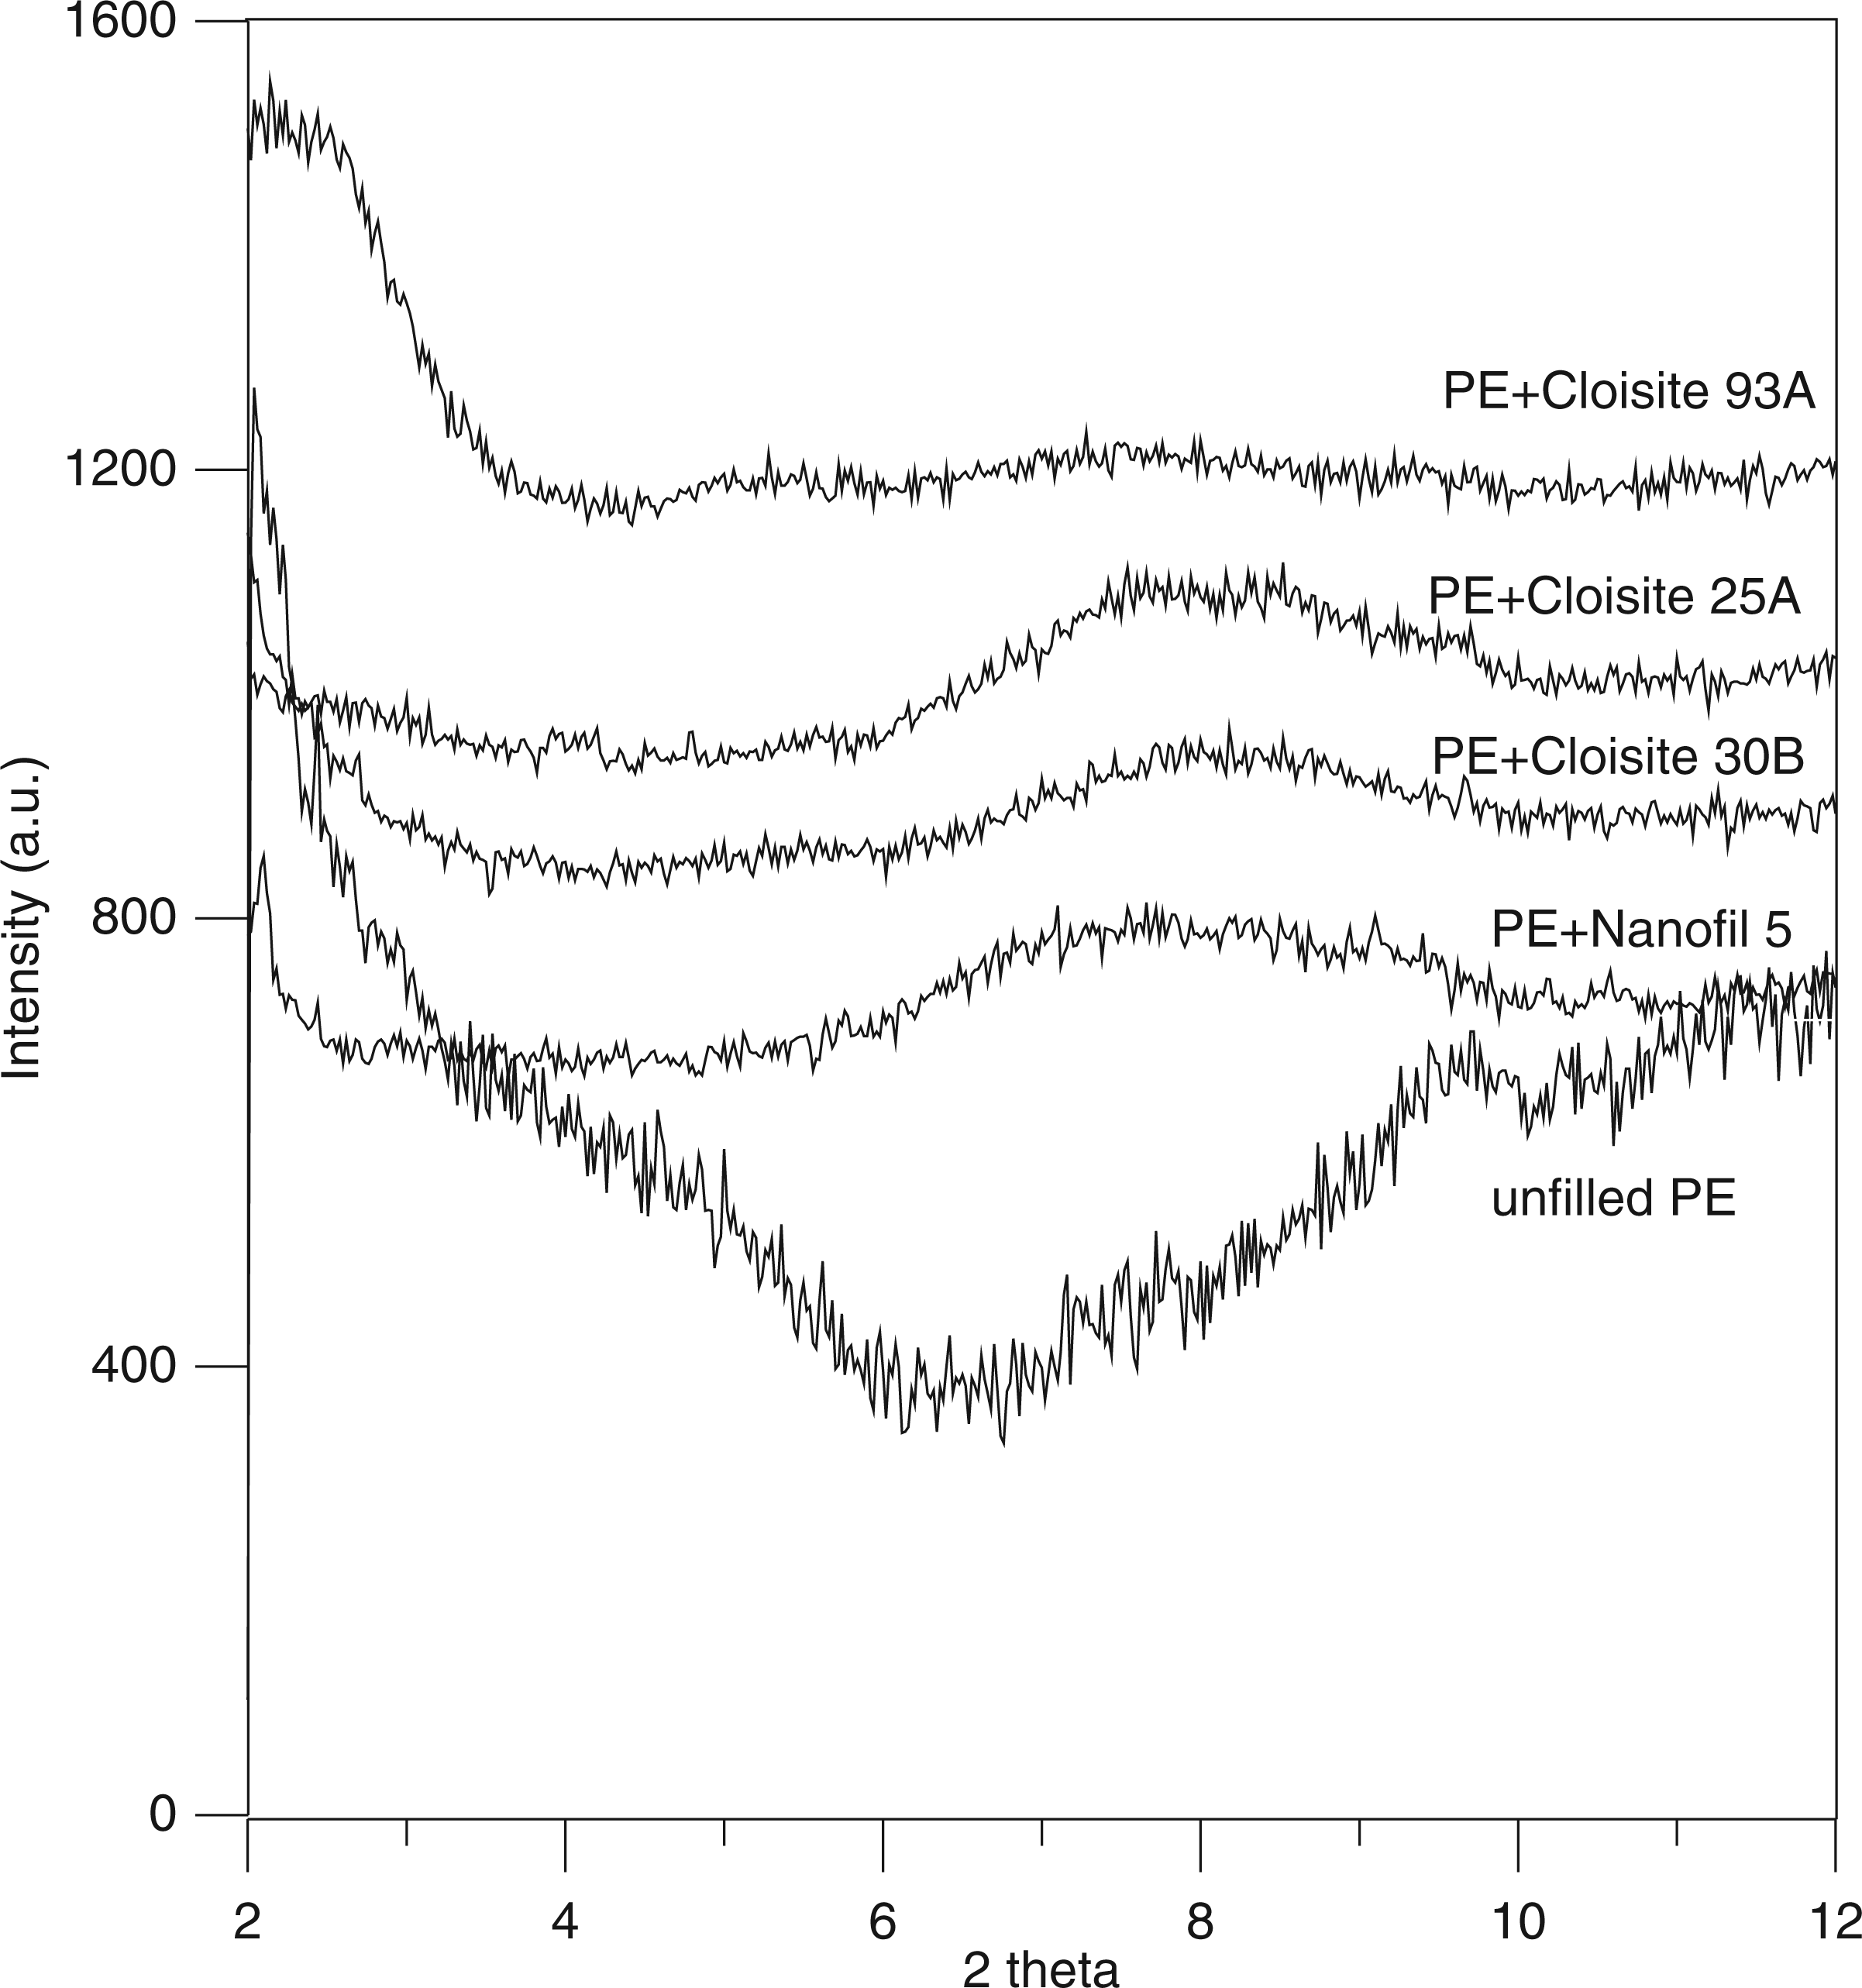
In order to compare the influence of different compounding devices on the level of exfoliation, the XRD technique was used. Figure 1 shows XRD patterns of samples prepared by KO Buss kneader. In all cases, it is possible to notice that the exfoliation of MMT particles did not happen completely. In the comparison with the pattern of unfilled PE, all other curves exhibit peaks with various heights and peak positions, which belong to the nonexfoliated montmorillonite agglomerates. The patterns of samples filled by Cloisite 93A and Nanofil 5 even exhibit the next broadening peak. Thus, as it was said, already from this first observation, it can be concluded that MMT here is not well exfoliated. Figure 2 shows the patterns of nanocomposite samples prepared on APV twin-screw extruder. The shape of patterns here is completely different from those in Figure 1. The noticeable maxima are present only in two shown patterns. However, they are not high and sharp. Moreover, in the area between 2.5° and 7°, the curve is flat without any significant peaks. It indicates that the level of exfoliation after the compounding in APV achieved much higher level. To show the difference more clearly, two selected fillers are plotted in one graph (Figure 3). The curves belonging to samples prepared in APV device are almost without any peak – there are no measurable multilayer regularly arranged structures. XRD analysis has indicated better mixing in twin-screw extruder. To confirm these results, we had carried out also TEM observations of the structures.
XRD patterns of PE/clay samples (5% of MMT loading) prepared in KO kneader Buss. XRD patterns of PE/clay samples (5% of MMT loading) prepared in APV twin-screw extruder. XRD patterns of PE/clay samples (5% of MMT loading) prepared in KO kneader Buss and APV twin-screw extruder – the comparison.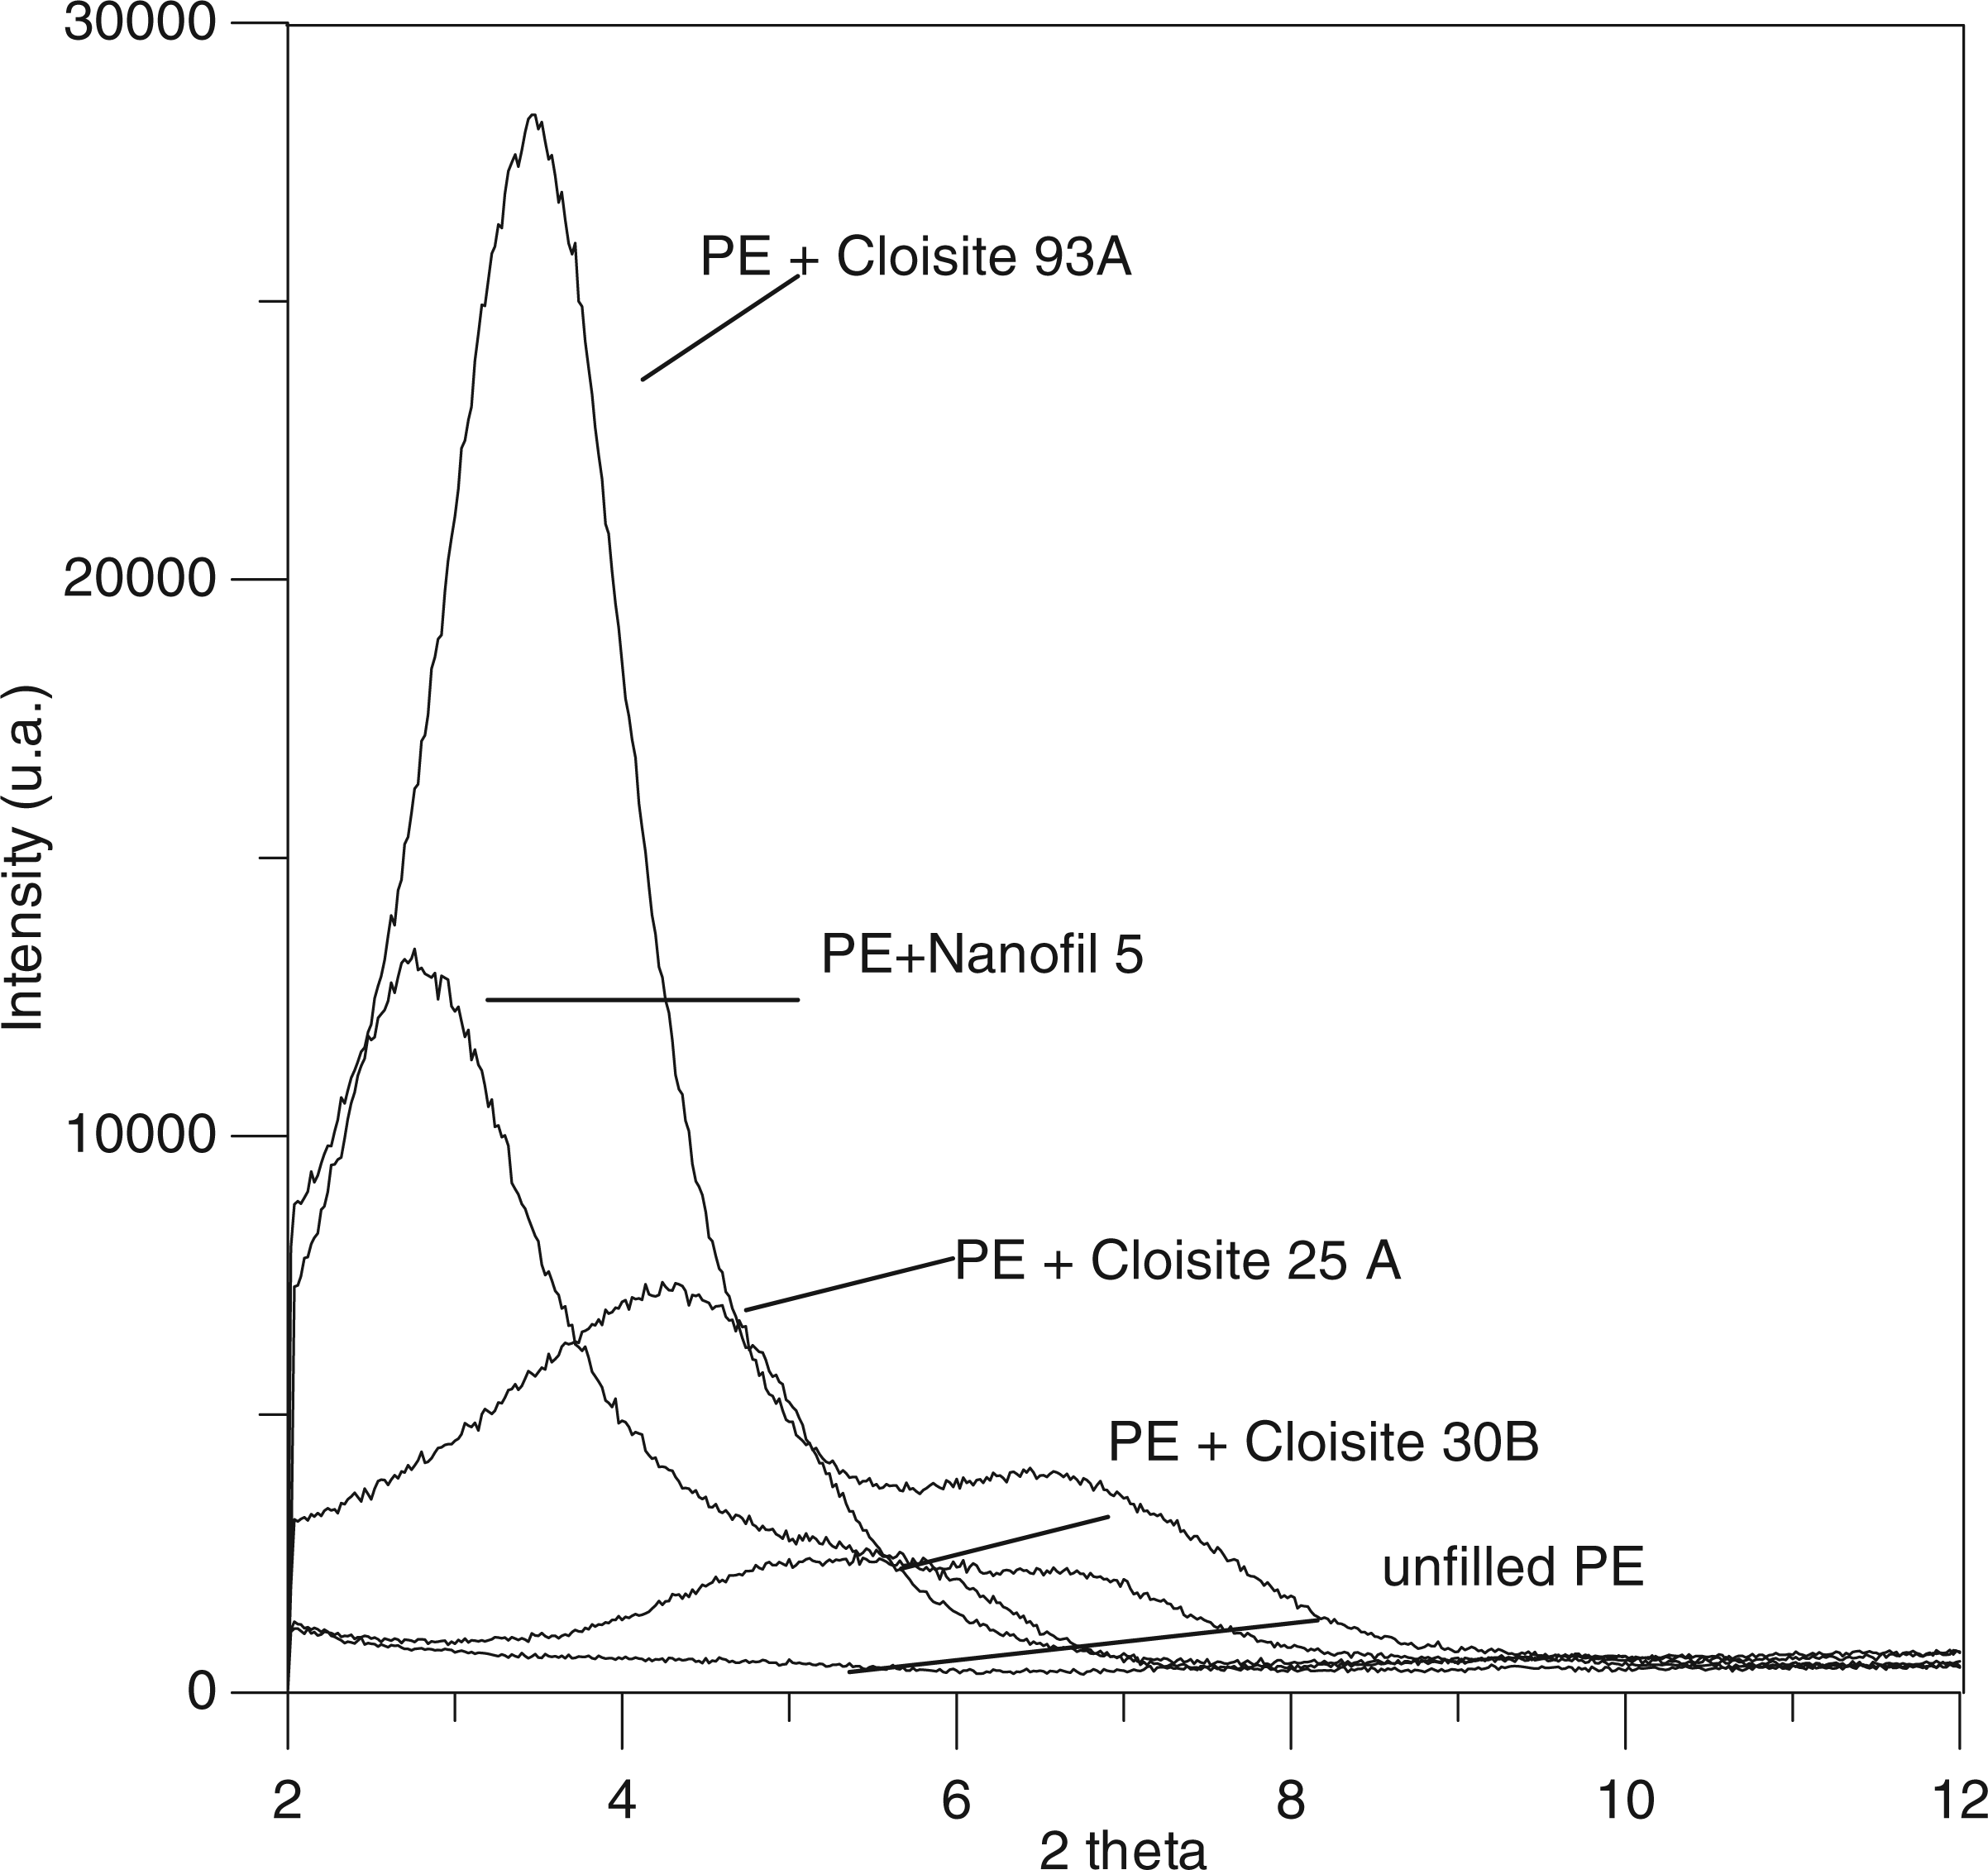
TEM allowed us to obtain the images of the sample morphology in two different magnifications. These images are shown in Figures 4(a), (b) and 5(a), and (b) for PE/Cloisite 25A composite. The first pair of TEM images (Figures 4 and 5) belongs to the samples of nanocomposite PE/Cloisite 25A, (a) shows the sample prepared by compounding in KO Buss, (b) shows the images of sample prepared by APV extruder. It is possible to see clearly the bigger MMT agglomerates in case of KO Buss kneader preparation. The size of montmorillonite particles in figure b is noticeably lower. The same trend confirms the second pair of TEM images with higher magnification (Figure 5(a) and (b)). The thickness of MMT particle in figure b (APV extruder) is significantly smaller; it is close to tens of nanometer. The similar situation is possible to describe in the case of the next used nanofillers, Cloisite 93 A and Nanofil 5 (Figures 6 and 7(a) and (b)). In both cases, it is possible to recognize in the images the presence of bigger and thicker (with more MMT layers together, only intercalated, not exfoliated) particles of clay nanofiller for the samples prepared in KO kneader Buss. In contrast, the particles in the samples compounded in APV device, the particles are smaller with the thickness going to the particular MMT layers dispersed in the PE matrix.
TEM images of the sample PE/Cloisite 25A prepared in: (a) KO Buss and (b) APV twin-screw extruder. TEM images of the sample PE/Cloisite 25A prepared in: (a) KO Buss and (b) APV twin-screw extruder (higher magnification). TEM images of the sample PE/Cloisite 93A prepared in: (a) KO Buss and (b) APV twin-screw extruder (higher magnification). TEM images of the sample PE/Nanofil 5 prepared in: (a) KO Buss and (b) APV twin-screw extruder (higher magnification).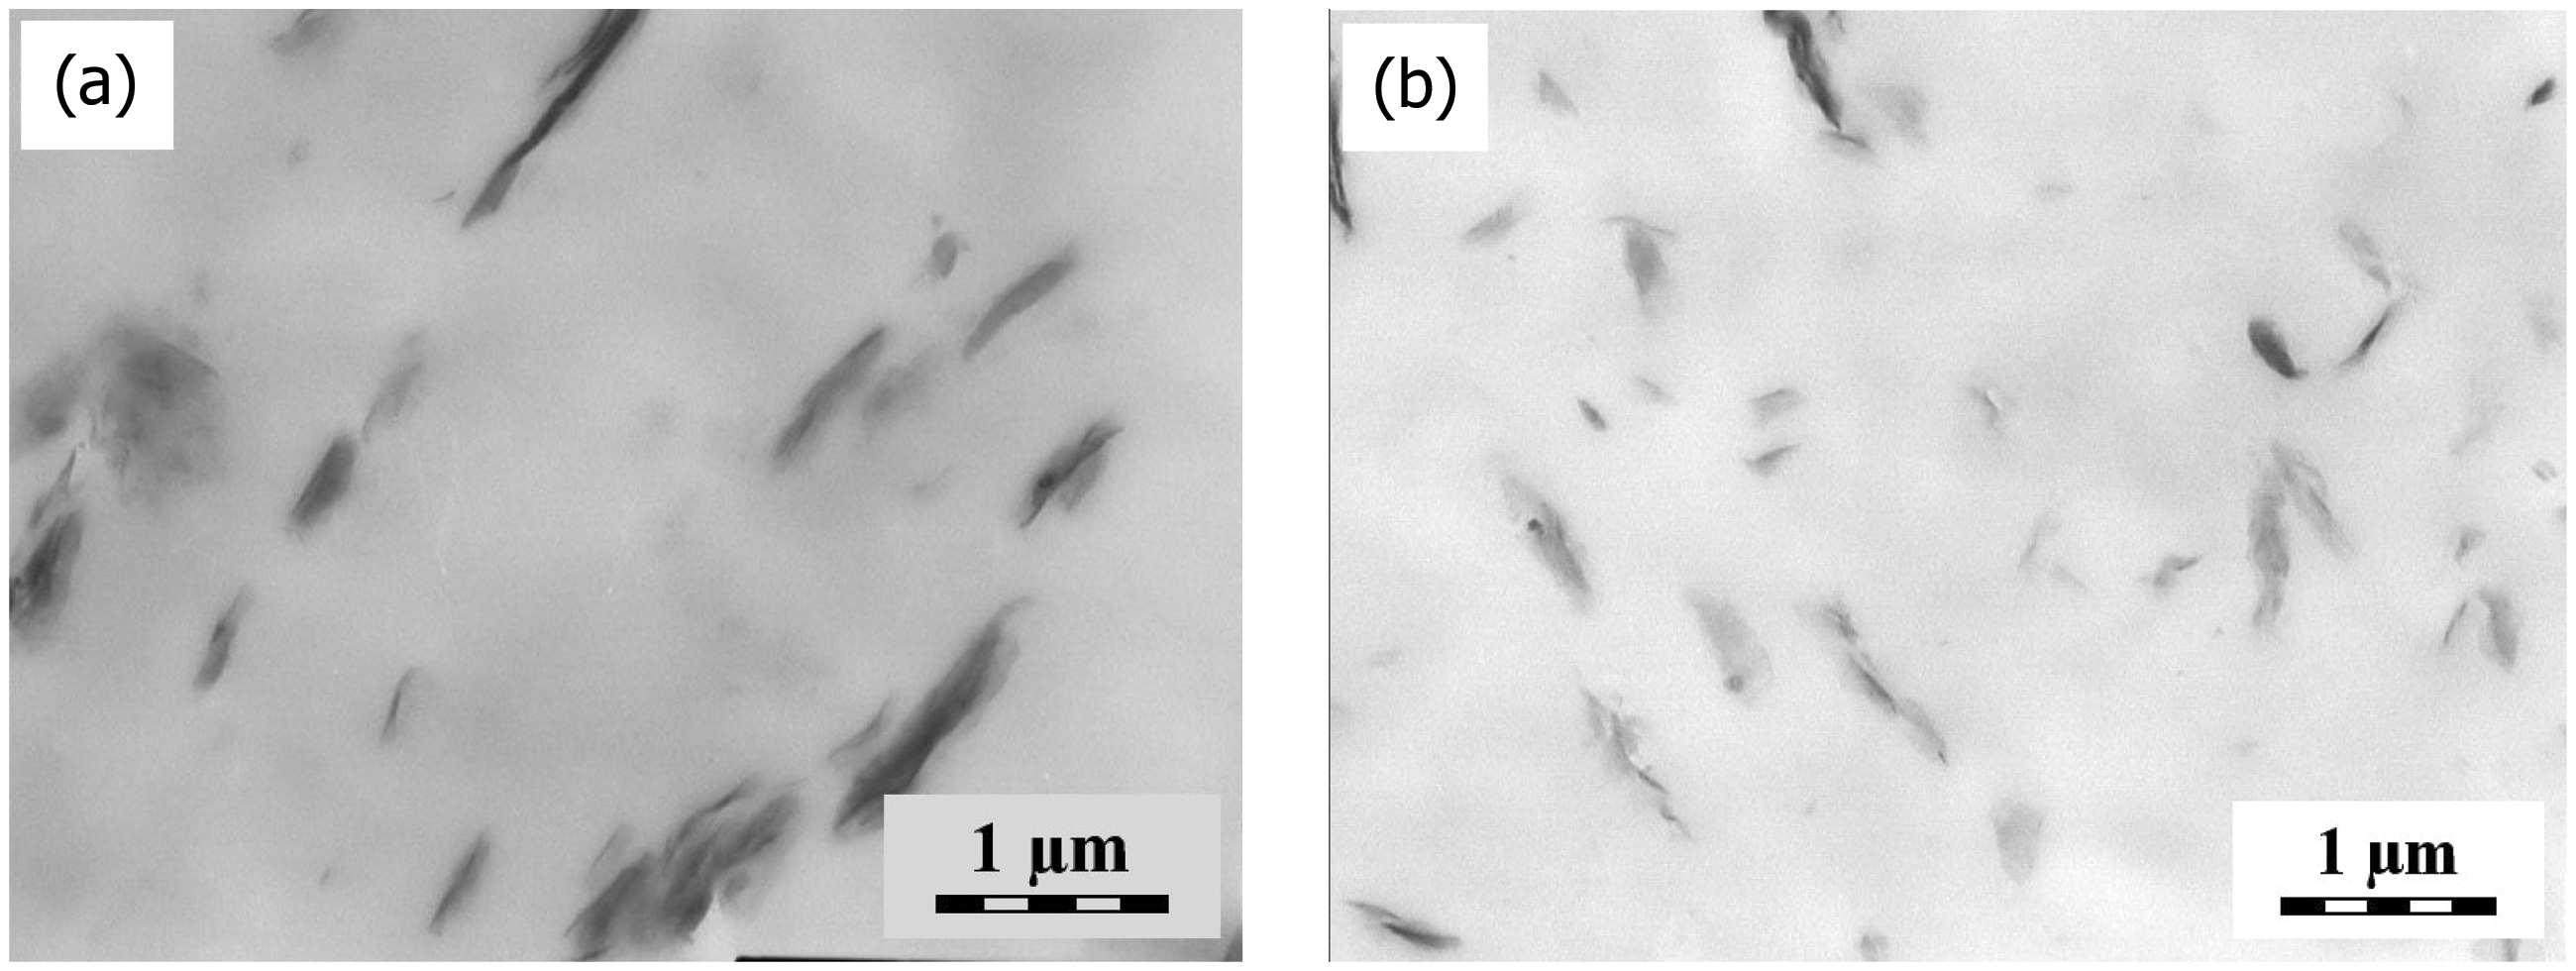
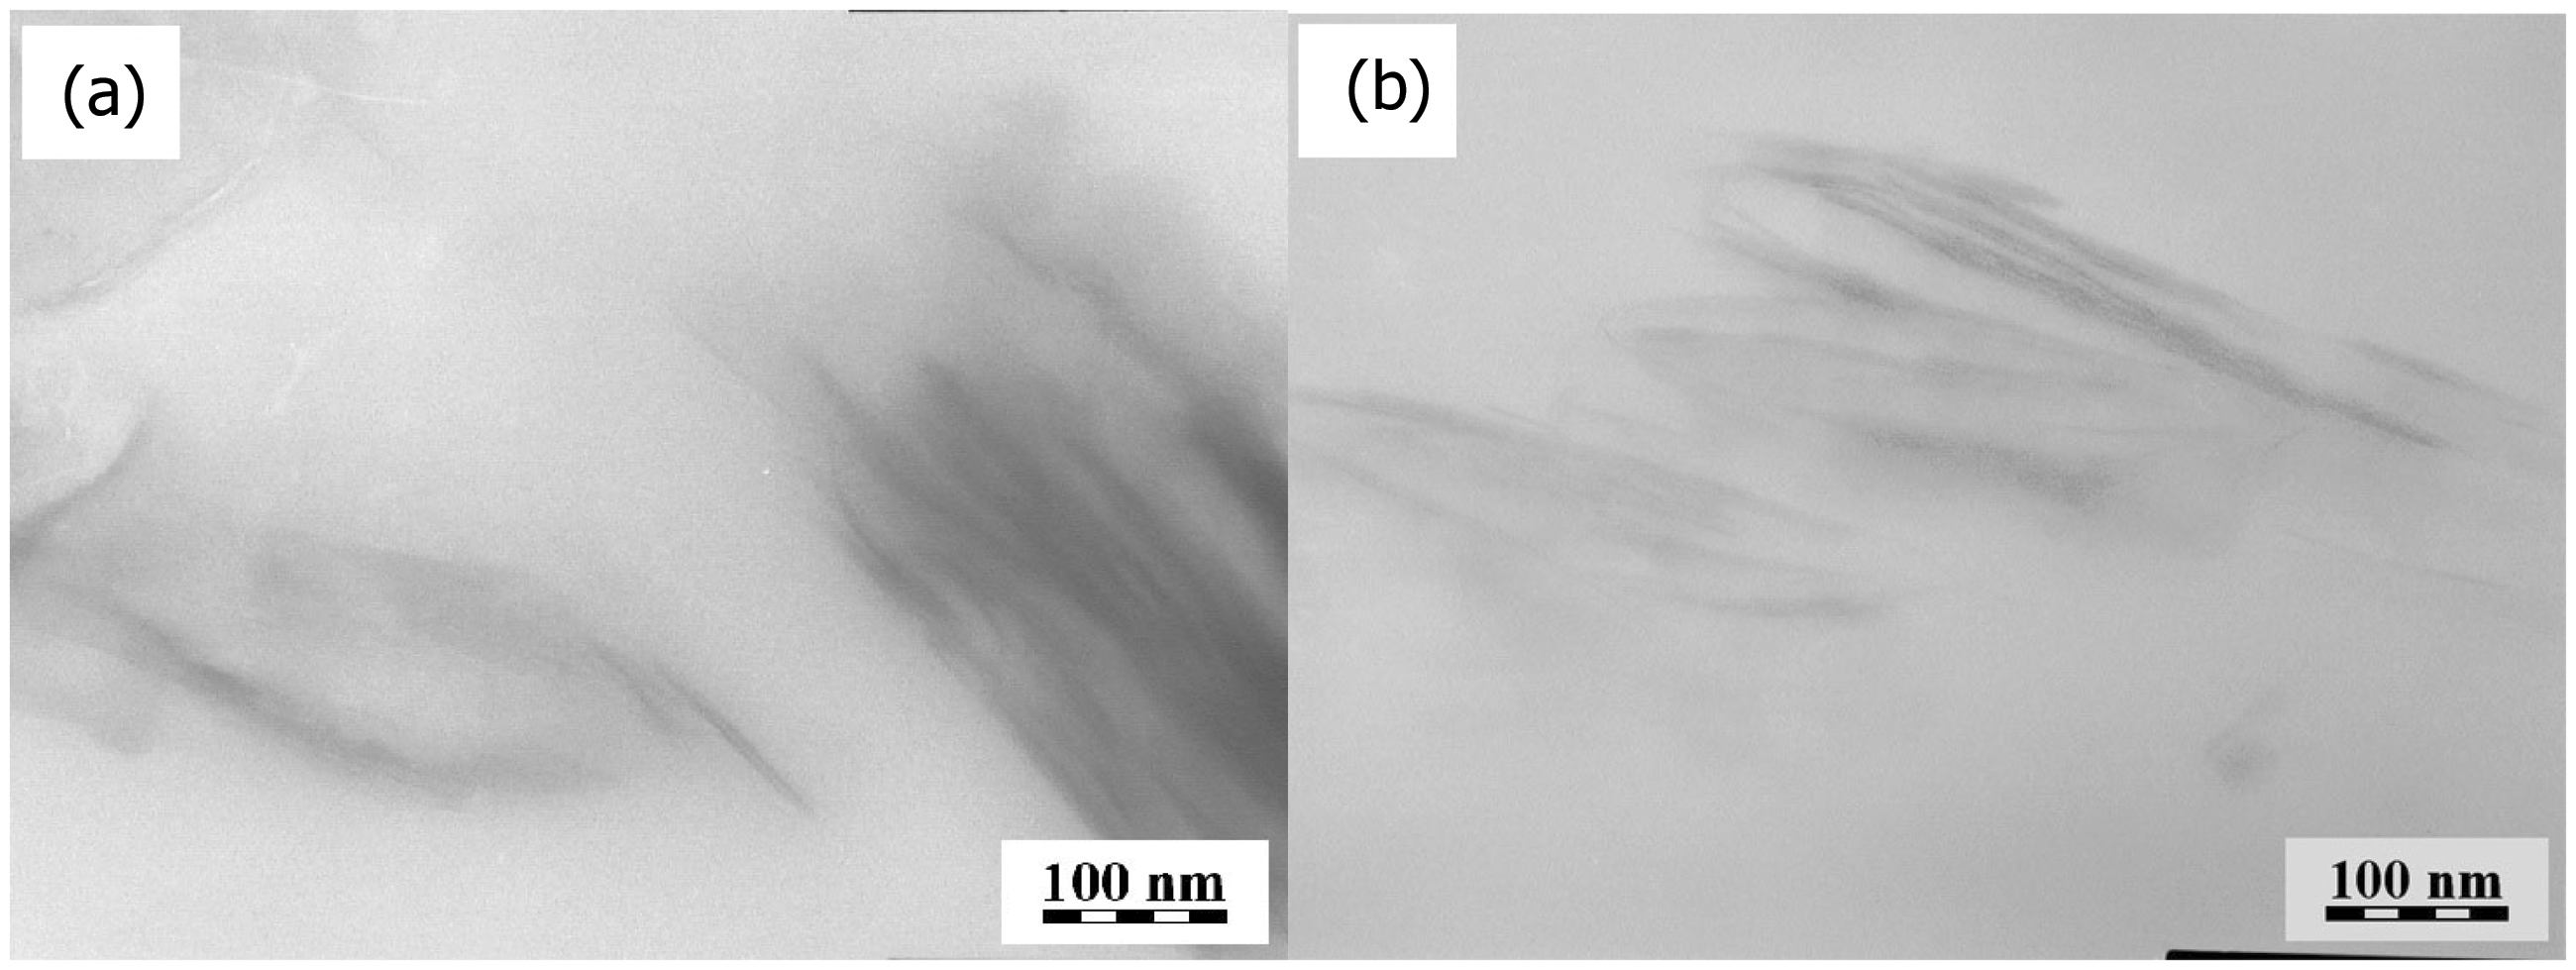
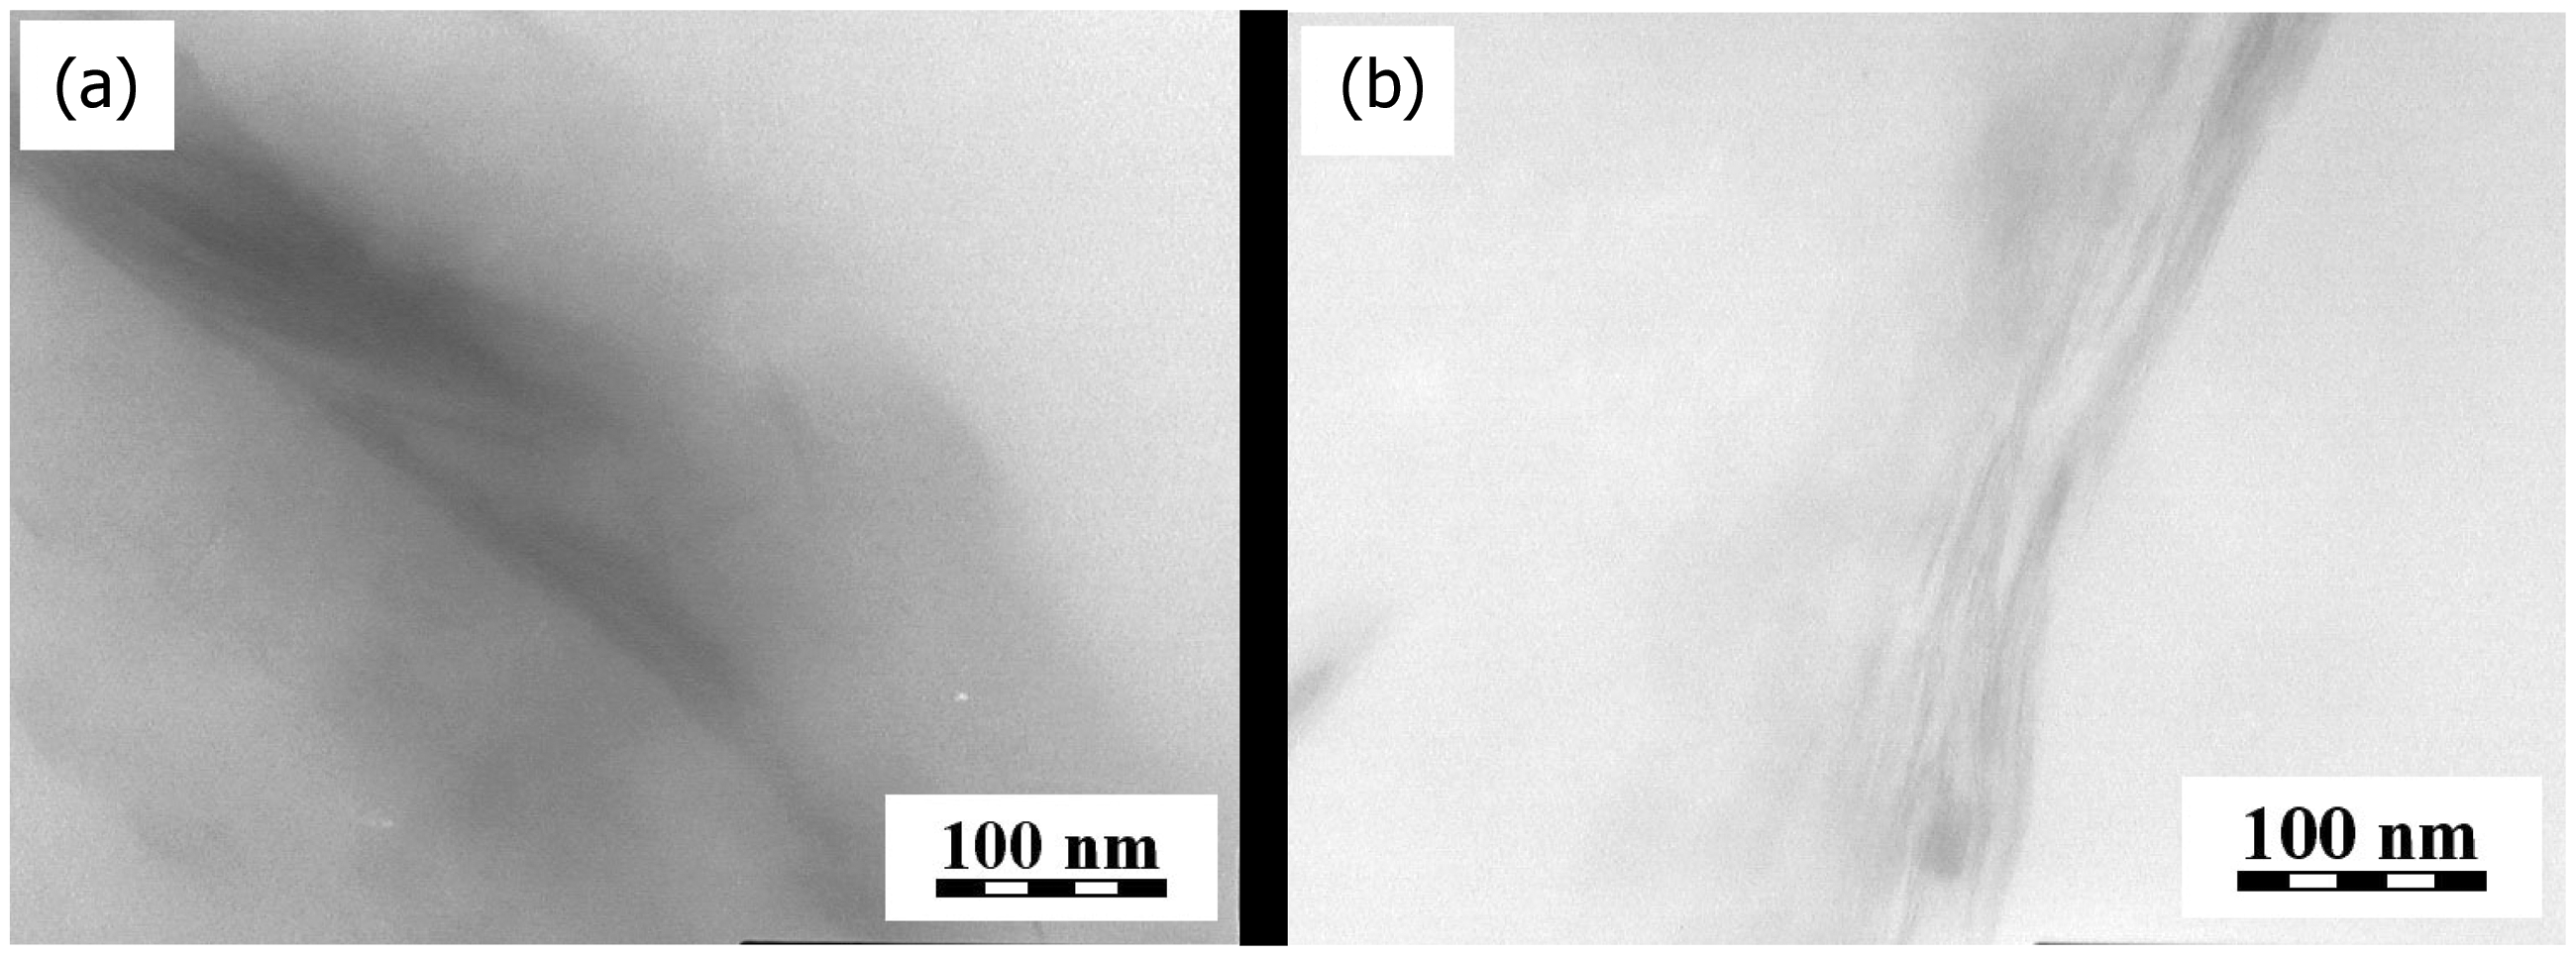
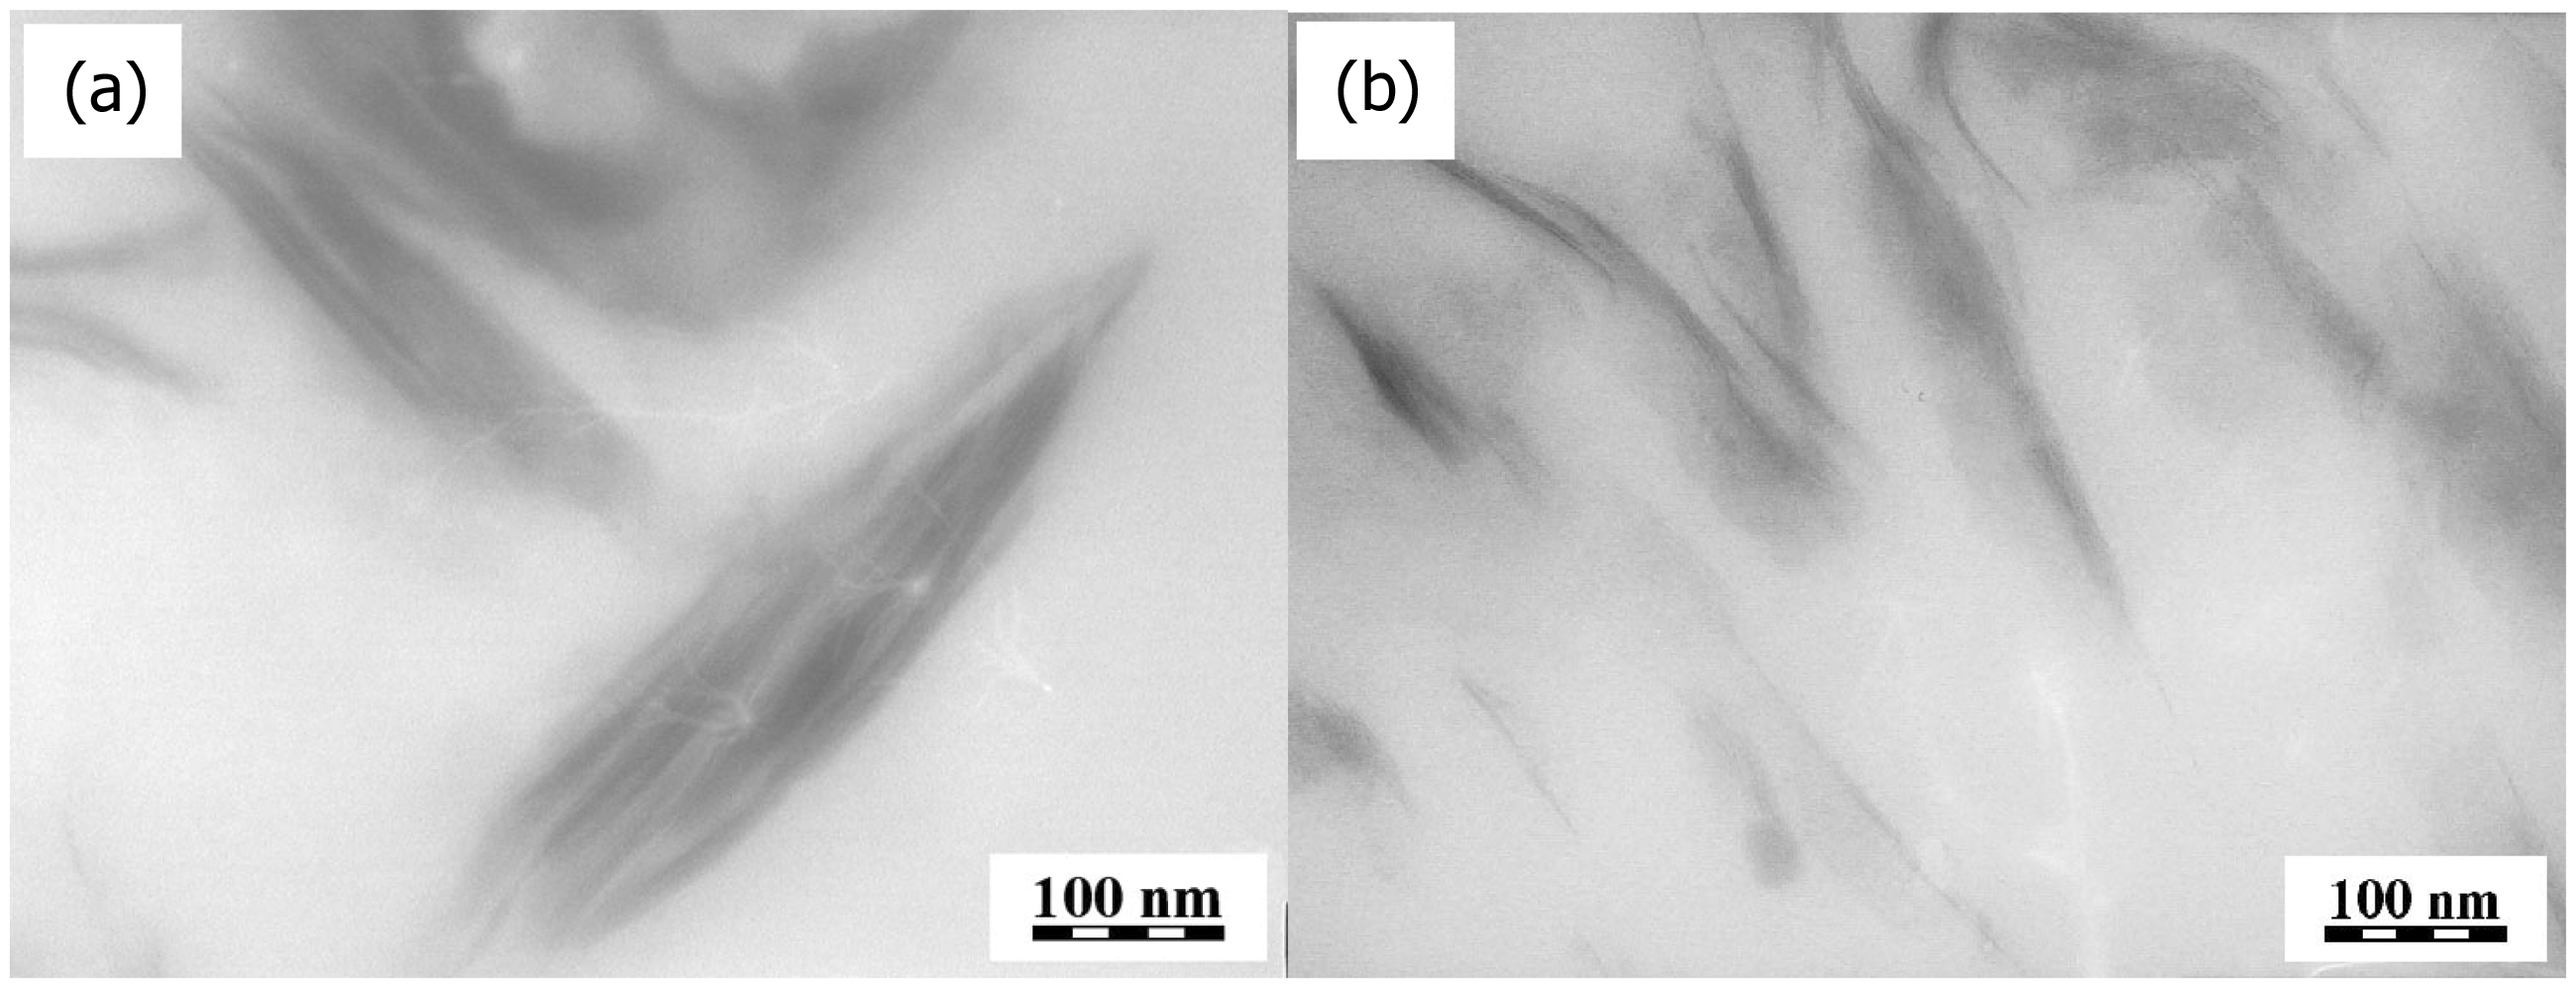
To sum up, the results of TEM observation support the results from XRD measurement. The level of exfoliation was higher for the samples prepared by APV twin-screw extruder.
For the practical applications of prepared nanocomposite materials, mechanical properties are very important. Dynamical mechanical analysis (DMA) is a powerful method for obtaining values of modulus and loss angle tan δ. The data from DMA are listed in the Table 1 and in two graphs (Figures 8 and 9). Figure 6 represents the data of E* modulus. It is clear that all prepared samples, prepared either by KO Buss or by APV extruder, show about 50% increase in E* (the improvement of stiffness). Moreover, this graph brings the information that there is no significant difference between values obtained for both observed devices.
Graph of DMA – E* modulus. Graph of DMA – loss angle (tan δ).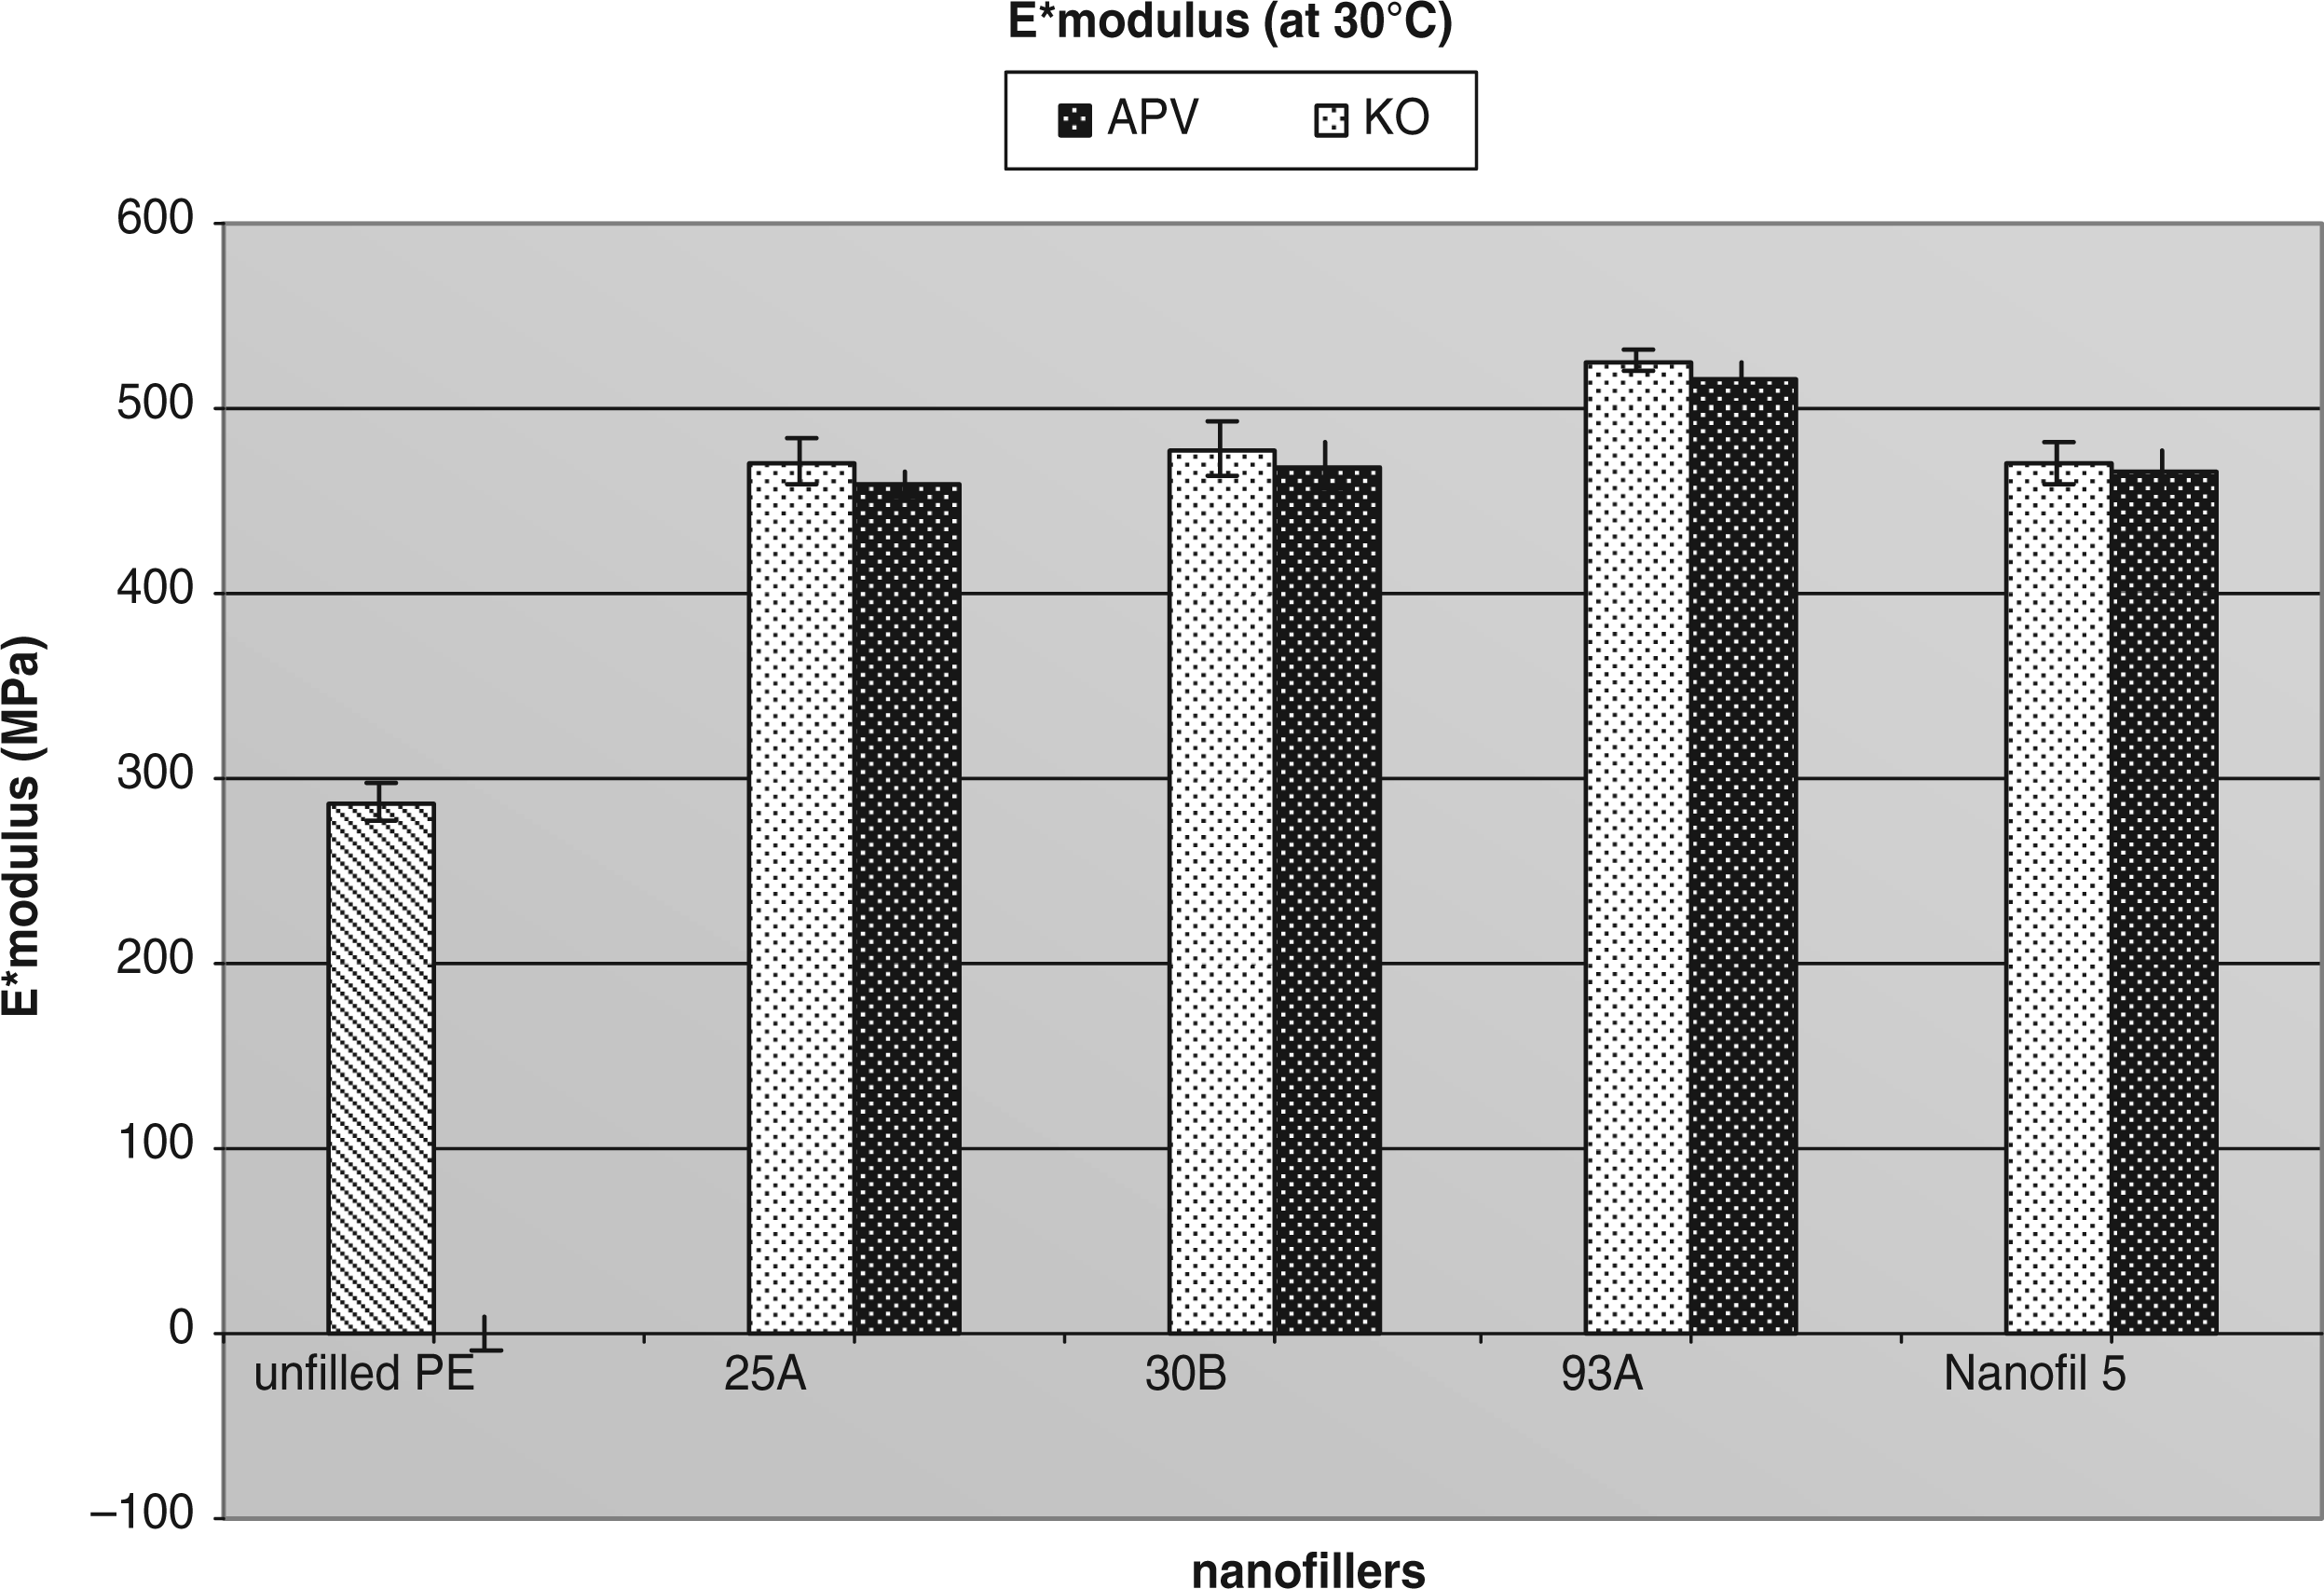
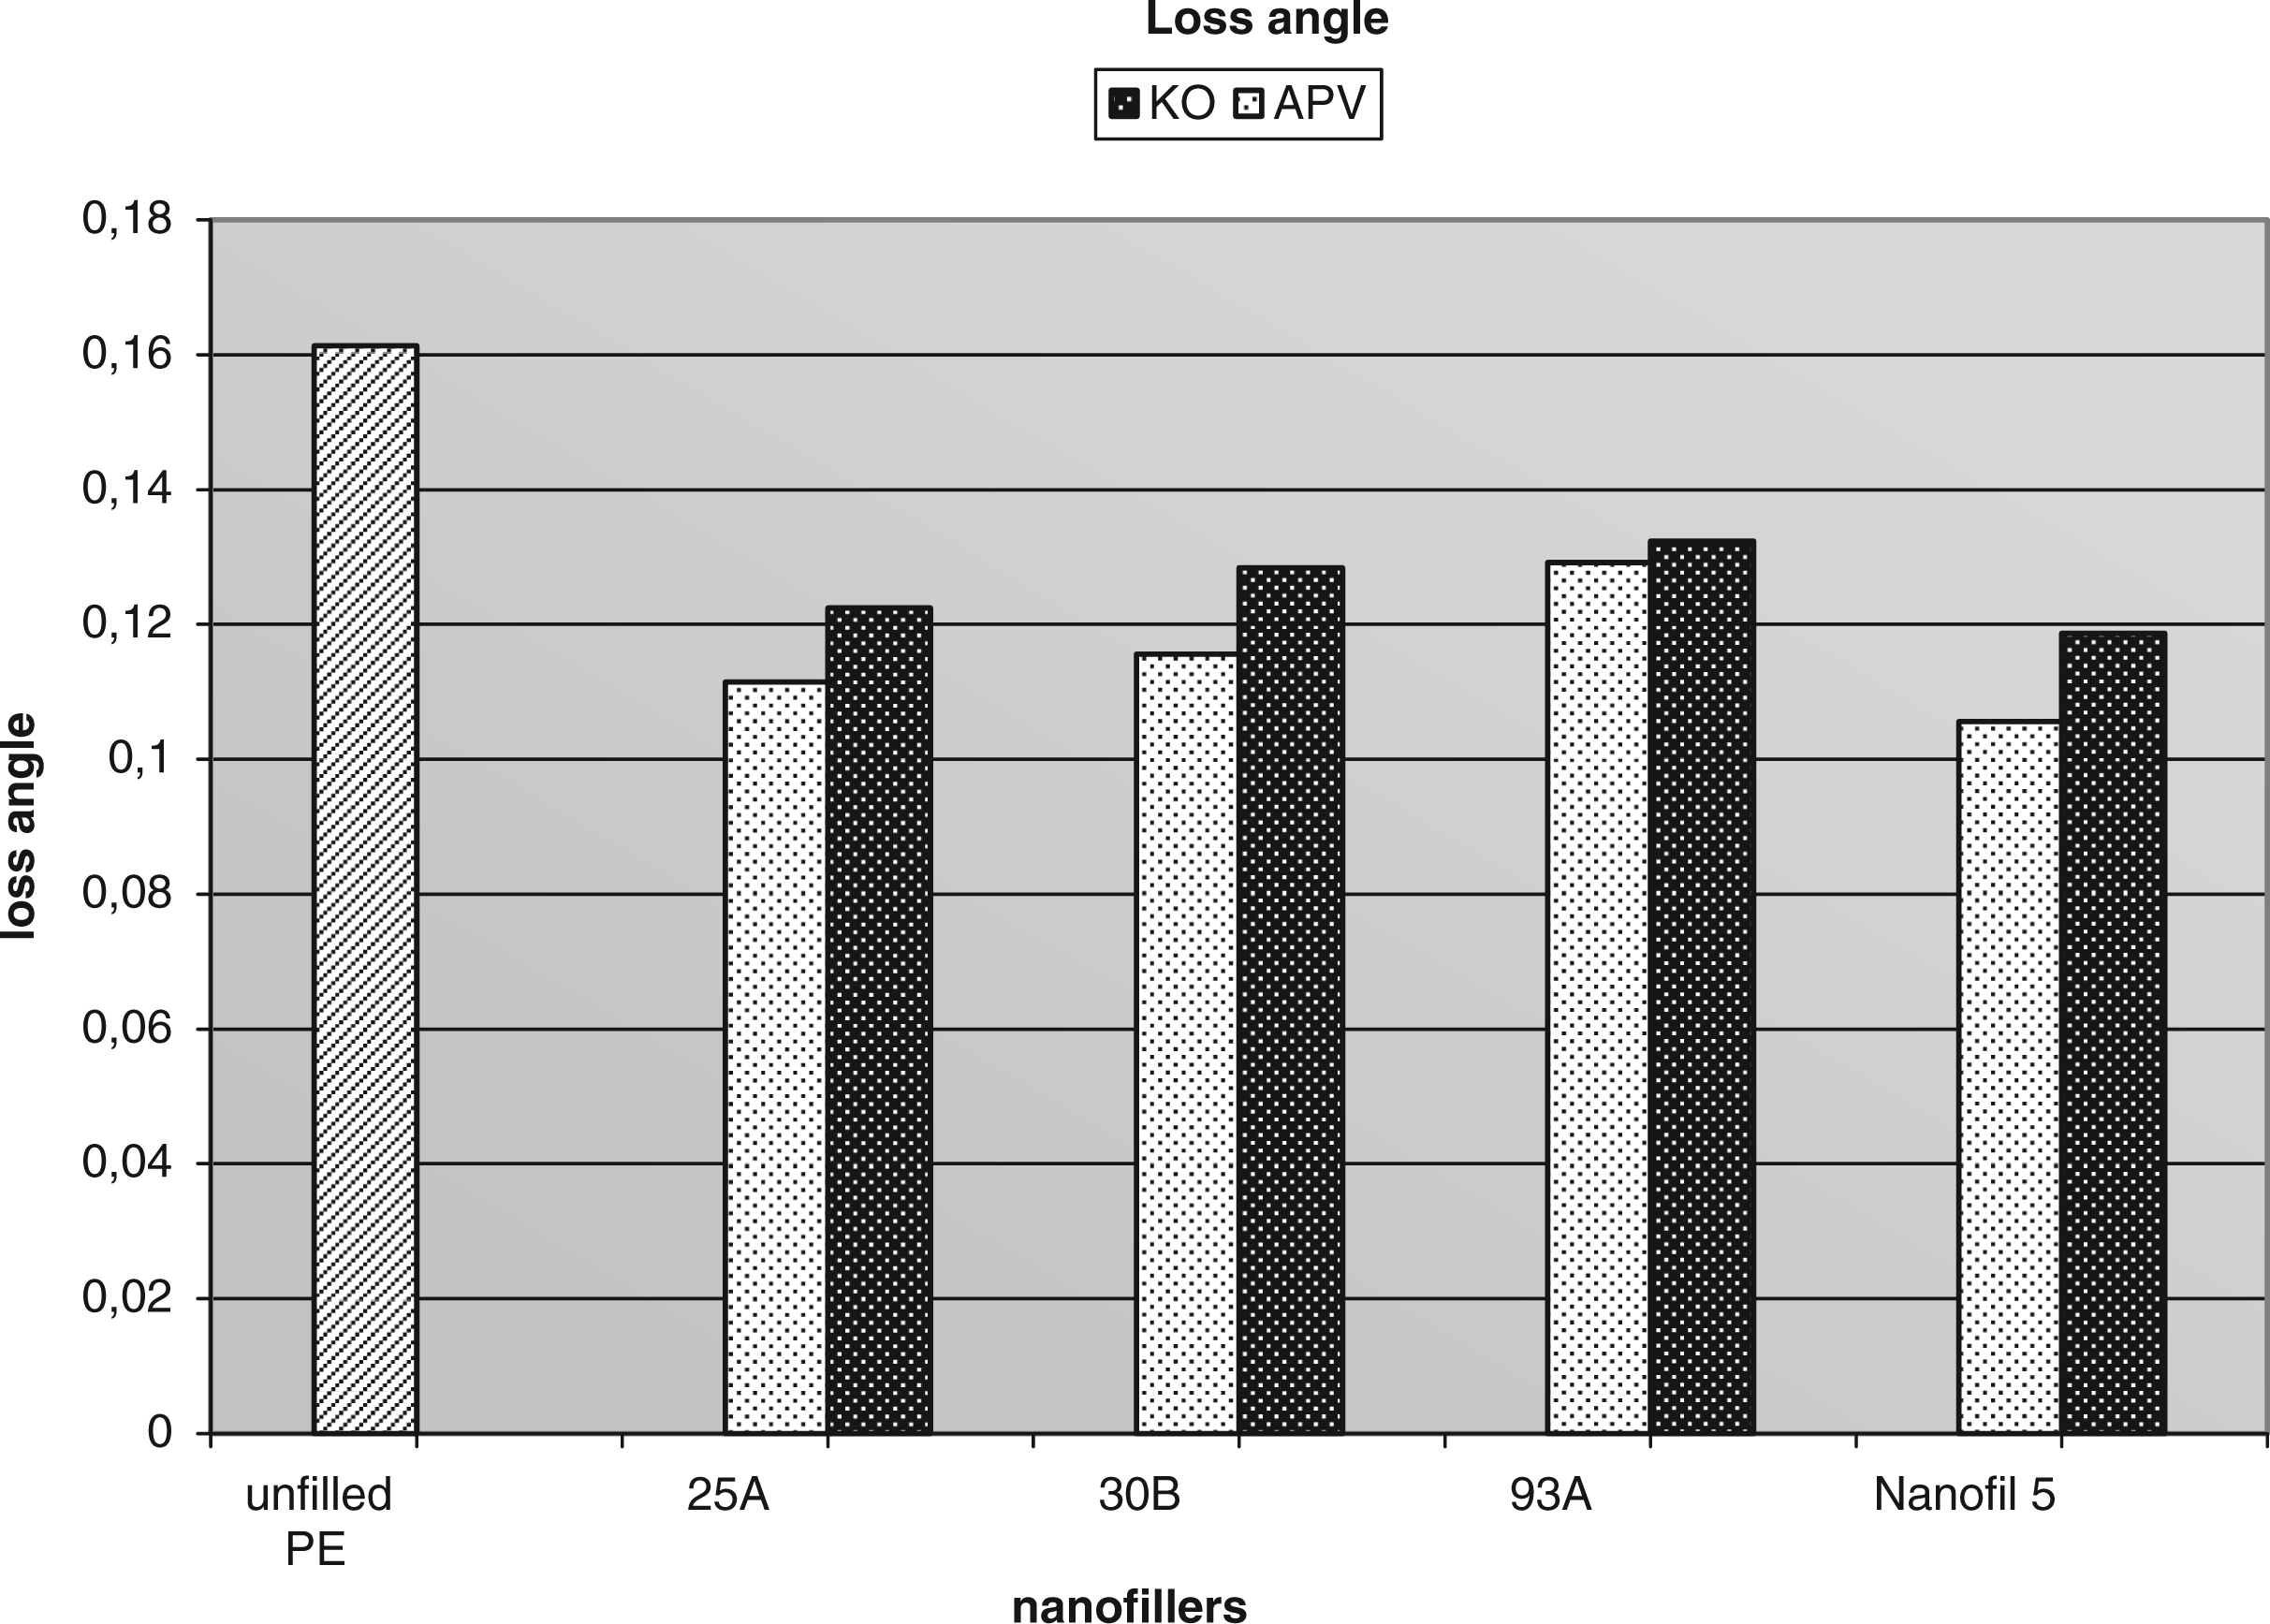
Next data obtained from DMA measurement focus on loss angle tan δ. Values of tan δ are calculated as the ratio of loss modulus E′ and storage modulus E″ (tan δ = E′/E″). This tan δ value describes the level of material elasticity. Many times higher elasticity is considered as a positive change with exception to shock absorbing application when high tan δ is required. And the elasticity is influenced by the level of MMT exfoliation in a polymer matrix, better exfoliation causes higher elasticity. So, it can be considered to be one of the possible evaluations of MMT exfoliation. Figure 9 shows values of tan δ of observed samples. We can say, that the results are in good agreement with the results of E*. All values of filled samples are lower (we have achieved better elasticity), than for unfilled PE and there is also the same tendency, APV samples are better than KO Buss ones. To sum up, the use of twin-screw extruder brings the better level of MMT particles exfoliation.
The data from tensile stress measurement are plotted in graph in Figure 10. The tendency here is quite different from the DMA results. Values of tensile stress vary in higher scale and not all of them are better then unfilled PE. The best results were achieved for the sample PE/Nanofil 5 and not significantly lower the value of sample PE filled with Cloisite 93A. In addition, here the differences between values related to both used compounding devices have better visibility. Samples prepared by APV extruder show much higher improvement compared to the case of KO Buss. The tensile test represents a mechanical behavior of samples during a destruction process. The explanation of lower values of destruction properties can be that bigger MMT agglomerates (compare Figures 4 and 5 – TEM images) cause stress concentration during the tensile measurement. Better dispersion of the nanolayer causes increase in tensile strength such as it was shown for example for PE/Nanofil 5 (compare Figures 7 and 10). These results are in very good agreement with the TEM observation.
Graph of mechanical properties measurement – tensile strength.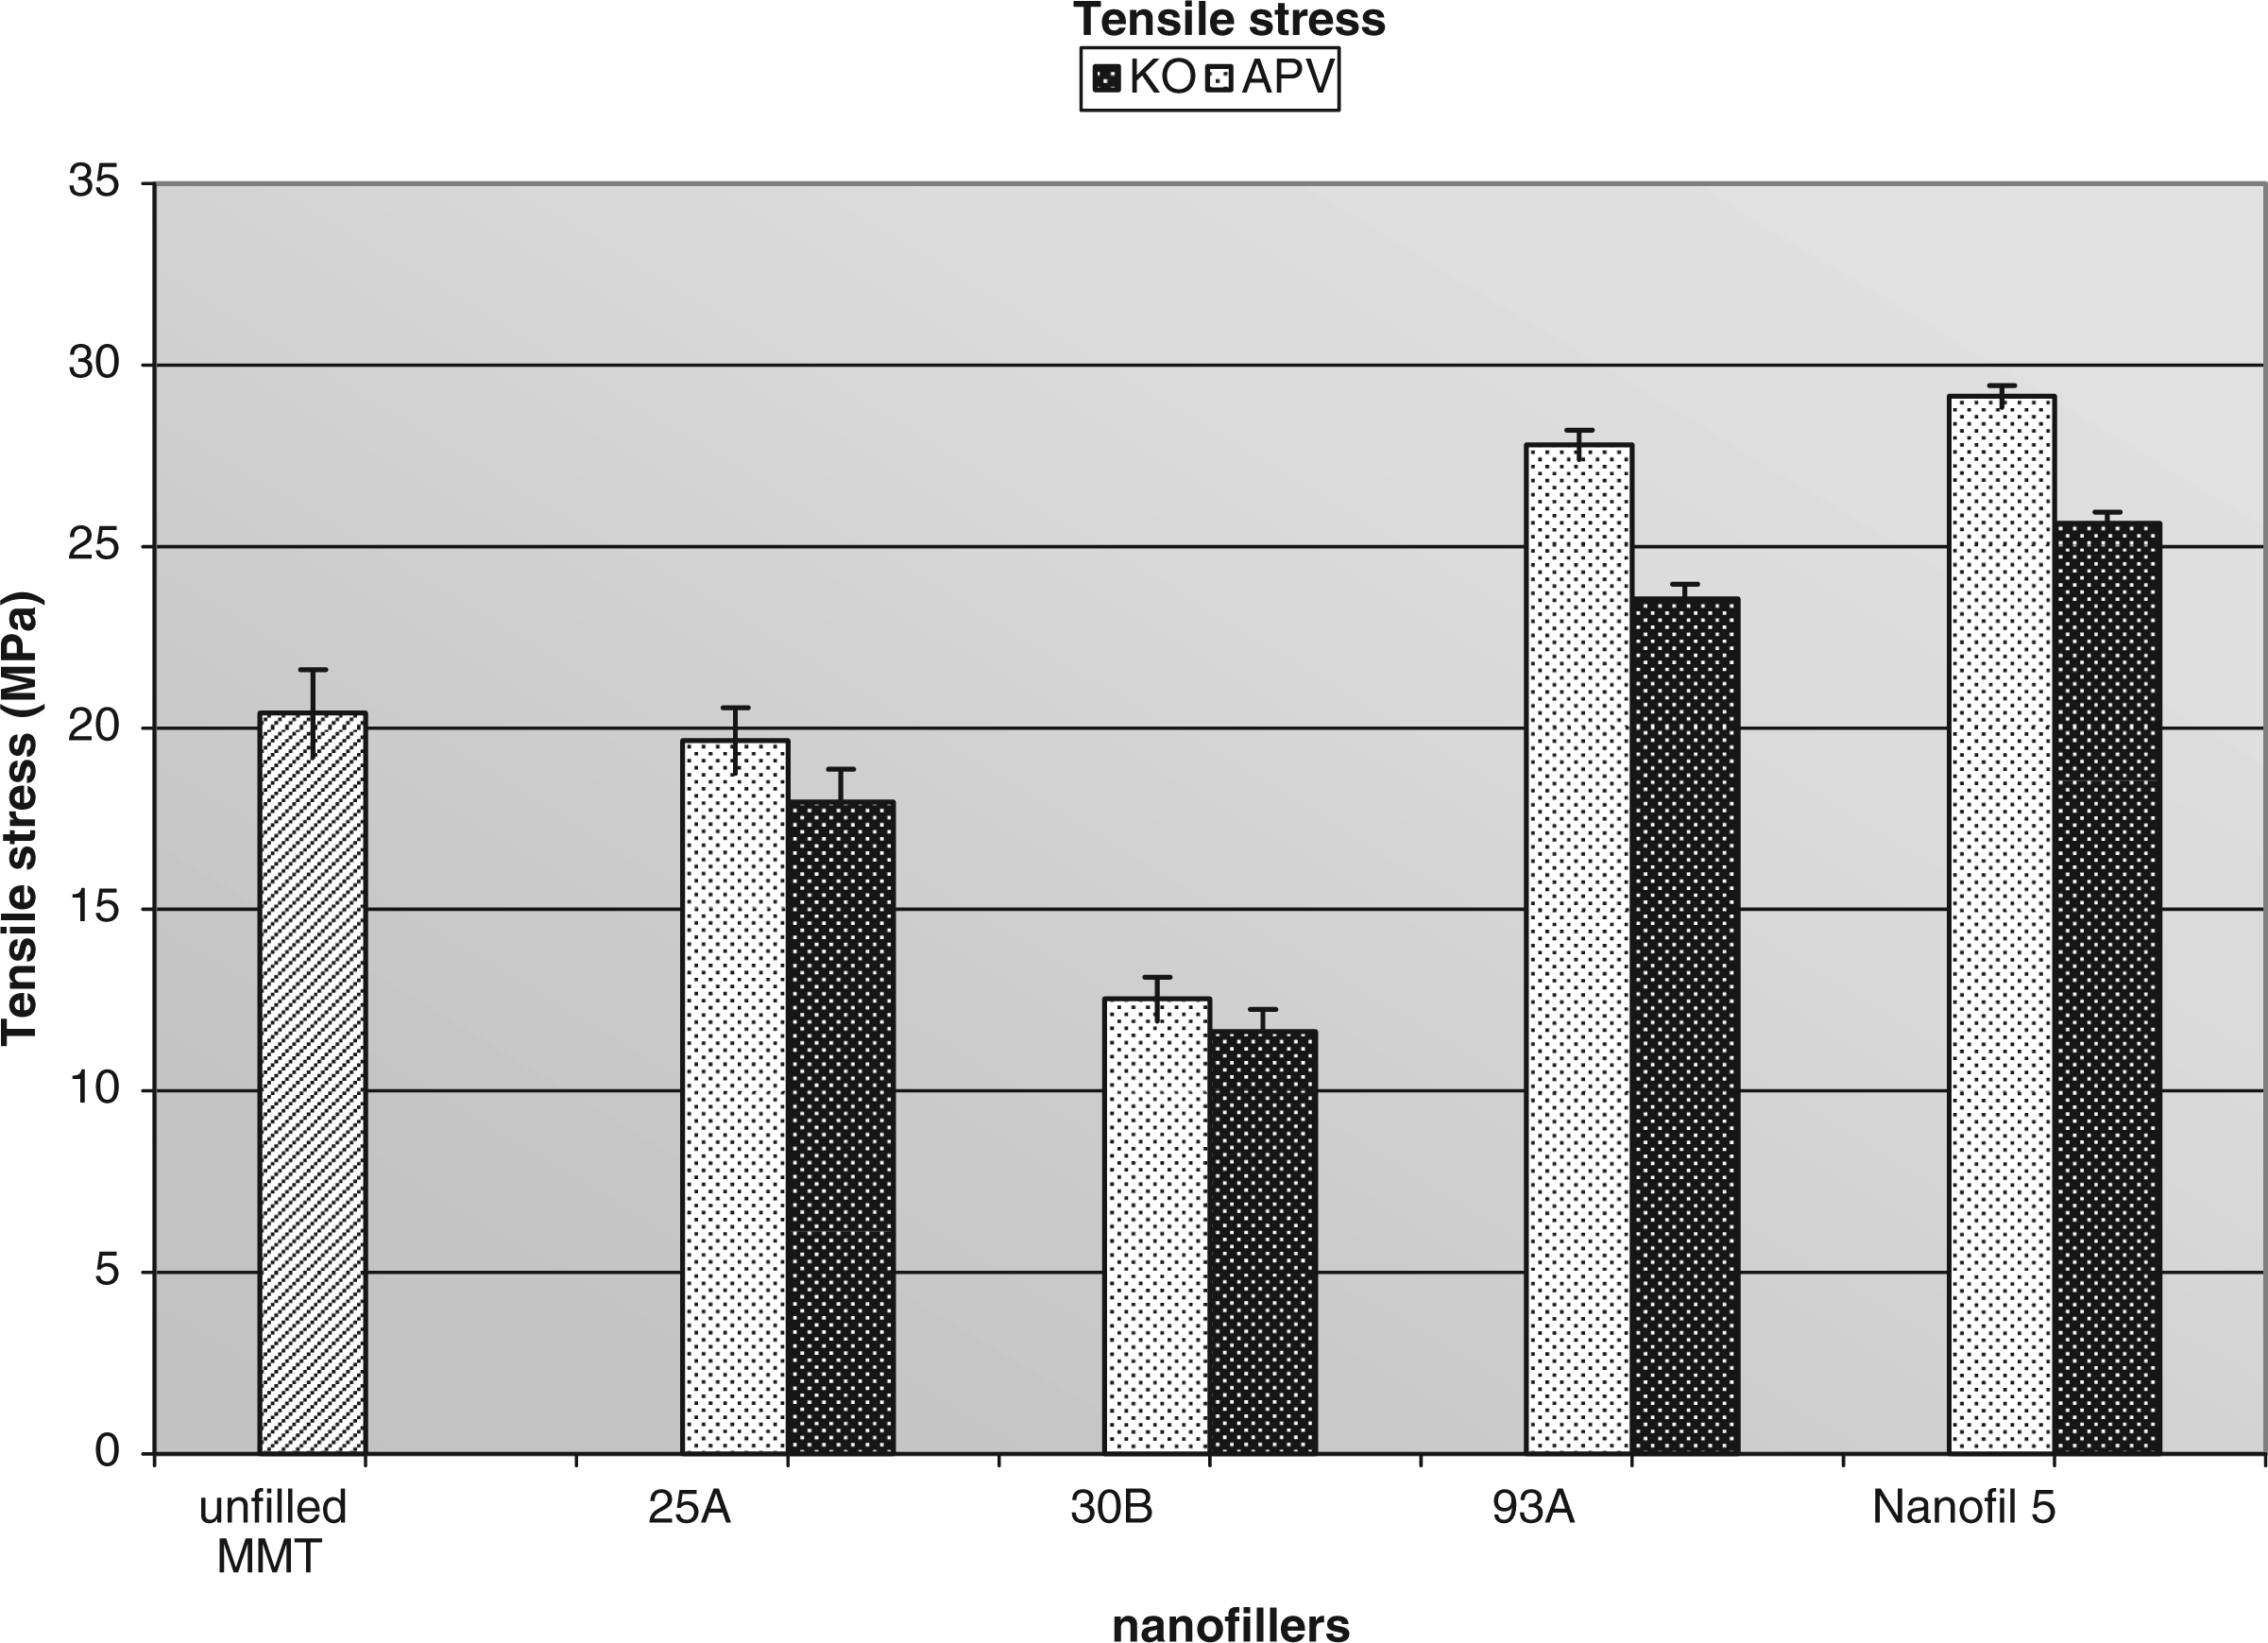
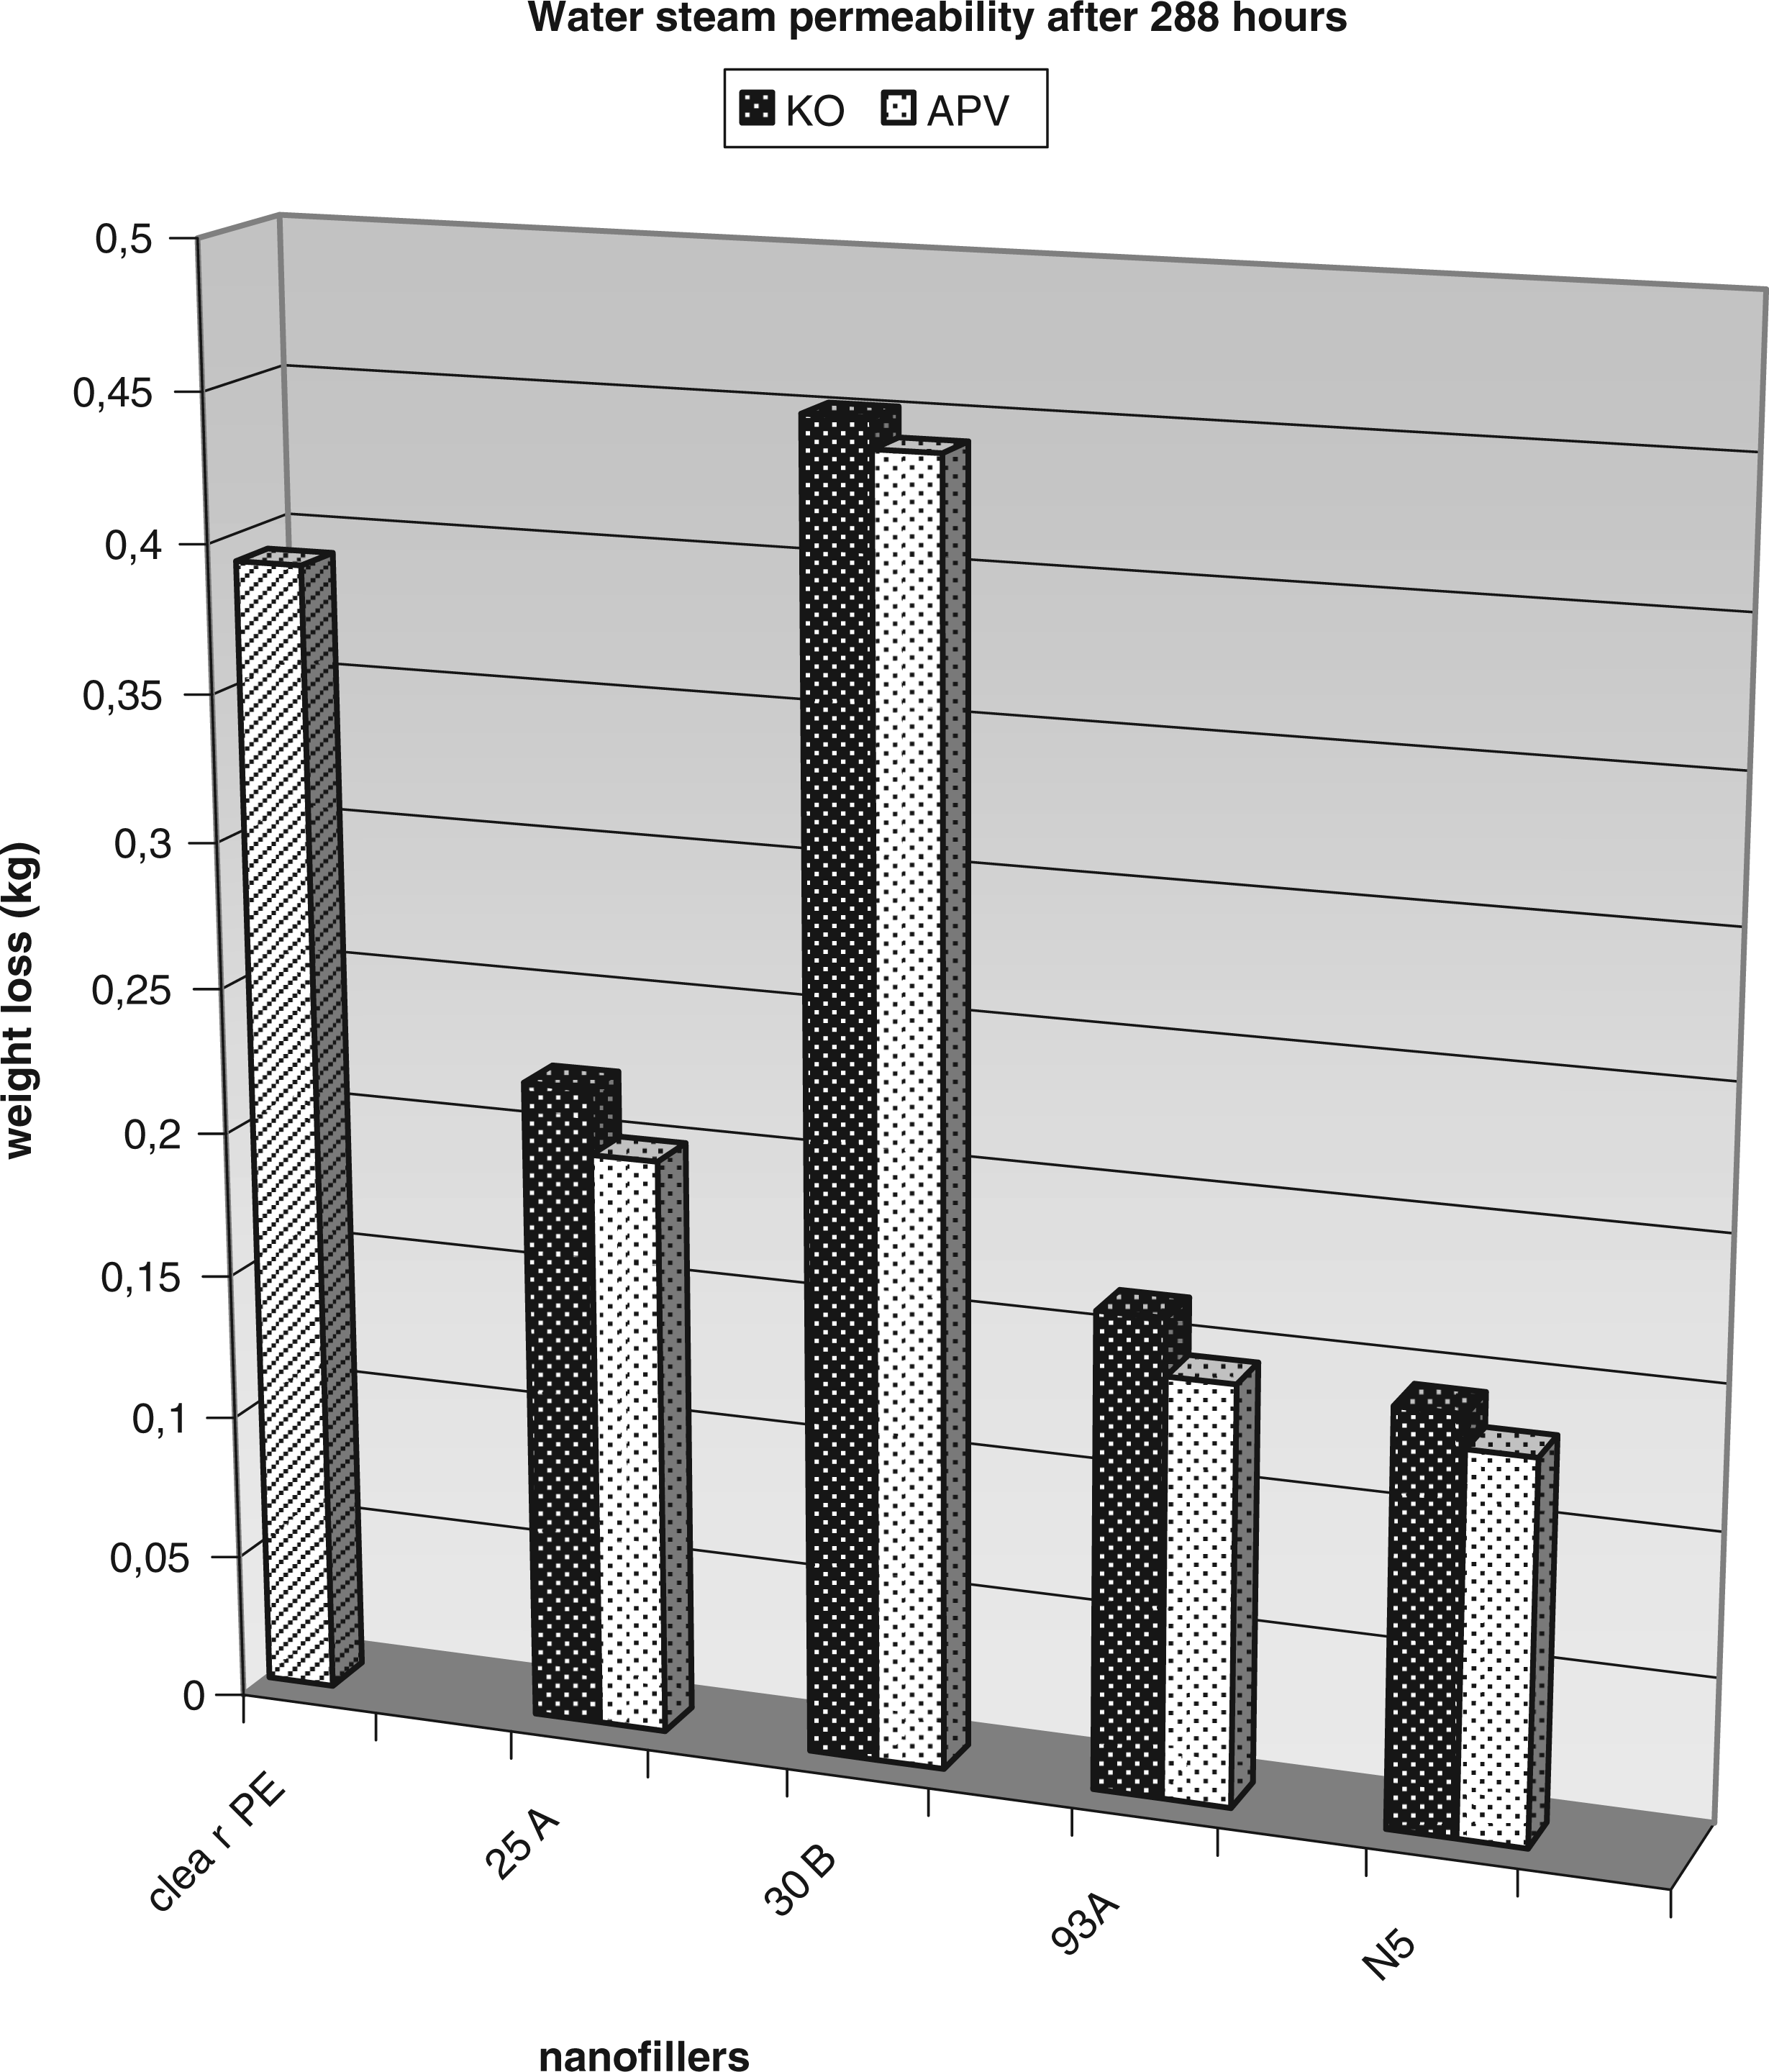
PE nanocomposites have been studied for longer period of time as materials that would be possible used in a packaging industry [24]. That is why also in our work, we were interested in the measurement of permeability properties. Figures 11–13 represent three graphs showing permeability coefficients for oxygen, carbon dioxide, and water vapor. Figure 11 exhibits the observation of oxygen permeability. The values plotted here show that the sample PE/Nanofil 5 is the worse one, which is exactly the opposite result to the tensile strength measurement. All composites containing Cloisites exhibit lower permeability coefficient in comparison with the unfilled PE matrix. When we focus on the differences between samples prepared by different compounding devices, the tendency is not the same, but almost in all cases, the values are lower for samples prepared by APV extruder.
Graph of permeability – oxygen permeability coefficient. Graph of permeability – carbon dioxide permeability coefficient. Graph of permeability – water vapor permeability.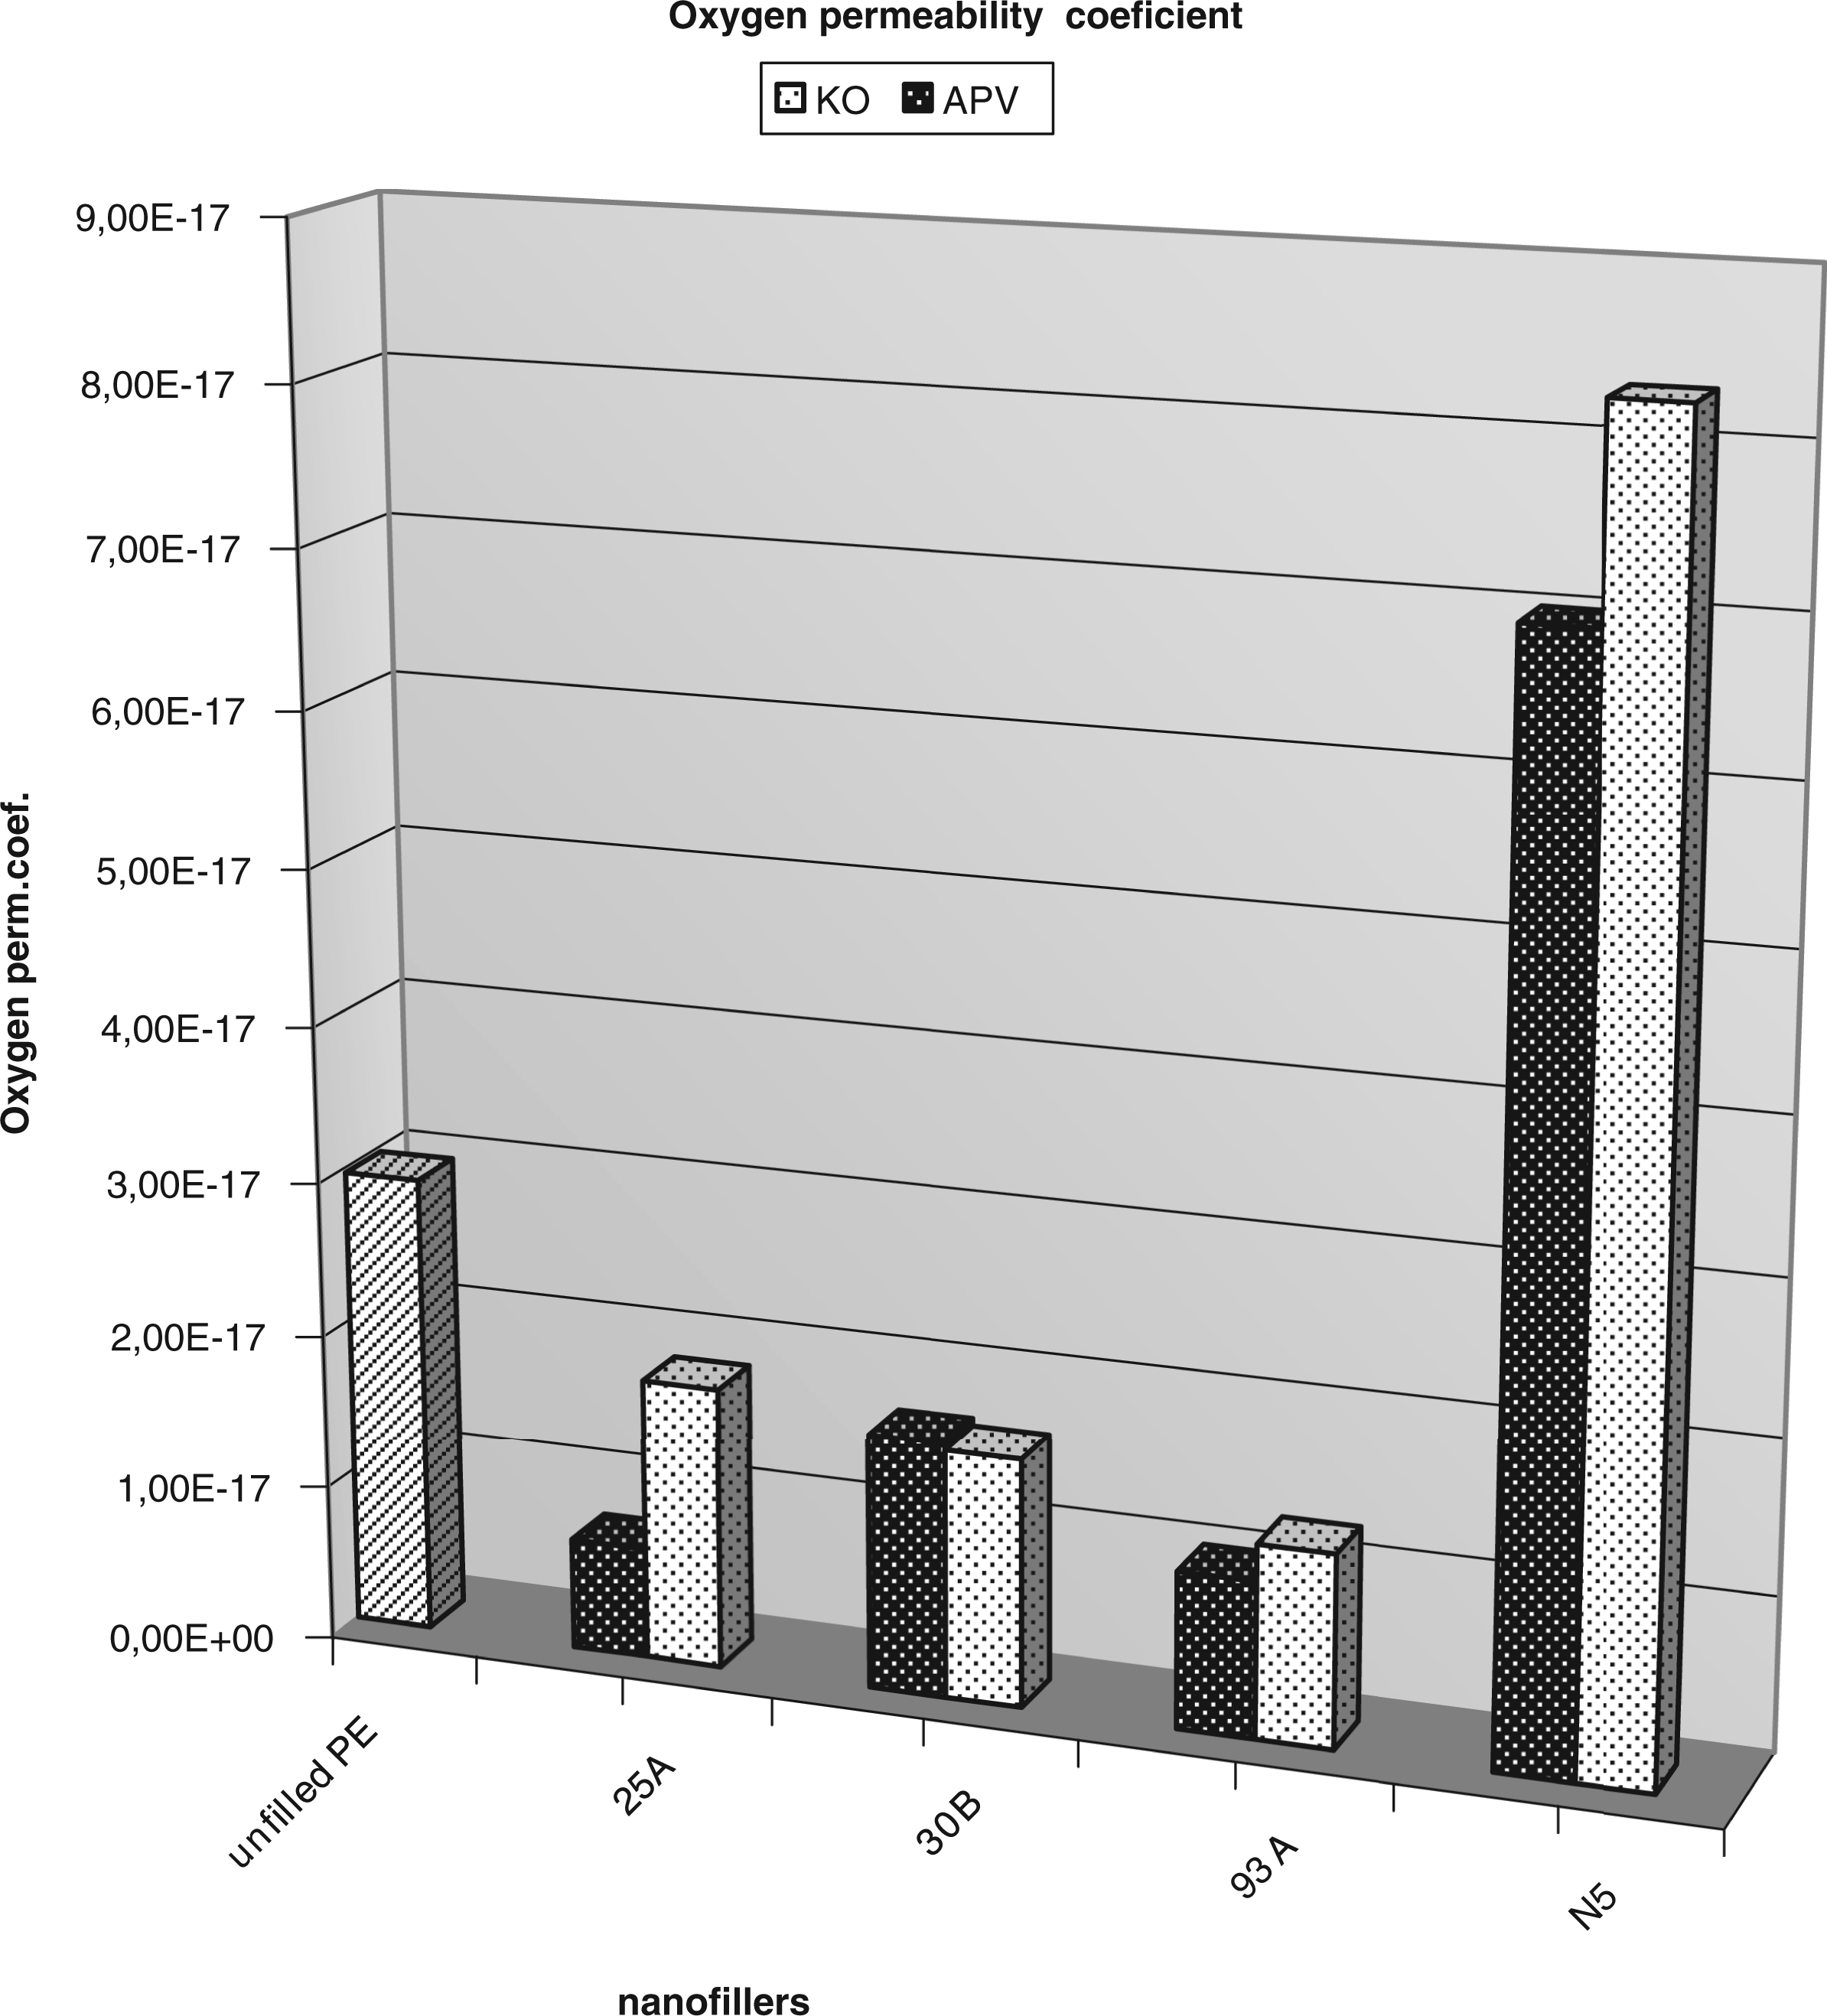
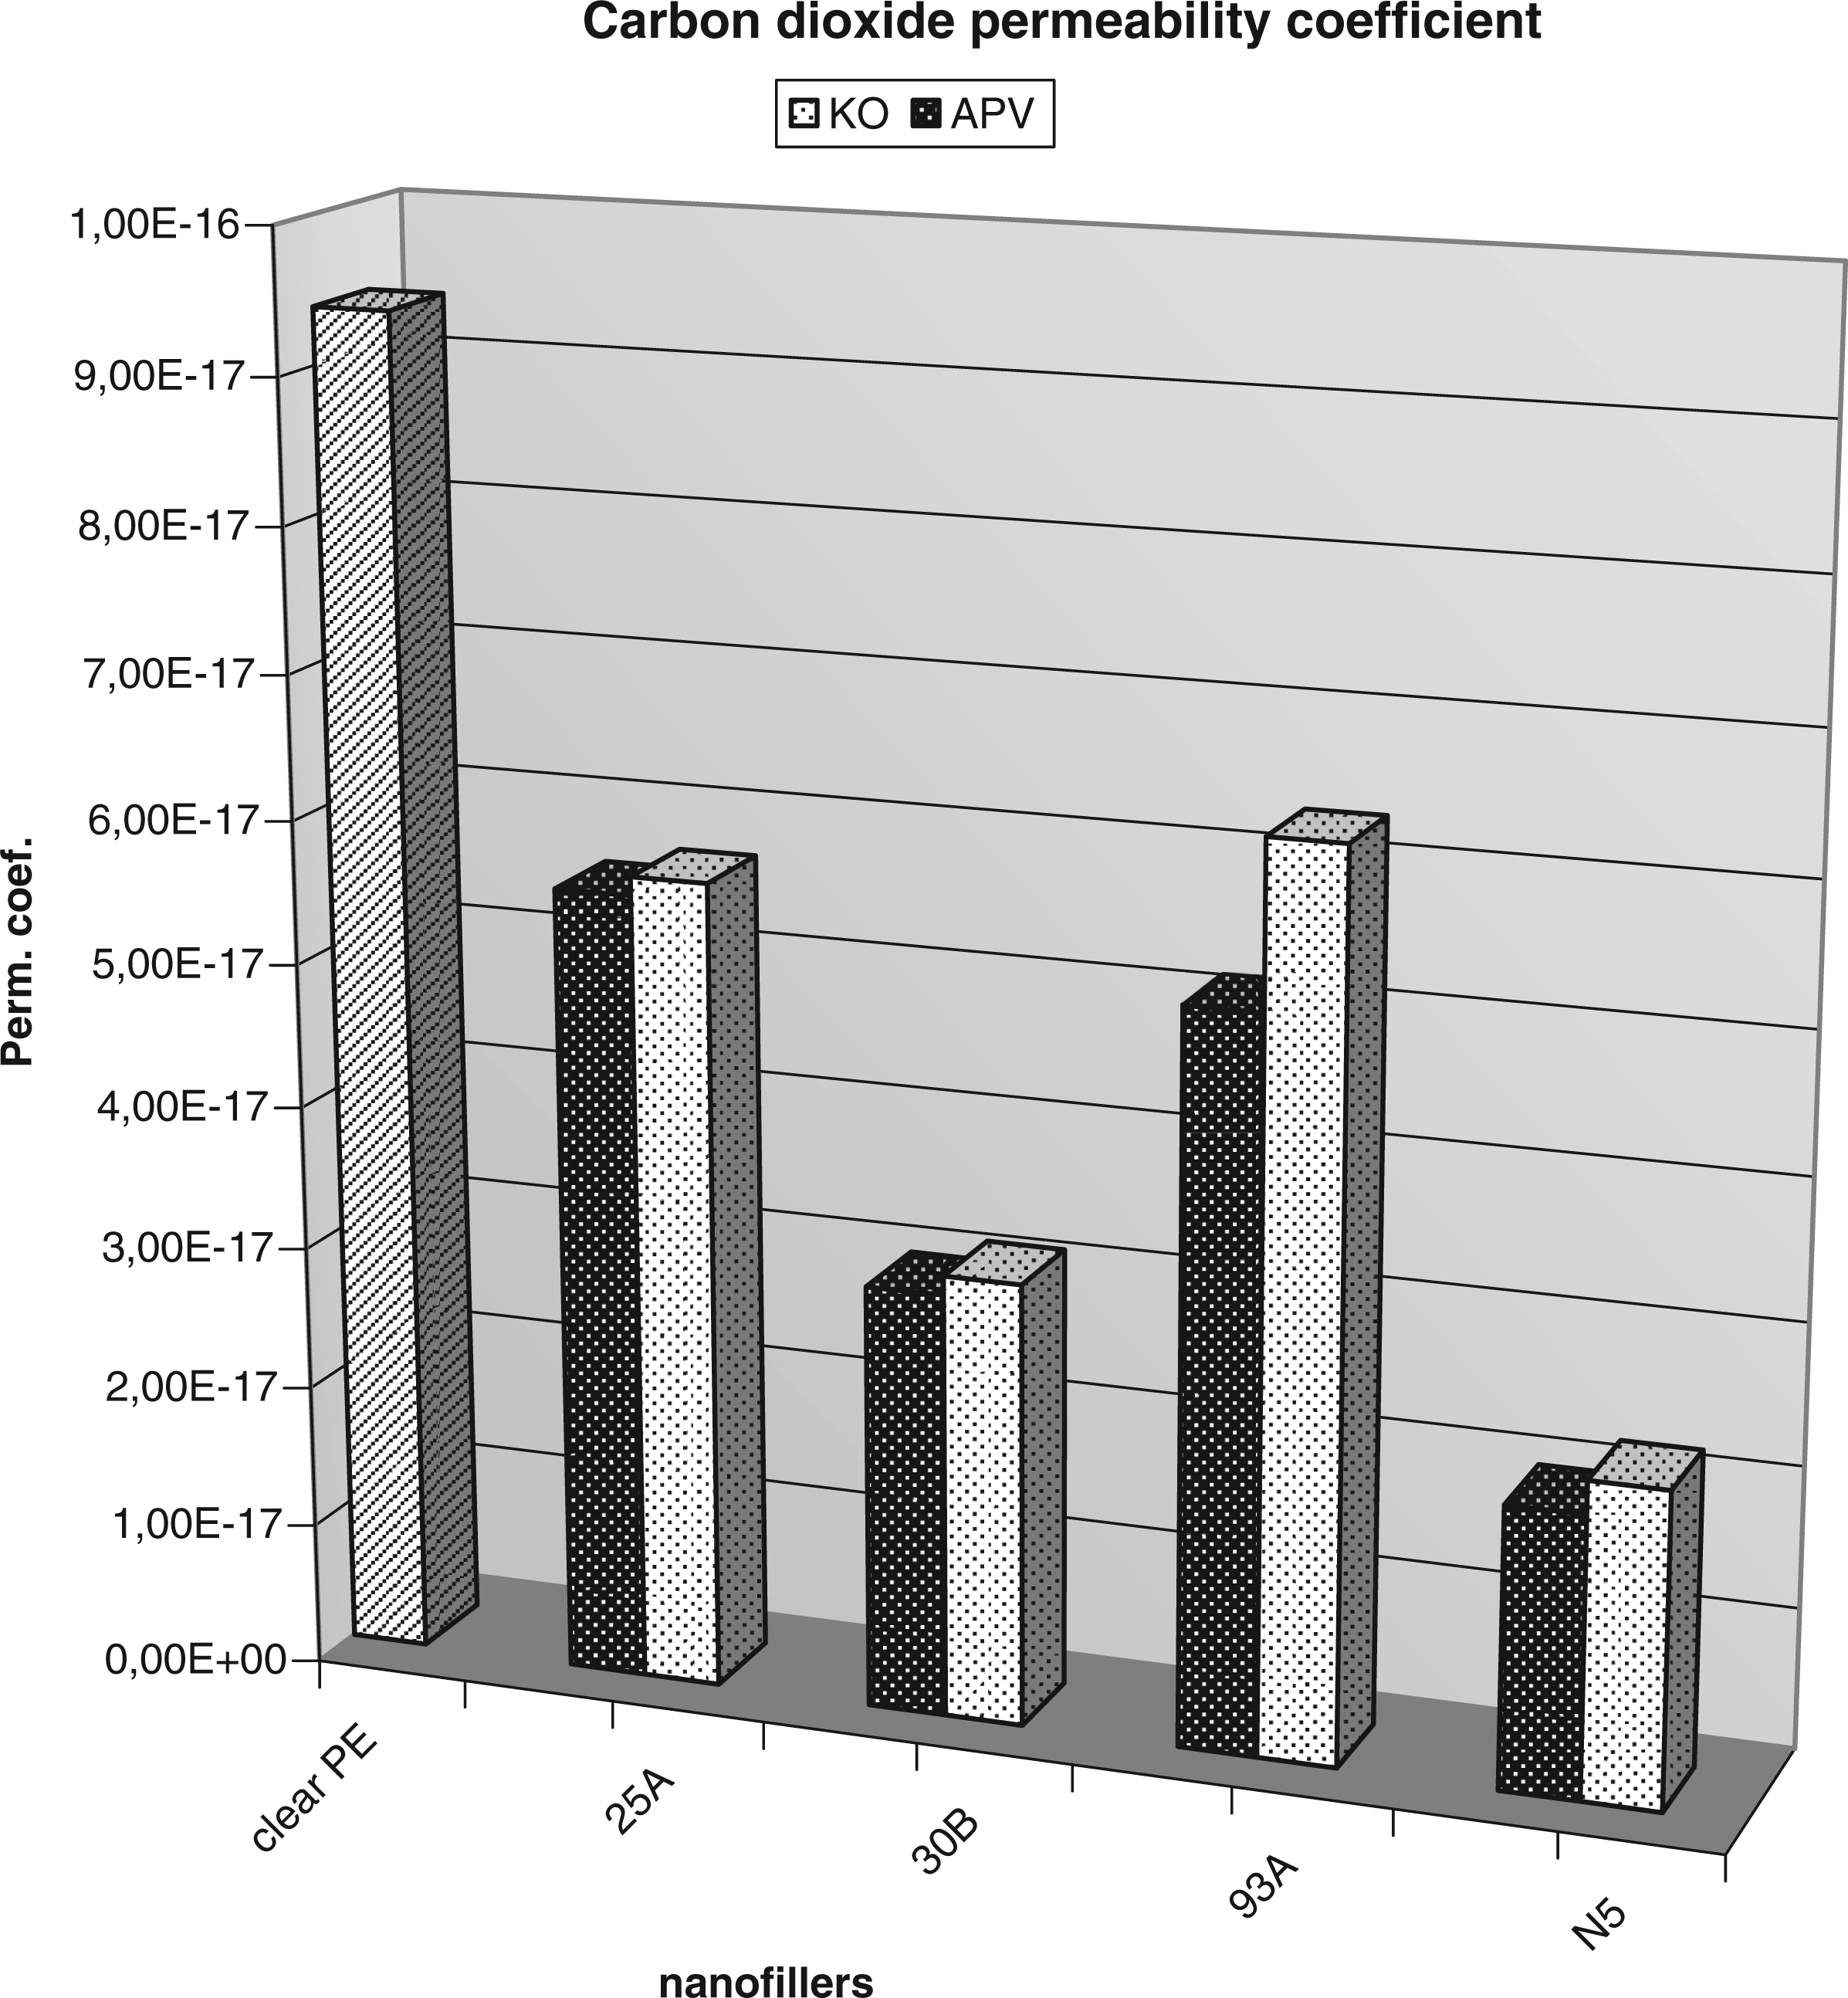
Similarly to the first-described graph (Figure 11), the next one deals with CO2 coefficient (Figure 12). However, here the values for Nanofil 5 are better in comparison with unfilled PE; surprisingly, it is the lowest from all observed samples. This result can be explained by different sizes and polarities of O2 and CO2 molecules, which also influence the transmission of these gases through the PE film. Nevertheless, the results of APV samples exhibited here also have the lowest values of CO2 permeability coefficient.
The water vapor permeability was the last-studied property. The measurement is not the same as in cases mentioned above (it was described in ‘Experimental’ section). The data are presented in Figure 13. The results show that the permeability after 288 h of observation was lower for almost all studied samples in comparison with a clean PE, except of PE/Cloisite 30B. It indicates that all other samples can be used for the decreasing of water vapor permeability. The big influence of different preparation methods was obtained in case of nanofiller Cloisite 25A and Nanofil 5.
The summary evaluation of measured properties.
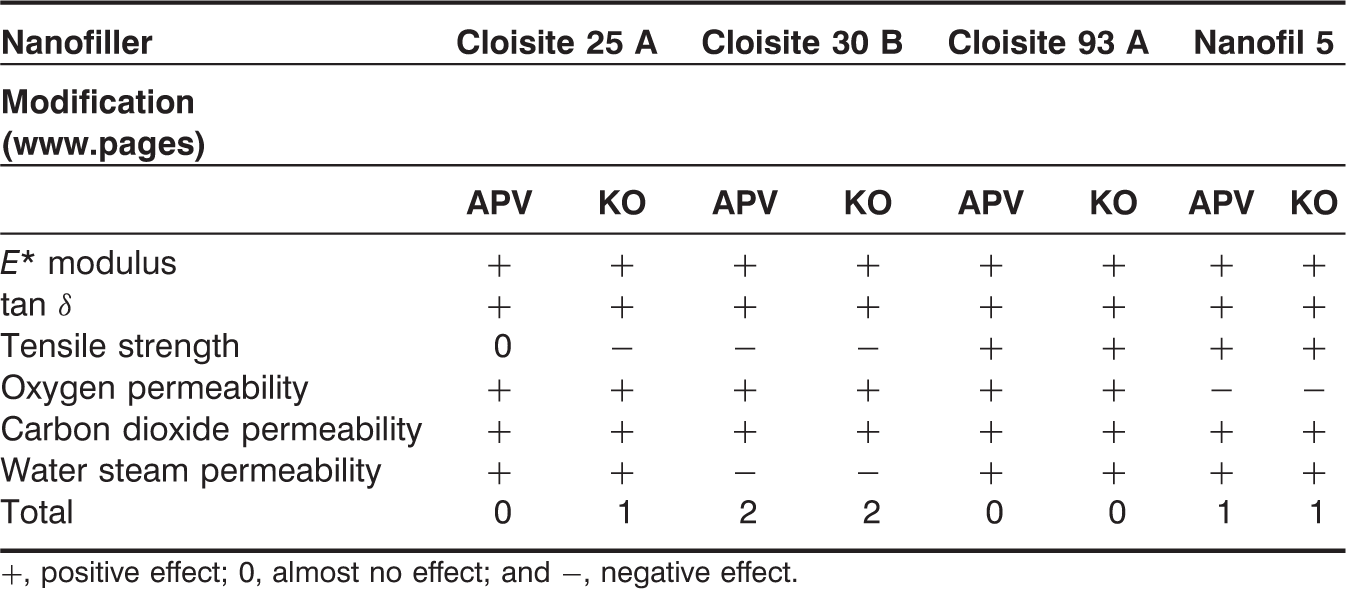
+, positive effect; 0, almost no effect; and −, negative effect.
Conclusions
In this study, the influence of different compounding devices on the PE/nanofiller properties was observed. The samples with choice type of commercial nanofiller were prepared either by the use of KO Buss kneader or APV twin-screw extruder. The morphology, mechanical properties, and permeability of three gases were studied.
Generally, almost in all cases, the results obtained for samples prepared by twin-screw extruder were better than those obtained for KO Buss samples. This phenomenon was different only in the case of E* modulus measurement, where all values increased in the same level disregarding the way of preparation or the type of nanofiller. A little bit different is the situation in case of values tan δ
To sum up, the best results were obtained for the sample of PE/Cloisite 93A prepared by APV extruder.
The future work will follow presented work and it will be focused mainly to the elaboration of influence of other modified conditions used for PE nanocomposite preparation on its properties.
Footnotes
Acknowledgments
This project was supported by the Academy of Sciences of the Czech Republic (project AVOZ4050913). This study has been also partially supported by the Ministry of Education of The Czech republic as a part of the project no. VZ MSM 7088352102.