
Abstract
Many studies, experimental, theoretical, and numerical, have been done on polymer nanocomposites, but nearly all of them have focused on a particular type of material system or some specific material properties. A comprehensive understanding of this complicated material system is still quite lacking. The objective of this study is to use mesoscale finite element simulation to gain insights on the reinforcing efficiencies of different types of carbon nanofillers as distinguished by their geometries and interfacial strengths. It is demonstrated that CNT (carbon nanotube) and CNF (carbon nanofiber) have larger load carrying capacity and potentially higher reinforcing efficiency than GNP (graphite nanoplatelet) due to their larger aspect ratio and physical length. However, the higher load carrying capacity is also associated with higher interfacial stress which can lead to earlier debonding, particularly for CNT. GNP, on the other hand, has lower load carrying capacity, and is thus less sensitive to the bonding condition and less susceptible to debonding. The overall reinforcing efficiency is a manifestation of the interplay between the load carrying capacity of the filler, which is limited by filler’s geometry, and the load transfer capability at the interface, which is limited by the filler/matrix interfacial strength. This interplay is also reflected in the effects of filler orientation on reinforcing efficiency. The insights gained from this study can be used to devise a strategy for developing advanced nanocomposites, such as hybrid composites.
Keywords
Introduction
Carbon based nanofillers such as carbon nanotube (CNT), carbon nanofiber (CNF), and graphite nanoplatelet (GNP), which possess superior strength and stiffness, have emerged as new potential reinforcement materials for developing advanced composites. Unlike traditional composites, carbon nanofillers provide an avenue for tailoring the material properties of the composites at the microscopic level. Among various applications, polymer nanocomposite as a structural material has attracted significant research and development interests due to their lightweight and some other advantages, such as cost effectiveness, etc.
The primary differences between the carbon nanofillers mentioned above are their structures, shapes, sizes, and surface morphologies. The Young’s moduli of CNTs are reported to be greater than 1 TPa and tensile strengths up to 63 GPa, 1 while for CNFs, the Young’s modulus and tensile strengths are in the order of 500 GPa and 5 GPa.2-5 Besides mechanical properties, the structural differences also lead to different surface morphologies and thus different interfacial properties. CNT and GNP have smooth surfaces which result in poor interfacial shear strength (IFSS) or resistance to interfacial sliding. On the other hand, pristine CNF has relatively better interfacial strength due to the mechanical interlocking induced by its zig-zag serrated surface. To enhance the interfacial properties, various methods for functionalization or surface treatment of nanofillers have been proposed.6,7
In recent years, hybrid composites which employ mixture of different types of fillers have attracted increased attention. As some examples: bigger GNP flakes were found to have greater reinforcement efficiency at all GNP concentrations and a mixture of CNT and GNP of ratio of 9:1 resulted in marked improvement in fracture toughness of the hybrid composites 8 ; CNTs/GNPs/epoxy nanocomposites and CNTs/GNPs/epoxy/carbon fiber composite laminates were found to have optimal characteristics with reinforcement through CNTs/GNPs hybrids addition 9 ; mixtures of CNF/GNP were observed to be more effective than CNF alone in increasing the tensile strength of the high-density polyethylene (HDPE) composites, 10 etc. Obviously, the enhancement of the composites resulting from mixture of different fillers is attributed to not only the contribution from individual fillers, but also their interactions or the synergetic effects. However, even for individual contributions, there still has not been a comprehensive understanding on the relative strengths and weaknesses between different types of fillers. Most of the studies conducted so far have focused on a particular material system. For example, Needleman et al. 11 studied the effects of interfacial properties on composite properties, but only for CNT composites. Safaei et al. 12 studied the effects of volume fraction and filler aspect ratio, but only on GNP composites. Liu and Brinson 13 is one of very few which has investigated the relative reinforcing efficiencies between nanotube and nanoplatelet fillers, but focused only on the elastic properties of composites. Furthermore, they did not take the interfacial strength which plays a critical role on the overall composite performance into consideration. In summary, the studies mentioned above have shed some light on a particular material system or property but have not provided a comprehensive picture on the reinforcement contributions from different types of carbon nanofillers which have distinct geometries and interfacial properties.
Objective and approach
The overall objective of this study is to gain insights on the reinforcement efficiencies of different types of carbon nanofillers as distinguished by their geometries and interfacial strengths. Since filler/matrix interface plays a critical role on the performance of the composites, the effects of interface and their interaction with different types of nanofillers at different orientations on the elastic-plastic behavior of the composites are a major part of this study.
Simulation design and setup
A mesoscale finite element analysis is used to address the aforementioned research objective. The simulation is performed with a commercial finite element software ABAQUS 14 . Shown in Figure 1 are the simulation setups in which a carbon nanofiller is embedded in a representative volume element (RVE). For CNT and CNF, a cuboid RVE as shown in Figure 1(a) is used, while for GNP, a cube is used as shown in Figures 1(b) and 1(c). Different shapes of RVEs are used here in order to accommodate the different shapes of CNT, CNF, and GNP.
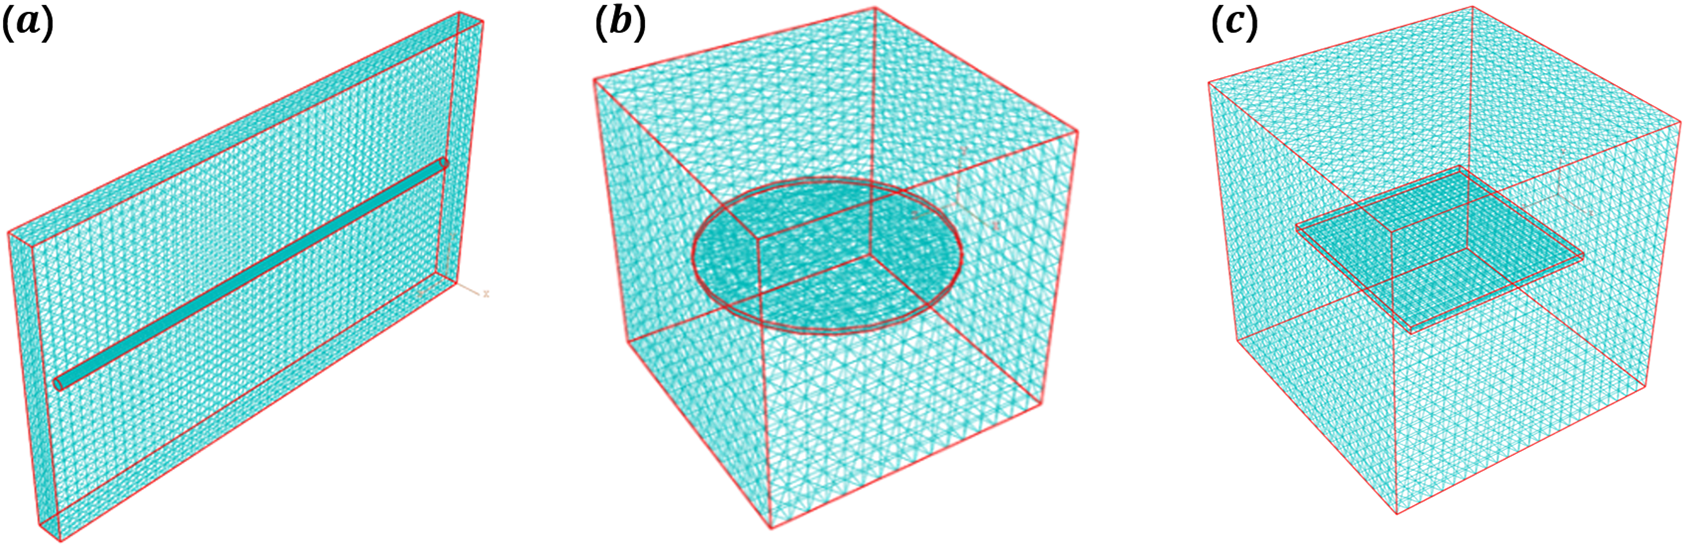
(a) Cuboid RVE for CNT and CNF, (b) cubic RVE for circular GNP composites, (c) cubic RVE for square GNP composites.
The dimensions of RVEs and nanofillers are summarized in Table 1. They are so chosen such that system parameters, such as the aspect ratio and volume fraction of the fillers for different composites, can be controlled in a consistent manner. As will be shown and discussed later, maintaining the system parameters in a consistent manner, is vital for making meaningful comparisons between composites reinforced with different types of fillers. CNT and CNF are modeled as straight solid cylinders with an aspect ratio of l/d, where l is the length of the filler and d is the diameter. For GNP, two different shapes are investigated, namely a circular disk with an aspect ratio of D/t, 13 where D is the diameter and t is the thickness; and a square disk with an aspect ratio of W/t, 13 where W is the width and t is the thickness. This study is focused on the circular GNP (C-GNP). The square GNP (S-GNP) is only used to address the issue of filler shape as will be discussed later.
Dimensions of nanofillers and their RVEs. Units for lengths are in nm.
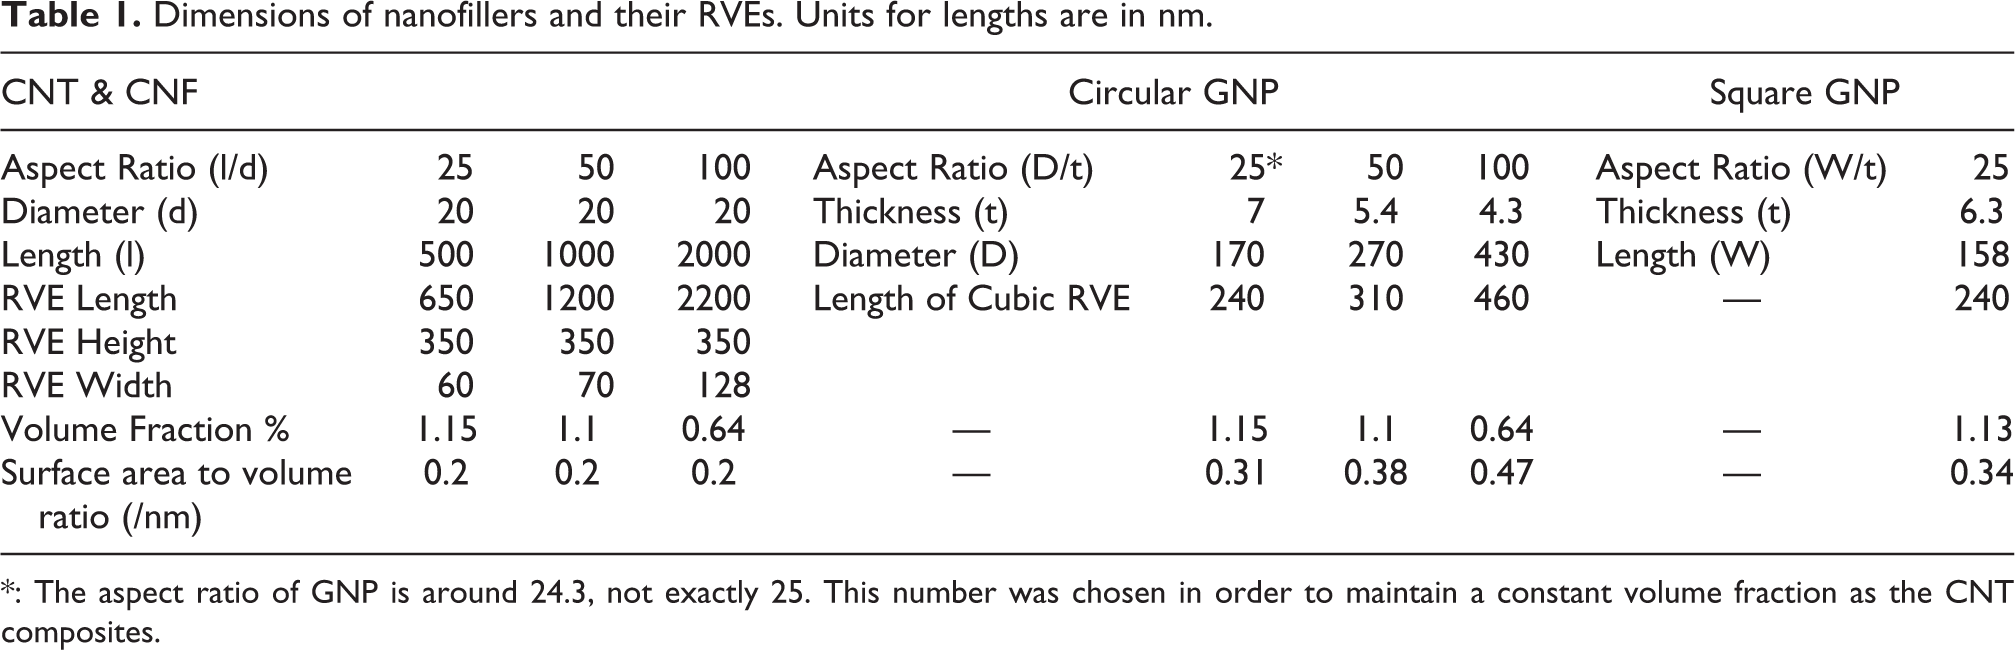
*: The aspect ratio of GNP is around 24.3, not exactly 25. This number was chosen in order to maintain a constant volume fraction as the CNT composites.
The eight-node brick element with reduced integration and hourglass control (C3D8R) is used for the nanofillers. Mesh grids of 4 nm are generated on the cross section and then extended along the axial direction. For the matrix, flexible four-node linear tetrahedron (C3D4) element is used to more easily accommodate the asymmetry induced by inclined fillers. Mesh grids with average size of 15 nm are generated based on the nodes defined along the edge of the matrix. The boundary conditions imposed on RVE are shown in Figure 2. The right, bottom, and back surfaces are on roller support. The left surface is subject to a tensile displacement-controlled loading. A homogeneous boundary condition (plane remains plane) is applied to the top and the front surfaces to maintain the rectangular shape of the RVE. Our comparison studies show that this set of boundary conditions is computationally more efficient but yields essentially the same results as the more rigorous but computationally more intensive periodic boundary conditions. The tensile loading is applied at a strain rate of 0.01/s and the maximum strain is set at 0.3. The simulation setup was validated against the results reported by Needleman et al. 11

Boundary conditions applied on the RVE. P.R.P. stands for “plane remains plane.”
The overall uniaxial stress (

and

where F is the tensile force calculated by

with Fi being the nodal force at node i on the left surface (see Figure 2). 15 A is the current cross sectional area, and L and L0 are the current and original lengths, respectively.
Material models
Fillers
Although CNT is stiffer and stronger than CNF, their stiffnesses and strengths are both much higher than those of the polymer matrix, i.e. the differences between these properties are expected to have very limited effects on the mechanical performance of the composites. Accordingly, the carbon nanofillers are modeled as an isotropic linear elastic solid with a Poisson’s ratio of 0.33 and an elastic modulus of 1 TPa, i.e. the elastic properties for CNT. 11
Polymer matrix
The polymer matrix is modeled with Johnson-Cook model 16 as described below,

where

Comparison of experimental data of HDPE under uniaxial compression loading with the Johnson-Cook model used in this study.
Filler/matrix interface
The behavior of the filler/matrix interface is modeled by the cohesive zone model (CZM) available in ABAQUS. 14 A review of different forms of this phenomenological model can be found in the work by Park and Paulino. 17 In this study, the interfacial traction-separation behavior is described by a bilinear relation, which is reasonably justified from the MD simulation results. 18 In addition, the normal and shear responses are assumed to be decoupled, essentially a linear response. This assumption is consistent with the bilinear relation mentioned above. From practical point of view, since little is known about the details of the interaction between the normal and shear response of the interface, there is little justification to adopt more complicated relation at this point. As will be discussed later, although the traction-separation relations are decoupled as in isotropic linear elasticity, the criteria for damage initiation and final debonding do take load coupling into consideration as in energy-based fracture criteria in fracture mechanics. For decoupled linear behavior, the initial elastic traction-separation relation is given by the following form:
where T is the traction on the surface, Δ is the distance of separation, and [K] is the interfacial stiffness matrix. The subscripts n, s and t indicate the normal and the two mutually perpendicular shear directions, respectively. The distance of separation in each direction is defined as the displacements of slave surface nodes relative to their corresponding projection points on the master surface.
After reaching a critical interfacial strength, damage initiates and the interface starts to degrade. For a mixed-mode loading, the damage initiates when the combination of individual separation reaches a threshold defined by a quadratic relation as follows:
where
The damage evolution is described by a scalar damage variable D, which has an initial value of 0 and monotonically increases until it reaches the maximum value, 1, where interface is completely separated. The evolution of the damage follows the following rule:

where

where Gn, Gs, and Gt refer to the energy dissipated at the current separation condition, and
The tractions for the damaged interface are related to the damage variable D by the following relations:


where
Since the interfacial properties, namely strength and toughness, depend on many factors such as size, shape, configuration, and property of the fillers and host matrix, it is not surprising that there are a wide range of variations on their quantitative values. The interfacial properties for pristine carbon nanofillers used in this study were based on the results from a MD study
18
and other literatures.5,19-26 Specifically, the interfacial shear strengths (IFSS) for CNT, GNP, and CNF are set to be 25 MPa, 25 MPa, and 100 MPa respectively. As mentioned in the Introduction section, CNT and GNP both have smooth surface which results in lower IFSS. In contrast, CNF has zig-zag serrated surface which results in better mechanical interlocking and higher IFSS. The normal separation between filler and matrix is governed by Van der Waals interactions instead of the surface morphology. Since the interfaces studied here are simply carbon atoms and polymer molecules regardless of the types of nanofiller, it is assumed that all the nanofillers have the same interfacial normal strength of 100 MPa. The critical separation at damage initiation,
Since the main objective of this study is to use parametric study to gain insights on the interaction between filler and matrix and the resultant mechanical performance of the composites, in addition to the interfacial conditions mentioned above, two additional conditions are also considered, one is perfect bonding with which filler and matrix never separate and the other is an extremely weak bonding. These four bonding conditions are designed as bond A (perfect bonding), B (pristine CNF type bonding), C (pristine CNT/GNP type bonding), and D (extremely weak bonding). The traction-separation responses for bonds B, C, and D are shown in Figure 4, and the relevant material parameters are summarized in Table 2.

(a) Normal interfacial traction-separation behavior for bonds B, C, and D; (b) shear interfacial traction-separation behaviors for bonds B, C, and D. Bond A is perfect bonding. The area under traction-separation relation is the critical fracture energy Gc.
Material parameters used in cohesive zone model for different types of bonding, B (pristine CNF type bonding), C (pristine CNT/GNP type bonding), and D (extremely weak bonding). Refer to Figure 4 for their interfacial behavior. Bond A is perfect bonding.

Effect of filler shape and interface on reinforcing efficiency of the composites
Two types of shapes are investigated here, namely cylindrical rod which resembles CNT/CNF and circular disk which resembles GNP. Refer to Figure 1 for the shapes of the fillers. The difference between CNT and CNF in this study is the higher interfacial strength associated with CNF due to its zig-zag serrated surface as mentioned earlier. The volume fractions and aspect ratios are controlled at 1.15% and 25, respectively. Within these constraints, the surface/volume ratios cannot be adjusted independently. They are 0.2 and 0.31 for CNT/CNF and GNP, respectively. Other geometric dimensions are given in the second and sixth columns of Table 1, for CNT/CNF and GNP, respectively.
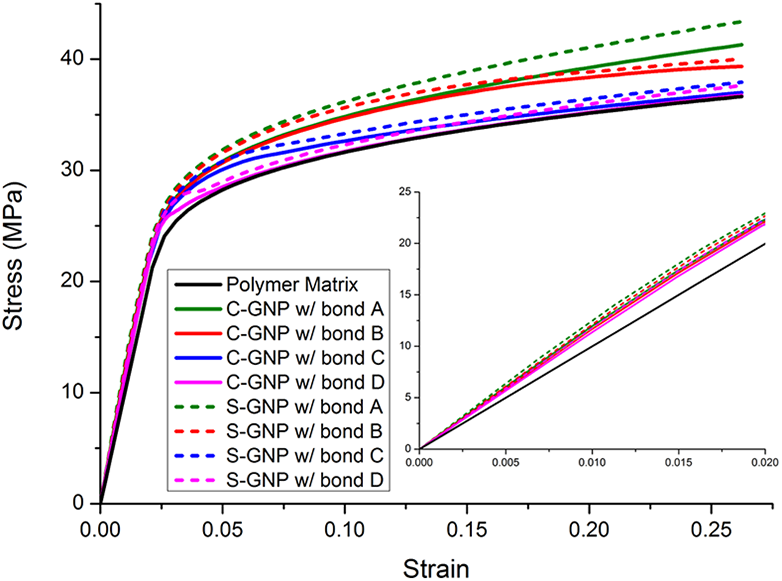
The simulated results for both composites with different types of interface are shown in Figure 5. Note that CNT with type B bonding essentially represents pristine CNF and CNT with type C bonding represents pristine CNT. Under ideal or perfect bonding condition (type A bonding), CNT has the highest reinforcing efficiency as would be expected. However, as demonstrated in Figure 5, pristine CNT (with bond C) appears to contribute to the reinforcement of composites only at relatively low stress or elastic regime, but has very poor performance in the high stress or plastic regime. Under type D bonding, the reinforcing from CNT is limited to a small part of the elastic region. Figure 5 also demonstrates that pristine CNF (with type B bonding) has much higher reinforcing efficiency than pristine CNT apparently due to its higher interfacial strength. For GNPs, the performances are somewhat less sensitive to or affected by the types of the bonding. Type A and type B bonding have almost the same and type C has relatively inferior performance, but all three perform better than pristine CNT. For type D bonding, GNP appears to have slightly better overall (elastic-plastic) performance than CNT although both are quite poor.

Effect of filler shapes, cylindrical rod (CNT/CNF) vs circular disk (GNP), and interfacial properties on the responses of resultant composites. The inserts are the magnified elastic response. All composites have a volume fraction of 1.15%. Both fillers have the aspect ratio of 25. The geometric dimensions of the corresponding composites can be found in the second and sixth columns of Table 1. Refer to Figure 4 for different types of bond.
To comprehend the above results, the perfect bonding condition is considered first. Under this condition, CNT has much better reinforcing efficiency than GNP even though both fillers have the same aspect ratio and both composites have the same volume fraction of fillers. The difference is apparently attributed to the geometries of the fillers. CNT has longer length relative to the critical length and thus can carry more load, i.e. a better load carrying capacity. On the other hand, to maintain the constraint of constant volume fraction, the diameter of GNP has to be smaller than the length of the CNT (physically this is the case too) in order to have the same volume as CNT and same number of fillers in a reference volume. Because the relatively shorter physical length, the load carrying capacity for GNP is reduced. To illustrate this point, distributions of the maximum principal stress inside the CNT and GNP fillers for composites with type B bonding at a strain of 0.05 are shown in Figure 6. The maximum value attained in CNT is around 1.4 GPa and it is only about 600 MPa in GNP.
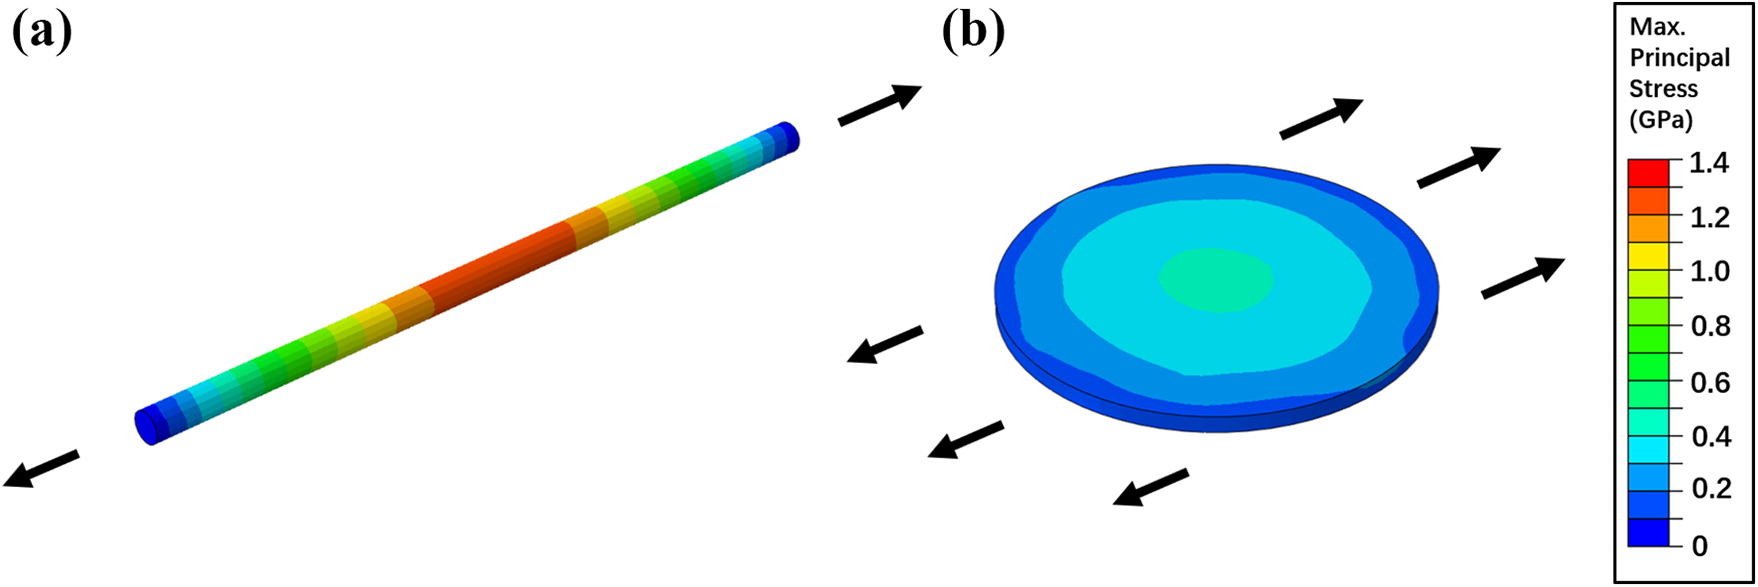
Distribution of maximum principal stress in fillers with bond B at a strain of 0.05. (a) CNT, (b) GNP. Arrows indicate the loading direction.
As mentioned earlier, the aspect ratio for the circular GNP is often defined as the ratio between diameter and thickness. Based on this definition, the CNT and GNP fillers studied here have the same aspect ratio, but very different performance. Since most of the load transfer from matrix to the filler occurs on the circular surface, a ratio based on the in-plane dimensions would seem to be more sensible. In this case, the aspect ratio of a circular GNP is 1, i.e. D/D where D is the diameter. This very small in-plane aspect ratio and limited physical size are basically the reason why GNP has much smaller load carrying capacity than CNT. Since the load is transferred to the filler through the filler/matrix interface, the higher load carried by the filler is also associated with higher interfacial stress and earlier debonding or interfacial failure, particularly for CNT. On the other hand, the smaller load carried by GNP results in smaller interfacial stress. Another possible contribution to lower interfacial stress is the larger surface area of GNP compared to that of CNT as evidenced by the higher surface/volume ratio of GNP, i.e. 0.31 for GNP vs 0.2 for CNT. As mentioned earlier, once the volume fraction (1.15%) and aspect ratio (25) are fixed, the surface/volume ratio cannot be adjusted independently. Due to the lower interfacial stress as discussed above, GNP appears to be less sensitive to the types of bonding and less susceptible to debonding. As a result, the overall performance of pristine GNP is better than pristine CNT. To demonstrate this point, distributions of interfacial shear stress at a strain of 0.26 for CNT and GNP composites with type D bonding are shown in Figure 7. This figure shows that about half of CNT has separated from the matrix, i.e. debonded, while for GNP, debonding occurs only around the edge of GNP.

Distribution of interfacial shear stress along the loading direction of GNP and CNT with bond D at strain of 0.26. The debonding is less prominent on the GNP surface than that of the CNT.
For GNP, besides aspect ratio, the filler shape also plays an important role on the composite performance. As an example, the mechanical behavior of a composite reinforced with square GNP (S-GNP) is also simulated for different types of bonding and compared with those with circular GNP. The results are shown in Figure 8. Both circular and square GNPs have the same aspect ratios, 25 for out-of-plane, and 1 for in-plane, and approximately the same surface/volume ratio, 0.31 and 0.34, and both composites have the same filler volume fraction, 1.15%. The details of the geometric dimensions are given in the 6th and 10th columns of Table 1. As shown by Figure 8, the composites reinforced with square GNPs perform better than those with circular GNPs in terms of both stiffness and strength. The performance enhancement can be comprehended with a schematic where the composites are cut into slices and each slice contains a rod type filler. As shown in Figure 9, the circular GNP disk is somewhat equivalent to a set of multiple rods, a majority of which has smaller aspect ratios relative to those around the center. On the other hand, the square disk is equivalent to a set of rods with uniform aspect ratio close to that at the center of the circular disk. As mentioned earlier, it was reported that bigger GNP flakes showed greater reinforcement at all GNP concentrations. 8 Figure 9 and the above discussion provide a good insight on this experimental observation. It is worth mentioning that in reference, 13 a similar study was conducted to investigate the elastic modulus of nanotube and nanoplatelet reinforced composites. The authors reported that nanotube-reinforced composites had a higher modulus than GNP composites due to largely the higher surface to volume ratio of CNT which leads to larger amount of interphase between filler and matrix. However, as shown by Table 1, the surface/volume ratio of CNT is less than that of GNP when the conditions of constant volume fraction and constant aspect ratio are enforced, yet the CNT composites still exhibit higher elastic modulus than GNP composites. Thus, the in-plane aspect ratio as discussed above may play a more critical role on the reinforcement of the composite with nanoplatelet fillers.
Comparison of the stress-strain responses of the composites reinforced with circular (C-GNP) and square GNP (S-GNP). The inserts are the magnified elastic response. All composites have a volume fraction of 1.15%. Both C-GNP and S-GNP have the aspect ratio of 25. The geometric dimensions of the corresponding composites can be found in the 6th and 10th columns of Table 1.
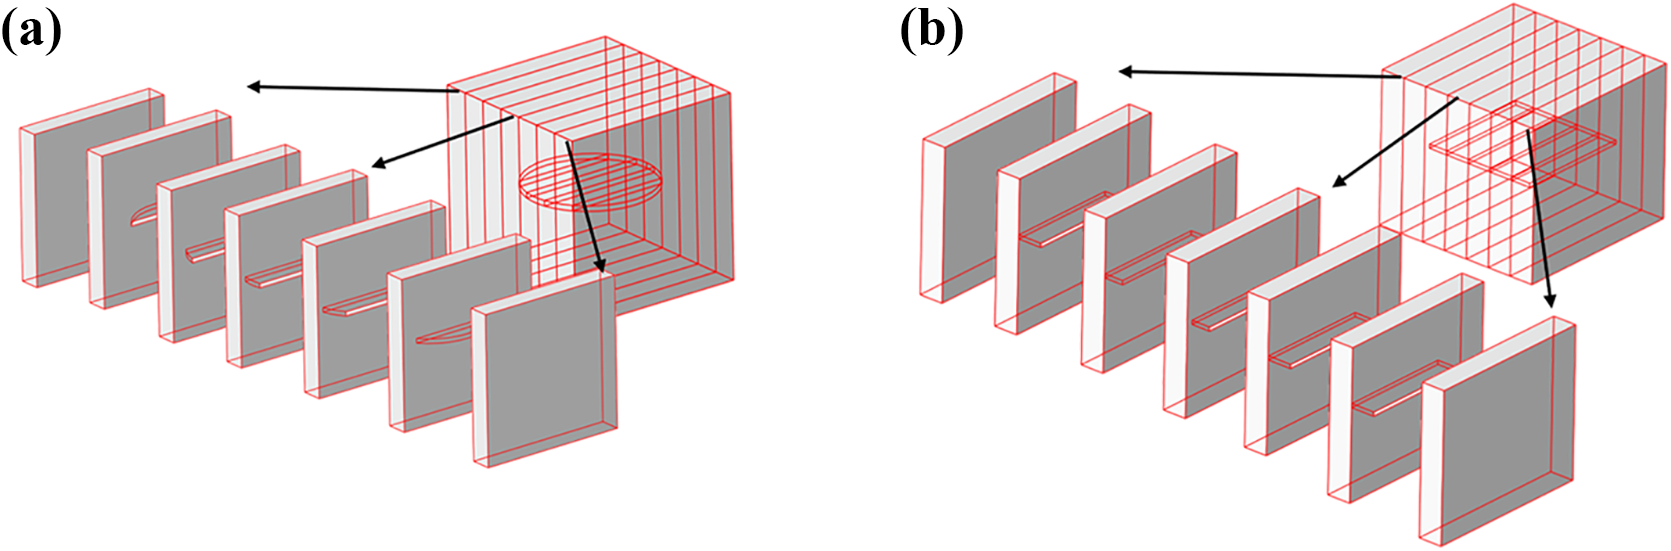
(a) Sliced RVE containing circular GNP, (b) sliced RVE containing square GNP.
Effect of filler aspect ratio and interface on reinforcing efficiency of the composites
In this part of the study, the effects of aspect ratio for nanofillers with different shapes are investigated. Here the aspect ratio for GNP is still referred as D/t. Three different ratios are examined, namely 25, 50, and 100. For CNT type fillers, different ratios are realized by changing the length, while keeping the diameter the same; and for GNP type fillers, both the diameters and thicknesses are varied to maintain the same aspect ratios and volume fractions as those for the CNT composites. To accommodate the larger size fillers, the RVE sizes also need to be adjusted. The detailed dimensions are shown in Table 1.
The simulated results are shown in Figure 10. For CNT filler, under perfect bonding condition, increase of the aspect ratio leads to significant enhancement of stiffness and strength. The predicted trend on stiffness is consistent with the experiment results reported27-29 for the composites reinforced with natural fibers. This is again due to the larger load carrying capability associated with larger aspect ratio. However, larger load carrying also leads to higher interfacial stress and earlier debonding. These debondings lead to rapid and catastrophic softening for CNT composites with fillers of aspect ratios 50 and 100 and type B bonding as shown in Figure 10 (b). For C and D bonding, the very weak interface debilitates the strengthening effects regardless of the aspect ratios of the filler. The behavior of the composites with GNP type filler follows the general trend of CNT composites, but much less sensitive to the aspect ratio again because the smaller load carrying capacity or filler stress due to its geometry as discussed in the last section.

Effect of aspect ratio on the stress-strain responses of CNT and GNP composites with different types of bond. The inserts are the magnified elastic response. (a) Composites with bond A, (b) composites with bond B, (c) composites with bond C, and (d) composites with bond D. The composites of filler of 25, 50, and 100 aspect ratios have a volume fraction of 1.15%, 1.1% and 0.64% respectively. The details of geometric dimensions for the fills and composites RVE are given in Table 1. Refer to Figure 4 for different types of bond.
Effect of filler orientation and interface on reinforcing efficiency of the composites
In this part of the work, the effects of filler orientation and interface on reinforcing efficiency are studied. The RVEs containing nanofillers aligned at different orientations, namely, 0°, 30°, 60°, and 90°, are shown in Figure 11. The dimensions for CNT/CNF and GNP composites are the same as those used in the filler shape study as reported in the Section of Effect of Filler Shape and Interface. Simulations of the 60° and 90° CNT and CNF composites are accomplished by subjecting the 30° and 0° RVE to loading in the transverse direction. 30

Orientations of nanofillers relative to the loading direction.
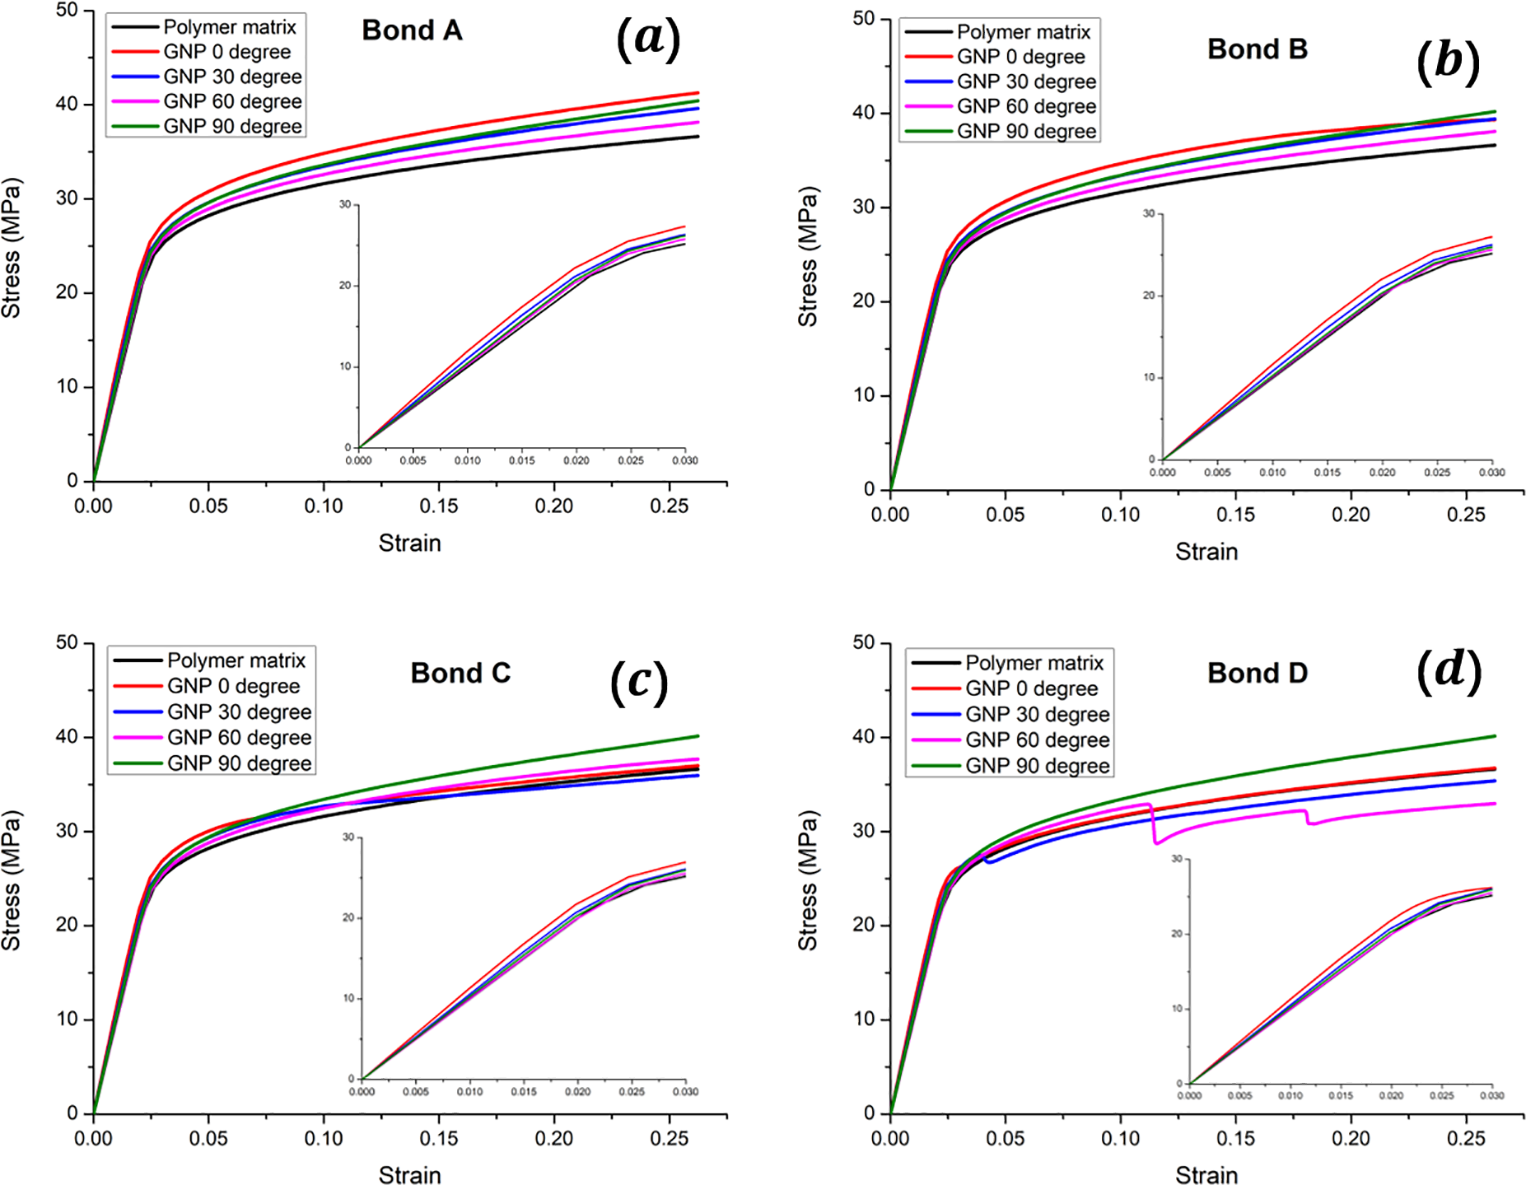
The simulated results for CNT composites are shown in Figure 12. For perfect bonding, both the stiffness and strength of the composites decrease with increased angle of filler or deviation from the loading direction. However, the 90° composite shows stiffer and stronger response than that of 60°, i.e. the trend reverses. Similar observations on fiber-reinforced composites were also reported.30-33 In these works, Young’s modulus of fiber-filled composite was observed to decrease as the angle increases, reached a minimum at about 45–60°, and then increased slightly when the angle increased between 60° and 90°. The composites with type B bond generally follow the same trend as the composites with bond A, but some debonding occurs in 0° and 30° composites in the plastic range as indicated by the leveling off of the stress-strain curves. For type C bonding, debonding occurs prior or close to yield point for 0° and 30° composites, but is not observed for 60° and 90° composites. Furthermore, the 90° composite displayed the highest strength and post-yield flow stress. For bond D, debonding takes place at the early stage of the elastic loading for 0° and 30° composites, and in the plastic range for the other two as indicated by the kinks of the post-yield stress-strain curves. For imperfect bonding, the debonding always occurs earliest for the 0° composites, followed by 30°. It should also be noted that the behaviors of the 60° composite are all very close to that of the matrix material regardless of the types of the bonding.
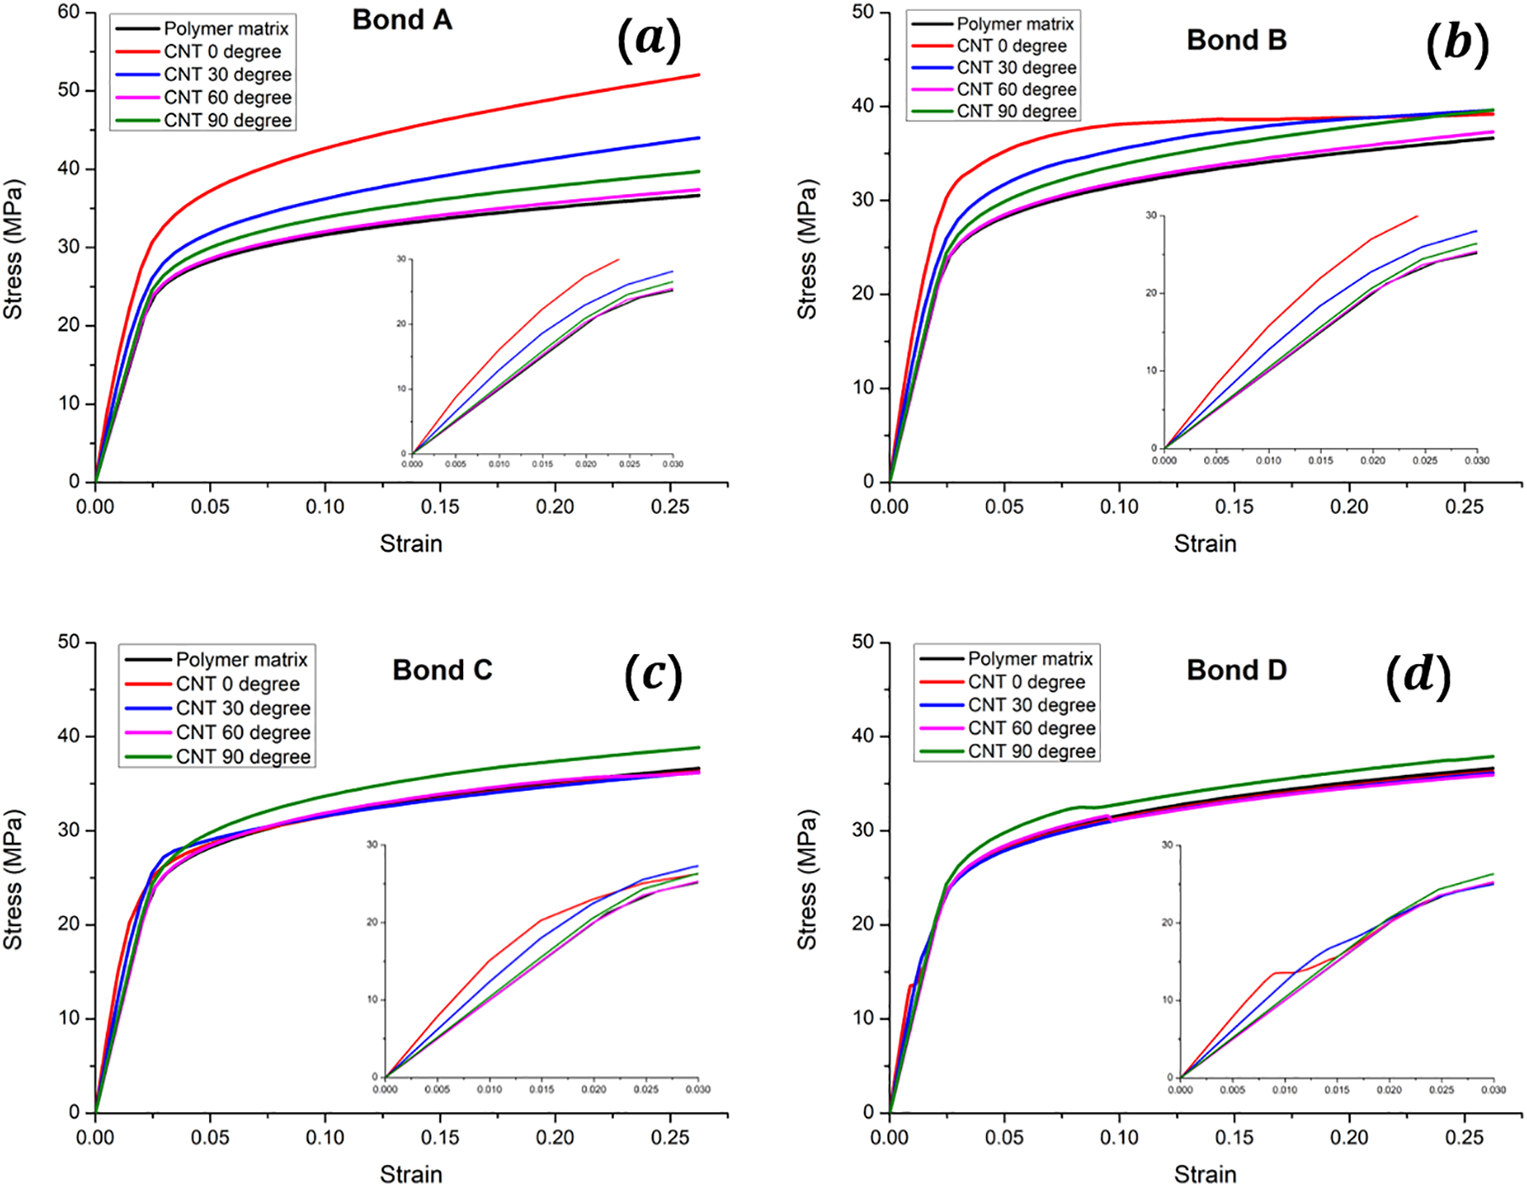
Effect of CNT orientation on the stress-strain responses of CNT composites with different types of bonding. The inserts are the magnified elastic response. (a) Bond A, (b) bond B, (c) bond C, and (d) bond D. The geometric dimensions for CNT/CNF and GNP composites are given in the second and sixth columns of Table 1, respectively. Refer to Figure 4 for different types of bond.
To gain insights on the composite responses displayed in Figure 12, the distributions of Mises stress in the matrix and maximum principal stress in the filler are shown in Figure 13. As shown by Figure 13(a1), debonding takes place at the ends of the filler for 0° composite. For 30° and 60° composites, Figures 13(b1) and (c1) show that the fillers rotate during the deformation. This rotation is very pronounced for the 60° composite. As also shown by Figure 13(c2), the filler carries little stress during the rotation and nearly all the deformation comes from the matrix. This is likely why the response of the 60° composite is almost the same as that of the matrix material regardless of the types of the bonding. Along the same lines, the weaker response of the 30° composite compared to 0° composite is likely attributed to a combination of less load transfer due to deviation of the filler from the loading direction and filler rotation after the load is applied. At 90°, the composites again show some strengthening effect. Because the filler is perpendicular to the loading direction, the load transfer through interface is likely to be small. The strengthening could likely be due to the constraints imposed on the lateral contraction of the matrix by the filler. This can be demonstrated by the high stress in the matrix around the tip of the filler and the fact that the principal stress in filler is mostly compressive for 90° orientation, while it is tensile for 0° and 30° fillers.

Distribution of Mises stress in the matrix and maximum principal stress in the filler of the composites with type B bonding at the strain level of 0.12. Loadings are all in horizontal direction. Refer to Figure (d) for stress scales. The gray blocks in the center are the fillers. The black dash lines in Figures (b1) and (c1) represent the original orientation of filler before deformation. (a) 0° orientation. (b) 30°, (c) 60°, and (d) 90°. The principal stress in Figure (d2) is mostly compressive and those in Figures (a2) and (b2) are tensile.
For comparison, similar plots as those shown in Figure 13 are also made for type C bonding and shown in Figure 14. As shown by these figures, due to early debonding, the filler carries little stress. However, at 90°, Figure 14(d), the filler and the matrix behave similarly to those for type B bonding as shown in Figure 13(d) apparently as a result of the similar strengthening due to the lateral constrains.
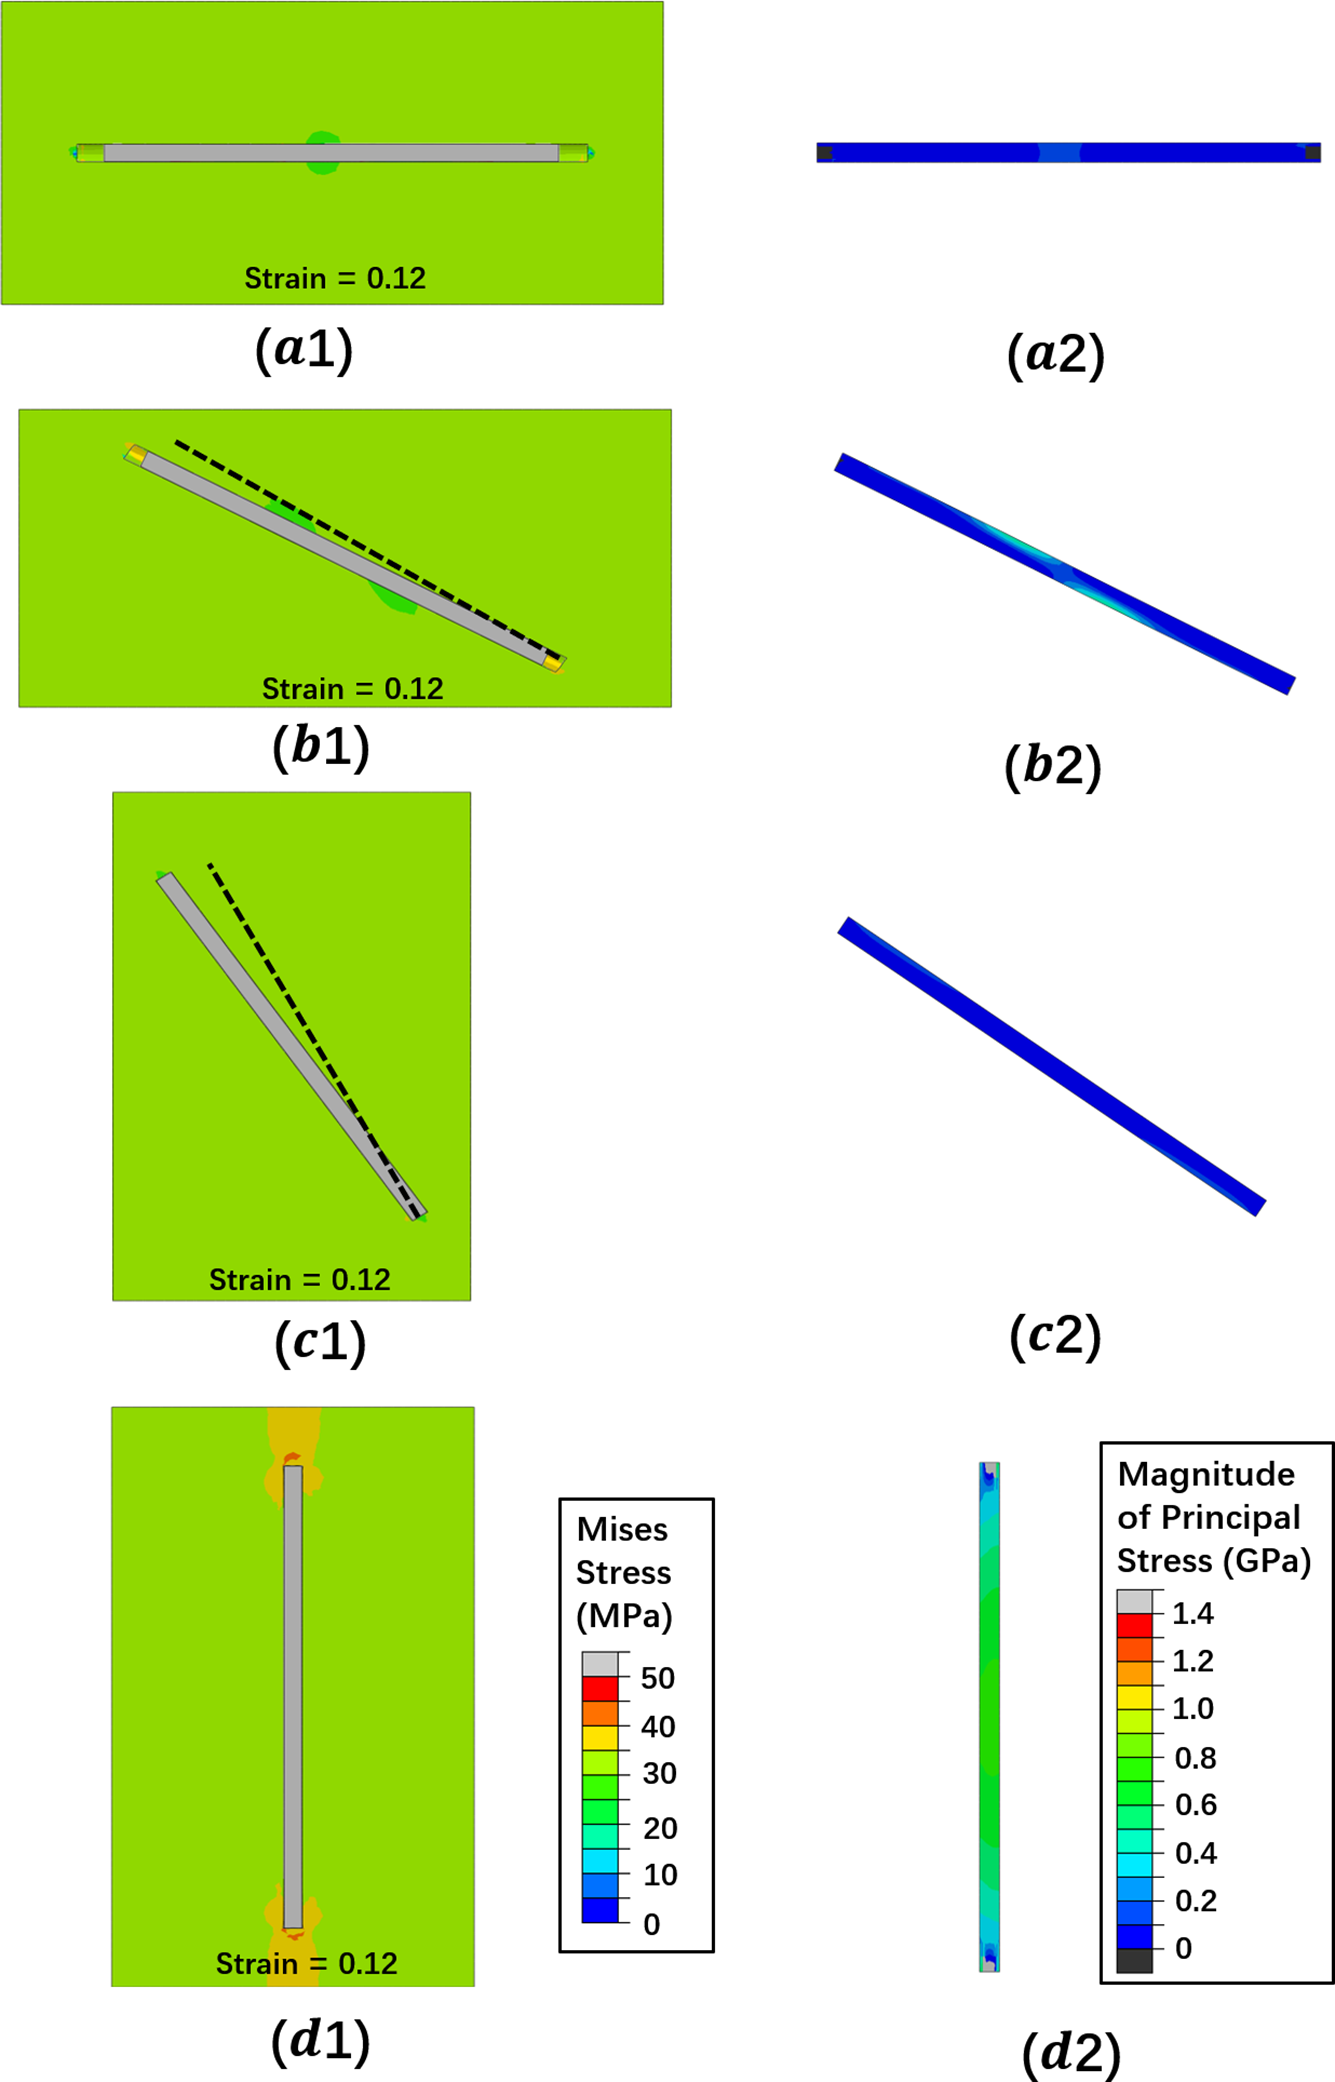
Distribution of Mises stress in the matrix and maximum principal stress in the filler of the composites with type C bonding at the strain level of 0.12. Refer to the caption for Figure 13.
The effects of filler orientation on GNP composites are shown in Figure 15. The general trend is similar to, but less pronounced, than that for CNT composites. For perfect bonding, both the stiffness and strength decrease with the increase of the angle or deviation from the loading axis. This trend is reversed when the angle approaches 90°. As the interface degrades, the performance of composites becomes less sensitive to filler orientation. There are two features that are somewhat unique for GNP compared to CNT composites. One is that the 60° GNP has discernible strengthening effects for all the bonding conditions before debonding takes place. This is likely due to the capability of GNP to support normal traction at the GNP/matrix interface. The other is that the composites with 90° GNP display significantly enhanced strength and stiffness regardless of the bonding condition. For bond types A and B, the post-yield flow stress of 90° GNP composites surpasses that of the 30° composites, and for bond types C and D, the 90° composite has the highest post-yield flow stress compared to other orientations. This is again partially due to the capability of GNP to support interfacial normal traction and that the area supporting the normal traction increases with the angle and reaches maximum at 90°. The other reason is the lateral constraint as mentioned for the 90° CNT composites. Because of the axisymmetric configuration of the 90° GNP, the constraint tends to transition the loading from uniaxial stress to uniaxial strain loading.
Effect of GNP orientation on the stress-strain responses of GNP composites with different types of bonding. The inserts are the magnified elastic response. (a) Bond A, (b) bond B, (c) bond C, and (d) bond D. Refer to Figure 4 for different types of bond.
As also shown by Figure 15(d), for 30° and 60° composites, some stress dips are observed in the post-yield behavior. One stress dip is observed for the 30° composite at a strain around 0.04, and two dips are observed for the 60° composite at strains around 0.11 and 0.18. These dips are related to debonding. The debonding evolution and the associated stress distribution in the matrix are illustrated in Figure 16.

Debonding process in the 60° GNP composites. The gray block in the center is the GNP. (a) Before debonding, (b) at strain around 0.11 (first dip of the flow stress), debonding occurs on the bottom surface of GNP, (c) at strain around 0.18 (second dip of the flow stress), debonding occurs on the top surface of GNP.
To illustrate the combined effects of filler type, filler orientation, and interface on the overall performance of the respective composites, the results for bonds A and B shown in Figures 12 and 15 are reorganized and shown in Figure 17. The results for bonds C and D are not included because of their diminished influences on the composite performance. Figure 17 essentially shows that for orientation less than 30°, CNT composites perform better. As the angle or the deviation from the loading direction increases, the performances of GNP composites are comparable or slightly better than CNT composites. This transition is related to both the load transfer at the interface, i.e. increased role of normal load transfer at the GNP/matrix interface and change of the stress state from uniaxial stress to plane or uniaxial strain loading due to lateral constraints.

Collective effects of interface, types of nanofillers, and filler orientation on the overall stress-strain responses of the composites. (a) 0° filler orientation, (b) 30°, (c) 60°, and (d) 90°. Refer to Figure 4 for different types of bond.
Discussion
In the studies described above, various aspects of reinforcing mechanisms by nanofillers and their interaction with interface have been investigated, such as filler geometry including both shape and aspect ratio and filler orientation. A good way to summarize all these results is to make a prediction of the reinforcing efficiencies of the composites reinforced with different types of nanofillers, namely CNT, CNF, C-GNP (circular GNP), and S-GNP (square GNP), at their pristine conditions, i.e. without surface modifications to enhance interfacial strength. As mentioned earlier, the major difference between CNT and GNP is their geometries and the major difference between CNT and CNF is higher interfacial strength of CNF due to its serrated surface. For the comparison of reinforcing efficiencies at the pristine conditions, CNT and GNP are thus assumed to have type C bonding and CNF has type B bonding. The aspect ratios for all the nanofillers are 25 and the volume fractions of the fillers are all 1.15%. Other dimensions are given in the second and sixed columns of Table 1.
The simulated overall responses for composites reinforced with the aforementioned nanofillers are shown in Figures 18 (a) and (b), for 0° and 90° orientations, respectively. As shown by this figure, for 0° orientation, CNF outperforms other fillers due to a combination of superior loading bearing capacity of the filler and load transfer capability at the filler/matrix interface. CNT performs the worst due to its poor interfacial strength or load transfer capability which leads to early debonding or interfacial failure. For the 90° orientation, the performances of all the composites are comparable to each other, but GNP performs slightly better likely due to its two-dimensional geometry and more enhanced lateral constraint imposed on the deformation of the matrix.

Comparison of the performance of composites reinforced with different types of pristine nanofillers. (a) 0° filler orientation. The inserts are the magnified elastic-plastic transition. (b) 90°. All composites have a volume fraction of 1.15%, and the fillers have an aspect ratio of 25. The geometric dimensions of the corresponding composites can be found in the second and sixth columns of Table 1. Refer to Figure 4 for different types of bond. The inserts are the magnified response at yielding region.
Finally, it should be reiterated that the overall objective of this study is to gain insights on the reinforcement efficiencies of different types of carbon nanofillers as distinguished by their geometries and interfacial strengths. For this purpose, the approach used in this study is essentially a parametric study with the various geometrical and material variables involved in the simulations controlled precisely controlled. The predicted trends are compared with the experimental results wherever applicable and they are demonstrated to be consistent with the experiments. The material system used in the study is idealized. In reality, the practical material systems are much more complicated than those used in the simulations. For example, the nanofillers always have some waviness and tend to form agglomerations instead of standing alone. In addition, they are rarely periodically distributed. As such, very few experimental data are available that can be used to directly compare with the results obtained in this study. There are at least two possible future work that can be followed up from this study. One is to design innovative experiments to mimic the material systems used in the current study. The other is to incorporate more complicated features, such as waviness and/or agglomerations in the study. For the latter, some approaches have been proposed to address the specific issues on waviness and agglomeration,34-36 but not for a comprehensive understanding of a practical material system which involves different types of filler, interface, and distribution besides waviness and agglomeration. For either case, the current work has laid out a foundation for these possible future studies.
Conclusion
In this study, a mesoscale finite element simulation is used to gain insights on the reinforcing efficiencies of different types of nanofillers as manifested by their geometries, orientation, and interfacial strengths. It is demonstrated that the overall reinforcing efficiency is a manifestation of the interplay between the load carrying capacity of the filler, which is limited by filler’s geometry, and the load transfer capability at the interface, which is limited by the filler/matrix interfacial strength. For pristine fillers, carbon nanofiber (CNF), which has serrated surface, possesses better interfacial strength than carbon nanotube (CNT) or graphite nanoplatelet (GNP) which has smooth surface. Due to its larger aspect ratio and physical length, CNT/CNF filler can support higher stress which leads to larger load carrying capacity and potentially higher reinforcing efficiency. On the other hand, the higher load carrying capacity of CNT and CNF also leads to higher interfacial stress and earlier debonding or interfacial failure, particularly for CNT. Due to its lower load bearing, GNP is less sensitive to the bonding condition and less susceptible to debonding. The interplay between the geometries and interfacial strength of the fillers is also reflected in the effects of filler orientation on reinforcing efficiency. CNT/CNF is most effective when it is aligned with loading direction. As the filler deviates further from the loading direction, the reinforcing efficiency of GNP becomes comparable or even superior to that of CNT/CNF. This is partially due to the two-dimensional geometry associated with GNP. The insights gained from this study on the mechanisms for the reinforcing efficiencies of different types of nanofillers establish a foundation for devising a strategy for developing advanced nanocomposites, such as hybrid nanocomposites.
Footnotes
Declaration of conflicting interests
The author(s) declared no potential conflicts of interest with respect to the research, authorship, and/or publication of this article.
Funding
The author(s) received no financial support for the research, authorship, and/or publication of this article.