
Abstract
Introduction:
The carbon footprint of imaging equipment in radiology is high, but the impact of patient travel for imaging is unclear. This study aimed to quantify distances traveled by ambulatory patients for outpatient MRI, determine the proportion traveling beyond their nearest MRI facility, and estimate the associated excess carbon dioxide equivalent (CO2e) emissions.
Methods:
With research ethics board approval, we retrospectively analyzed provincial MRI data from 2023. Distances from patient home address to the nearest and attended MRI facilities were calculated. CO2e estimates were derived using an online tool (www.carbonfootprint.com/calculator.aspx) with average vehicle size and emissions.
Results:
In 2023, 40 062 provincial MRI scans were performed; isolating single visits for adult patients yielded 27 755 data points. Of these, 19.5% (n = 5400) traveled beyond their nearest MRI facility. Mean round-trip travel was 60.4 km for those attending their nearest site versus 295.6 km for those traveling further (P < .0001). The excess travel produced ~288 metric tons of additional CO2e, equivalent to emissions from 61 large-size gasoline-powered cars driven for 1 year or carbon sequestered by 4762 tree seedlings grown for 10 years.
Conclusion:
Nearly one-fifth of patients traveled farther than necessary for MRI, generating substantial avoidable emissions. Aligning MRI service distribution with population density could lessen the environmental impact of medical imaging.
Introduction
Climate change, driven by the burning of fossil fuels and the resulting increase in atmospheric greenhouse gases, significantly impacts population health. 1 There are several recent studies that emphasize radiology’s role in climate stewardship in health care. Current efforts have focused on reducing unnecessary imaging, prioritizing low-carbon imaging methods, and optimizing equipment energy use.2 -4 Imaging modalities such as CT and MRI are energy-intensive and have a measurable carbon footprint. 3 It has been estimated that radiology departments contribute approximately 9% of the carbon emissions in medicine, with MRI services alone accounting for about 1% of the overall healthcare carbon footprint.3,5
An often overlooked but important contributor to imaging-related emissions is patient travel relating to accessing healthcare. The carbon footprint of patient travel, which is best assessed using a standardized measure of ecological cost termed the carbon dioxide equivalent, 3 should be incorporated in estimates of the carbon footprint of medical imaging. This is even more true in a country such as Canada, which comprises a mix of populated urban and suburban regions, and less populated rural areas. Appropriate resource allocation and system-based efficiency is essential to limit the impact of medical imaging on climate change. 4 Medical imaging providers have the opportunity to lead healthcare initiatives in reducing emissions—both through equipment-related efficiency improvements and by addressing the modifiable factor of travel-related emissions.2,6
Recent events have hampered access to medical imaging services and may have further increased the carbon footprint in radiology. Since 2019, wait times have been prolonged because of the COVID-19 pandemic and associated challenges in healthcare resources, including a national shortage in technologists.4,7,8 According to the Canadian Association of Radiologists, the average wait-times for patients requiring MRI in Nova Scotia (NS) is well beyond the national standard. 4 For example, in 2019 the Fraser Institute reported an average MRI wait-time of 16 weeks in NS, relative to the Canadian average of 9.3 weeks. 9
Because of long wait-times and inequitable access to MRI services, patients often seek MRI services at different facilities, traveling greater distances for quicker access. This represents a source of increased fossil fuel emissions that contributes to the overall carbon footprint of healthcare that, to our knowledge, has not been previously studied. The objectives of this study were therefore to determine the proportion of patients traveling beyond their nearest MRI facility, and to estimate the excess carbon dioxide equivalent (CO2e) emissions resulting from this added travel. We hypothesized that excess travel for MRI would represent a substantial source of added CO2e.
Methods
Study Design and Cohort
This retrospective study was conducted at the Queen Elizabeth II Health Sciences Centre in Halifax, NS. The study was approved by the institutional Research Ethics Board as a Quality Improvement project, and the need for patient consent was waived. Data were extracted from the provincial Picture Archiving and Communication System (PACS), a database that includes all publicly performed diagnostic imaging tests in NS. All adult ambulatory patients who underwent MRI examinations in 2023 were included. Nova Scotia Health is divided into 4 geographic zones: Central, Eastern, Western, and Northern. There were 9 MRI units in the province in 2023. This includes 3 scanners in the Central Zone, 2 in the Northern Zone, 2 in the Eastern Zone, and 2 in the Western Zone10,11 (Supplemental Table 1, Supplemental Figure 1). All MRI units are 1.5 T apart from one 3 T unit in Halifax. Patients were excluded if they reside outside of Nova Scotia or if their address could not be located with the Google Maps application programming interface (API).
Data Collection
The list of all patients who underwent ambulatory MRI in NS in 2023 was extracted by the Diagnostic Imaging Provincial Quality Improvement and Stewardship Lead (SS). For each patient, the age, sex, home address, and location of MRI service was extracted. The MRI facility closest to the patient’s home address was recorded.
Travel Distance and Emissions Calculation
The Google Maps distance matrix API key (Version 4.10) was used to map the driving distances between the listed home address and each of the hospitals in NS with MRI capability. The process of generating distances from all patients’ homes to each of the MRI capable facilities was automated in Python (Version 3.11). We excluded any one-way distance that exceeded 600 km, the provincial tip-to-tip driving distance, and confirmed that these aberrant results were generated from the addresses recorded in the database that could not be located on Google Maps, and instead, localized to similarly named locations outside of NS. We then performed manual random sampling of 300 of the discrete ambulatory MRI appointments included in this study within Google Maps to validate our method of driving distance calculation. For each patient, we compared (a) the distance to the MRI facility attended, and (b) the distance to the nearest MRI capable facility. The difference between these 2 distances was considered excess travel.
Estimated CO2e emissions were calculated using an established online carbon footprint calculator (https://www.carbonfootprint.com/calculator.aspx 12 ). This website estimates the amount of carbon dioxide produced based on estimated vehicle emissions for a gasoline-powered vehicle, and the distance traveled. In estimating the carbon footprint, we selected a large-sized gasoline-powered car above 2.0 L. This reasonably estimates true emissions as passenger cars accounted for 36.7% of all vehicle registrations in 2023 in NS, whereas sports utility vehicles, crossovers, pickup trucks, and vans represented a larger 56.2% share. 13 In terms of fuel, gasoline- and diesel-powered vehicles comprised 92.4% and 5.6%, respectively, of vehicle registrations in NS in 2023. By contrast, low emission plug-in hybrid electric, hybrid electric, and battery electric vehicles accounted for only 1.9%. 13 Our assumption that the vehicles are gasoline-powered is reasonable given these numbers and the additional consideration that only 42.5% of electricity generated in 2023 in NS came from renewable sources. 14
Statistical Analysis
Descriptive statistics were used to summarize demographic and travel data. Chi-squared tests were applied for categorical comparisons between health zones. Paired and unpaired t-tests assessed differences in continuous variables. Ninety-five percent confidence intervals (CIs) for continuous variables were calculated as the mean ± 1.96 × standard error, where the standard error is the standard deviation divided by the square root of the sample size. A P-value of <.05 was considered statistically significant. All analyses were performed using Microsoft Excel for Mac (Version 16.97.2).
Results
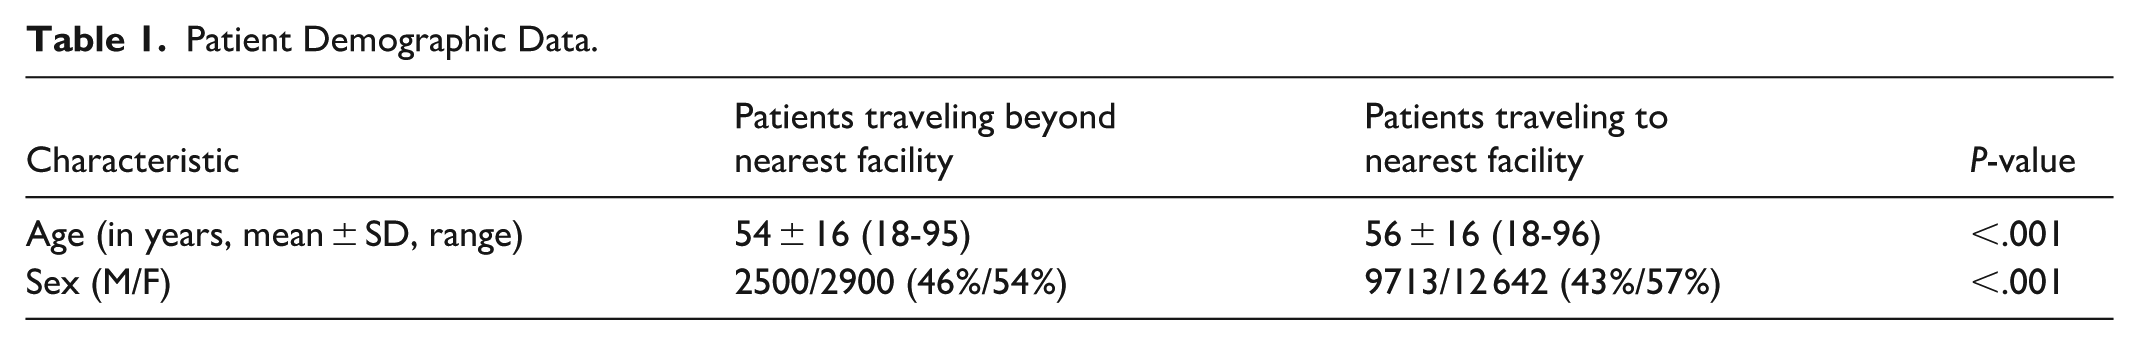
Figure 1 is a flowchart of the study cohort. There were 27 755 discrete ambulatory MRI appointments (56% female, 44% male) in 2023 included in the analysis. Cumulative demographic data is summarized in Figure 2. There were statistically significant differences in mean age or gender (P < .001) between the group of patients who traveled to their nearest hospital versus those that did not (Table 1). However, the mean differences between the 2 groups were small (2 years by age, 3% by sex) and not clinically significant.
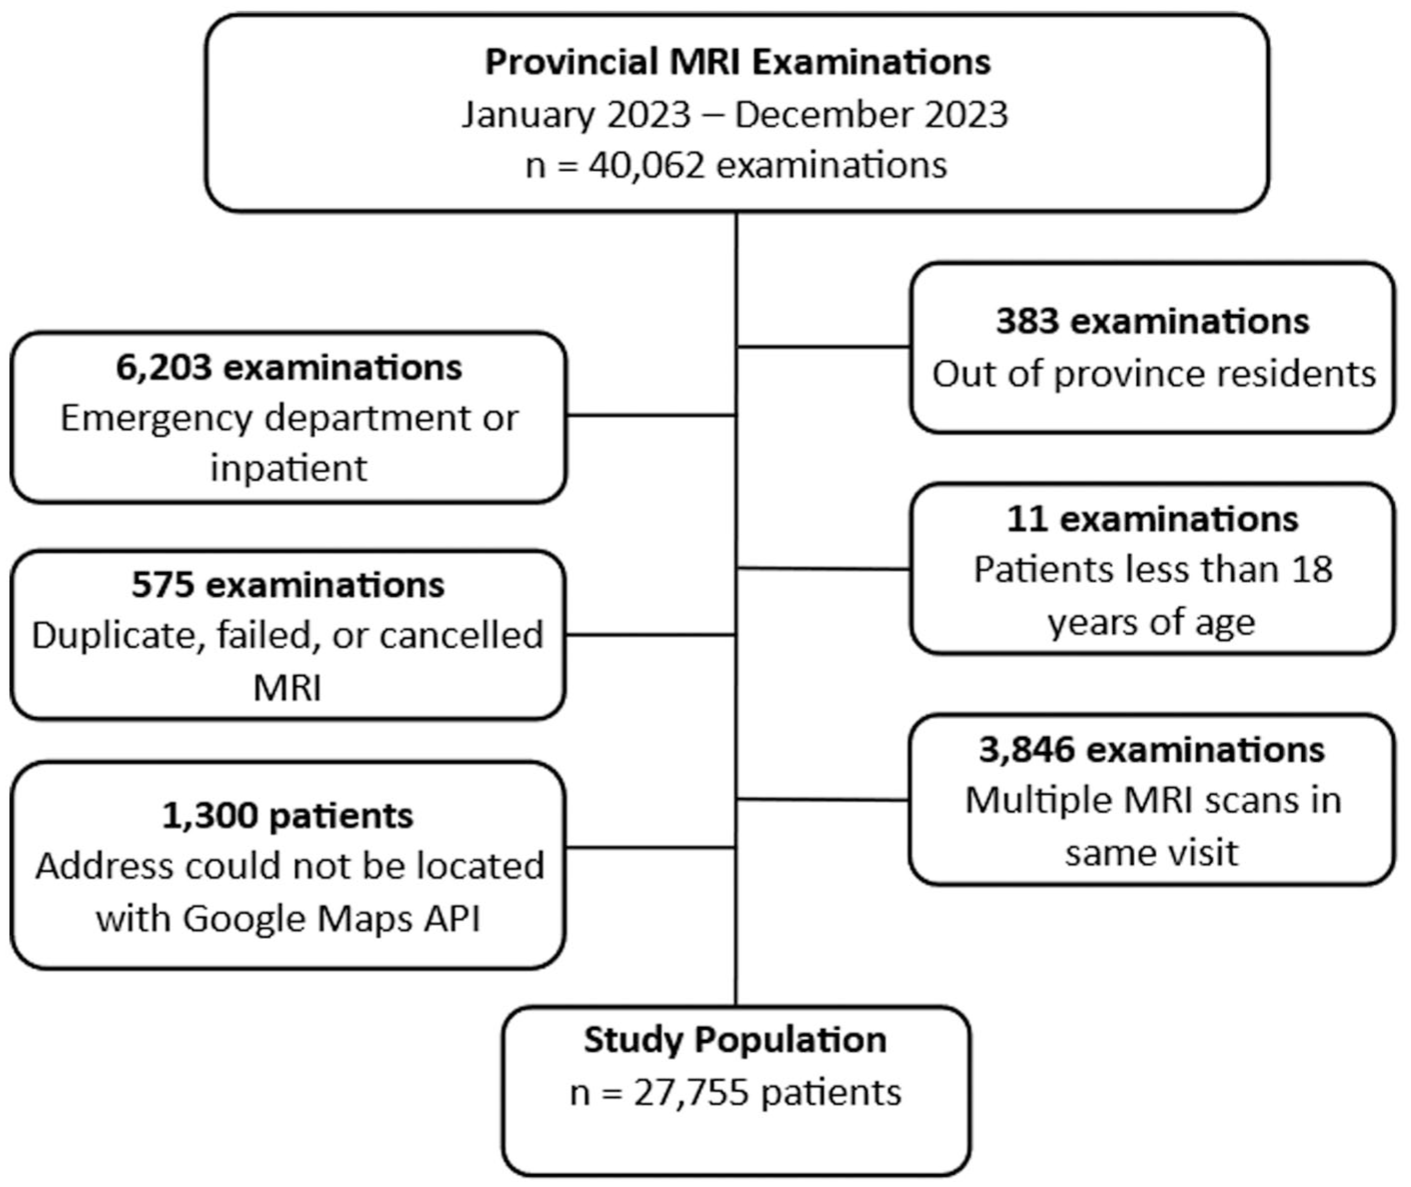
Patient flowchart.
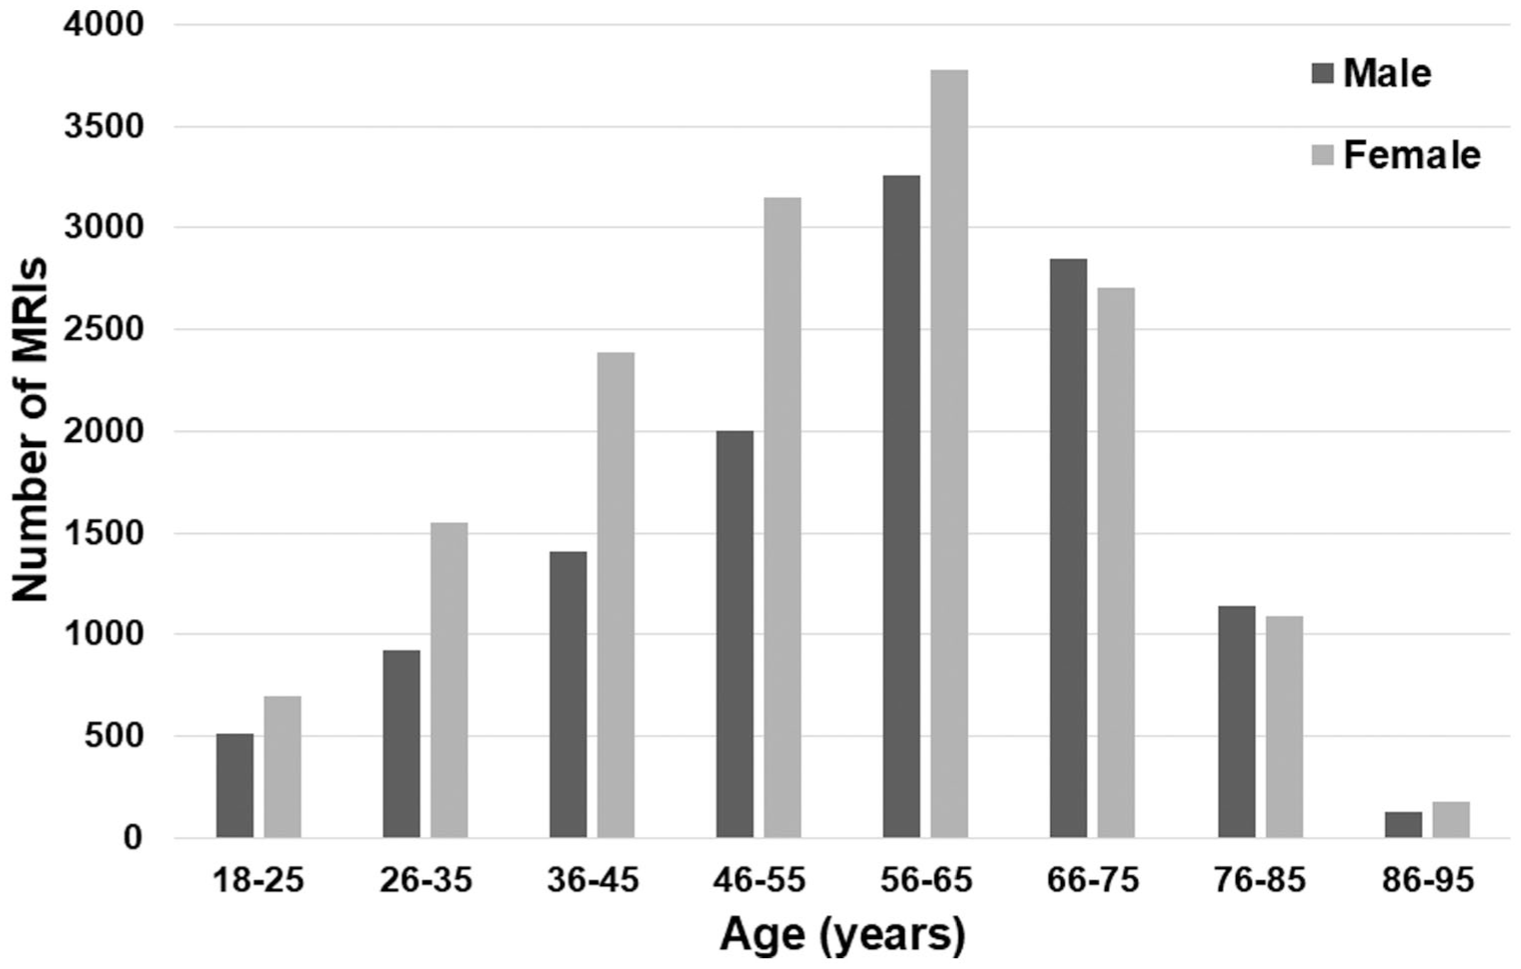
Patient demographic data.
Patient Demographic Data.
Among our cohort of 27 755 patients, 5400 (19.5%) traveled beyond their nearest MRI facility to be scanned. The proportion of patients from each health zone traveling beyond their nearest facility for MRI services varied significantly by zone (P < .0001), ranging from 11.5% in the Eastern Zone to 25.2% in the Western Zone (Table 2). The Central Zone accounted for the greatest proportion of patients who traveled beyond their nearest MRI facility for scans in 2023 (n = 2224/5400; 41.2%).
Summary of MRI Patient Travel Data by Zone.
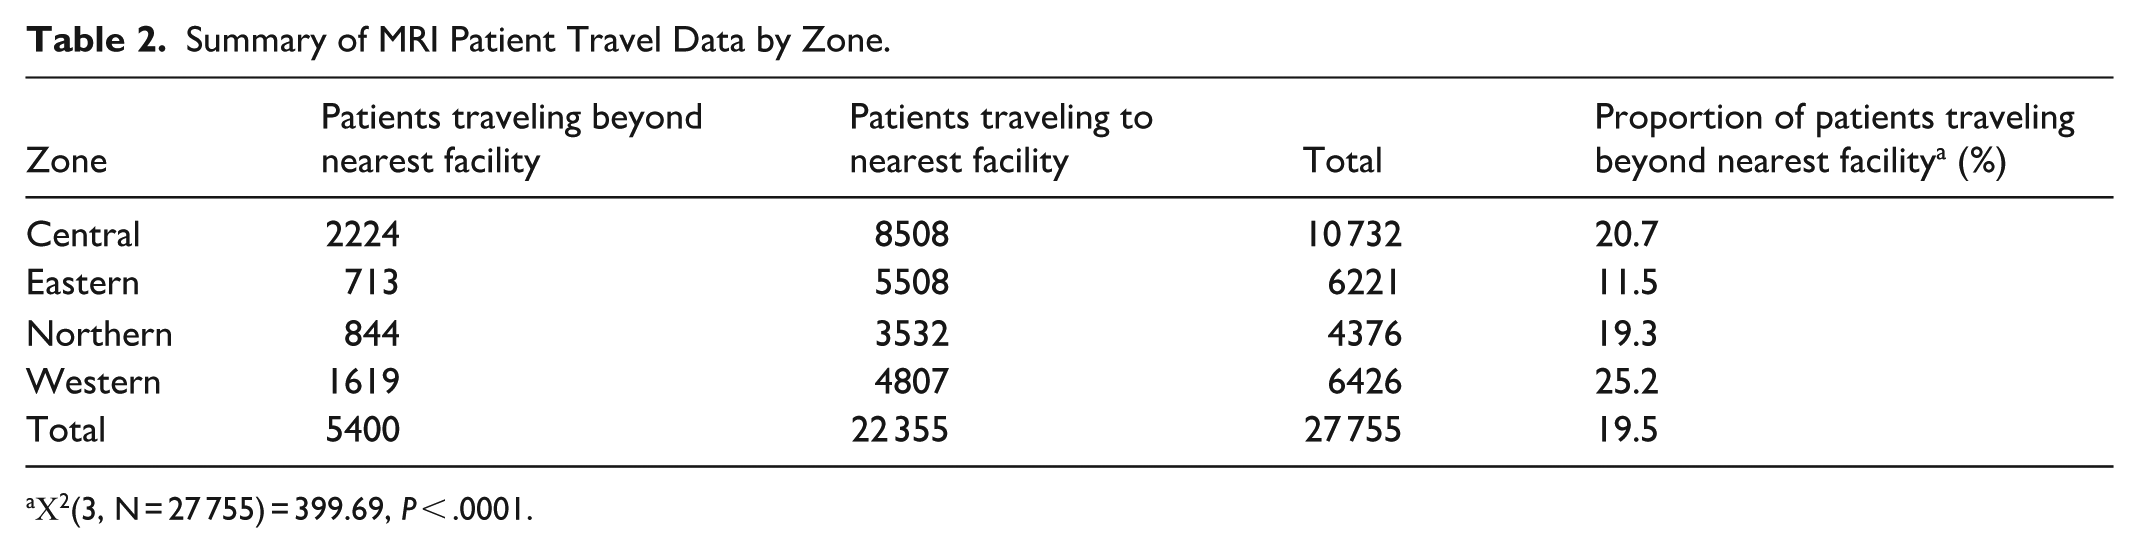
Χ2(3, N = 27 755) = 399.69, P < .0001.
The mean and 95% CIs in the round-trip distance for those attending their nearest MRI facility (n = 22 355) was 60.4 ± 0.9 km, compared to 295.6 ± 3.9 km for those traveling further (n = 5400; P < .0001). When stratified by zone, all regions also showed significant increases in travel distance (P < .0001) for those bypassing their nearest facility (Figure 3). The total distance traveled by patients attending their nearest MRI facility (n = 22 355) was 1 350 338 km whereas the total distance traveled by patients traveling beyond their nearest MRI capable facility (n = 5400) was 1 596 668 km. If the patients traveling beyond their nearest MRI capable facility (n = 5400) had attended the nearest MRI capable facility instead, they would have traveled a shorter total distance of 524 375 km. Accordingly, the total excess distance for our study cohort was 1 072 293 km, representing an up to three-fold (3.0) increase in total MRI-related travel.
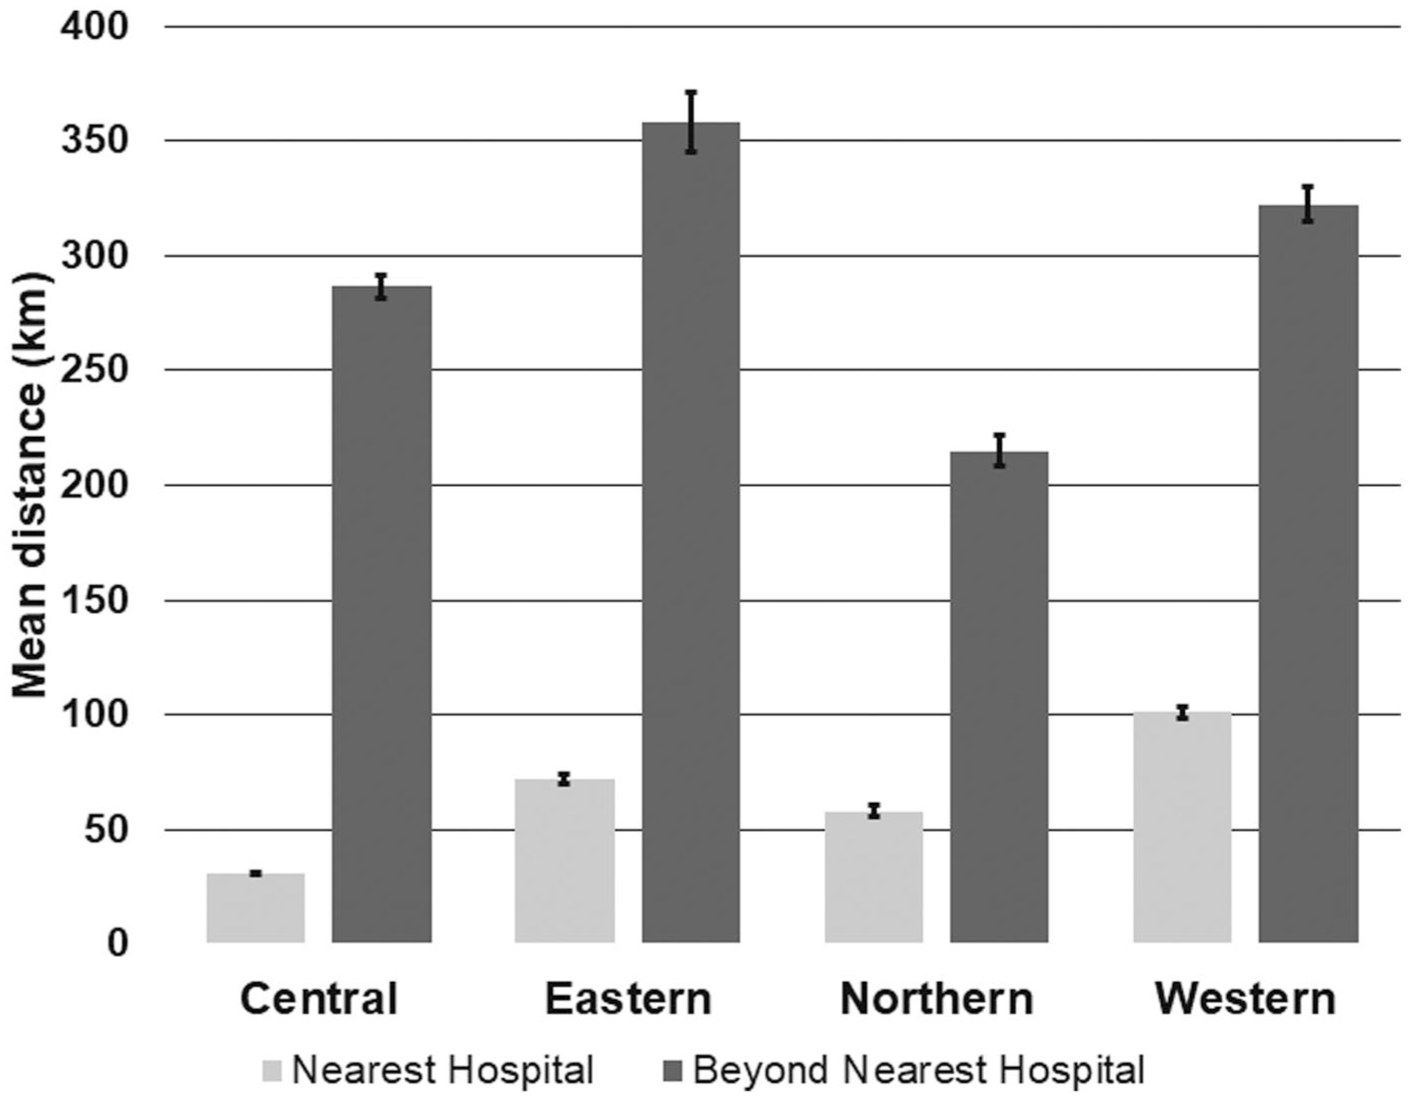
Mean round-trip distance traveled by ambulatory MRI patients by zone.
Using an online carbon footprint estimation tool, the excess travel resulted in approximately 288 metric tons of CO2e. 12 This is equivalent to the annual emissions of 61 large-sized gasoline-powered passenger cars above 2.0 L each traveling an average of 17 565 km per year12,15 or the carbon sequestration of 4762 tree seedlings grown over 10 years. 14 Excess travel by patients residing in the Central Zone contributed the largest CO2e (Figure 4).
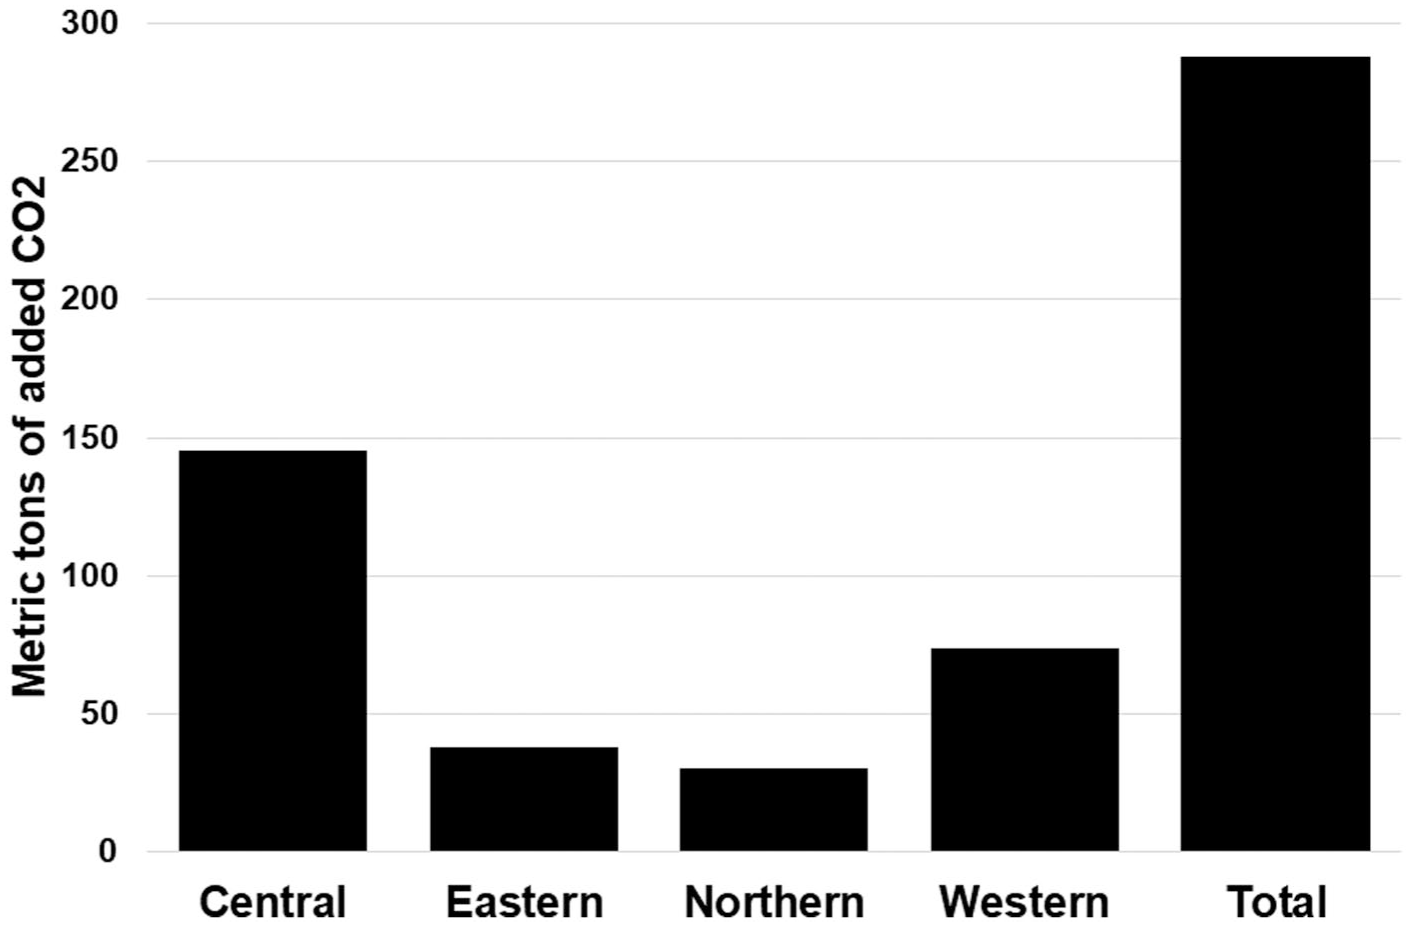
Estimate of added CO2e related to excess travel for ambulatory MRI by health zone.
Discussion
The main finding from our study is that almost 20% of patients obtain MRI services from a facility further away from their nearest hospital. This adds 288 metric tons of CO2e to the atmosphere. Our study adds to the growing body of literature relating to the important carbon footprint of diagnostic imaging, and to our knowledge is the first to assess patient-specific travel as a contributing factor to MRI-related greenhouse gas emissions in Canada.
Much of the excess travel reported in this study is likely related to disparate geographic MRI access and patients seeking faster appointments times elsewhere. It is well-established that inefficient resource allocation is a key factor contributing to excess CO2 emissions. 4 In this study, only 3 of 9 MRI units were situated within the Central Zone in 2023, which accounted for over 50% of the provincial population. 10 Indeed, we found that Central Zone residents accounted for over 40% of patients who traveled beyond their nearest MRI capable facility in this study.
The generalizability of these results to other Canadian provinces and territories may be limited given the smaller geographic size of NS but is likely comparable to other Atlantic Canadian provinces and similarly sized health authorities in the country, such as Vancouver Island. Canadians living in more remote and Northern communities travel even larger distances than the ones quoted here for MRI access although mobile MRI units may further limit travel-related emissions. For example, only 21% of the population in Nunavut lived within 100 km of a hospital. 16 Importantly, the methodology and framework of this study are widely applicable to estimations of carbon emissions from healthcare-related travel.
There were other limitations to our study. The retrospective nature meant that patients could not be surveyed on their MRI facility preferences, mode and type of transportation, and specific travel routes at the time of imaging. Furthermore, the automated approach to calculating travel distances was efficient, but a small amount of data was lost due to aberrant mapping. Our study may have slightly overestimated the total excess travel distance as some out-of-zone travel is required for specialist 3 T imaging that is only available at a single hospital in the Central Zone; however, this impacts a small number of the overall patients (estimated 3 T examinations in 2023 numbered ~1000). Additionally, adult patients scanned at the MRI unit in the tertiary women’s and children’s hospital for the Maritime provinces in the Central Zone were excluded from analysis, given the wide referral base and predominant pediatric imaging. Similarly, our study does not capture patient travel related to the single privately owned MRI unit in NS, nor does it capture out-of-province MRI related travel. For patients waiting excessively long wait times for MRI services, private and out-of-province MRIs are becoming increasingly common, which further compounds the problem of added CO2e.
In the future, our provincial healthcare provider has committed to improving regional MRI access through new and upgraded MRI installations at strategic sites, including the pending roll-out of a mobile MRI unit which will help limit appointment-related travel. At the time of the study, MRI requests were still being faxed to individual hospitals for triage and booking. Our provincial healthcare provider is currently switching to a paperless central intake medical imaging requisition management system; we are looking to build a dashboard highlighting the carbon footprints of diagnostic imaging tests and related travel to help individual providers and patients integrate these metrics into clinical decision making. Future studies may evaluate post-intervention data or explore examination-specific travel trends.
In summary, travel beyond the nearest MRI capable facility in our province in 2023 is estimated to have increased carbon emissions by 288 metric tons of CO2e. This finding highlights an underrecognized source of the environmental impact of medical imaging and emphasizes the need for improved accessibility as a strategy to mitigate climate change. Healthcare systems and radiology departments should work toward incorporating environmental sustainability into service planning to promote responsible healthcare delivery.
Supplemental Material
sj-docx-1-caj-10.1177_08465371261416324 – Supplemental material for The Carbon Footprint of MRI Access: A Population-Based Study Evaluating Excess Patient Travel and CO2 Emissions in Nova Scotia
Supplemental material, sj-docx-1-caj-10.1177_08465371261416324 for The Carbon Footprint of MRI Access: A Population-Based Study Evaluating Excess Patient Travel and CO2 Emissions in Nova Scotia by Jessica Thompson, Joseph Silburt, Stephanie Schofield, Andreu F. Costa and Michael Rivers-Bowerman in Canadian Association of Radiologists Journal
Supplemental Material
sj-tif-2-caj-10.1177_08465371261416324 – Supplemental material for The Carbon Footprint of MRI Access: A Population-Based Study Evaluating Excess Patient Travel and CO2 Emissions in Nova Scotia
Supplemental material, sj-tif-2-caj-10.1177_08465371261416324 for The Carbon Footprint of MRI Access: A Population-Based Study Evaluating Excess Patient Travel and CO2 Emissions in Nova Scotia by Jessica Thompson, Joseph Silburt, Stephanie Schofield, Andreu F. Costa and Michael Rivers-Bowerman in Canadian Association of Radiologists Journal
Footnotes
Ethical Considerations
IRB approval was obtained for this work.
Funding
The authors received no financial support for the research, authorship, and/or publication of this article.
Declaration of Conflicting Interests
The authors declared no potential conflicts of interest with respect to the research, authorship, and/or publication of this article.
Supplemental Material
Supplemental material for this article is available online.