
Abstract
Purpose:
Breast arterial calcification (BAC), detectable on routine mammograms, offers a promising independent risk factor for cardiovascular disease (CVD) risk stratification. However, current BAC assessment methods lack standardization and rely on subjective interpretations. This study introduces a semi-supervised deep learning (DL) model to automate BAC severity grading, enhance cross-system generalizability, and align with clinical consensus.
Methods:
A U-Net-based segmentation model was trained on 2560 annotated screening mammograms from 7 vendors. A semi-supervised learning strategy employing progressive pseudo-labeling incorporated 6000 unlabeled images to enhance model robustness. BAC severity was graded by thresholding the percentage area covered by BAC and benchmarked against radiologists’ assessments using Canadian Society of Breast Imaging (CSBI) guidelines. Performance was evaluated using the Jaccard Similarity Coefficient (JSC) for segmentation, along with accuracy, precision, F1-score, and recall. For detecting clinically significant (Grade 3) BAC, sensitivity, specificity, and area under the curve (AUC) were assessed. Agreement with experts was evaluated using weighted kappa statistics.
Results:
The proposed model achieved a JSC of 0.614, an accuracy of 0.991, an F1-score of 0.756, a precision of 0.763, and a recall of 0.764. It demonstrated superior segmentation accuracy compared to the baseline U-Net model. Agreement with consensus radiologists was high, with a weighted kappa of 0.90, 95% CI = (0.70, 1.00). For clinically significant (Grade 3) BAC, the model achieved an AUC of 0.87, 95% CI = (0.72, 1.00), sensitivity of 0.80, and specificity of 0.93.
Conclusion:
The framework holds promise for clinical adoption, integrating into mammography workflows and improving women’s cardiovascular risk stratification.
Introduction
Cardiovascular disease (CVD) remains the leading cause of mortality in women worldwide. 1 Although widely utilized tools for CVD risk stratification exist, they often fail to capture unique sex-specific factors that influence women’s cardiovascular health, 2 resulting in underdiagnosis, undertreatment, and poorer outcomes. 3 As a result, there is growing interest in leveraging adjunctive biomarkers that can be readily incorporated into existing clinical workflows.
One such biomarker is Breast Arterial Calcification (BAC), which appears incidentally on routine mammograms performed for breast cancer screening. 2 BAC is associated with systemic arterial calcification and has been linked to an elevated risk of future cardiovascular events. By evaluating BAC severity on mammographic images, clinicians may gain insights into a woman’s cardiovascular health status at little additional cost and without extra testing time. However, current methods for BAC assessment are often limited by subjectivity, relying on radiologists’ interpretations that can vary based on experience and lack standardized criteria. 2 This subjectivity hinders consistent grading, reproducible risk stratification, and widespread clinical adoption.
Automated tools, including deep learning (DL)-based methods, have shown promise in addressing these challenges by automating the detection and quantification of BAC.4-7 Nonetheless, such approaches often demand large, annotated datasets, and their performance may be constrained by training on images acquired from a single manufacturer’s equipment. These limitations reduce both the robustness and generalizability of existing DL-based solutions.
In this work, we introduced a semi-supervised deep learning approach to improve BAC grading. By incorporating images from multiple vendors and employing progressive pseudo-labeling, our model aims to reduce annotation burden and enhance cross-system generalizability. This approach not only mitigates the challenges posed by limited data but also improves the robustness and applicability of the model across diverse clinical settings. Additionally, we proposed an area-based BAC severity grading system and investigated the magnitude of agreement between the grades produced by our proposed system and the grading schema outlined in the Canadian Society of Breast Imaging (CSBI) Position Statement on BAC reporting on mammography. This consensus guideline suggests classifying BAC into 3 grades and recommends that when mammography identifies Grade 3 BAC, the report should indicate the strong association with CVD and encourage correlation with cardiovascular risk factors. We benchmark the model’s performance against expert radiologists’ assessments and evaluate its sensitivity and specificity in detecting Grade 3 BAC, the most clinically significant category.
Materials and Methods
Dataset of Annotated Screening Mammograms
A total of 2560 single-view mammographic images were collected from 1280 screening exams, comprising 1318 craniocaudal (CC) and 1242 mediolateral oblique (MLO) views. These images were acquired using 11 different scanner types from 7 manufacturers: Agfa (2.10%), FUJI (38.44%), HOLOGIC (10.56%), KONICA (7.74%), Philips (1.29%), Sectra (11.68%), and SIEMENS (28.20%). To construct bilateral inputs, left and right images from the same exam were concatenated, resulting in 1280 bilateral mammograms. In cases where only one view was available, it was paired with the contralateral view from the same exam to maintain consistency. Of the full dataset, 2278 images (1139 bilateral pairs) were allocated for training and validation, while 282 images (141 bilateral pairs) were held out for final testing. Image selection was performed by a dedicated medical imaging scientist specializing in mammography, while the presence of BAC was verified by a senior radiologist with over 30 years of experience.
All images underwent a rigorous annotation process using Label Studio software. 8 Initial segmentations were subsequently reviewed and confirmed by 2 senior radiologists to establish a robust ground truth. To standardize image inputs, several preprocessing steps were performed, including uniform resizing and pixel-value normalization to address variations in brightness and contrast.
Base Model Training
A U-Net architecture 9 was selected as the base model for BAC segmentation due to its proven effectiveness in biomedical imaging tasks. The U-Net structure, with its encoder-decoder and skip-connections design, is well-suited for capturing both coarse and fine details necessary to delineate calcifications.
The model was trained on resized full-sized images (1024 × 1024 pixels) and patches of size 512 × 512 pixels with an overlap of 386 pixels. Training on patches enabled the model to focus on localized features, thereby improving its ability to segment smaller and more intricate calcifications. Bilateral images were incorporated to address misclassification issues observed during single-view training, where the model occasionally misclassified artifacts at the edges of the image as BAC. By including bilateral images, the model learned to better distinguish true calcifications from artifacts at the boundaries of the combined views. Figure 1 illustrates how bilateral images were used to mitigate these issues.
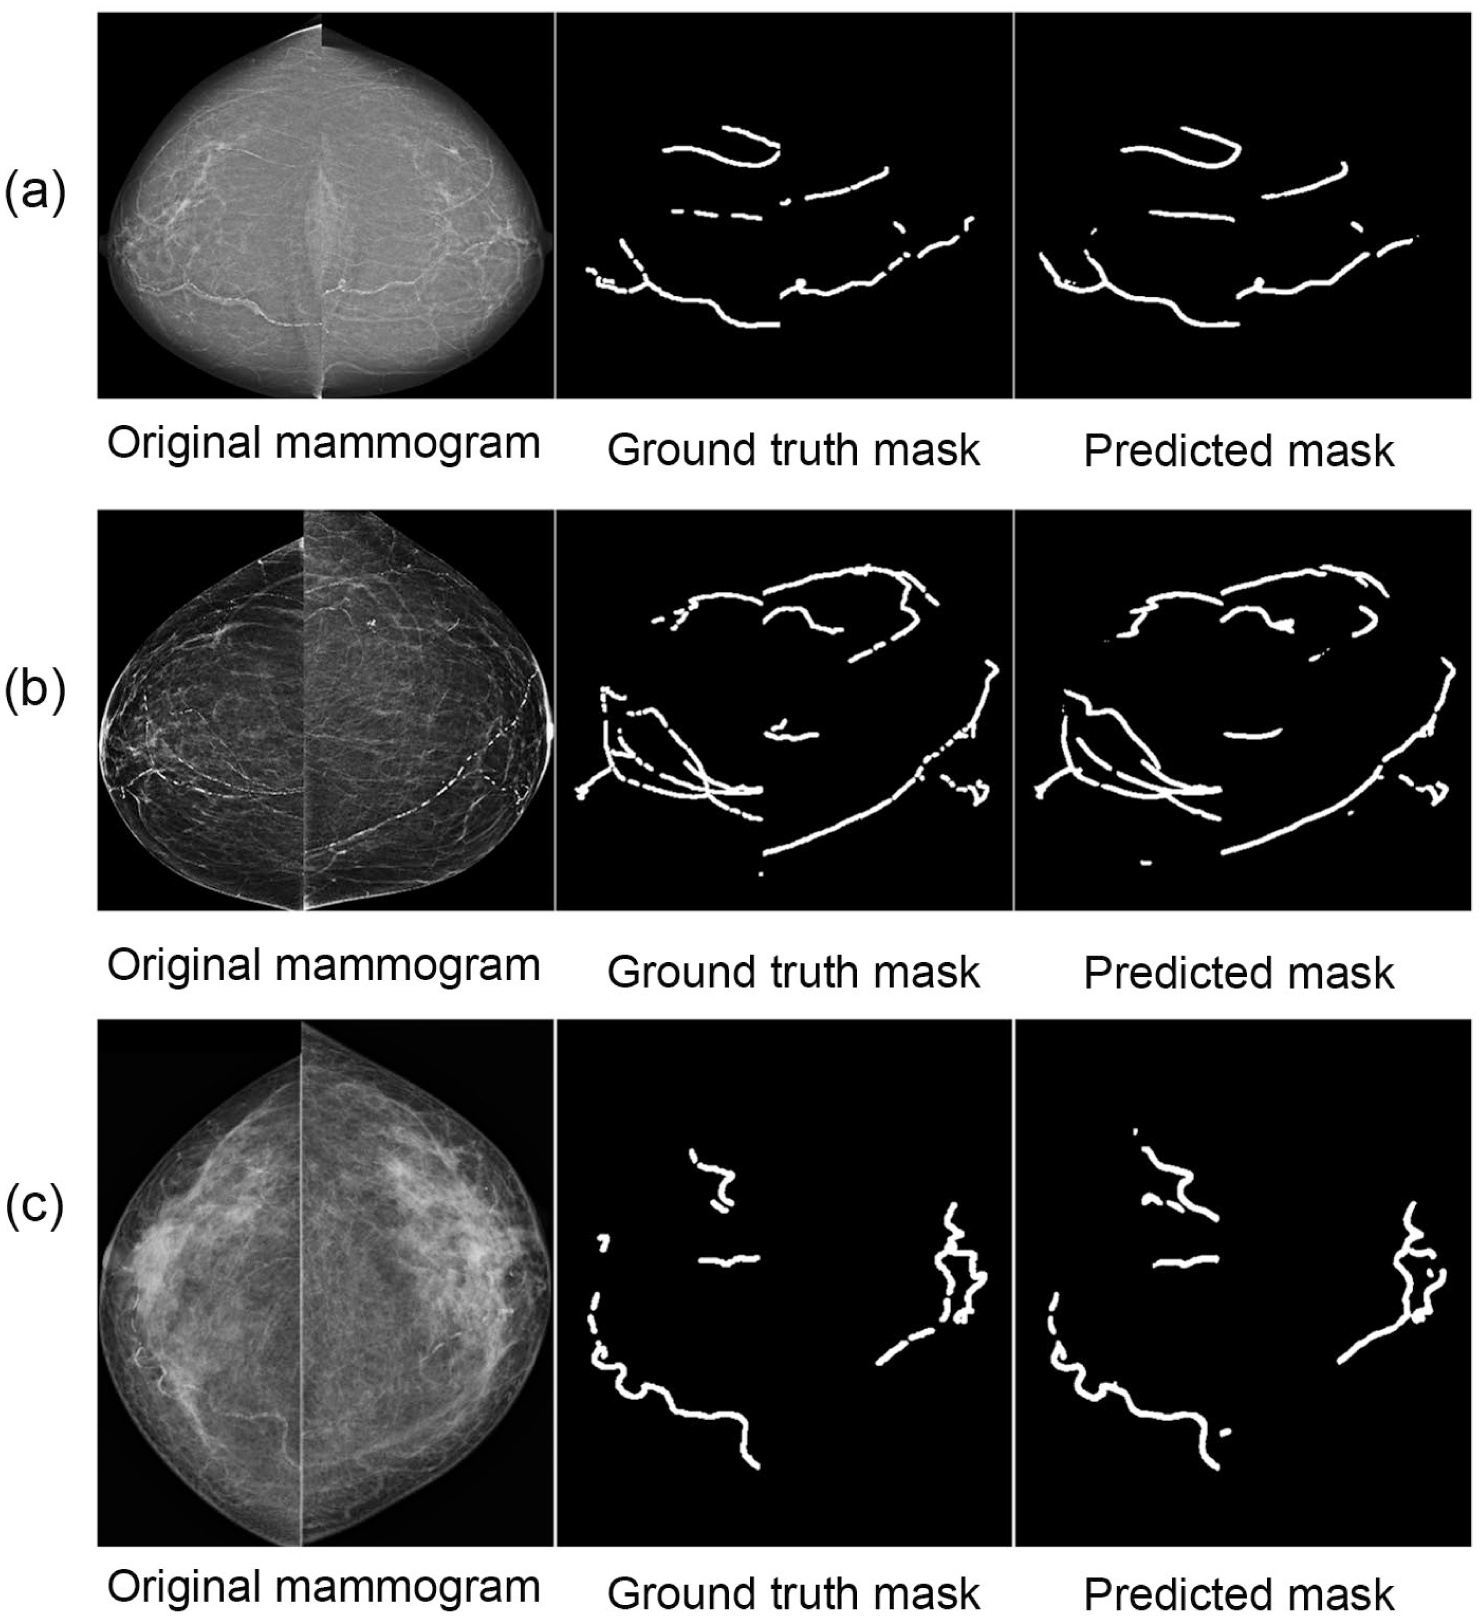
Comparison of BAC segmentation for examinations from 3 vendors (ie, (a) Siemens, (b) Hologic, (c) Fuji), including the original image, ground truth mask, and predicted mask.
Of the manually annotated dataset, 70% of the images were used for training, 20% for validation, and 10% for testing. The model was trained with a learning rate of 0.001 and binary cross-entropy as the loss function. This initial training phase established a strong baseline for subsequent refinements.
Data augmentation was applied exclusively to the training dataset to increase variability and robustness. Specifically, brightness adjustments were performed with a scaling factor of 0.2, pixel saturation with a factor of 0.3, and hue shifts up to 0.25. While no geometric perturbations such as flips, rotations, or scaling were applied, the use of intensity augmentations helped mitigate overfitting and improve the model’s generalizability.
All training was performed on an NVIDIA RTX 3090 GPU. The baseline U-Net model was trained for up to 50 epochs with early stopping based on validation loss. For the semi-supervised approach, the model was retrained within each pseudo-labeling iteration for up to 20 epochs, again using early stopping criteria.
Semi-Supervised Learning With Progressive Pseudo-Labeling
To address the challenge of limited annotated data, we adopted a semi-supervised learning strategy that incorporated progressive pseudo-labeling, as inspired by prior work. 10 This approach enabled us to enhance the model’s performance and generalizability by leveraging an additional dataset of 6000 unlabeled mammographic images. For context, the average age (±SD) in the 6000-case corpus and the held-out test set was 63.5 ± 7.7 and 63.1 ± 8.8 years, respectively; screening images were randomly retrieved from routine screening between 2006 and 2019, with ~75% acquired during 2009 to 2013. Initially, we employed an entropy-based selection method to evaluate these unlabeled images. The trained base model generated predictions, and images with low entropy—indicating high-confidence predictions—were chosen for pseudo-labeling. At each iteration, we selected the top 3% of patches with the lowest entropy (~180 patches), provided they exceeded a predicted mask area threshold of 0.007. These high-confidence patches were added to the training pool for the subsequent iteration. To maintain training quality and prevent the model from being overwhelmed, pseudo-labeled images were introduced incrementally in small batches. This pseudo-labeling process was repeated for 10 iterations, progressively refining the model’s performance through incremental updates.
Retraining on the combined annotated and pseudo-labeled dataset utilized a custom loss function blending binary cross-entropy and Jaccard loss. Binary cross-entropy enabled fine-grained pixel-level differentiation between BAC and non-BAC regions, while the Jaccard Similarity Coefficient (JSC) emphasized spatial overlap between predicted and true segmentation masks. This combination encouraged accurate and spatially consistent delineation of BAC regions, even when they were subtle or sparse.
To prevent data leakage, all dataset splits were performed strictly at the patient level before any patch extraction or pseudo-labeling was conducted. This ensured that pseudo-labeled images were never included in the held-out test set. Validation during the pseudo-labeling process was conducted on a dedicated 20% subset of the annotated training data, stratified by case. Final model selection and all reported results were evaluated exclusively on the fixed held-out test set, comprising 282 single-view exams (141 bilateral pairs).
Area-Based BAC Severity Grading
In addition to segmentation, we introduced a four-tier grading system based on the ratio of BAC area to the total breast area:
Absence: BAC area <0.2% of the total breast area
Mild: BAC area between 0.2% and 1% of the total breast area
Moderate: BAC area between 1% and 2.5% of the total breast area
Severe: BAC area >2.5% of the total breast area
This quantitative framework facilitated consistent severity assessments for both the model and expert radiologists. The trained model, along with a grading script, is available online at https://github.com/muath111/BAC-Segmentation.
Validation Against Expert Radiologists
To assess concordance with clinical expertise, we selected 20 bilateral mammographic exams not used in model development. These exams spanned the model’s area-based BAC severity range with 5 exams per severity level. Three experienced radiologists—blinded to each other and to model outputs—independently graded each exam using the Canadian Society of Breast Imaging (CSBI) Position Statement definitions, which specify 4 ordered grades (0-3):
CSBI Grade 0: No vascular calcification
CSBI Grade 1: Few punctate vascular calcifications without coarse, tram-track, or ring calcifications
CSBI Grade 2: Coarse vascular or tram-track calcification in fewer than 3 vessels
CSBI Grade 3: Severe coarse vascular or tram-track calcification affecting 3 or more vessels
For the model/area-based severity, we defined a four-level ordinal scale

This alignment enabled four-category agreement analyses (0-3) across observer–observer and observer–AI pairs and supported the clinically salient binary task of CSBI Grade 3 versus non-Grade 3 detection. We quantified agreement using quadratic-weighted Cohen’s κ and uncertainty using non-parametric percentile bootstrap 95% CIs (5000 resamples). We report full 4 × 4 contingency tables in the Supplement. For the Grade-3 detection task, we used the AI’s 0 to 3 severity as a continuous decision score to compute AUC, and we report sensitivity/specificity at the AI = 3 threshold, each with bootstrap 95% CIs.
Evaluating the Model’s Performance
To assess the performance of our semi-supervised deep learning model in segmenting BAC on mammograms, we employed a range of metrics, including accuracy, precision, recall, F1 score, and the Jaccard Similarity Coefficient (JSC).
Accuracy measures the proportion of correct predictions across the entire image.
Precision quantifies the proportion of correctly identified BAC regions among all predicted BAC regions.
Recall reflects the proportion of actual BAC regions that were correctly identified.
F1 score is the harmonic mean of precision and recall, balancing false positives and false negatives.
JSC, also known as Intersection over Union (IoU), measures the overlap between the predicted segmentation mask and the ground truth. This metric is particularly important in our context, as BAC generally occupies only a small portion of the mammogram. Without emphasizing this specific overlap, a model might achieve deceptively high accuracy by primarily capturing non-calcified areas rather than the clinically significant BAC regions. A high JSC, therefore, indicates the model’s ability to accurately delineate BAC boundaries, even when these areas are relatively minor within the larger image.
To statistically evaluate whether the semi-supervised model significantly outperformed the baseline U-Net, we conducted a paired analysis using per-case Jaccard Similarity Coefficient (JSC) values on the held-out test set (N = 141 bilateral exams). A paired bootstrap resampling procedure with 100 000 iterations was used to estimate the mean difference (ΔJSC = SSL − baseline), resampling at the exam level. Bias-corrected percentile confidence intervals were calculated, and Monte Carlo P-values were obtained using +1 smoothing. The observed improvement (ΔJSC = 0.0114; 95% CI [0.0072, 0.0156]) was statistically significant (P < .001), confirming the robustness of the proposed approach. All thresholds, preprocessing steps, and data splits were held constant across models.
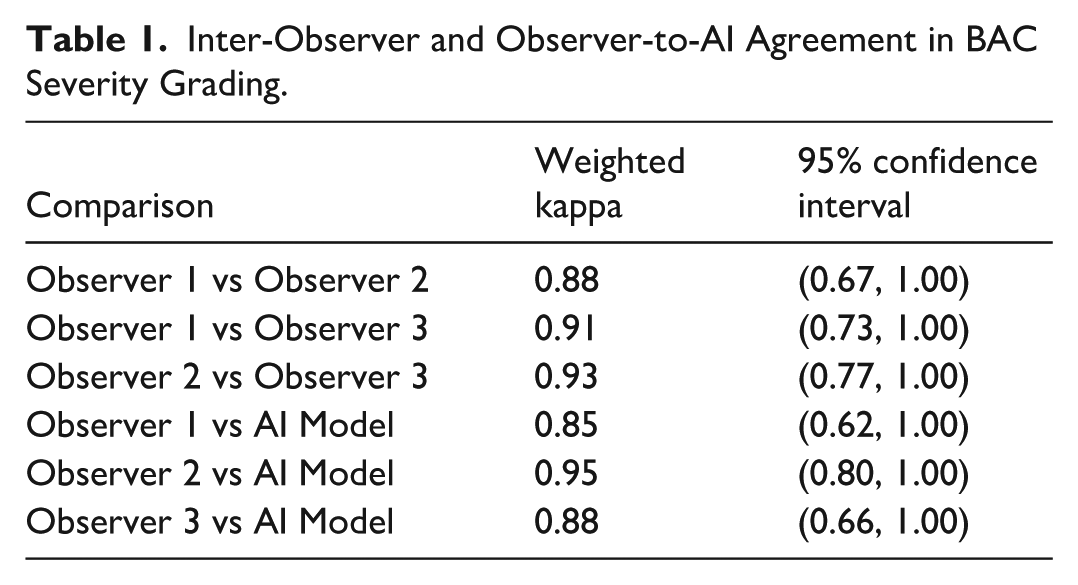
Observer agreement was quantified using weighted kappa statistics (Table 1). Comparisons were made between each pair of human observers and between the observers and the AI model. By applying a majority voting scheme, an expert consensus was established for each case, enabling the calculation of overall percent agreement and the weighted kappa (AI vs consensus). All kappa confidence intervals above are non-parametric percentile bootstrap 95% CIs (5000 resamples) for quadratic-weighted κ.
Inter-Observer and Observer-to-AI Agreement in BAC Severity Grading.
Finally, given the clinical importance of identifying Grade 3 BAC, as outlined in the CSBI Position Statement on BAC reporting in mammography, we conducted a binary classification analysis focused on this category. In this scenario, we calculated:
AUC (Area Under the Curve), which measures the model’s ability to distinguish Grade 3 BAC from non-Grade 3 BAC cases across thresholds.
Sensitivity, which is the proportion of Grade 3 BAC cases correctly identified by the model.
Specificity, which is the proportion of non-Grade 3 BAC cases correctly excluded by the model.
These metrics collectively provide a comprehensive evaluation of the model’s effectiveness in segmenting BAC and detecting clinically significant cases.
Results
Performance of the Proposed Segmentation Model
Initial evaluations of the U-Net model using both patch-based (512 × 512) and whole-image (resized to 1024 × 1024) training approaches showed promising segmentation performance (Table 2). For the patch-based approach, the U-Net achieved a Jaccard Similarity Coefficient (JSC) of 0.602 (95% CI: 0.586-0.618), with an accuracy of 0.991 (95% CI: 0.990-0.991), precision of 0.753 (95% CI: 0.738-0.768), F1-score of 0.747 (95% CI: 0.733-0.760), and recall of 0.756 (95% CI: 0.736-0.775).
Evaluation Results of Different Models Trained on Patches and Whole Images. The Metrics Presented Are Recall, Precision, Accuracy, F1-Score, and Jaccard Similarity Coefficient (JSC).
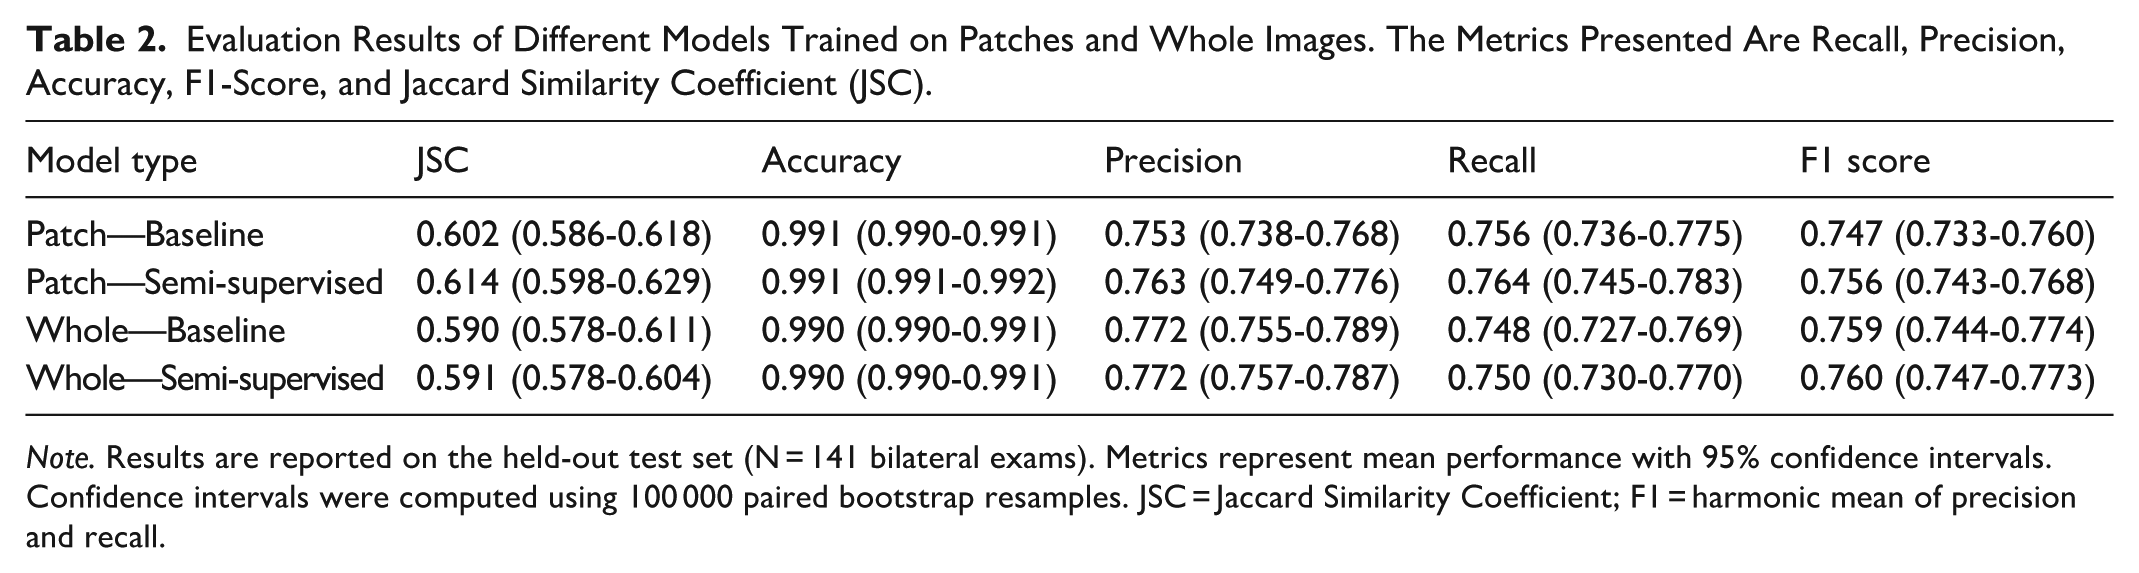
Note. Results are reported on the held-out test set (N = 141 bilateral exams). Metrics represent mean performance with 95% confidence intervals. Confidence intervals were computed using 100 000 paired bootstrap resamples. JSC = Jaccard Similarity Coefficient; F1 = harmonic mean of precision and recall.
Similarly, training on resized 1024 × 1024 images yielded comparable segmentation results, with a JSC of 0.590 (95% CI: 0.578-0.611), accuracy of 0.990 (95% CI: 0.990-0.991), precision of 0.772 (95% CI: 0.755-0.789), F1-score of 0.759 (95% CI: 0.744-0.774), and recall of 0.748 (95% CI: 0.727-0.769). These results provided a solid baseline for further model enhancements.
Incorporating a semi-supervised learning strategy with progressive pseudo-labeling led to measurable improvements in segmentation performance. For the patch-based model, the JSC increased to 0.614 (95% CI: 0.598-0.629), with an F1-score of 0.756 (95% CI: 0.743-0.768) and recall of 0.764 (95% CI: 0.745-0.783), while maintaining high accuracy at 0.991 (95% CI: 0.991-0.992) and precision of 0.763 (95% CI: 0.749-0.776).
The whole-image model also showed modest segmentation gains, with JSC improving to 0.591 (95% CI: 0.578-0.604), F1-score to 0.760 (95% CI: 0.747-0.773), and recall to 0.750 (95% CI: 0.730-0.770), while precision and accuracy remained stable at 0.772 (95% CI: 0.757-0.787) and 0.990 (95% CI: 0.990-0.991), respectively.
On the held-out test set (N = 141 bilateral exams), the patch-based semi-supervised model outperformed the baseline by a mean ΔJSC of 0.0114 (95% CI [0.0072, 0.0156]; P < .001). This difference was statistically significant, as confirmed by paired bootstrap resampling with 100 000 iterations; the confidence interval did not include zero, indicating the improvement is unlikely to be due to chance.
The distribution of BAC severity across datasets was as follows: in the unlabeled dataset (N = 6000), 72% were mild, 26% moderate, and 2% severe. The annotated dataset comprised 23% mild, 59% moderate, and 18% severe cases. In the held-out test set (N = 141 bilateral exams), 11% were mild, 73% moderate, and 16% severe. These distributions reflect random sampling from BAC-positive exams; no stratification by severity was applied.
To evaluate segmentation performance across severity levels, we stratified results into 3 categories based on BAC extent (Grade 1: mild, Grade 2: moderate, Grade 3: severe). As expected, segmentation metrics varied with severity, with lower performance observed in Grade 1 due to the sparse and subtle nature of early BAC. For instance, the baseline model achieved a JSC of 0.450 and F1-score of 0.615 in Grade 1, compared to 0.611 and 0.755 in Grade 2, and 0.663 and 0.796 in Grade 3, respectively. The semi-supervised model showed consistent improvements across all grades: +0.021 JSC and +0.021 F1-score in Grade 1, +0.012 JSC and +0.009 F1 in Grade 2, and modest gains in Grade 3 (+0.003 JSC, +0.002 F1). Notably, recall improved across all grades, indicating enhanced sensitivity for detecting BAC, even in challenging cases. These findings confirm that segmentation performance increases with BAC severity but also highlight the semi-supervised model’s ability to improve detection even in subtle Grade 1 presentations. Full stratified metrics are presented in Table S1.
To visually validate the segmentation results, Figure 1(a) to (c) presents segmented mask outputs compared to ground truth from 3 manufacturers: Siemens, Hologic, and Fuji. The enhanced ability to capture the intricate details of BAC regions highlights the model’s capability to deliver accurate and reliable assessments.
Validation Against Expert Radiologists
Inter-observer and observer-to-model comparisons demonstrated strong agreement between Area-based BAC Severity and CSBI grading. Pairwise comparisons between the 3 radiologists yielded weighted kappa values of 0.88, 95% CI = (0.75, 0.94) (Observer 1 vs Observer 2), 0.91, 95% CI = (0.75, 0.97) (Observer 1 vs Observer 3), and 0.93, 95% CI = (0.81, 0.98) (Observer 2 vs Observer 3), indicating high consistency among expert graders. When comparing each observer to the AI model, the weighted kappa values remained robust, at 0.85, 95% CI = (0.73, 0.93) (Observer 1 vs AI), 0.95, 95% CI = (0.86, 1.00) (Observer 2 vs AI), and 0.88, 95% CI = (0.77, 0.95) (Observer 3 vs AI), further underscoring the model’s ability to align with expert assessments.
By applying a majority-voting consensus among the radiologists, the AI model’s weighted kappa against this consensus reached 0.90, 95% CI = (0.79, 0.96). In a binary classification scenario focused on detecting clinically significant (Grade 3) BAC based on the CSBI position statement, the model achieved an AUC of 0.93, 95% CI = (0.81, 1.00), with a sensitivity of 0.80, and a specificity of 0.93.
To probe generalizability, we stratified AI-versus-consensus agreement by breast density and vendor. By density, agreement remained high for both non-dense (A/B) cases (κ = 0.86, 95% CI = [0.51, 0.96]; N = 10) and dense (C/D) cases (κ = 0.93, 95% CI = [0.73, 1.00]; N = 10). Grouped by vendor, agreement was κ = 0.95, 95% CI = (0.81, 1.00) for all Fujifilm models (N = 13) and κ = 0.80, 95% CI = (0.36, 0.91) for other vendors/models (N = 7). Given small stratum sizes, confidence intervals are wider and should be interpreted cautiously.
Discussion
This study evaluated the performance of a semi-supervised deep learning (DL) model for the segmentation and quantification of breast arterial calcifications (BAC) on mammograms. Unlike previous approaches primarily focused on binary classification of BAC presence or absence,6,10,11 our model provides detailed segmentation and quantification, enabling a more comprehensive assessment of BAC extent and severity. This is particularly important given the emphasis on clinically significant BAC findings, as outlined in the CSBI Position Statement, which underscores the need for accurate identification and reporting of severe (Grade 3) BAC. By quantifying BAC rather than simply detecting it, our model offers a richer clinical perspective on calcification severity.
Our findings demonstrate that a semi-supervised DL model can effectively leverage both annotated and unannotated data, thereby enhancing model generalizability and robustness. Through the inclusion of mammograms from multiple vendors and the implementation of progressive pseudo-labeling, we addressed key limitations that often hinder generalization. In contrast, other models such as DU-Net 6 and the DL-based method proposed in Khan and Masala 11 focus on detection but lack pixel-level segmentation or severity grading. While SCU-Net 7 shows promise, it was developed using single-vendor training data, raising concerns about its adaptability to broader clinical settings. Additionally, as SCU-Net is not publicly released, we were unable to evaluate it under consistent multi-vendor conditions. Our approach, by comparison, demonstrates strong adaptability to diverse imaging characteristics and clinical contexts.
Our model’s capacity for detailed segmentation is further enhanced by its integration with a four-tier area-based BAC severity grading system—Absence, Mild, Moderate, and Severe—based on the proportion of calcified area relative to the breast area. This system offers a refined classification framework more consistent with radiologists’ clinical judgment than binary alternatives. A major strength of this study is the stratified evaluation of segmentation performance across BAC severity levels. As anticipated, performance was highest for Grade 3 cases, where calcifications are more extensive and visually apparent. Grade 1 cases, often characterized by subtle and sparse calcifications occupying less than 0.2% of the breast area, posed the greatest challenge. For these cases, the baseline model achieved a Jaccard Similarity Coefficient (JSC) of 0.450 and an F1-score of 0.615. However, the semi-supervised model yielded consistent improvements across all grades—including Grade 1, where JSC improved to 0.471 and F1-score to 0.636—demonstrating the value of pseudo-labeling in enhancing the detection of fine-grained features. Performance for Grade 2 cases closely matched the overall test metrics, suggesting that this category may reflect typical BAC presentations encountered in clinical practice. A detailed breakdown of these results is provided in Table S1.
These stratified results are particularly relevant in light of the severity distribution in the test set, which included 11% mild, 73% moderate, and 16% severe cases. Importantly, the annotated and test datasets included only BAC-positive cases, and no severity-based stratification was applied during selection; rather, cases were randomly sampled from the available cohort. While the observed distribution may not represent the full population prevalence of BAC severity, it enabled evaluation across a diverse range of clinically relevant scenarios. Ensuring model performance across this spectrum is essential to mitigate potential biases and ensure equitable segmentation outcomes.
The validity of our area-based BAC severity grading approach was reinforced by strong agreement between the model’s severity predictions and expert radiologist assessments. Weighted kappa values of 0.85, 0.95, and 0.88 between individual observers and the model, and 0.90 between the model and the consensus of 3 radiologists, highlight the clinical relevance of the model’s outputs. Furthermore, the model demonstrated strong performance in detecting clinically significant (Grade 3) BAC, achieving an AUC of 0.87, sensitivity of 0.80, and specificity of 0.93. These metrics indicate the model’s capacity to identify cases that may warrant further cardiovascular risk evaluation, with a level of accuracy approaching expert interpretation. Automating this process can enhance clinical workflows by reducing inter-observer variability, supporting standardization, and aiding clinicians in identifying patients who may benefit from additional cardiovascular assessment. Although this pilot observer study comprises 20 exams, the cases were randomly selected from a screening program across 48 screening services, providing acquisition heterogeneity. The use of percentile bootstrap confidence intervals provides a distribution-aware uncertainty estimate; as expected with small strata, several intervals are wide. We therefore caution against over-interpretation of stratum-specific estimates and plan a powered, multi-site expansion to deliver more precise, stratified effect sizes.
Despite the promising results, several challenges and limitations remain. Although our dataset was drawn from 11 different scanner types and 7 vendors, its distribution was not uniform: approximately 67% of cases were acquired using FUJI and SIEMENS systems, while other vendors, such as AGFA and Philips, were underrepresented, contributing fewer than 3% of cases each. This imbalance may introduce vendor-specific biases, potentially limiting generalizability to underrepresented systems. Future work should focus on validating these findings using more balanced datasets and in broader clinical environments. In addition, exploring domain adaptation strategies could help mitigate such biases and further improve performance consistency across vendors.
It is also important to acknowledge that the annotated training and test datasets included only BAC-positive cases. While this allowed focused learning and evaluation, it limits direct extrapolation to full screening populations where BAC prevalence and severity distributions may differ. Future research should examine model performance on broader screening cohorts and explore longitudinal links between quantified BAC burden and long-term cardiovascular outcomes, thereby establishing the prognostic value of automated BAC quantification.
In conclusion, this study demonstrates the efficacy of a semi-supervised DL-based model for detailed BAC segmentation and quantification. By leveraging both annotated and unannotated data and training across diverse imaging sources, our model exhibits enhanced robustness and adaptability to real-world clinical settings. The integration of an automated area-based grading framework, combined with strong concordance with expert assessments, positions this tool as a promising adjunct for dual-purpose mammography—facilitating both breast cancer screening and cardiovascular risk stratification. With further validation and refinement, such tools could play a pivotal role in advancing personalized preventive care.
Supplemental Material
sj-docx-1-caj-10.1177_08465371251400538 – Supplemental material for Semi-Supervised Deep Learning-Based Model for Segmentation of Breast Arterial Calcification on Screening Mammograms
Supplemental material, sj-docx-1-caj-10.1177_08465371251400538 for Semi-Supervised Deep Learning-Based Model for Segmentation of Breast Arterial Calcification on Screening Mammograms by Mu’ath Ibrahim, Patrick C. Brennan, Mo’ayyad E. Suleiman, Mary Rickard, Seyedamir Tavakoli Taba and Ziba Gandomkar in Canadian Association of Radiologists Journal
Supplemental Material
sj-docx-2-caj-10.1177_08465371251400538 – Supplemental material for Semi-Supervised Deep Learning-Based Model for Segmentation of Breast Arterial Calcification on Screening Mammograms
Supplemental material, sj-docx-2-caj-10.1177_08465371251400538 for Semi-Supervised Deep Learning-Based Model for Segmentation of Breast Arterial Calcification on Screening Mammograms by Mu’ath Ibrahim, Patrick C. Brennan, Mo’ayyad E. Suleiman, Mary Rickard, Seyedamir Tavakoli Taba and Ziba Gandomkar in Canadian Association of Radiologists Journal
Footnotes
Acknowledgements
We acknowledge the support of the Medical Research Future Fund (MRFF). We also thank the radiologists and data annotation team for their valuable assistance throughout the project.
Ethical Considerations
Ethical approval was obtained from the institutional review board.
Consent to Participate
Informed consent was obtained from all participants.
Author Contributions
All authors have made equal contributions to this work, including conceptualization, methodology, writing the original draft, reviewing, and editing.
Funding
The authors disclosed receipt of the following financial support for the research, authorship, and/or publication of this article: Medical Research Future Fund (MRFF).
Declaration of Conflicting Interests
The authors declared no potential conflicts of interest with respect to the research, authorship, and/or publication of this article.
Data Availability Statement
Data related to this study will be made available upon reasonable request. Access to the de-identified dataset used for the analysis may be granted with proper institutional and ethical approvals.
Supplemental Material
Supplemental material for this article is available online.
References
Supplementary Material
Please find the following supplemental material available below.
For Open Access articles published under a Creative Commons License, all supplemental material carries the same license as the article it is associated with.
For non-Open Access articles published, all supplemental material carries a non-exclusive license, and permission requests for re-use of supplemental material or any part of supplemental material shall be sent directly to the copyright owner as specified in the copyright notice associated with the article.