
Abstract
Introduction
Scoliosis refers to an abnormal curvature of the spine, with signs such as back pain and shoulder and waist asymmetry.
1
As the reference for scoliosis diagnosis and treatment planning,
2
Cobb angles in X-Ray images measure the curvature of the spine. Lines parallel to the end vertebrae in the spine curve form the basis for Cobb angle calculation.
3
Two X-Ray examples of curved spines are shown in Figure 1. Positive judgement is made on the presence of scoliosis if the largest Cobb angle exceeds 10 degrees, and the severity rises when it reaches 25 degrees.
1
The conventional standard manual approach for measuring the Cobb angle is associated with high inter- and intra-observer errors due to the variation in the level of operator’s experience and the nature of manual measurement.
4
Automated Cobb angle estimation techniques have been proposed to alleviate the problems caused by manual measurements. (a) Key vertebrae identifications for Cobb angle measurement on frontal view spine radiograph (marked in blue) with curved spine from AASCE-MICCAI challenge 2019 dataset.
5
(b) Spine subregions for Cobb angle measurement on frontal view spine radiograph (marked in red) with curved spine from the internal dataset.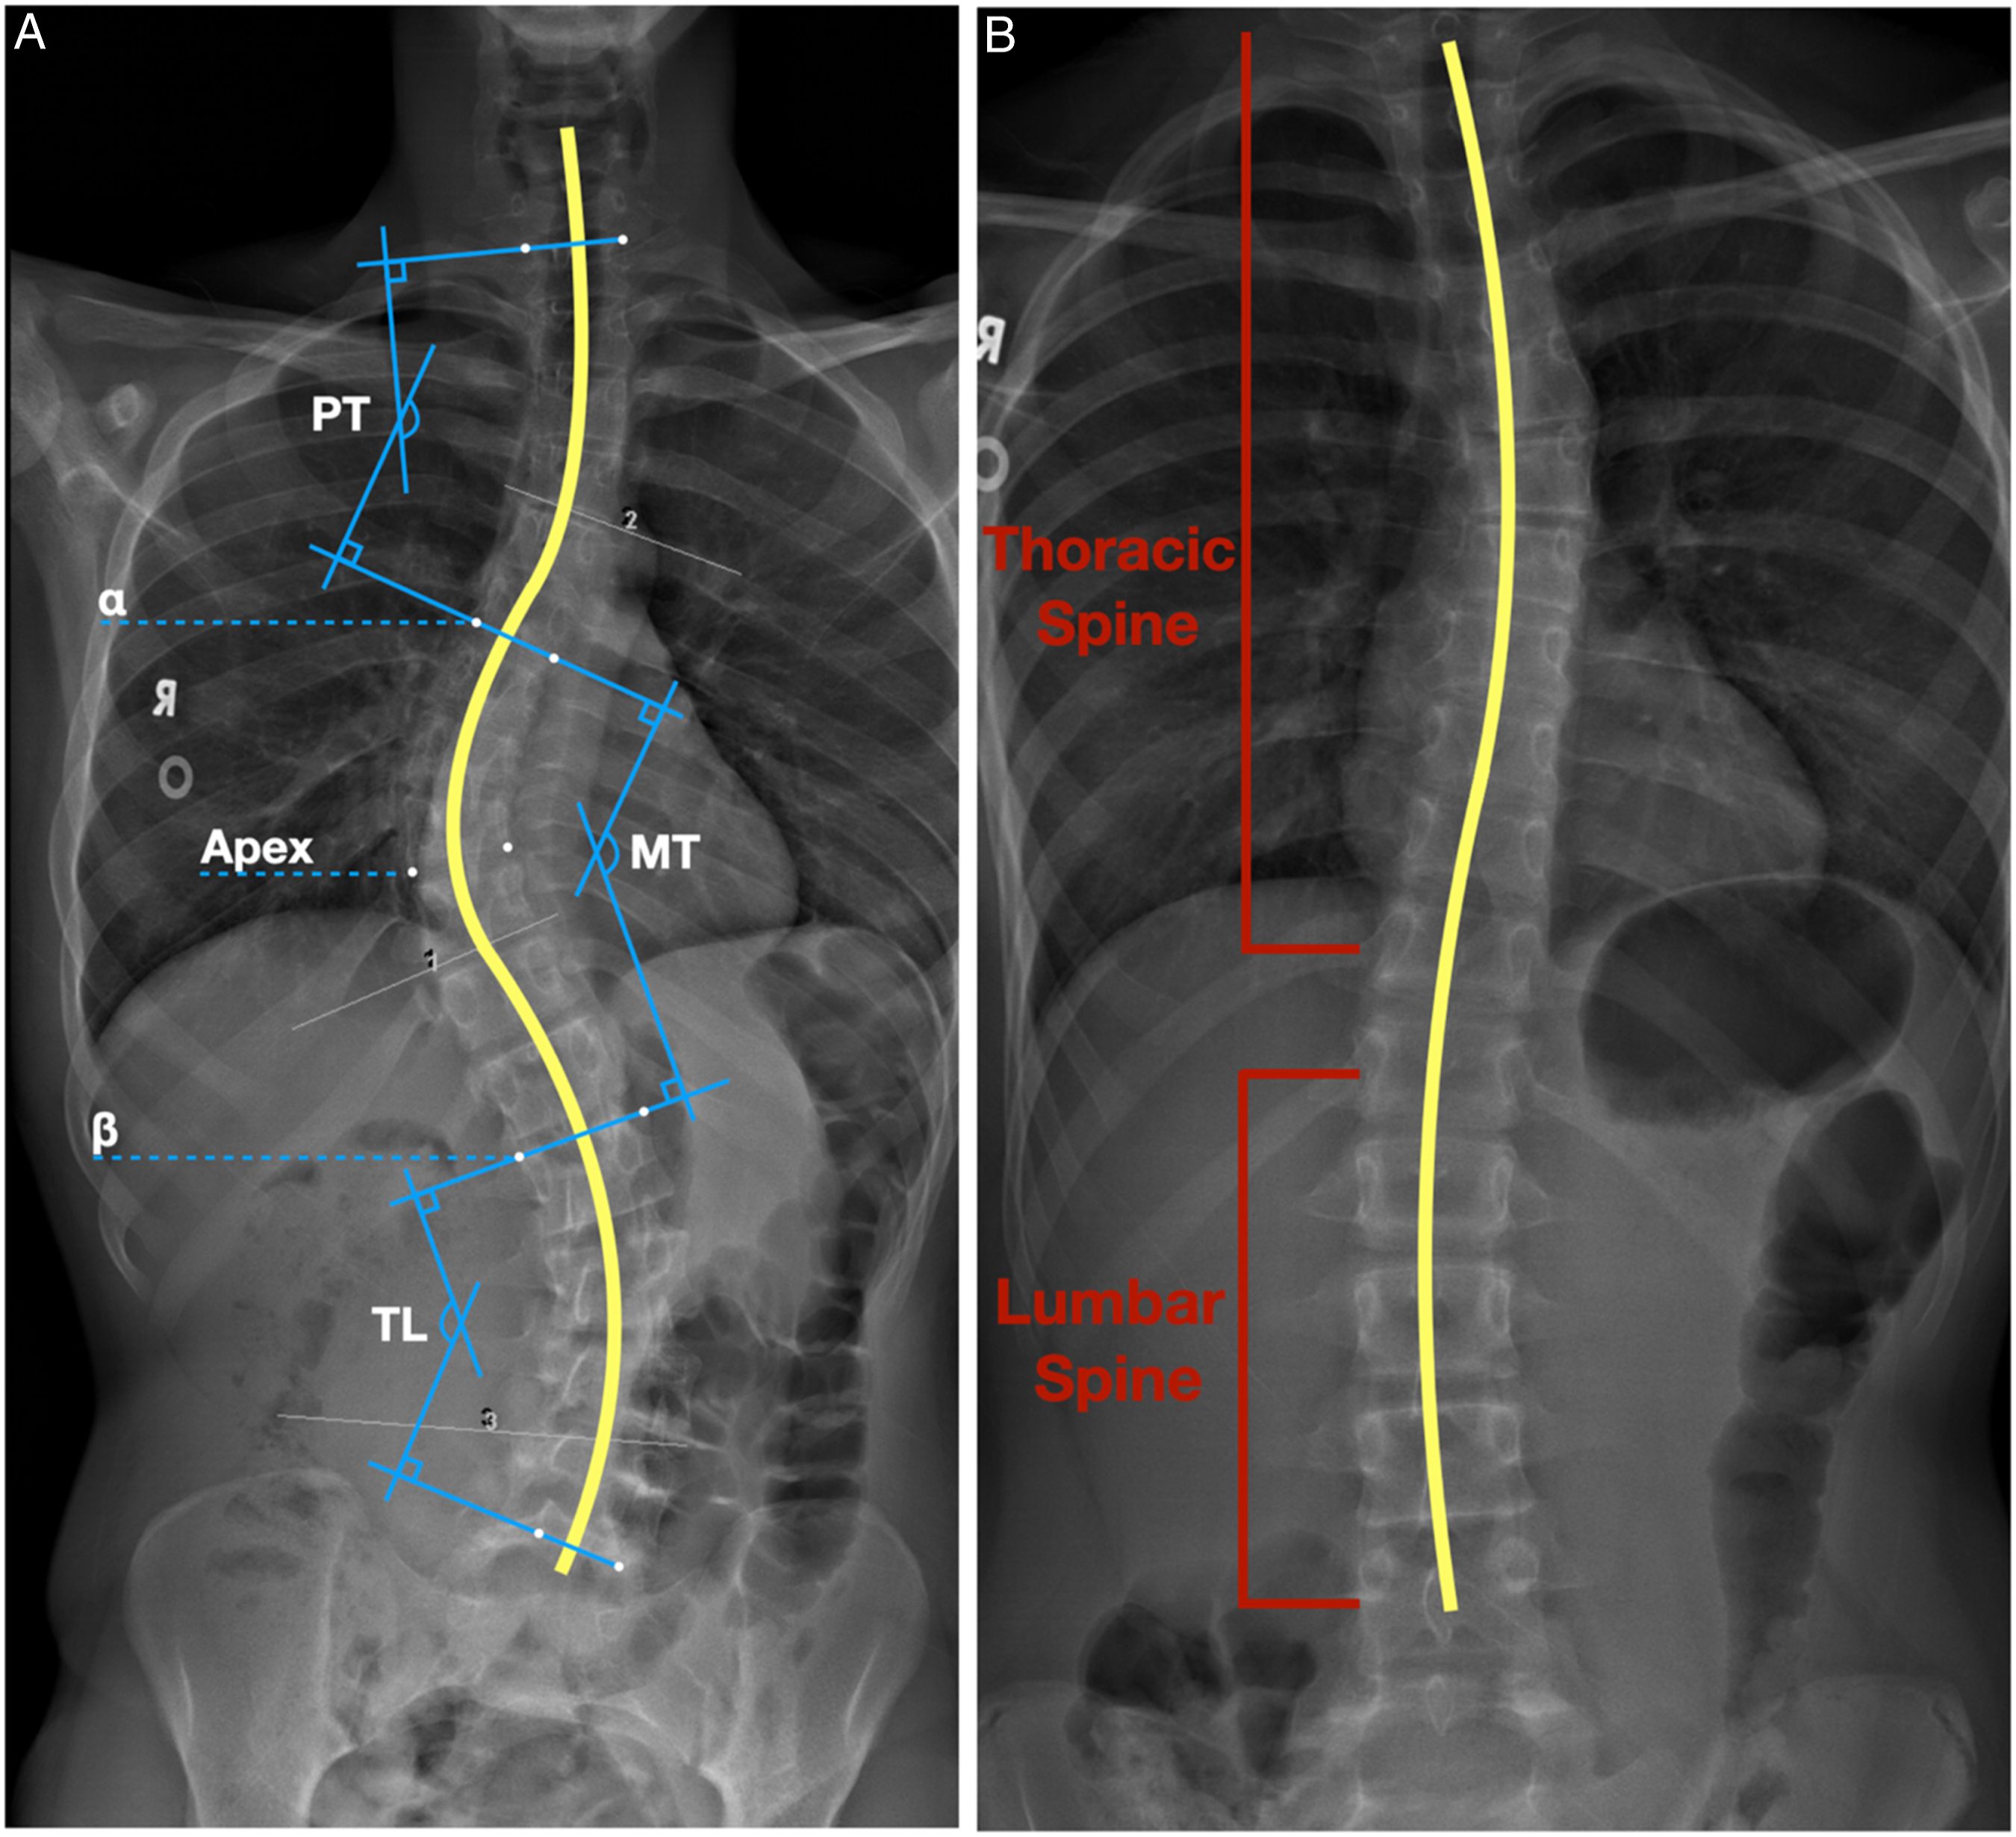
Previous Work
The majority of the current computer-aided automatic Cobb angle estimation techniques are based on the task of localizing landmarks in the thoracic and lumbar regions. These pipelines use landmark coordinates to compute Cobb angles. Common approaches to localizing landmarks include direct estimation and segmentation of the vertebras.
Direct estimation methods
Direct estimation approaches for the vertebra landmarks approximation have adopted various machine learning (ML) algorithms, such as Support Vector Regression (SVR) and Convolutional Neural Networks (CNN). Sun et al proposed the Structured Support Vector Regression (S2VR) 6 technique, which takes the advantage of SVR in handling non-linear input-output relationships, and relies on mapping hand-crafted features from input X-Ray images to landmark coordinates, and Cobb angles simultaneously. BoostNet 5 is another direct estimation approach that automates feature extraction using a CNN and filters outlier features with statistical methods. Khanal et al. proposed a CNN-based solution 7 to isolate each vertebra with Faster-RCNN, 8 which consists of a Region Proposal Network (RPN) to propose candidate regions of interest (ROIs) and a layer to regress vertebrae bounding boxes for each individual vertebra. Once the bounding boxes are formed, landmarks within each individual vertebra bounding box are detected by a DenseNet. 9
Segmentation-Based Methods
Segmentation-based approaches for the vertebra landmarks approximation consist of classifying individual pixels into foreground and background, followed by extracting landmark coordinates from the segmentations. Horng et al. utilized CNNs for vertebrae segmentation 10 and used three variations of U-Net architecture, 11 namely, the base U-Net, Residual U-Net, and Dense U-Net. Residual U-Net achieved the best results. Anitha et al. proposed Active Contour method, 12 where the vertebrae are contoured by gradient vector flow (GVF) snakes. 13 GVF snakes are initialized with a closed path encompassing the ROI which is iteratively improved based on the integration of gradients of pixel intensities on the path.
The accuracy of landmark localization techniques is crucial for predicting Cobb Angles. Direct estimation approaches are impacted by the highly non-linear association between input images and desired output, and thus any minor error in identifying landmark coordinates may lead to significant errors in Cobb angle calculations. In contrast, segmentation-based approaches extract vertebra landmarks from processed segmentations. Nevertheless, X-Ray machine settings, anatomical variability, and low tissue contrast can affect segmentation results. In this paper, we propose a novel architecture to tackle the challenges of the segmentation-based methods by introducing extra kernel constraints when selecting image features.
Methodology
Research Ethics Board approval was obtained for this study. Given the retrospective nature of the study informed consent was waived.
Dataset
AASCE-MICCAI challenge 2019 dataset
AASCE-MICCAI challenge 2019 dataset 5 is composed of 609 spinal Anterior-Posterior (AP) X-Ray images, with all of the patients showing signs of scoliosis. Since the dataset includes cervical vertebrae, which are seldom involved in spinal deformity, 14 all images were cropped to only include the ROIs (i.e., 17 vertebrae from the thoracic and lumbar regions). Each image is provided with 68 landmark coordinates labelled by professional radiologists. The landmark ground truths are ordered from top to bottom, left to right, and normalized into [0, 1]. They also include 3 Cobb angles in the order of proximal thoracic (PT), main thoracic (MT), and thoraco-lumbar (TL) spine. We randomly split the dataset into subsets of 481 samples for training (85%) and validation (15%) and 128 samples for testing. In the test set, 26 cases were excluded due to inaccurate ground truth landmarks, leaving the test set with 102 samples. Figure 1(a) shows an example from the AASCE-MICCAI challenge 2019 dataset. 5
Internal dataset
We further validated (external validation) the proposed architecture on another dataset obtained internally in a paediatric hospital. The dataset is composed of 55 spinal standing AP X-Ray images captured from children aged 9 to 17 showing signs of scoliosis. A subset of patients (n = 8) who had undergone prior spine surgeries, who were using braces during the X-Ray data acquisition, or who had spine segmentation anomalies were marked as extreme cases and hence, two datasets were constructed for the external validation: the first set that includes all cases (n = 55), and the second set that excludes extreme cases (n = 47).
The images in the internal dataset were manually cropped to reproduce AASCE-MICCAI challenge 2019 dataset’s constraints on the ROIs. The internal dataset contains similar ground truth information as the AASCE-MICCAI challenge 2019 dataset. The landmark coordinates were labelled by a senior radiology resident (PGY5) (S.H.) who was supervised by a senior radiology staff with more than 20 years of experience in pediatric radiology (A.S.D.). It should be highlighted that the internal dataset was not involved in model training, and all samples in the dataset were reserved for testing purposes. Figure 1(b) shows an example of the internal dataset.
Data augmentation
Given CNNs demanding large training datasets, data augmentation is often used in pipelines. 15 By augmenting the dataset, the CNN is exposed to more diversity in the data, and thus is less likely to overfit the dataset. 15 We employed conventional data augmentation techniques including mirroring each data sample, randomly tilting each image with an angle up to 10 degrees, randomly adjusting the gamma of each image, and the combination of multiple operations, for example, tilting after the gamma is adjusted.
Proposed Architecture
The proposed architecture consists of two phases: (1) Segmenting objects of interest by an Augmented U-Net neural network and (2) refining extracted landmark coordinates by a non-learning-based error correction and outlier rejection technique.
The augmented U-net architecture
The proposed Augmented U-Net is a novel architecture to perform precise segmentation tasks on spinal vertebra region. The architecture is a derivation of the conventional U-Net architecture, 11 with an additional path, namely, the Augmented path. The Augmented U-Net is trained to segment the vertebrae, where the target shape is rectangular. 16 Literature suggests the average length of the vertebrae is approximately twice their average height,16–18 which was confirmed by the experiments we conducted on a sample dataset from the training cohort. Hence, we enforced the model to treat the horizontal pixels twice as significant compared with vertical pixels by applying non-square kernels on the augmented path. Inspired by the Double U-Net, 19 we hypothesized the output feature map produced by using only non-square kernels can be further refined by incorporating feature map produced by square kernels. Consequently, a path containing square kernels, which simulated conventional U-Net architecture 11 was employed in parallel. This ensures that the Augmented U-Net does not lose the information flow of the original U-Net architecture while enforcing a priori knowledge of the shape of the vertebrae. The Augmented U-Net learnt features from both settings, and two paths were merged before final output generation.
Non-square kernels
We enforced vertebra shape constraints by introducing non-square kernels. The non-square kernels assign more attention to the horizontal features than the vertical features within the filters. Nevertheless, non-square kernels may fade edge and corner features in the feature maps because they have a broader field of view. Thus, a conventional U-Net branch is employed in parallel to the non-square-kernel path.
Implementation
A block diagram of the proposed Augmented U-Net architecture is shown in Figure 2. Each of the paths in the Augmented U-Net architecture behaves as an individual U-Net network in the early stage. The input images were cropped, and their size was unified to 256 × 512, resulting in ROI-limited frames. The input images were fed into both paths simultaneously. Each path started with dedicated encoder structures to extract image features. The encoder structures consist of multiple convolutional layers and max-pooling layers. Max-pooling layers downsample the input images by a multiplier of 4 after every two convolutional layers. Dropout layers were then employed in between consecutive convolutional layers to prevent model from overfitting. Block diagram of the proposed Augmented U-Net architecture.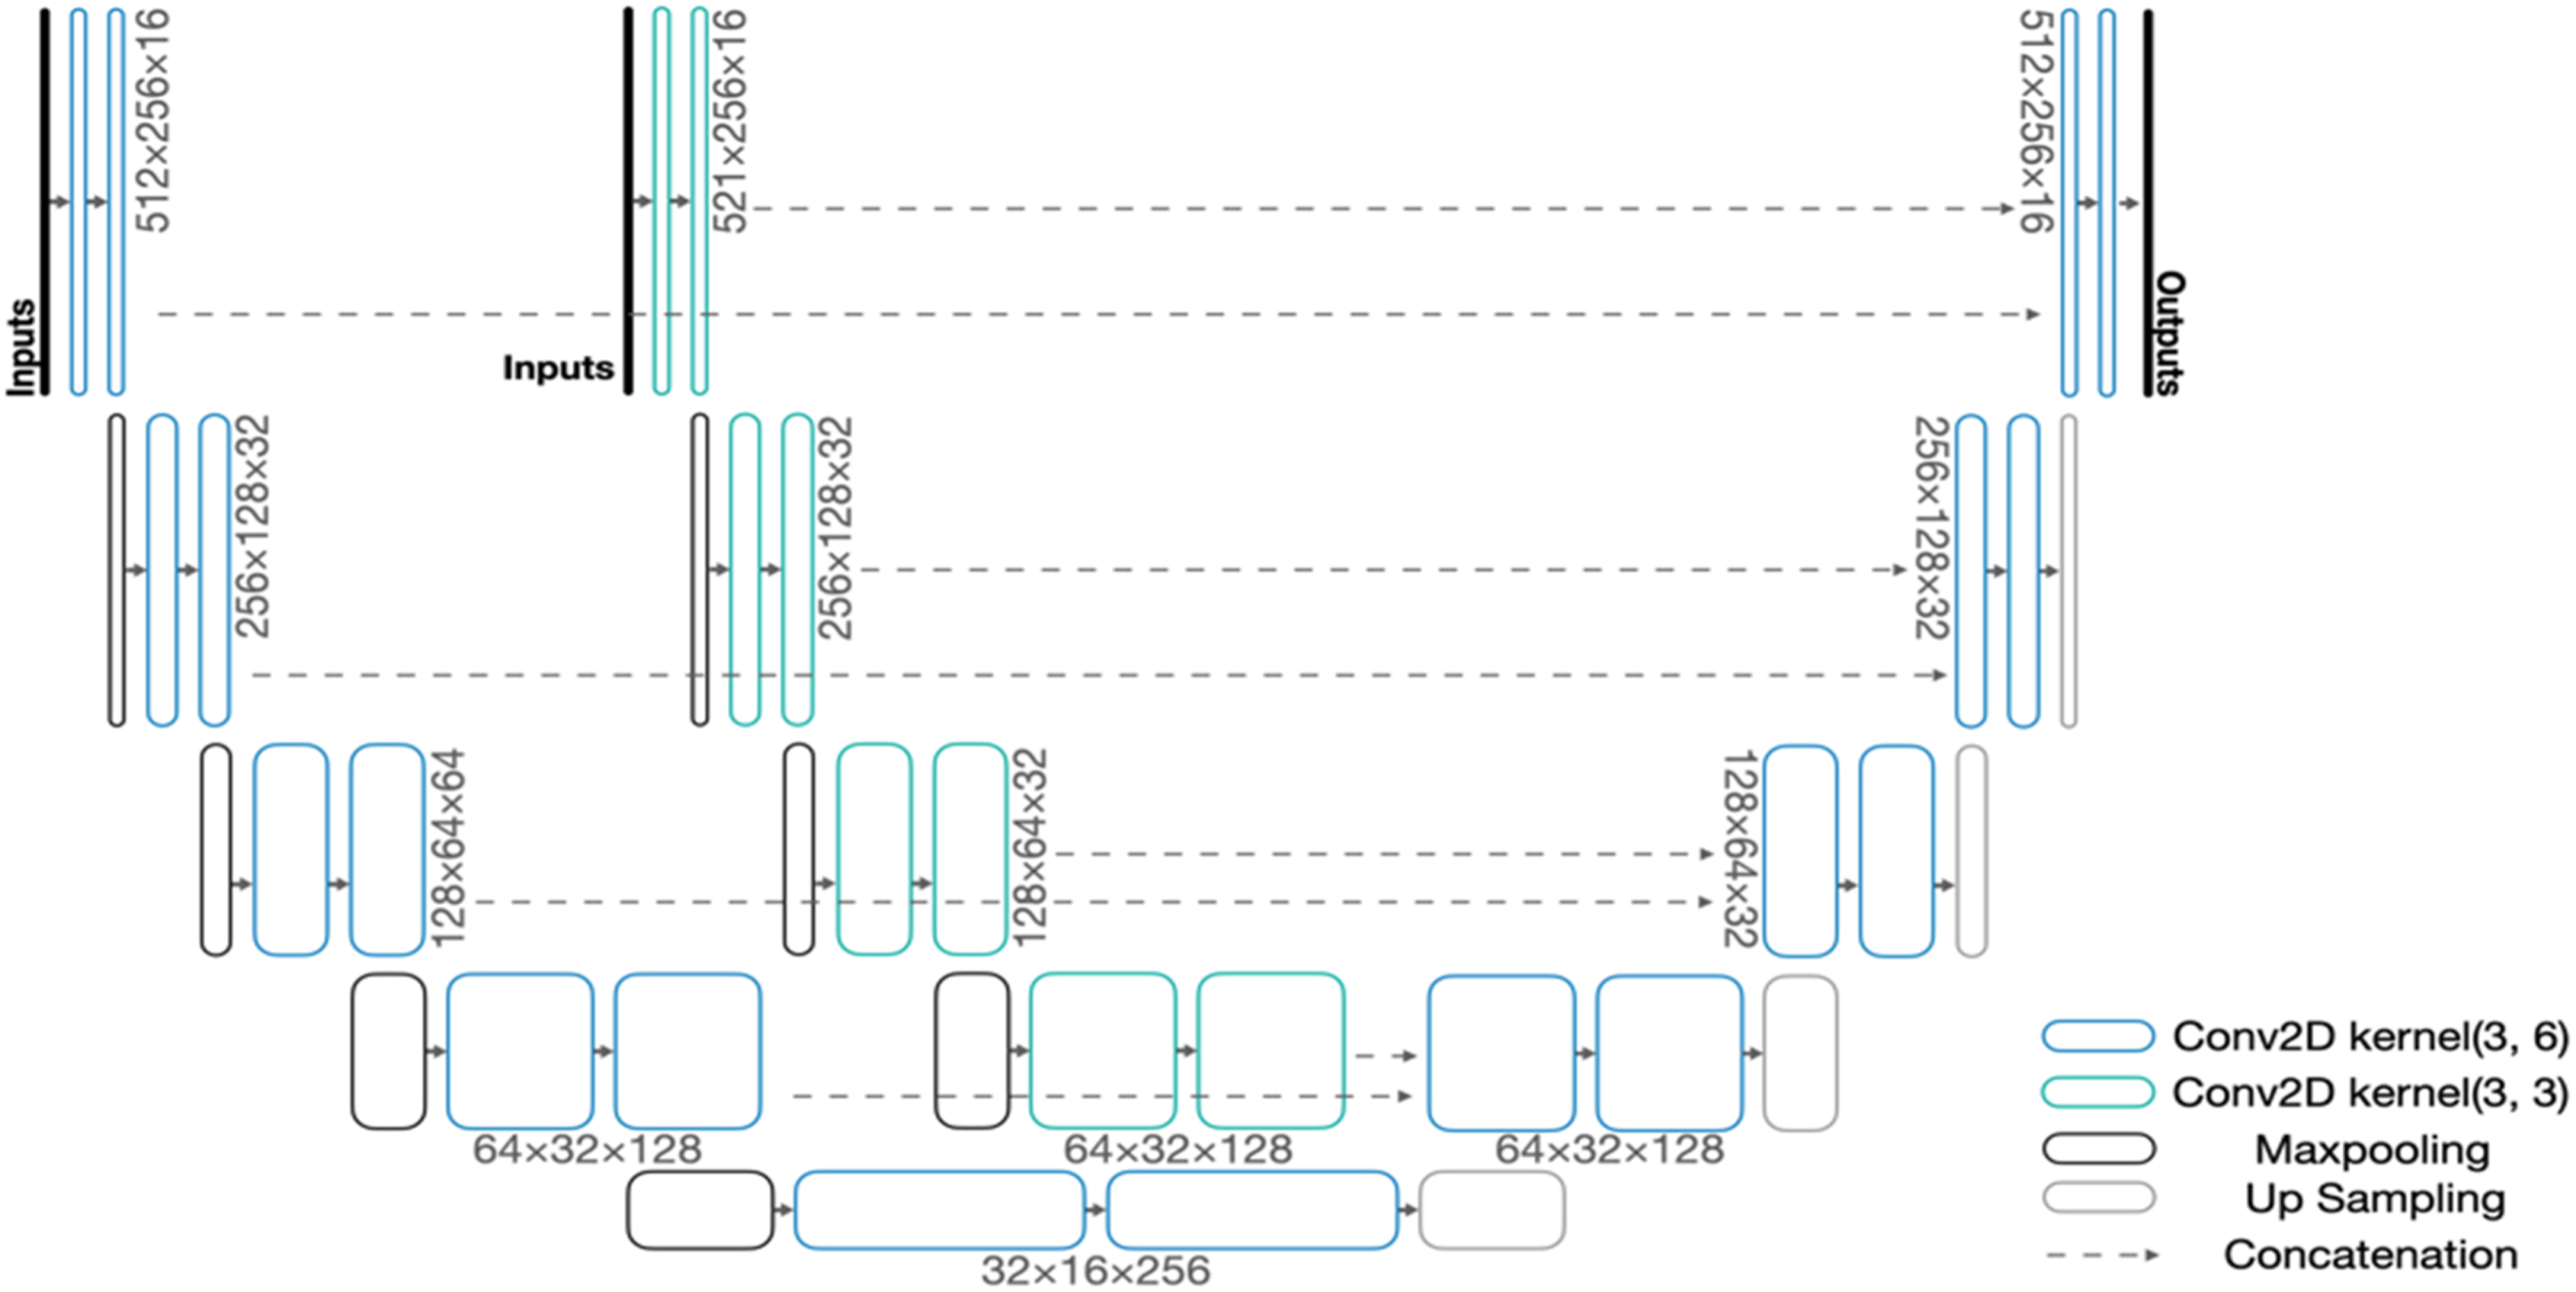
Decoders were then applied to project lower-level features back to the pixel space. The decoders consist of multiple convolutional layers and upsampling layers. Similar to the encoder, we used upsampling layers between every two convolutional layers and dropout layers between consecutive convolutional layers. Similar to the original U-Net architecture, 11 the Augmented U-Net requires concatenations between encoders and decoders to refine details that may vanish during downsampling. 11 The two-channel output layer of the Augmented U-Net was activated by the Softmax function, corresponding to the probability of each pixel belonging to the object of interest (foreground) and background, respectively. We compared both probabilities and classified each pixel to either 1 (foreground) or 0 (background) accordingly.
Vertebra Extraction
We applied Border-following algorithm 20 to the segmentation results to initiate the vertebra extraction process. This algorithm detects the borders of connected foreground objects in the segmentation results, namely, the vertebrae, and reformats them into collections of coordinates. Within each vertebra contour, the minimum bounding rectangle (MBR) algorithm 21 was used to discover the tightest enclosing rectangle.
Outlier Rejection
The following sections discuss error correction and outlier rejection techniques we introduced to refine the extracted landmark coordinates based on the adjacent vertebrae.
Location filtration
Spine vertebrae form a line when they are connected, and consecutive vertebrae have close orientations and coordinates. A segmentation generated by the Augmented U-Net may contain misclassified pixels in the form of outliers. We used the coordinates of the topmost vertebra, which is assumed to be correctly segmented, as a reference to enforce the location offsets of consecutive vertebrae. We determined the maximum offset to be 40 pixels horizontally based on experiments on the training set. Vertebrae farther from their adjacent neighbours were treated as outliers and thus, discarded.
Size filtration
The Augmented U-Net network occasionally generates false positive objects in the spine area other than vertebrae, such as tissues and ribs. We studied the size variation between true positives and false positives from ground-truth information in the training cohort. The results suggested the average size of the vertebrae above and below the apex were similar. Hence, we grouped foreground objects based on their positions related to the apex and calculated the average sizes for both sets. Based on the experiments, the foreground objects with a size 60% larger than the average size were considered non-vertebra objects and thus, discarded.
Cobb Angle Calculation
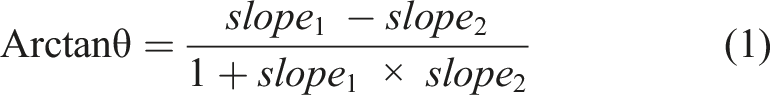
We extracted the landmarks of the four corners of each vertebra and derived the final Cobb angles as follows: (1) compute slopes for every pair (left and right corners) of vertebrae landmarks, (2) identify the landmark pair with the furthest deviation from the expected position of the spine, that is, the apex,
22
(3) identify the most tilted landmark pair (i.e., with the largest slope) above the apex (α), (4) identify the most tilted landmark pair (i.e., with the largest slope) below the apex (β), and (5) compute 3 Cobb angles using equation (1): a) proximal thoracic (PT) cobb angle – angle between the topmost landmark pair and α. b) main thoracic (MT) cobb angle – angle between α and β. c) thoraco-lumbar (TL) cobb angle – angle between β and the bottom most pair
Evaluation Metrics
We used the Symmetric Mean Absolute Percentage Error or SMAPE, as our primary evaluation metric to quantify the quality of the predicted Cobb Angles. Equation (2) describes the SMAPE metric, where N represents the number of samples in the test dataset, and A and B are the ground truth and predicted angles, respectively. Lower SMAPE corresponds to a better performance
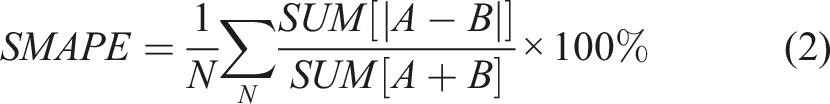
The actual angle differences calculated according to equation (3) are also important to compare the predictions and ground truths

Results
The novel architecture proposed in this paper achieved superior performances for both spinal vertebra segmentation and Cobb angle measurement tasks compared to benchmarks.10,23,24
Qualitative Results for Spinal Vertebra Segmentation
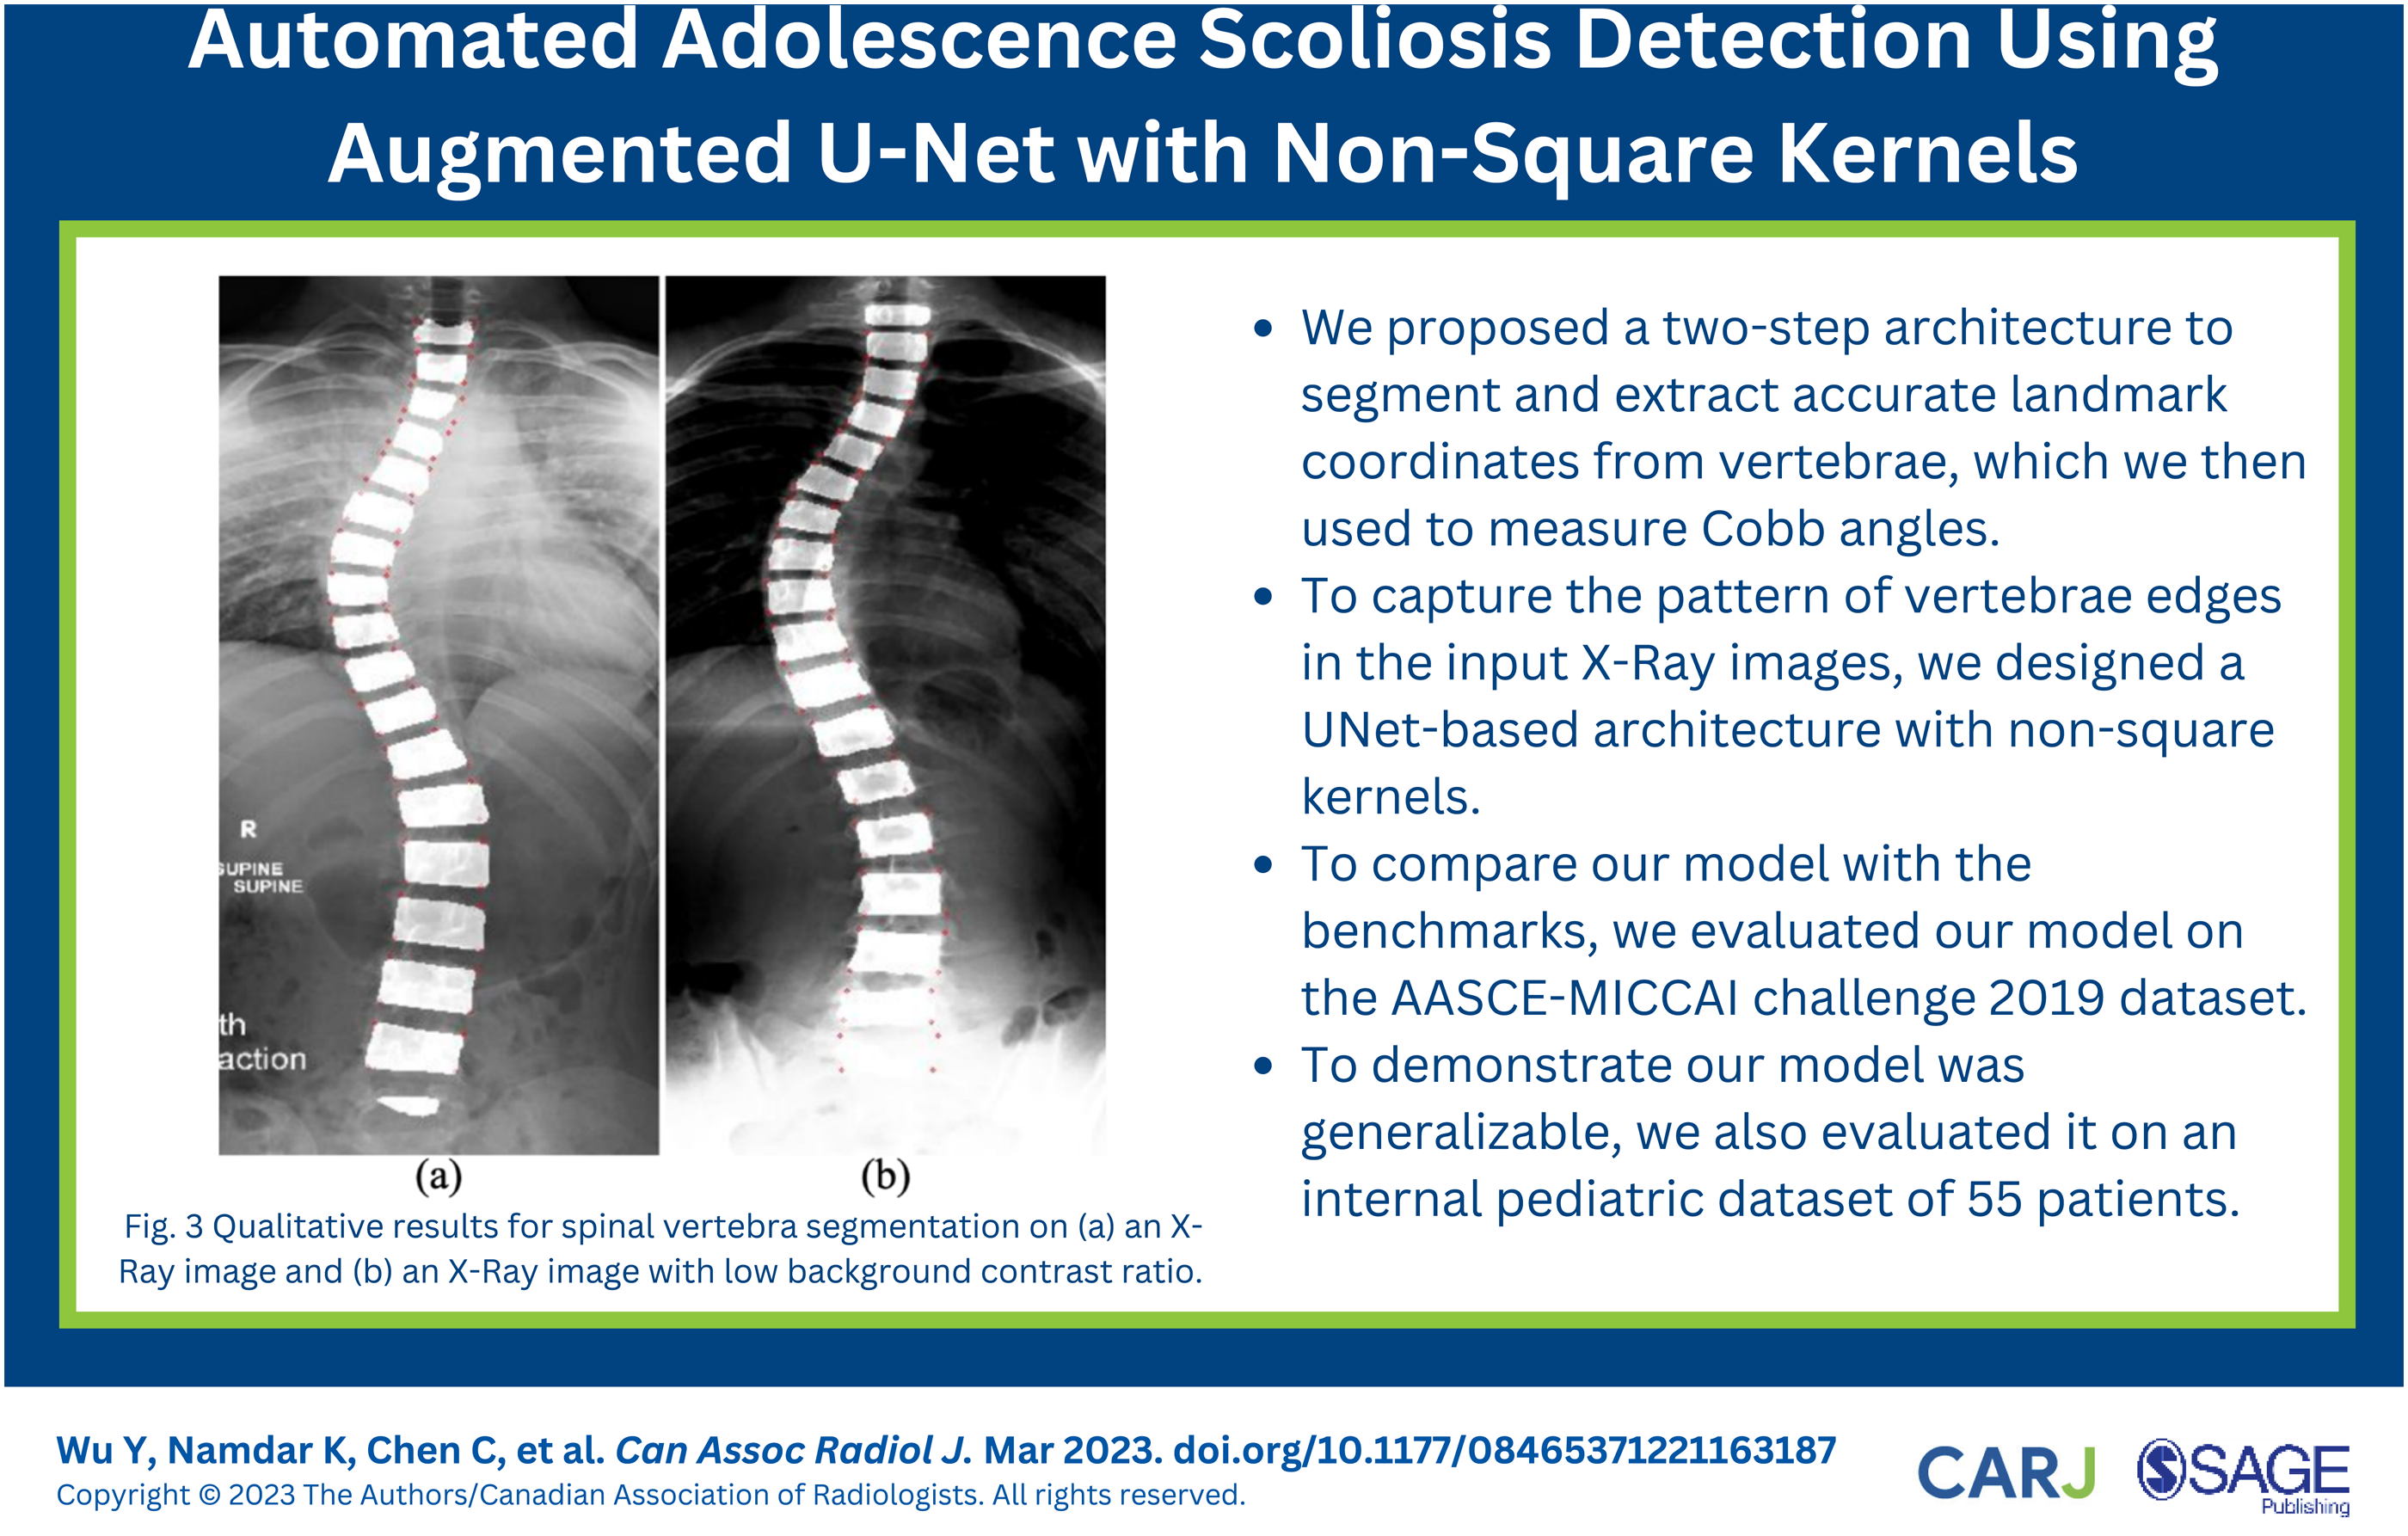
Figure 3 illustrates the qualitative segmentation results of spinal vertebra generated by the Augmented U-Net architecture as highlighted areas. At least 17 segmented vertebral endplates were included in each image. Exceptions existed as the X-Ray images may include vertebral endplates other than thoracic and lumbar vertebra. The proposed architecture accurately detected all desired spinal vertebrae (highlighted in red) and generated precise segmentations. Unlabelled or partially labelled vertebrae, for example, the bottom vertebra from Figure 3(a), were discarded by our proposed outlier rejection algorithm. The segmented vertebrae followed the curve of the spine, and clear boundaries between adjacent vertebrae were presented in the majority of cases (87 out of 102). Successful separation of the adjacent vertebrae improved the precision of the later landmark coordinates extraction step. Qualitative results for spinal vertebra segmentation on (a) an X-Ray image and (b) an X-Ray image with low background contrast ratio. The red points highlight estimated landmark coordinates.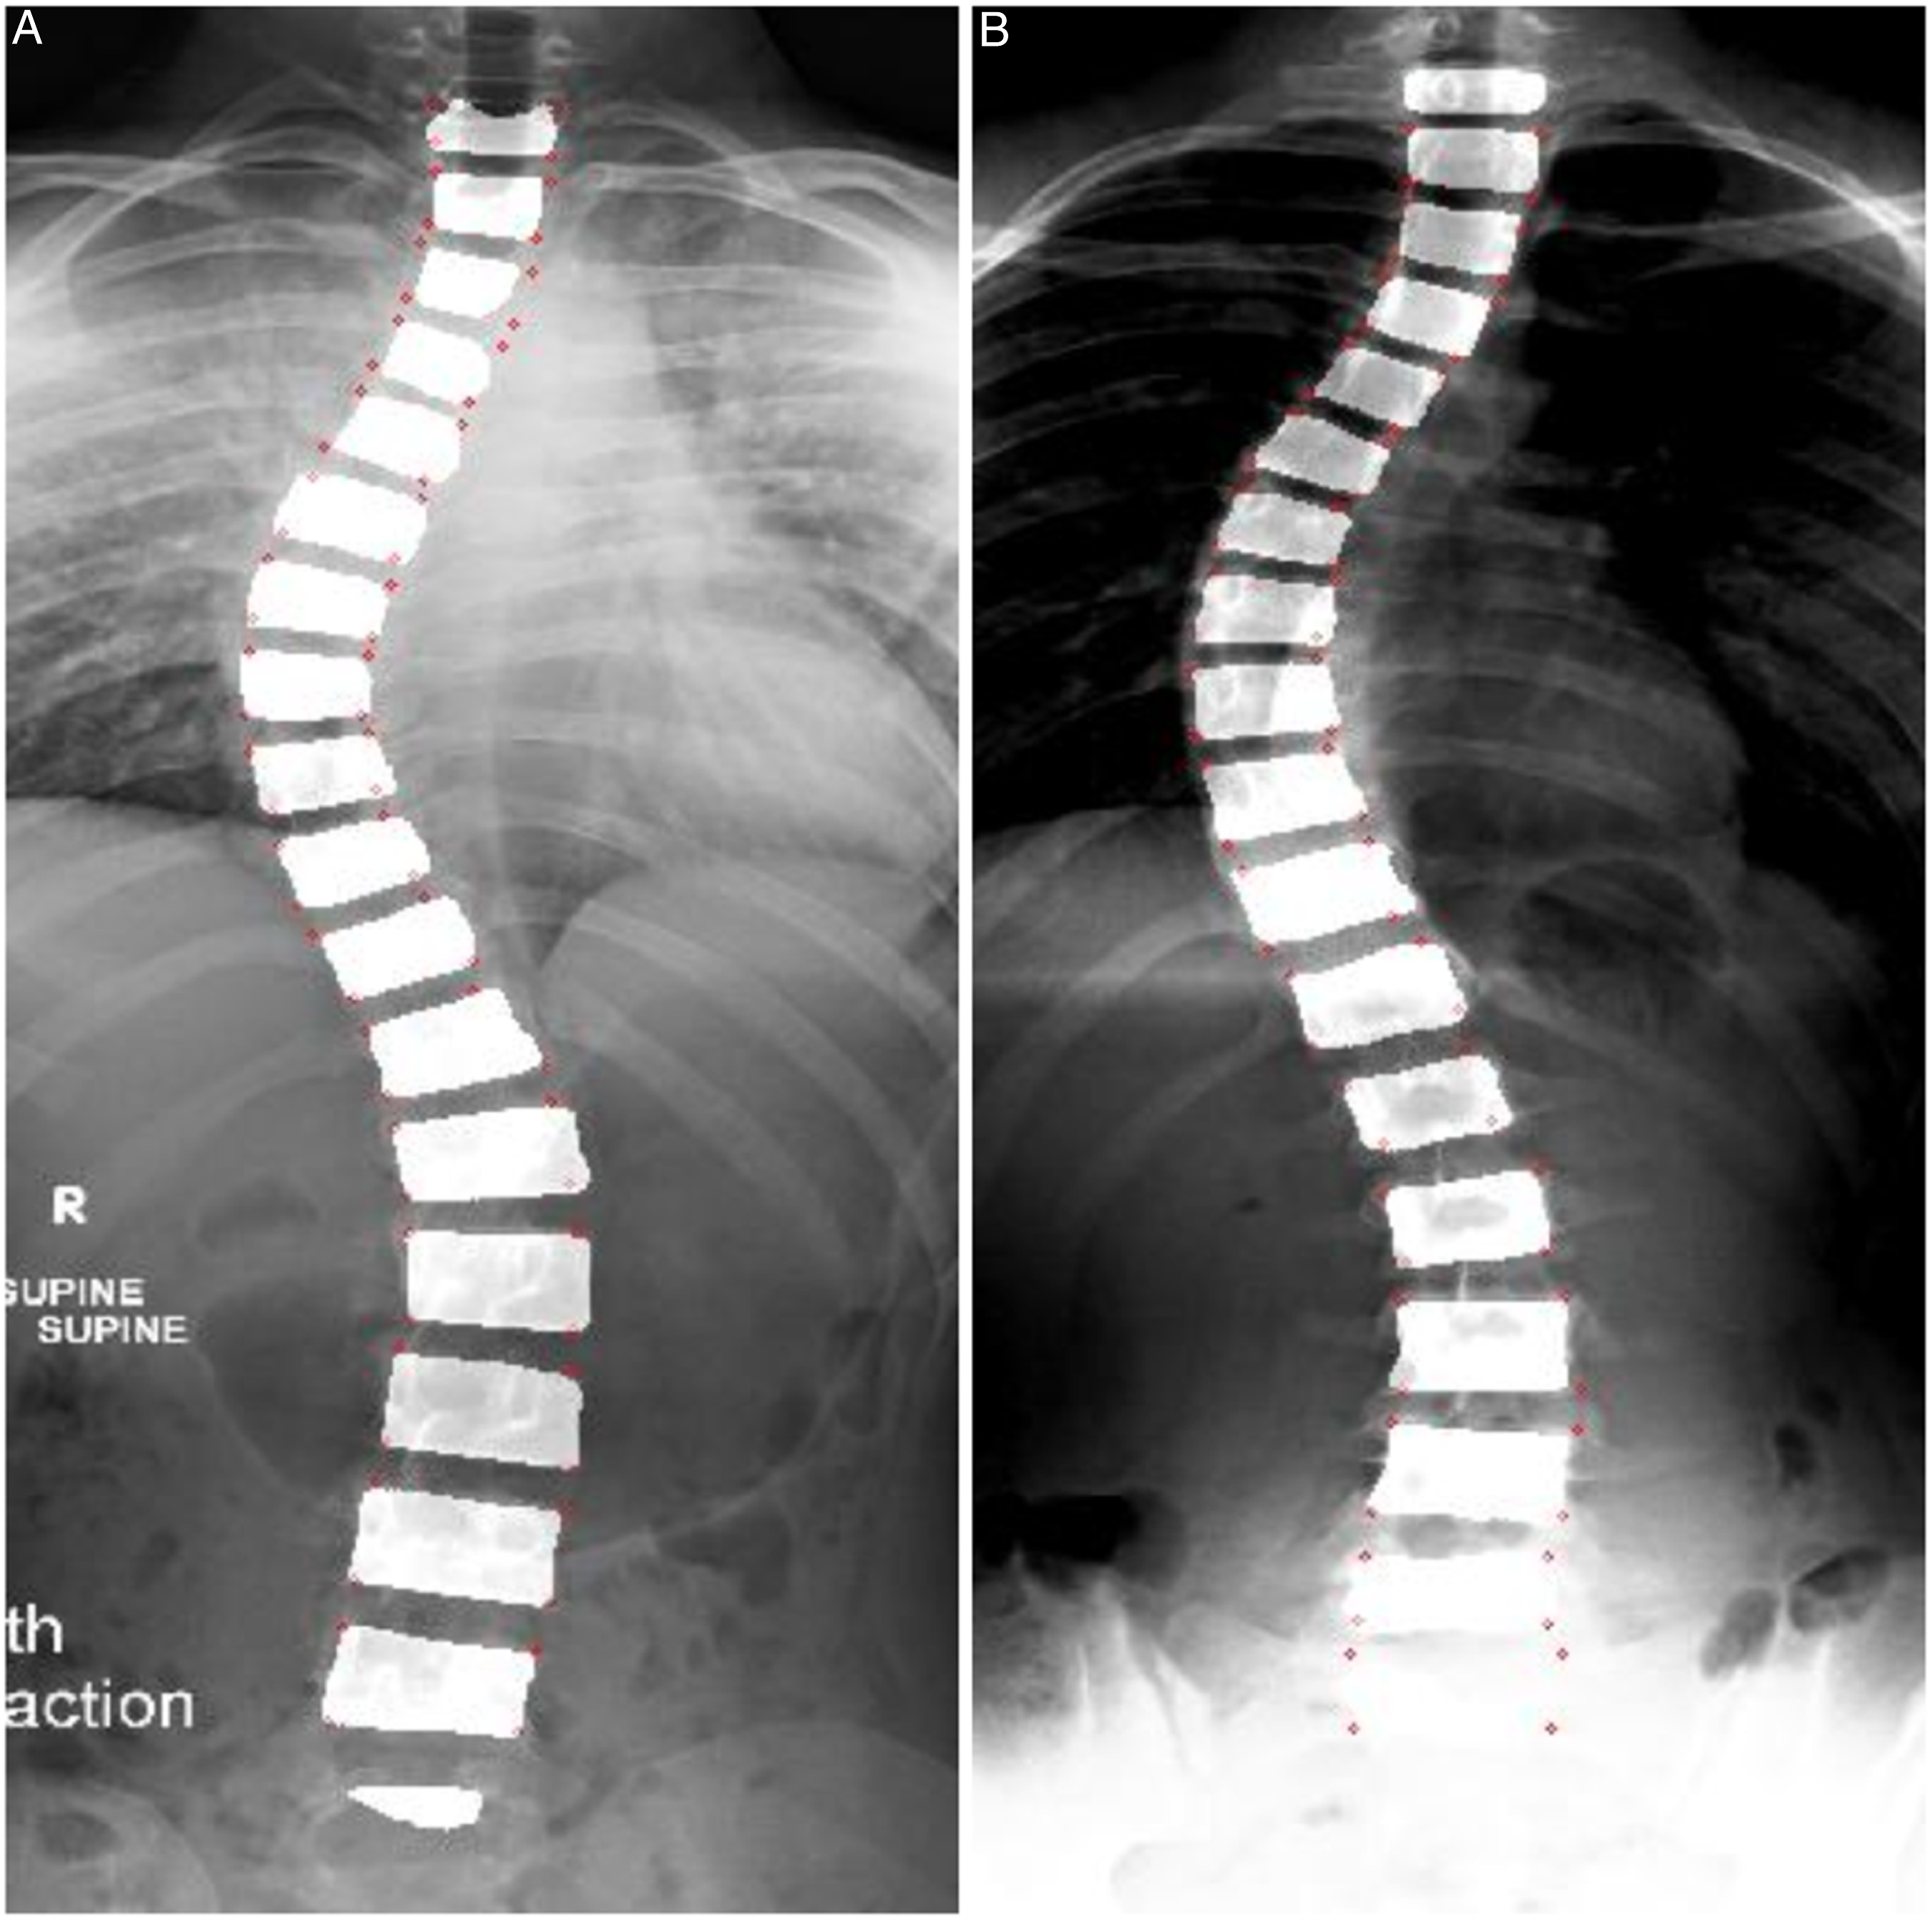
Quantitative Results for Cobb Angles Measurement
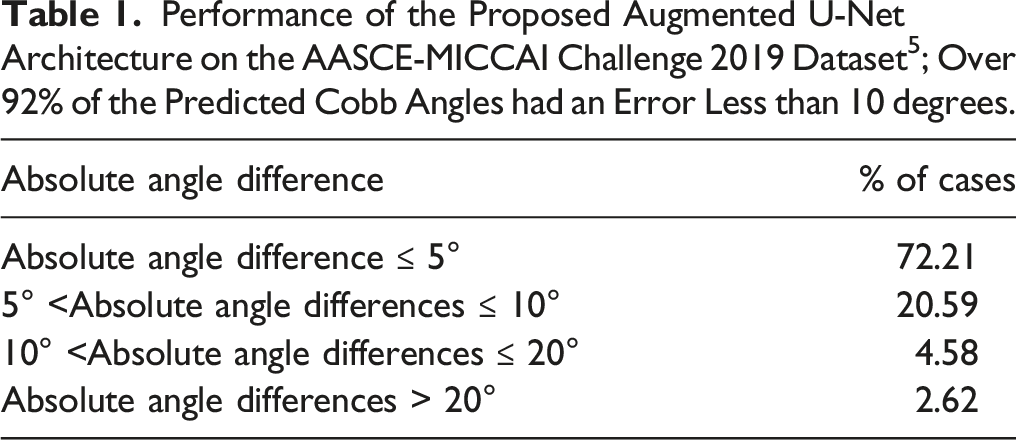
Performance of the Proposed Augmented U-Net Architecture on the AASCE-MICCAI Challenge 2019 Dataset 5 ; Over 92% of the Predicted Cobb Angles had an Error Less than 10 degrees.
External Validation
Performance of the Proposed Augmented U-Net Architecture on the Internal dataset With and Without Extreme Cases; Over 90% of the Predicted Cobb Angles in Both Cases had an Error Less than 10 degrees.
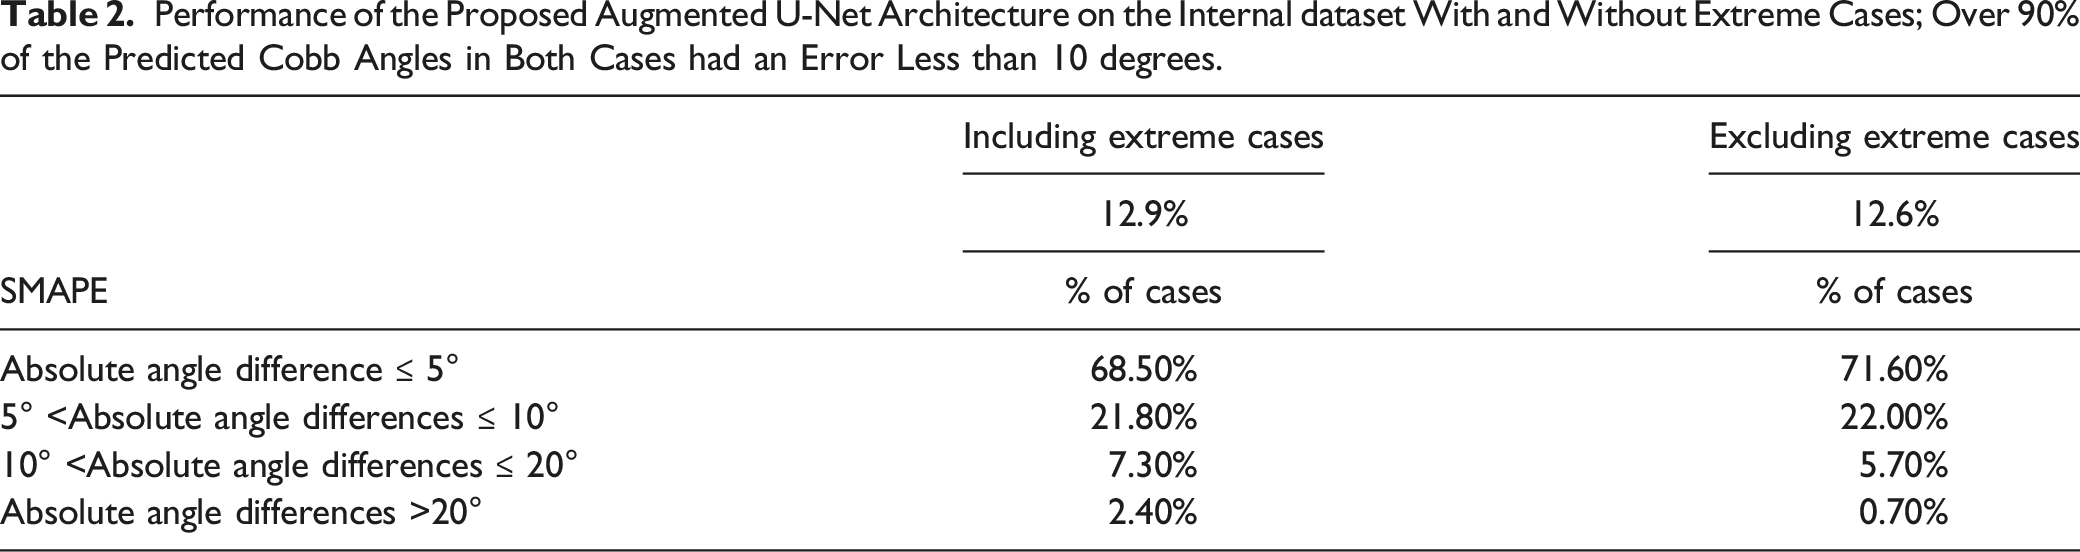
Figure 4 illustrates examples of extreme cases in the internal dataset, where large artifacts and pixel noise are observed around the vertebra region. Such artifacts resulted in reduced visual distinguishability of nearby vertebrae. We investigated the performance of the architecture after excluding the extreme cases that the radiologists could not confidently distinguish vertebra landmarks due to the interfering noises. The overall SMAPE without extreme cases was 12.6%, and over 93% of Cobb angle predictions had absolute differences of fewer than 10 degrees from the ground truths. Examples of extreme cases in the internal dataset.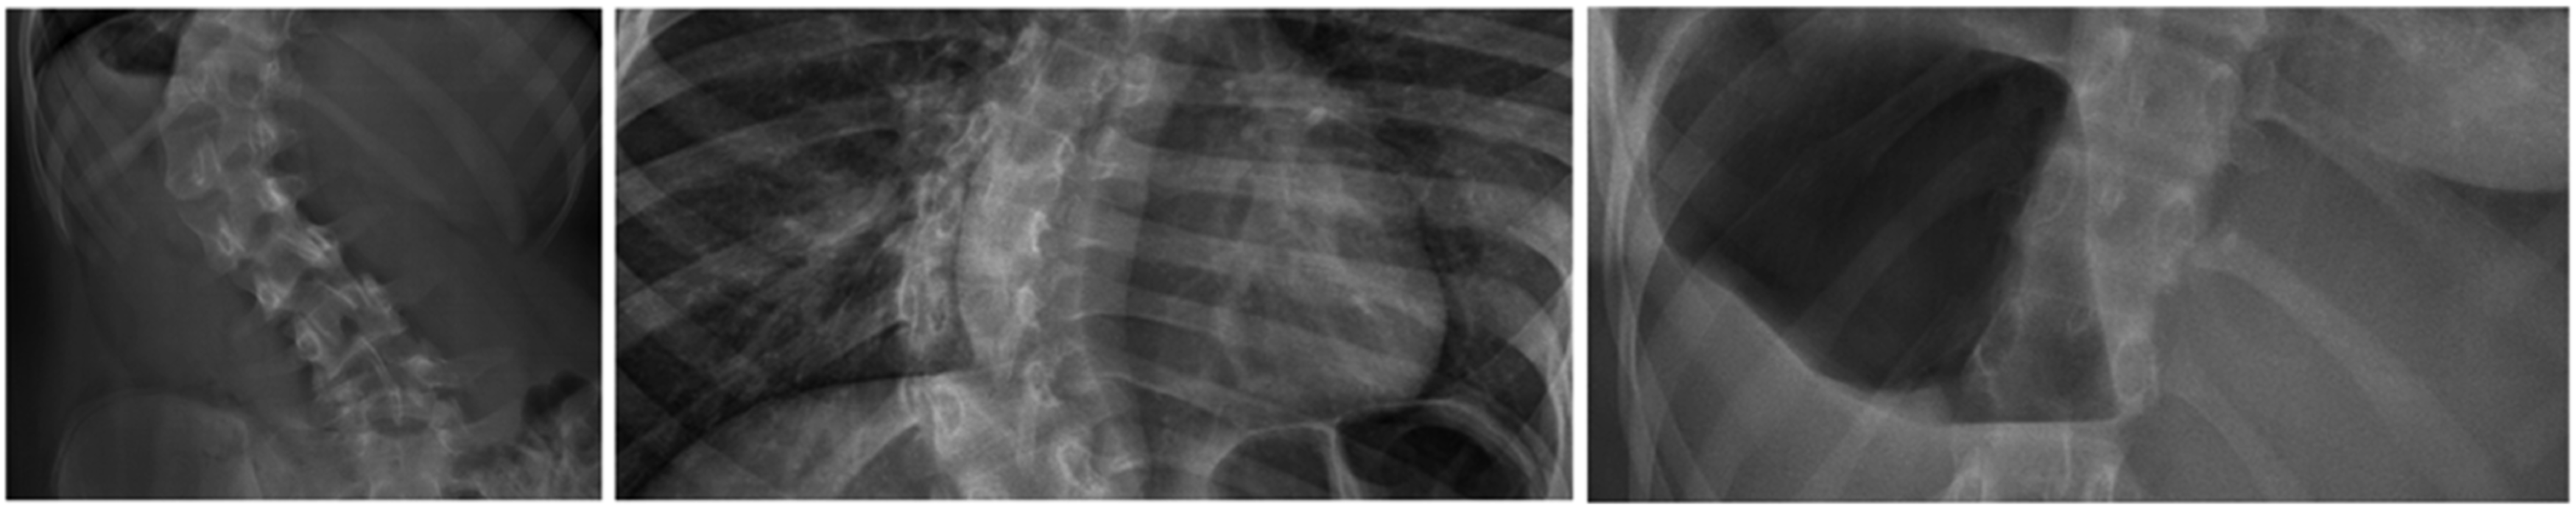
Vertebrae Segmentation Effect
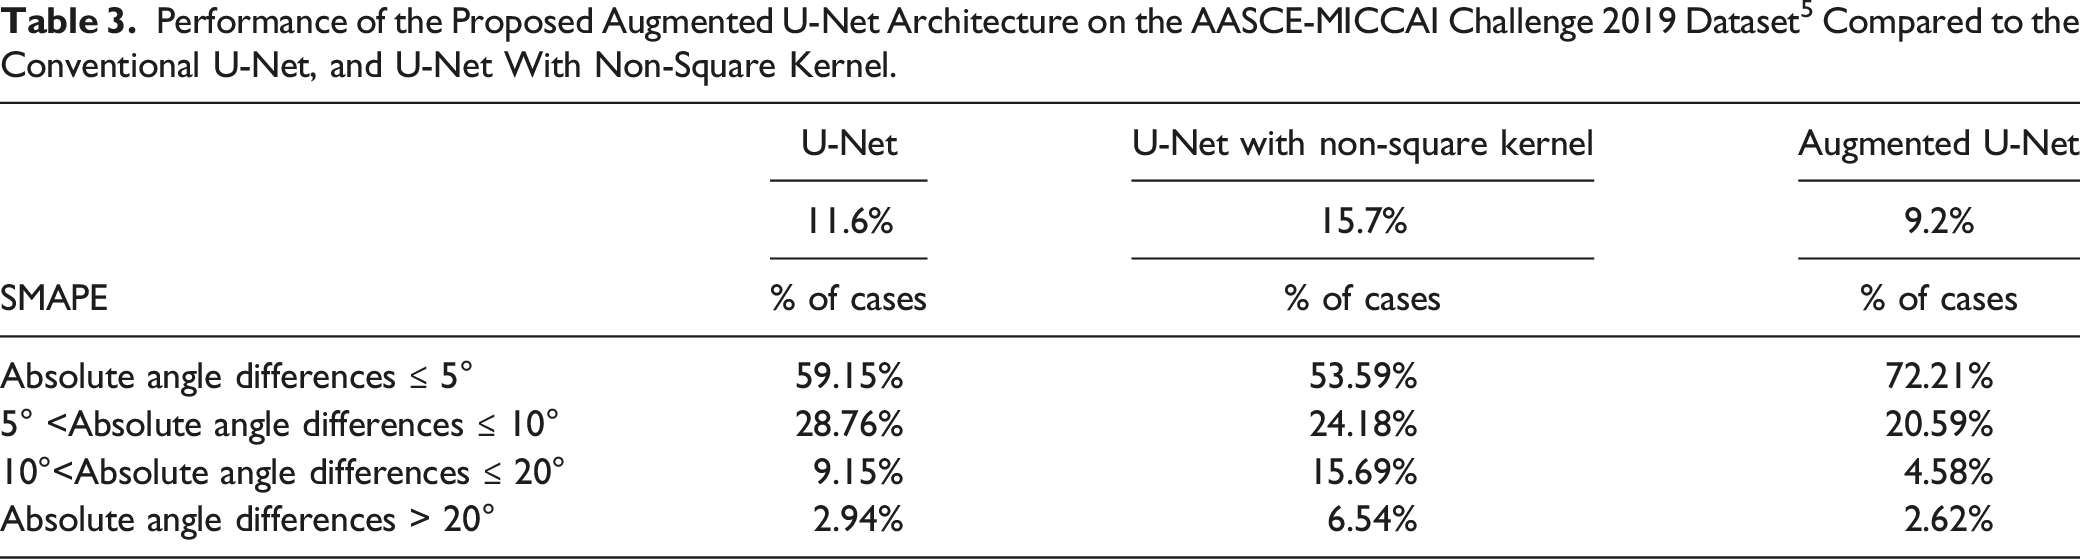
Performance of the Proposed Augmented U-Net Architecture on the AASCE-MICCAI Challenge 2019 Dataset 5 Compared to the Conventional U-Net, and U-Net With Non-Square Kernel.
Comparison to the State-of-the-Art
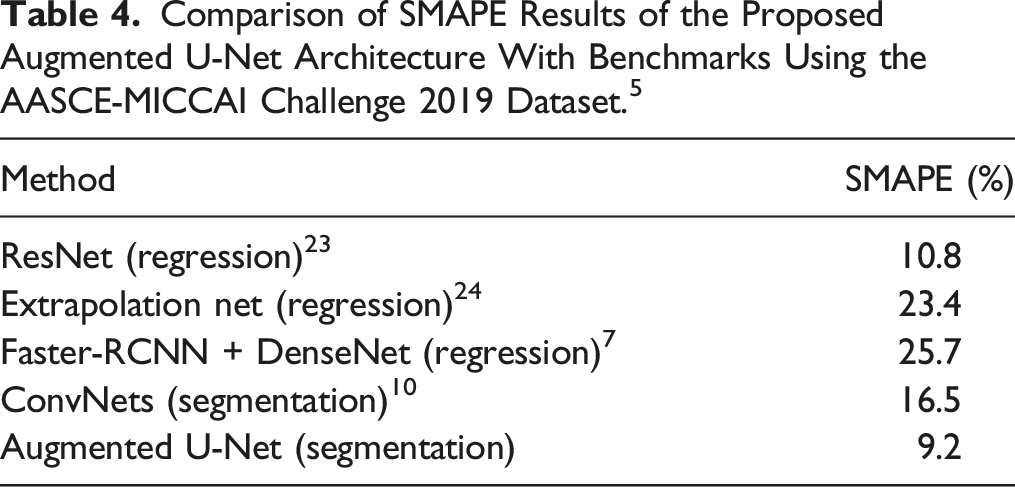
Comparison of SMAPE Results of the Proposed Augmented U-Net Architecture With Benchmarks Using the AASCE-MICCAI Challenge 2019 Dataset. 5
Discussion
In this work, we proposed Augmented U-Net segmentation architecture, which is robust in predicting Cobb angles from AP X-Ray images. The proposed architecture enhances vertebrae segmentation by applying non-square kernels, resulting in clear boundaries between adjacent vertebrae and fewer outliers. The post-processing algorithms efficiently filter undesired foreground pixels.
The common approach for automatically computing Cobb angles is based on localizing landmark coordinates of vertebrae in X-Rays, which is usually done by either direct estimation methods such as SVR 6 and BoostNet 5 or segmentation-based methods, which are usually based on variations of U-Net architecture. 11 Direct estimation methods are sensitive to accurate landmark localization, and conventional U-Net based segmentation methods do not consider the rectangle shape of vertebrae. Our proposed architecture overcame these limitations, and outperformed the existing methods (SMAPE: 9.2% vs 10.8%-25.7%). The external validation of our proposed architecture further confirmed the robustness of the Augmented U-Net in the estimation of Cobb angles (SMAPE: 12.9%).
The level of precision achieved by our proposed architecture enables radiologists in real-world clinical settings to perform faster, more accurate, and more reliable diagnostics for scoliosis. 25 Moreover, the vertebra segmentations generated by the Augmented U-Net can be used for purposes such as spinal surgery planning.
This work can be improved if a larger, multi-institutional dataset is accessible. Another clinically important point is separating patients who had surgery for training and testing. Larger batches of data for training and a deeper architecture could help the performance, however, training the Augmented U-Net would become computationally expensive.
Conclusion
In this paper, we proposed a novel segmentation architecture for spinal Cobb angle estimation, which takes advantage of the prior knowledge of the target shapes and applies designated non-square kernels to acquire superior segmentation results. Our approach resulted in improved SMAPE and absolute angle differences on the AASCE-MICCAI challenge 2019 dataset compared to benchmarks, demonstrating the pipeline’s applicability in clinical settings. Our architecture also achieved similar performance on an external validation.
Footnotes
Declaration of Conflicting Interests
The author(s) declared no potential conflicts of interest with respect to the research, authorship, and/or publication of this article.
Funding
The author(s) disclosed receipt of the following financial support for the research, authorship, and/or publication of this article: This work was supported by the Chair in Medical Imaging and Artificial Intelligence, a joint Hospital-University Chair between the University of Toronto, The Hospital for Sick Children, and the SickKids Foundation.
Appendix
The pretrained Augmented U-Net model can be accessed via: https://github.com/IMICSLab/Augmented_U-Net_for_Scoliosis_Detection.git