
Abstract
Hemorrhagic transformation is caused by extravasation of blood products from vessels after acute ischemic stroke. It is an undesirable and potentially devastating complication, which occurs in 10%-40% of clinical cases. Hemorrhagic transformation is classified into four subtypes based on European cooperative acute stroke study II. Predicting hemorrhagic complications at presentation can be useful life saving/altering decisions for the patient. Also, understanding the mechanisms of hemorrhagic transformation can lead to new treatments and intervention measures. We highlighted various imaging techniques that have been used to predict hemorrhagic transformation. Specifically, we looked at the usefulness of perfusion and permeability imaging for hemorrhagic transformation. Use of imaging to predict hemorrhagic transformation could change patient management that may lead to the prevention of hemorrhagic transformation before it occurs. We concluded that the current evidence is not strong enough to rely on these imaging parameters for predicting hemorrhagic transformation and more studies are required.
Introduction
Acute ischemic stroke (AIS) is associated with significant morbidity and mortality. Hemorrhagic transformation (HT) of stroke is the most common and feared complication of reperfusion therapy after AIS. 1 Recent papers have demonstrated that hemorrhagic complications are overwhelming the benefit of thrombolysis. A comprehensive understanding of the underlying etiology and pathophysiology of HT of AIS is required before strategies that mitigate the risk can be devised.
HT of AIS is complex and multifactorial with one of the most devastating complications of the AIS. Within seconds to minutes of ischemia onset there is a significant reduction in ATP production and cessation of Na+/ K+ ATPase activity. 2 The degree of anatomical and physiological disruption is highly dependent on the duration of ischemia. 2 A strong inflammatory response occurs in AIS distorting normal cerebrovascular anatomy and altering physiology. 3 Inflammation is accompanied by a cascade of cellular and metabolic processes that contribute to BBB disruption and cerebral vasculature autoregulatory impairment. 4 The resulting disruption of the BBB, and the subsequent impairment of the autoregulatory capacity of the cerebral vasculature, predisposes to blood extravasation. 5
Several mechanisms of HT have been proposed including ischemia/reperfusion injury, toxicity of tissue plasminogen activator (tPA) itself, inflammation; and/or remodeling factor-mediated effects. Clinical risk factors for thrombolysis-related cerebral hemorrhage include type of intervention, stroke severity, post-thrombolysis blood pressure, concurrent use of antithrombotic agents and time to symptom onset. Recently, it has been shown that damage associated molecular patterns (DAMPs) released by neurons after the neuronal cell death can lead to inflammation in the brain injury region and elevates secondary injury. This is also considered as one of the main factors for HT. 6 Imaging risk factors for HT may be detected on MRI and CT, especially perfusion imaging and include: hyperdense MCA sign, extent of admission CT hypodensity or DWI abnormality, very low cerebral blood volume(vlCBV) and changes in blood–brain barrier permeability (BBBP).
Classification of Hemorrhagic Transformation
The European cooperative acute stroke study (ECASS II) classifies HT into four subtypes (Table 1; Figure 1). 7 Hemorrhagic infarction type 1 (HI1) manifests as small hyperdense petechiae occupying less than one third of the ischemic territory. Hemorrhagic infarction type 2 (HI2) is a more confluent hyperdensity throughout the infarct zone involving greater than one-third of the ischemic territory but without mass effect. Parenchymal hematoma type 1 (PH1) is a homogeneous hyperdensity occupying <30% of the infarct zone with mass effect while parenchymal hematoma type 2 (PH2) is a homogeneous hyperdensity occupying >30% of the infarct zone with significant mass effect.
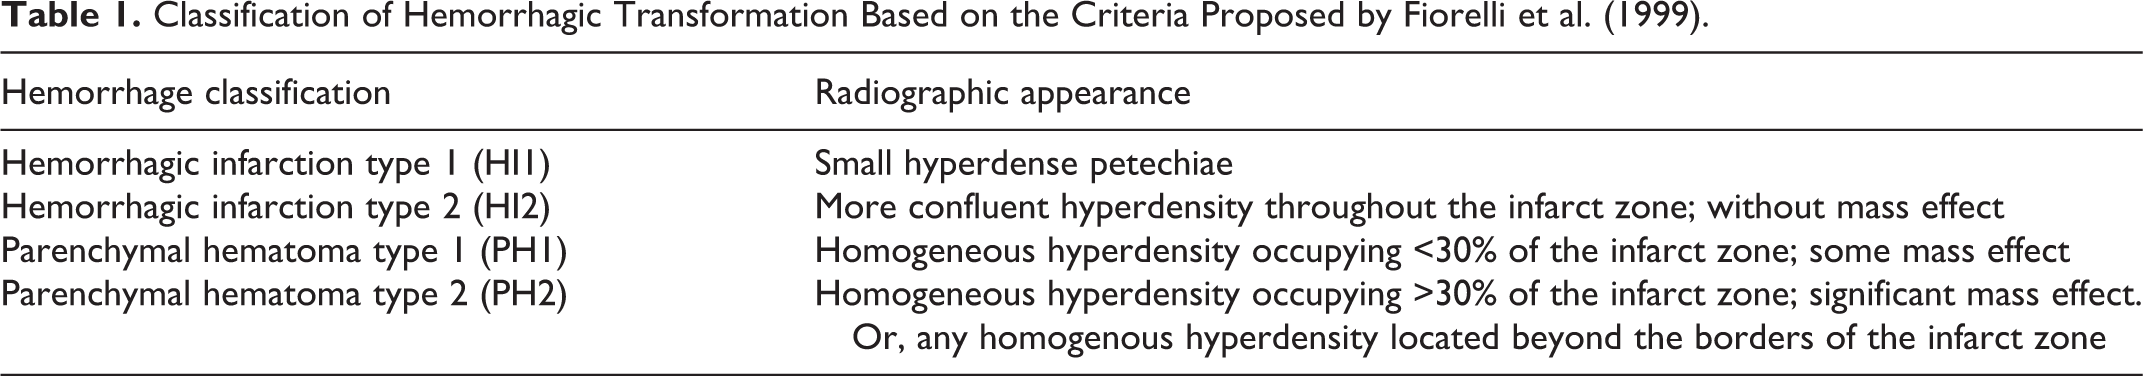
Classification of Hemorrhagic Transformation Based on the Criteria Proposed by Fiorelli et al. (1999).
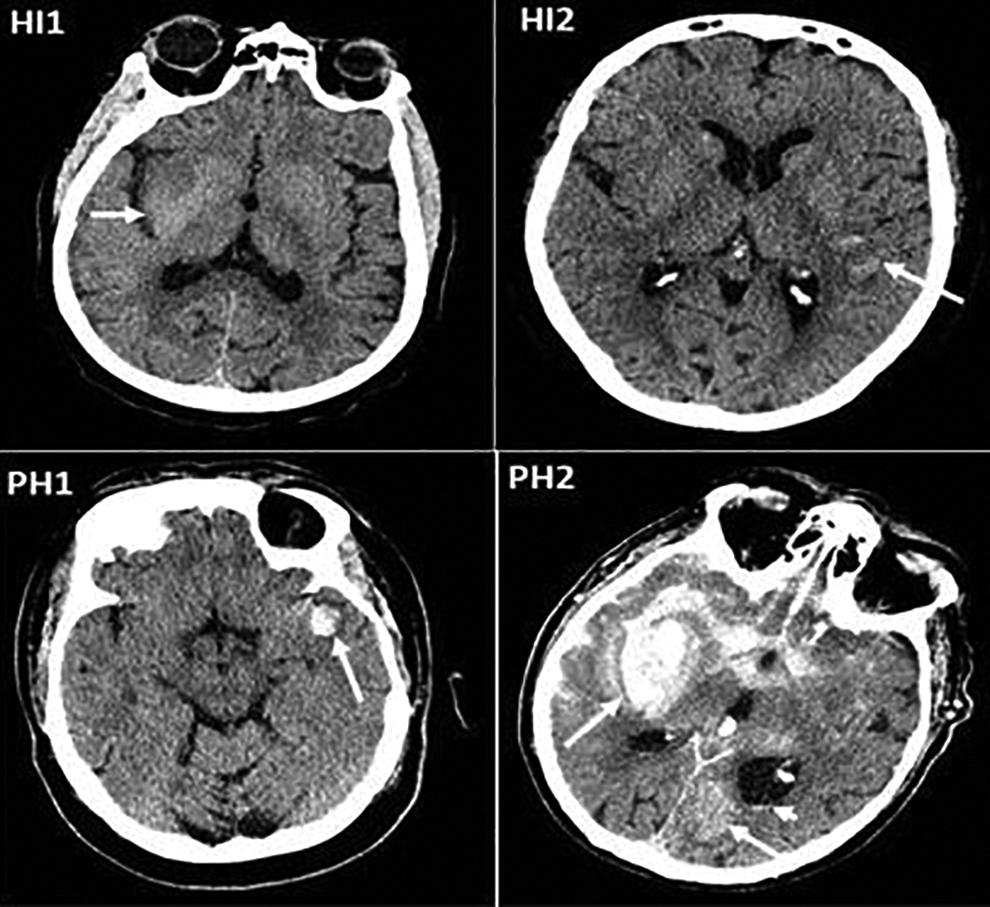
Representation of four subtypes of hemorrhagic transformation on plain CT head. Clockwise from top left; White arrow showing HI1, small hyperdense petechiae in the right basal ganglia region; HI2 manifest as more confluent hyperdensity in the left MCA territory infarct, without mass effect; PH1 with homogeneous hyperdensity occupying <30% of the infarct zone with some mass effect; and PH2 homogeneous hyperdensity occupying >30% of the infarct zone with significant mass effect. Additional homogenous hyperdensity located in the contralateral occipital lobe (arrow), subarachnoid and intraventricular hemorrhage (arrowhead).
Since the different types of HT may not relate with patient’s clinical presentation, many studies characterize HT simply as symptomatic and asymptomatic. The most utilized definition of symptomatic intracranial hemorrhage (SICH) is a ≥4-point deterioration on the National Institute of Health Stroke Scale with causation attributed to hemorrhage on imaging at around 24 hours. 8
Incidence and Consequences
Study by Horning and colleagues showed radiographic evidence of any HT in 43% (28/65) of cases of AIS followed prospectively with serial computed tomography (CT) imaging for 4 weeks. 9 In another study by Okada et al, authors reported any HT in 40.6% (65/160) of AIS patients followed prospectively with serial imaging. 10 There is an increase in HT rates as the time between stroke onset and vessel recanalization increases.11,12
Goyal et al performed meta analysis of individual patients from five endovascular thrombectomy randomized trails 13 including patient level data of 1287 patients. Endovascular thrombectomy (EVT) significantly reduced disability at 90 days when compared to controls. The risk of parenchymal hematoma was 5.1% for EVT and 5.3% for the control population with symptomatic intracranial hemorrhage in 4.4% for EVT and 4.3% for control population. 13
The DAWN study enrolled 206 patients within 6-24 hours of onset of stroke symptoms, with 107 assigned to EVT. 14 The rate of symptomatic intracranial hemorrhage did not differ significantly between groups (6% in thrombectomy group and 3% in control group, P = 0.50). In the DEFUSE III study EVT treated patients within a 6-16 hrs window 15 demonstrated no significant difference compared to the control group for symptomatic intracranial hemorrhage (7% versus 4% respectively, P = 0.75). 15 Both studies demonstrated a lack of association between time of stroke onset to EVT and risk of HT.
Natural History of Hemorrhagic Transformation
In a small study, it was found that within the first week after AIS onset, HT was more likely to be PH2-type and were symptomatic. HTs occurring later in time after AIS onset, were more likely to be HI1, HI2, or PH1. 9 In a post hoc analysis of ECASS-I study, PH2-type HT was found to be a significant predictor of neurological deterioration (odds ratio 32.3; 95% CI 13.4-77.7) and of 3 month mortality (odds ratio 18.0; 95% CI 8.1-40.1), whereas HI1, HI2, and PH1 were not associated with either increased morbidity or mortality. 7 However, poor functional outcome (modified Rankin Scale score ≥3) at 90 days was observed in both HI (odds ratio 2.23; 95% CI 1.53-3.25), p < 0.0001) and PH (odds ratio 6.24; 95% CI 3.06-12.75, p < 0.0001). Only PH type HT was associated with higher mortality (odds ratio 3.53; 95% CI 2.19-5.68, p < 0.0001). 16
In the Third International Stroke Trial (IST-3) authors determined the effect of IV alteplase on the ischemic brain lesion at 24-48 hours after ischemic stroke. 17 Authors assessed CT or brain MRI at baseline (pretreatment) and 24 to 48 hours posttreatment for acute lesion visibility, extent, and swelling, masked to all other data. They analyzed associations between treatment allocation, change in brain tissue appearances between baseline and follow-up imaging, and 6-month functional outcome. Of 3,035 patients recruited in IST-3, 2,916 had baseline and follow-up brain imaging. Progression in either lesion extent or swelling independently predicted poorer 6-month outcome (adjusted odds ratio [OR] = 0.92, 95% confidence interval [CI] 0.88-0.96, p < 0.001; OR = 0.73, 95% CI 0.66-0.79, p < 0.001, respectively). Patients allocated alteplase were less likely than controls to develop increased lesion visibility at follow-up (OR = 0.77, 95% CI 0.67-0.89, p < 0.001), but there was no evidence that alteplase reduced progression of lesion extent or swelling. 17 From their results authors concluded that alteplase is associated with reduced short-term progression in lesion visibility.
In another study authors tested the efficacy and safety of alteplase administered between 3 and 4.5 hours after the onset of a stroke. 12 They enrolled a total of 821 patients in the study and randomly assigned 418 to the alteplase group and 403 to the placebo group. The median time for the administration of alteplase was 3 hours 59 minutes. More patients had a favorable outcome with alteplase than with placebo (52.4% vs. 45.2%; odds ratio, 1.34; 95% confidence interval [CI], 1.02 to 1.76; P = 0.04). In the global analysis, the outcome was also improved with alteplase as compared with placebo (odds ratio, 1.28; 95% CI, 1.00 to 1.65; P < 0.05). The incidence of intracranial hemorrhage was higher with alteplase than with placebo (for any intracranial hemorrhage, 27.0% vs. 17.6%; P = 0.001; for symptomatic intracranial hemorrhage, 2.4% vs. 0.2%; P = 0.008). Mortality did not differ significantly between the alteplase and placebo groups (7.7% and 8.4%, respectively; P = 0.68). There was no significant difference in the rate of other serious adverse events. 12 From their results authors concluded that as compared with placebo, intravenous alteplase administered between 3 and 4.5 hours after the onset of symptoms significantly improved clinical outcomes in patients with acute ischemic stroke; alteplase is more frequently associated with symptomatic intracranial hemorrhage.
Imaging for Prediction of Hemorrhagic Transformation
Several imaging techniques are used for the prediction of HT. They include non-contrast CT, CT Angiography, CT perfusion and MRI. Most imaging signs are described for patients undergoing intravenous thrombolytic treatment (IVT) with limited data on imaging predictors of HT in patients undergoing EVT.
Non-Contrast CT
Hyperdense middle cerebral artery sign (HMCAS) is a radiological predictor for HT. In a study of 182 consecutive patients treated with IVT, HMCAS was an independent risk factor of HT in multivariate analysis (adjusted odds ratio = 2.691, 95% CI: 1.231-5.882, p = 0.013). 18
Presence and extent of baseline CT hypodensity, thought to represent cytotoxic edema has also been associated with ICH after IVT. 19 Early CT hypodensity <1/3 (OR 3.17, 95% CI 1.42 to 7.04) and >1/3 of MCA territory (OR 9.38, 95% CI 3.68 to 23.90) emerged in one study as independent predictors of SICH after IVT. 20 In a study of 118 patients undergoing IVT, the degree of NCCT hypoattenuation in the ischemic region was graded depending whether hypoattenuation was subtle (grade 1), similar to that of contralateral white matter (grade 2), or less than that of contralateral white matter (grade 3). NCCT hypoattenuation was significantly associated with PH (AUC 0.69; 95% CI 0.61-0.77) 21 (Figure 2).
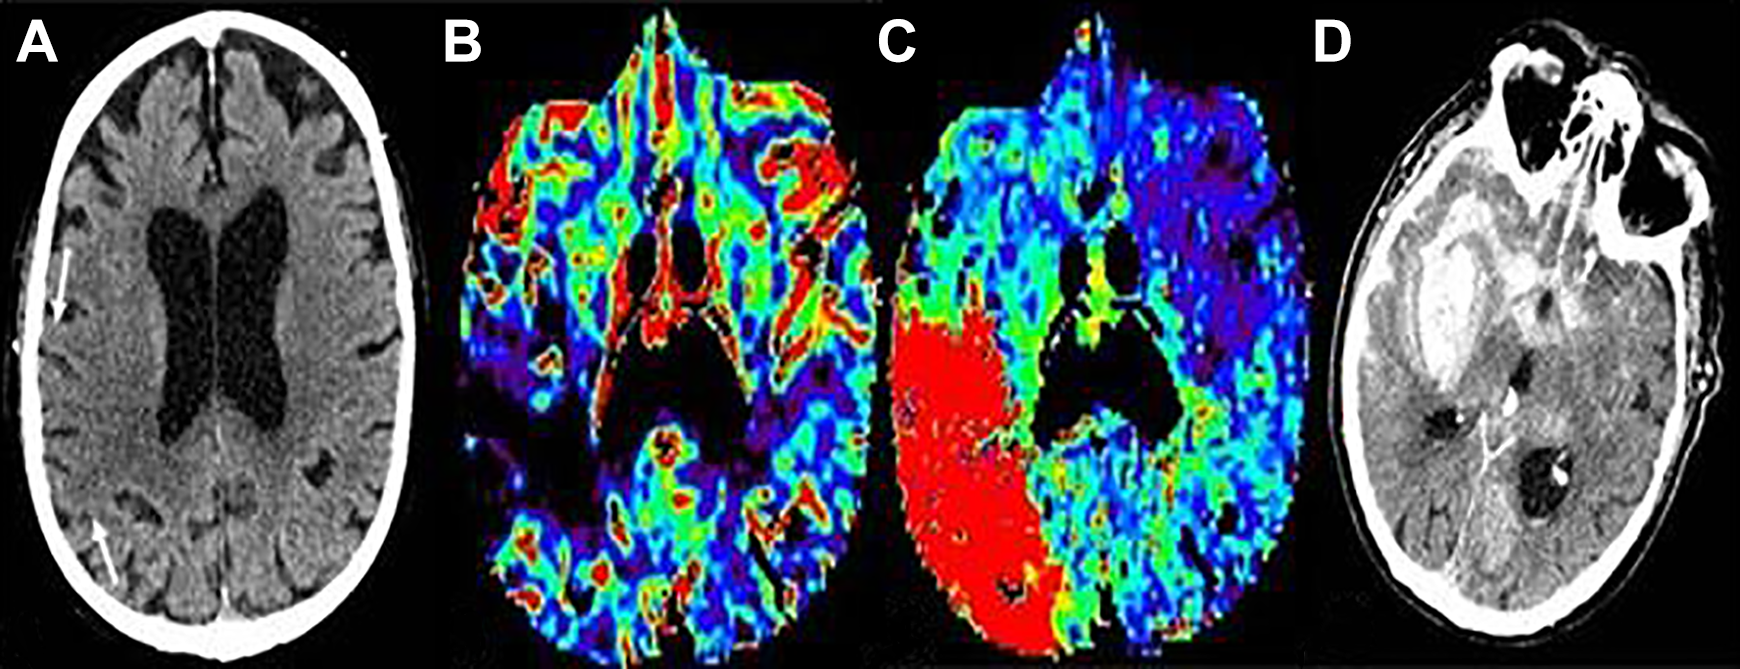
Hemorrhagic transformation in patient with acute right MCA territory ischemic stroke. (A) Arrows showing grade 1 hypodensity on the plain head CT, (B) demonstrates corresponding very low CBV in the area of hypoattenuation with prolonged Tmax (C). (D) PH2 type hemorrhagic transformation manifest as homogeneous hyperdensity occupying >30% of the infarct zone and significant mass effect. Subarachnoid hemorrhage is also seen with the basal cisterns, right MCA fissure and overlying right greater than left sulci.
Several studies have evaluated postthrombectomy brain parenchymal hyperdensity on dual energy CT. A retrospective study reported that a maximum absolute iodine concentration of >1.35 mg/mL identifies patients developing HT with 100% sensitivity and 67.6% specificity. 22 Because absolute iodine concentration varies with patient height, weight, cardiac output, renal function, contrast concentration and volume administered, and scan technique, a relative rather than absolute value may be more optimal. A study measuring relative iodine density between the superior sagittal sinus and the ischemic region in patients with contrast staining, demonstrated that a relative iodine value of 100% was associated with a 94.7% sensitivity, 43.4% specificity, and a likelihood ratio of 1.7 for HT. 23
CT Angiography
A post-hoc analysis of MR CLEAN (Multicenter Randomized Clinical Trial of Endovascular Treatment for Acute Ischemic Stroke in the Netherlands) included 478 patients who were randomized to endovascular therapy (EVT) or control group. HT occurred in 222 or 46% with HI in 66% and PH in 34%. SICH was present in 35 patients or 7.3%. HT was significantly associated with an absent/poor collateral score (OR 1.88; 95% CI 1.04-3.39). 24
Qi et al demonstrated that poor collateral circulation (OR 16.348; 95% CI 3.02-88.39; P = 0.001) and proximal MCA-M1 occlusion (OR, 4.06; 95% CI, 1.02-16.21; P = 0.047) were independently associated with elevated deep MCA territory permeability surface area product (PS) on multivariate analysis. 25
Digital Subtraction Angiography
In one of the recent study authors pointed out that digital subtraction angiography (DSA) could predict HT. 26 In this study authors prospectively analyzed 35 patients with AIS due to cardioembolism. Ischemic lesions were scored by MRI with diffusion weighted imaging (DWI). Blood flow analysis was evaluated MRI with ASL. Early venous filling was assessed by DSA. Their results have shown that early venous filling is observed in 22 of 35 (66%) patients after reperfusion therapy. There is a significant correlation between early venous filling and DWI-ASPECTS (6.2 vs 8.8, p = 0.0003), outcome (5 vs 9, p = 0.006), hyperperfusion (17 vs 1, p < 0.0001), and HT (17 vs 1, p = 0.005). 26 This comprehensive study revealed that early venous filling after reperfusion therapy is associated with postoperative hyperperfusion. Early venous filling may be a marker of the process of hyperperfusion, leading to hemorrhage and an unfavorable outcome. Detection of early venous filling may be an important finding on DSA for subsequent intensive perioperative management. 26
CT Perfusion
Several studies have demonstrated that CT perfusion can be used to predict HT risk in AIS. A recent meta-analysis included a total of 808 patients reviewed CT perfusion performance for HT prediction which was seen in 30.2% of the included cohort. As expected, there was significant heterogeneity in perfusion variables assessed among the different studies. Pooled analysis revealed a sensitivity and specificity of 85.9% and 73.9%, a negative predictive value (NPV) of 92.9%, a positive predictive value (PPV) of 19.8% and an accuracy of 67.4% for SICH prediction. 27 The most important perfusion parameters that can predict HT include high BBB permeability (i.e. BBBP > 7 ml/100 g/min; mean PSvol. 0.23 ml/100 g/min; PSinfarct vol. 0.84 ml/100 g/min; rPScore = 1.12); acute severe hypoperfusion (i.e. CBV < 0.5 ml/100 g; rCBV = 1.09; rCBF < 0.48; Tmax > 14 s; rMTT.1.3; TTP 0.27 s). 27
In a study of 43 patients receiving tPA and any HT occurring in 23 (53%), admission CT perfusion-derived PS maps discriminated between patients who subsequently developed HT. 28 Mean PS for the HT group was 0.49 mL/min/100 g and was significantly higher than for the non-HT group, 0.09 mL/min/100 g (P < 0.0001) (Figure 3). PS (odds ratio, 3.5; 95% CI: 1.69-7.06; P .0007) and the size of hypo-attenuating area at non-enhanced admission CT (odds ratio, 0.4; 95% CI: 0.2, 0.7; P .002) were the only independent variables associated with HT at stepwise multivariate analysis. Mean area under the receiver operating characteristic (ROC) curve was 0.918 (95% CI: 0.828, 1.00). PS threshold of 0.23 mL/min/100 g had 77% sensitivity and 94% specificity for HT detection. 28 Admission PS measurements appeared promising for identifying patients with acute stroke who were likely to develop HT. 28 In a similar study of 42 patients; 15 patients with HT following thrombolytic treatment for AIS 29 demonstrated a higher mean rPS (1.71 ± 1.64 versus 1.07 ± 1.30; P = 0.003) compared to the 27 cases without. An overall rPS value of 1.3 had a 9.2 times increased likelihood of HT with a sensitivity, specificity, PPV and NPV to predict HT of 71.4, 78.6, 62.5 and 84.6 respectively. The volume of permeability abnormality or high permeability region size (HPrs) on CT perfusion predicts HT after IVT in stroke. 30 In a study of 156 patients with HT in 37 patients (23.7%) and PH-2 in 12 patients (7.7%), the NPV of HPrs at a threshold of 7mL/100g/min was 0.84 for HT and 0.93 for PH-2. HPrs-PCT at 7mL/100g/min threshold combined with platelets and baseline NIHSS score best predicted HT with an AUC of 0.77. HPrs was the only independent predictor of PH-2 (odds ratio 1, AUC 0.68, p = 0.045).
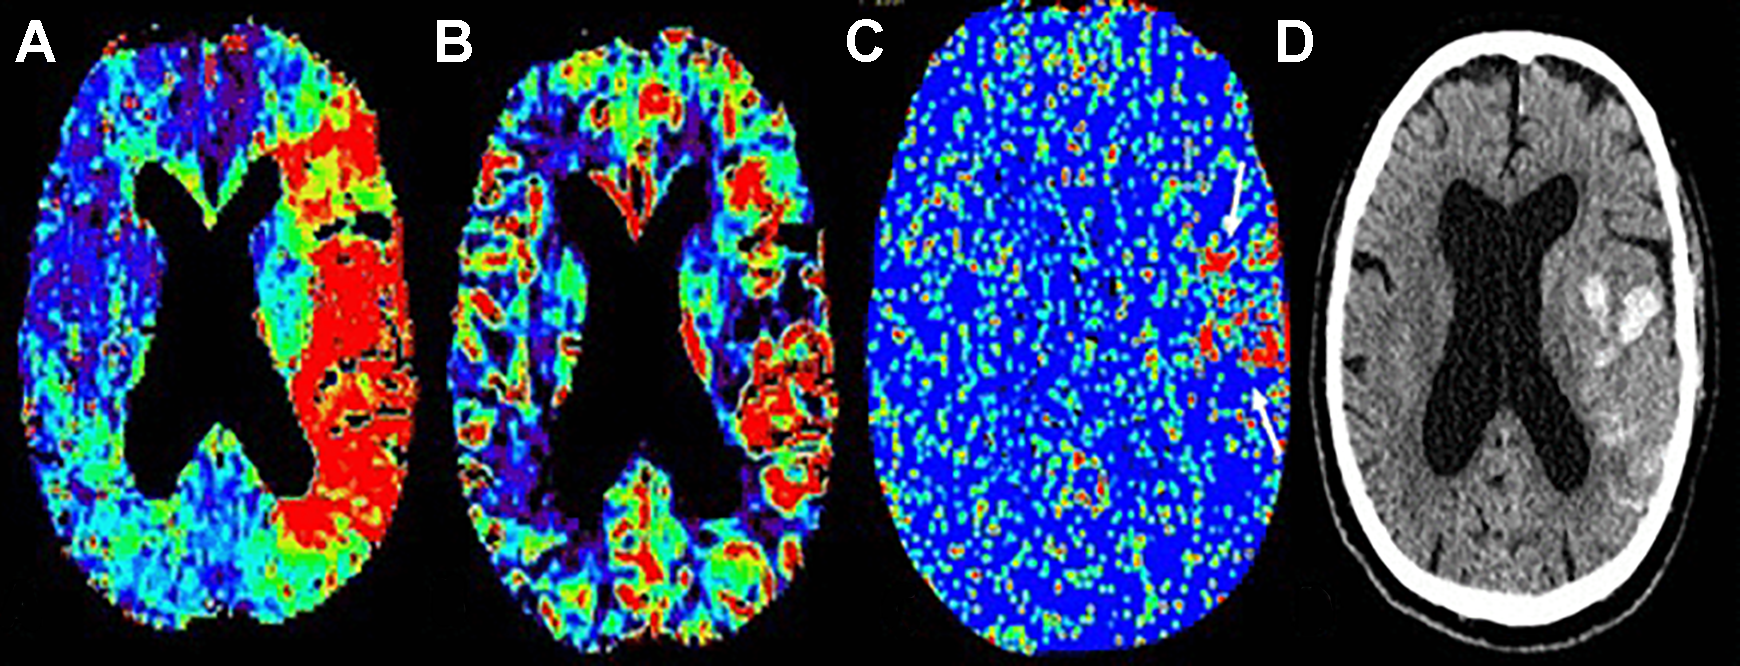
Example of very low CBV and increased permeability surface area product map in a patient with hemorrhagic transformation. (A) Shows increased left MCA territory Tmax, (B) Demonstrates a frontal opercula region of very low CBV, (C) Increased permeability corresponds with the area of very low CBV on permeability surface area product map (White arrows), (D) PH1 type hemorrhagic transformation on 24 hour non contrast CT head study.
Horsch et al. retrospectively evaluated 545 patients from the Dutch acute stroke study treated with IVT and/or intra-arterial thrombolysis. A model-based method to estimate permeability by fitting a mathematical tissue response model using non-linear regression to describe the attenuation curves obtained from the extended acquisition was used to estimate the blood–brain barrier PS. In univariate analyses, PS and CBV scored using ASPECTS were predictive of HT risk (OR 2.22, 95% CI 1.46-3.37 and OR 1.26, 95% CI 1.14-1.38 respectively). However, in multi-variate analysis neither parameter improved HT prediction over clinical variables of age and admission NIHSS score. 31 Similarly, in a separate study, absolute and relative PS in the deep MCA territory in 14 patients with PH type 1 or 2 with AIS were significantly different than non HT patients (odds ratio 67.89; 95% CI 7.87-585.94; P < 0.0001) in univariate analysis but failed to reach significance in multivariate analysis. 25
Relative vlCBV applied to CT in a study of 118 patients receiving IVT demonstrated association between rvlCBV and PH (P = 0.04) (Figure 2). A model including white matter derived rvlCBV and grade of hypoattenuation better predicted PH (AUC 0.73; 95% CI 0.63-0.83) than a model of gray-matter derived perfusion factors. PS was not associated with HT. 21
Yassi and colleagues investigated the optimal CTP parameter to predict cerebral parenchymal hematoma in acute ischemic stroke. 32 Out of 132 patients, 70 were treated with thrombolysis, and 14 (10.6%) developed PH on follow-up imaging. Receiver operating characteristic analysis revealed that Tmax >14 s (area under the curve = 0.748; P = 0.002) and relative cerebral blood flow <30% of contralateral mean (area under the curve = 0.689, P = 0.021) are the optimal thresholds, and the Bayesian information criterion (+2.6) indicated that Tmax was more strongly associated with PH than relative cerebral blood flow. Tmax >14 s volumes of >5 mL allowed prediction of PH with sensitivity of 79%, specificity of 68%, and negative likelihood ratio of 3.16. Tmax >14 s volume and thrombolysis were both independently predictive of PH in a multivariate logistic regression model (P < 0.05). Authors concluded that Tmax >14 s is most strongly associated with PH. 32
In a recent meta analysis authors investigated the diagnostic performance of CT perfusion for prediction of HT in acute ischemic stroke. 33 They conducted computerized literature search of various databases including Ovid MEDLINE and EMBASE. Their results pointed out that high blood–brain barrier and hypoperfusion status derived from CT perfusion are associated with HT. The pooled sensitivity and specificity were 84% (95% CI, 71-91%) and 74% (95% CI, 67-81%), respectively. The area under the hierarchical summary receiver operating characteristic curve was 0.84 (95% CI, 0.81-0.87). 33 From their results authors concluded that although various CT perfusion parameters have been used across studies the evidence supports the use of CT perfusion to predict HT in acute ischemic stroke.
Bevard and coworkers examined the diagnostic utility of existing predictors of any HT and compare them with new perfusion imaging permeability measures in ischemic stroke patients receiving alteplase only. 34 Total of 1407 patients from 5 different centers were included in this study. The cohort was split into a derivation cohort (1,025, 70% patients) and a validation cohort (382 patients or 30%). The extraction fraction (E) permeability map at a threshold of 30% relative to contralateral had the highest AUC at predicting any HT (derivation AUC 0.85, 95% confidence interval [CI], 0.79-0.91; validation AUC 0.84, 95% CI 0.77-0.91). The AUC improved when permeability was assessed within the acute perfusion lesion for the E maps at a threshold of 30% (derivation AUC 0.91, 95% CI 0.86-0.95; validation AUC 0.89, 95% CI 0.86-0.95). Previously proposed associations with HT and parenchymal hematoma showed lower AUC values than the permeability measure. From their results authors concluded that they have validated a highly accurate measure of HT prediction. This measure might be useful in clinical practice to predict hemorrhagic transformation in ischemic stroke patients before receiving alteplase alone. 34
In one of the recent studies authors evaluated outcome and safety of endovascular treatment beyond 6 hours of onset of ischemic stroke due to large vessel occlusion in the anterior circulation, in routine clinical practice. From the Italian Registry of Endovascular Thrombectomy, authors extracted clinical and outcome data of patients treated for stroke of known onset beyond 6 hours. 35 Patients were selected on individual basis by a combination of CT perfusion mismatch (difference between total hypoperfusion and infarct core sizes) and CT collateral score. The primary outcome measure was the score on modified Rankin Scale at 90 days. Safety outcomes were 90-day mortality and the occurrence of symptomatic intracranial hemorrhage. Data were compared with those from patients treated within 6 hours. Out of 3057 patients, 327 were treated beyond 6 hours. The most frequent site of occlusion was middle cerebral artery (45.1%). Functional independence (90-day modified Rankin Scale score, 0-2) was achieved by 41.3% of cases. Symptomatic intracranial hemorrhage occurred in 6.7% of patients, and 3-month case fatality rate was 17.1%. The probability of surviving with modified Rankin Scale score, 0-2 (odds ratio, 0.58 [95% CI, 0.43-0.77]) was significantly lower in patients treated beyond 6 hours as compared with patients treated earlier. No differences were found regarding recanalization rates and safety outcomes between patients treated within and beyond 6 hours. There were no differences in outcome between people treated 6-12 hours from onset (278 patients) and those treated 12 to 24 hours from onset (49 patients). 35 From the results of their study authors suggests that in patients with large vessel occlusion selected on the basis of CT perfusion and collateral circulation assessment, endovascular treatment beyond 6 hours is feasible and safe with no increase in symptomatic intracranial hemorrhage.
In another recent study authors aimed to determine the outcome and predictors of good outcome in AIS patients undergoing EVT with unknown-onset, or late presentation, stroke after 6 h from time last seen well, or witnessed stroke onset, at two Australian comprehensive stroke centers. 36
A retrospective analysis of functional outcome and mortality at 90-days from a prospective cohort of 56 consecutive patients with unknown-onset, or late presentation, stroke with large vessel occlusion in the anterior cerebral circulation undergoing EVT over a 15-month period (2016-2017). They evaluated factors which correlated with good functional outcome defined as a 90-day modified Rankin scale (mRS) 0-2. Recanalization times and symptomatic intracranial hemorrhage (sICH) rates were also examined in their study. A good functional outcome was achieved in 35 patients (62%). Eight patients died (14%). Median time-to-recanalization was 7.6 h. SICH occurred in four patients (7%). Factors which predicted good 90-day functional outcome included baseline National Institutes of Health Stroke Scale (NIHSS) < 16, 24 h NIHSS < 10, baseline Alberta Stroke Program Early CT Score (ASPECTS) ≥ 8, pre-procedural CT perfusion imaging and LVO lesion location. 36 This study shows good “real world” outcomes, comparable to published RCTs, in patients with unknown-onset, or late presentation, stroke treated with EVT more than 6 h from stroke onset.
MRI
In one study authors analyzed whether MRI can help in predicting HT. 37 Authors examined retrospectively 55 patients with acute ischemic stroke who underwent gadolinium-enhanced MR imaging within 6 hours of symptom onset and follow-up MRI within 72 hours. They looked in to determine whether the lesion volumes on diffusion-weighted imaging (DWI), apparent diffusion coefficient (ADC) values, and early parenchymal enhancement is predictive of HT and to investigate the mechanism of the enhancement. According to their results nineteen (34.5%) patients had HT (14 with hemorrhagic infarction, five with parenchymal hematoma). Patients with HT had decreased mean ADCs and large lesion volumes on DWI, but differences were not significant (P > .05). HT occurred in five patients (100%) with parenchymal enhancement, which corresponded to the site of HT. In enhancing lesions, the ADC ratio (0.76 ± 0.06) was slightly higher and the delay in time to peak (0.10 ± 2.79) was less than respective values in the rest of the ischemic lesion (0.66 ± 0.06 and 8.79 ± 4.86, respectively; P = .068. 37 Based on their results authors concluded that early parenchymal enhancement is highly specific for HT and may be associated with early reperfusion and damage to the blood–brain barrier in ischemic tissue. 37
MRI-DWI
In a study of 74 patients prospectively enrolled in an open-label study of IVT administered between 3 and 6 hrs after stroke onset, 38 DWI lesion volume was the single independent baseline predictor of SICH (odds ratio 1.42; 95% CI 1.13-1.78 per 10 mL increase in DWI lesion volume). When early reperfusion status was included in the predictive model, the interaction between DWI lesion volume and reperfusion status was the only independent predictor of SICH (odds ratio 1.77; 95% CI 1.25-2.50 per 10 mL increase in DWI lesion volume). Patients with large baseline DWI lesion volumes who achieved early reperfusion were at greatest risk of SICH after IVT. 38 However MRI is not a routine imaging technique at baseline for acute ischemic stroke in most centers.
In another study of 97 patients treated with IVT, 39 patients with PH has larger DWI lesion volumes (63.1 ± 56.1 mL) than those without HT (27.6 ± 39.0 mL, P = 0.033). The risk of PH was higher with larger DWI lesion volumes (OR = 1.16 per 10 mL; 95% CI, 1.03-1.30). In the EPITHET (The Echoplanar Imaging Thrombolytic Evaluation Trial) study, 91/100 patients had baseline PWI and DWI scans and follow-up imaging (MRI or CT). Very low cerebral blood volume (VLCBV), defined as cerebral blood volume <2.5th percentile of brain contralateral to the infarct, predicted HT better than DWI lesion volume and thresholded ADC lesion volume in ROC analysis and logistic regression. 40 A VLCBV of <2 mL had 100% sensitivity for PH and, in patients treated with tPA, defined a population with a 43% risk of PH (95% CI, 23%-66%, likelihood ratio = 16). When applied to the DEFUSE (Diffusion and Perfusion Imaging Evaluation for Understanding Stroke Evolution) dataset, the <2 mL VLCBV threshold predicted PH with 100% sensitivity, 72% specificity, 35% PPV and 100% NPV. Applied to both EPITHET and DEFUSE, regression models using VLCBV (p < 0.001) and tPA (p = 0.02) predicted PH independent of clinical factors better than models using DWI or Tmax >8 sec lesion volumes. 41
MRI is very useful in detecting cerebral microbleeds, particularly on the susceptibility weighted images. Presence of microbleed on pre-treatment MRI predicts hemorrhage and clinical outcome in patients with acute ischemic stroke. In a recent study, IVT in patients with >10 CMBs significantly increased the odds of mortality. 42 Since the cerebral microbleeds are rare occurrence, doing MRI to rule this out before IVT can only be justified if MRI could be done in less than 10 minutes. This is not practical in most institutions at the present time but could become reality in the future.
MRI-ASL
In one study authors evaluated relationship between HT and post reperfusion hyperperfusion using pulsed arterial spin labeling perfusion MRI and 123I-iodoamphetamine single-photon emission-computed tomography. 43 According to their findings patients who developed HT showed significantly higher cerebral blood flow in the affected lesion after thrombolysis and/or endovascular intervention. Focal hyperperfusion (ipsilateral to contralateral ratio >1.5) was associated with hemorrhagic transformation after reperfusion (odds ratio, 9.3; 95% confidence interval, 1.4-64.0). Their findings suggest that post-reperfusion hyperperfusion on Arterial Spin Labeling (ASL) could represent a reliable marker of HT. 43
In another study authors investigated the relationship between hyperperfusion and HT in acute ischemic stroke using ASL. They looked at a total of 361 ASL scans collected from 221 consecutive patients with middle cerebral artery stroke. 44 From their results authors showed that hyperperfusion was more frequently detected posttreatment (odds ratio (OR) = 4.8, 95% confidence interval (CI) 2.5 to 8.9, P < 0.001) and with high National Institutes of Health Stroke Scale (NIHSS) scores at admission (P < 0.001). There was a significant association between having hyperperfusion at any time point and HT (OR = 3.5, 95% CI 2.0 to 6.3, P < 0.001). There was a positive relationship between the grade of HT and time-hyperperfusion with the Spearman’s rank correlation of 0.44 (P = 0.003). Authors concluded that ASL hyperperfusion may provide an imaging marker of HT, which may guide the management of AIS patients post tissue-type plasminogen activator (tPA) and/or endovascular treatments. 44 Table 2 summarizes all the imaging modalities used in this review to describe HT.
Imaging Modalities Used for Predicting HT.
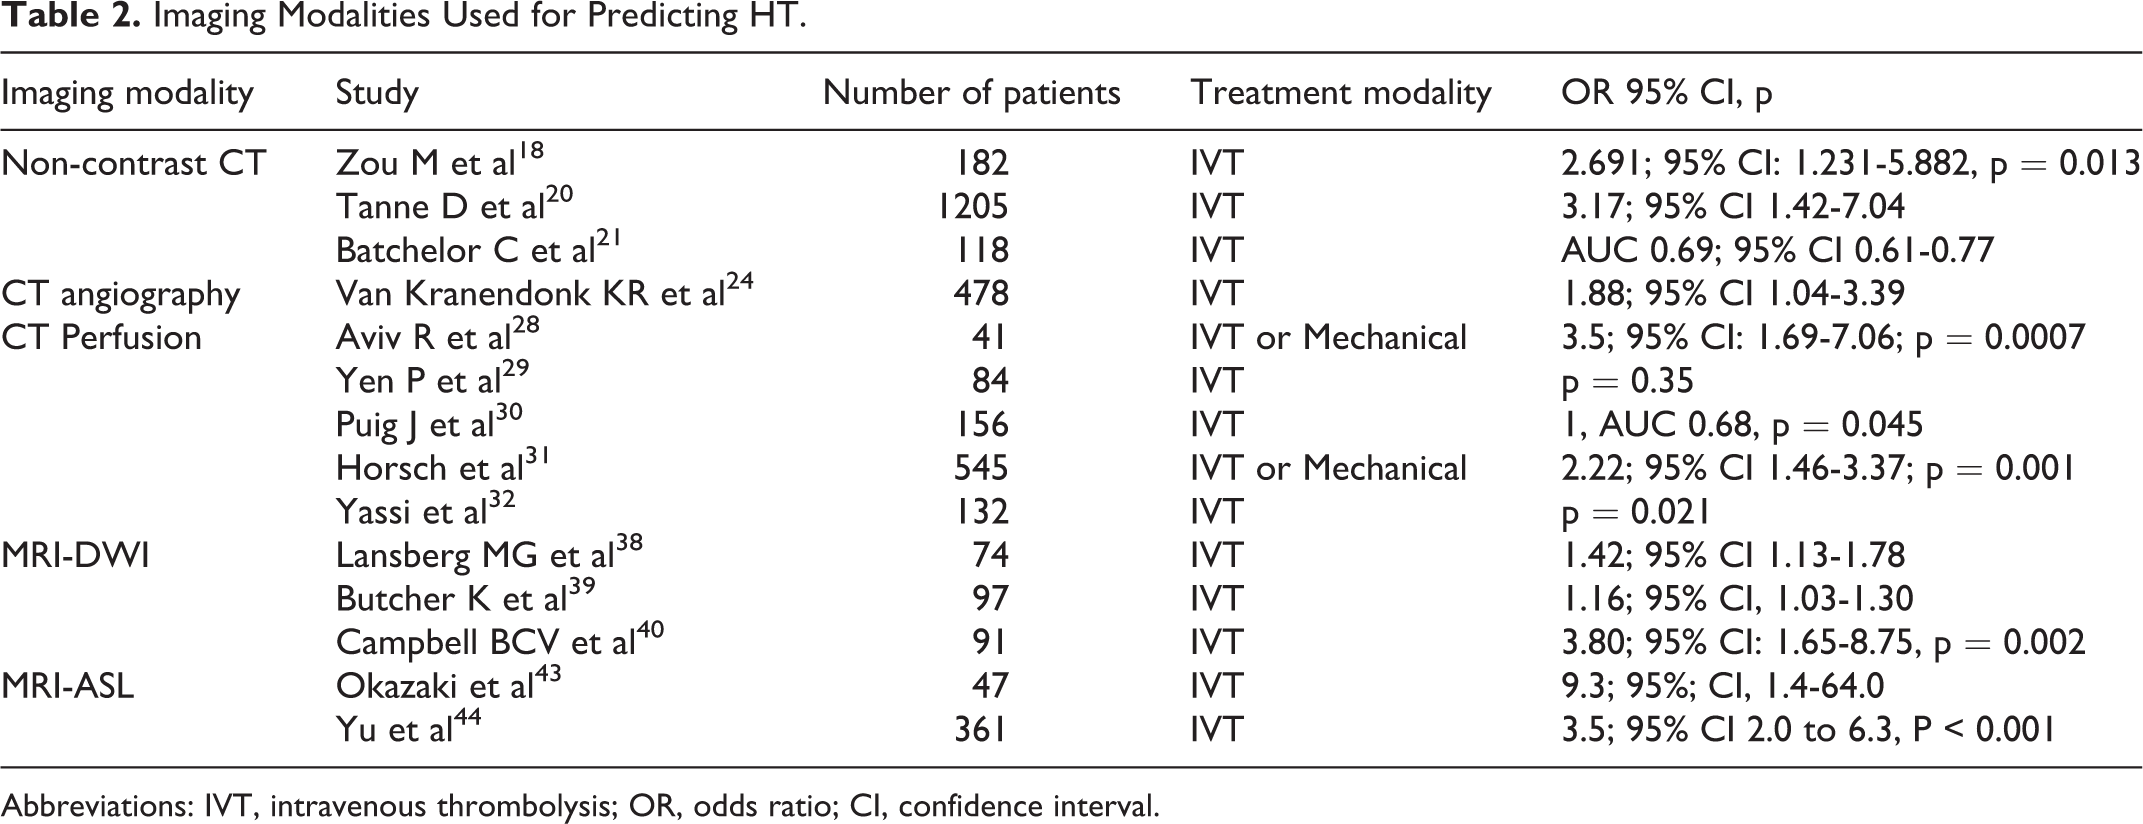
Abbreviations: IVT, intravenous thrombolysis; OR, odds ratio; CI, confidence interval.
Conclusions
Intracranial hemorrhage is a feared complication of reperfusion therapy after AIS and although relatively infrequent, is not infrequently associated with worse clinical outcomes. Baseline CT and MRI imaging parameters show promise at predicting future HT and theoretically may be of value to modulate anticipated therapeutic intervention. However, simple reliance on imaging parameters is currently insufficient and more studies are required to assess clinical and imaging risk factors. Also, there is a signal that imaging may help determine which patients will have HT and we need larger trials to show if imaging can predict HT by leveraging certain clinical features.
Footnotes
Declaration of Conflicting Interests
The author(s) declared no potential conflicts of interest with respect to the research, authorship, and/or publication of this article.
Funding
The author(s) received no financial support for the research, authorship, and/or publication of this article.