
Abstract
From the late sixteenth century, shipping in the Baltic Sea region experienced profound changes. The rising maritime powers – the Dutch Republic and Great Britain – penetrated the area and the old Hanseatic masters seem to have been relegated to a passive role. These changes are illuminated in the Sound Toll Registers but, in contrast, Baltic archival sources are so fragmentary and imperfect that it is not known how much traditional Baltic shipping was affected. Fortunately, there are printed sources – newspapers that also published shipping news. One such newspaper was the Lübeckische Anzeigen, which contained shipping lists for the city's port from the early 1750s. As Lübeck was still overwhelmingly oriented to the Baltic, this source can offer a different view from the Sound Toll Registers. It also suggests that this was not a period of stagnation for Lübeck shipping but that, in comparison with other national merchant fleets, it faired moderately well.
I
It is common knowledge that the economic structures of the Baltic Sea region experienced profound changes in the early modern period. The focus of change was the sea itself: the old Hanseatic Mediterranean was increasingly penetrated by western European merchants and seafarers. Already in the early seventeenth century, the Dutch dominated shipping through the Danish Sound but, in the following century, they were challenged and finally overwhelmed by the British. Compared to these dynamic newcomers, the old masters – the Hanseatic ports – seem to have been relegated to a somewhat passive role.
That such long-term developments can be traced reliably – and even in detail – is to the credit of extraordinary source material: the Danish Sound Toll Registers. 1 However, their ability to produce an overall picture of Baltic shipping has obvious limitations: shipping that never passed Elsinore (Helsingör) remains, by definition, beyond its bright spotlight. Moreover, few shipping sources of similar quality can be found in local Baltic archives; those that have been preserved are often fragmentary or contain wide gaps. Thus, it is no surprise that our knowledge of what happened in the Baltic is scant. Moreover, the bulk of the existing research concerns the seventeenth century, while the following 100 years have been scarcely studied. 2 It is also obvious that this meagre stock of knowledge cannot be rapidly multiplied .
Fortunately, the traditional archival material can be supplemented by print sources. As early as the seventeenth century, newspapers were being published in major cities in the Dutch Republic, England and a few German states. Gradually, this innovation spread to Baltic seaports and, most importantly, newspapers started to publish shipping news, such as lists of ships visiting their harbours. Recently, I studied St. Petersburg shipping by using the shipping data published in the St. Petersburgische Zeitung from 1744 and, in spite of it containing only the most basic information, it seemed to substantially complement the respective Sound Toll data. Thus, it was concluded that, depending on the decade, between 26 and 37 per cent of all arrivals at Kronstadt came from Baltic ports, and 20–31 per cent of the respective departures were heading to Baltic ports. Moreover, it became obvious that import cargoes from German and Prussian ports could at times match those from the Netherlands and Britain. On the other hand, the data also confirmed the established picture of growing British dominance, in particular as far as exports were concerned.
St. Petersburg was one of the principal terminals in the networks between western Europe and the Baltic world. Therefore, the data could not relay much about the traditional Hanseatic world of shipping. In this respect, another large Baltic port, Lübeck, is far more interesting. Not only was it the old ‘queen’ of the Hansa but, still in the mid eighteenth century, its shipping was remarkably little affected by Dutch and British dominance. Although the city also maintained connections with French and Iberian wine and salt ports, it seems that the best part of Lübeck's shipping was confined to the Baltic world. 3 Accordingly, the development of its maritime trades could tell us quite a lot about Baltic shipping in general.
There are two sources in the Lübeck city archives in which important data on eighteenth-century shipping can be found: the Zulagezoll (‘additional duty’) records and the ‘customs books’ of the Novgorodfahrer guild (which were both used by Elisabeth Harder-Gersdorff in her studies of Lübeck's trade). 4 They contain detailed data on ships and their cargoes and, for rich data, can be compared to the Sound Toll records. Both, however, have serious shortcomings. The Novgorodfahrer records (of course) only concern trade with Russian Gulf of Finland ports (Reval (Tallin), Narva and St. Petersburg) and the Zulagezoll series has large chronological gaps – for the eighteenth century, records can (with a few exceptions) only be found every 10 years (1750–1751, 1760, 1770, 1780, and so on).
Fortunately, Lübeck also had a newspaper that printed ship lists for its port. The Lübeckische Anzeigen was founded in 1751 and complete lists of all arrivals and departures could be found in its pages from 1754; the data continued unbroken for the remainder of the century and beyond. 5 Accordingly, it covers the whole latter half of the eighteenth century. The downside of good chronological coverage, however, is that the lists offer extremely scant information: only the names of the shipmasters and the ports of departure or arrival were published. As far as the ships themselves are concerned, the data is, in fact, no worse than the Sound Toll Registers, which recorded neither the ships’ names nor their sizes – however, the latter give the skippers’ nationalities, which the Lübeck lists do not. An even bigger drawback is that no information on cargo can be found – not even whether the ships were loaded or in ballast. Compared to the Sound Toll Registers and the Lübeck customs data, these ship lists can be regarded as secondary-level sources, and one may question if its meaningful to exploit and process such suboptimal data.
The big advantage of these ship lists is their impeccable coverage. With annual figures for ship passages, the powerful fluctuations of shipping can be charted across decades with similar precision to using the Sound Toll data. Strictly speaking, such series only tell of visiting frequencies; as sources of trade volumes, they are crude and inaccurate. Yet, even the number of ships is quite valuable information, not just as an end in itself but also for further research. Supposing that, in the future, a more ambitious study of Lübecan shipping were to be undertaken. Exploiting the Zulagezoll records, it would be valuable to know whether the few years for which data is available were years of boom or decline. Ship lists are also perfectly adequate sources to determine the geographical distribution of traffic, the relative importance of different directions in shipping networks, and respective structural changes. Moreover, ship lists, being quite simple sources with only two variables (plus the time dimension), are easy and ‘economical’ to work with. The results will have obvious limitations, but such an overview may still be regarded as a worthwhile pilot study for more in-depth research.
II
In the eighteenth century, Lübeck was an important outlet for German products to the entire Baltic area. Via the Elbe and Stecknitz Canal, manufacturing and handicraft products from Saxony, Hessen and other regions of the interior, as well as wine from southern Germany and even France, could easily reach its port. Even so-called ‘colonial goods’ were imported directly from western Europe, as well as from Copenhagen; they were also routed via Hamburg, thus avoiding the Sound Toll. 6 Accordingly, it is no wonder that Lübeck was a busy port. The total number of arrivals and departures fluctuated from around 600 to 800 a year in the 1750s, and rose to around 1,000 in the following decades. However, these total numbers are, in a sense, misleading as they also included hundreds of small vessels and boats from the coasts of Mecklenburg, Schleswig and Holstein, as well as the Danish islands. 7 Most of them carried farm produce, firewood and fish to the city; similar local trade also took place in the environs of Copenhagen and Stockholm. Their numbers fluctuated between 250 and 400, but were occasionally higher, and normally accounted for a third of the port’s total figures. 8 However, their small cargoes cannot have represented a significant fraction of the wider commodity flows and neither could their voyages by any definition be regarded as real Baltic-scale shipping.
In order to maintain the focus on Baltic shipping proper and longer trades, the statistics in this study have been calculated by discounting coastal trade. For practical purposes, ‘coastal’ was defined as traffic in the area from Rostock (inclusive) to the coasts of Holstein and Schleswig, the Danish islands and eastern Jutland, as well as German river and canal traffic, and traffic through the Schleswig-Holstein (Eider) Canal. Of all the Danish ports, only Copenhagen, a major supplier of sugar, coffee and tea for Lübeck, and Elsinore, at the crossroads of North Sea and Baltic shipping, were included. 9 Yet this, as are so many dichotomous divisions, is to some degree arbitrary. Thus, Bornholm has been classified as among the Danish islands in spite of it being located farther away from Lübeck than a number of South Swedish towns. On the other hand, small Scanian ports were included in the Swedish numbers, although their trade could be classified in the same category as the Danish islands. It may also seem strange that three old Hanseatic towns – Rostock, Wismar and Kiel – have been excluded, in spite of their vessels also sailing in long trades. Still, traffic between these towns and Lübeck was without doubt short-range and coastal. A finer classification is unfortunately impossible since no data on ship sizes or cargoes is available. 10
The series of ship lists would make it possible to extend the study a long way into the nineteenth century. However, the great upheavals around the turn of the century changed not only the political but also the economic environment to such a degree that they can be regarded as a natural end point for this study. The French Revolutionary Wars were having an indirect impact on Baltic shipping as early as the 1790s and, in the following decade, actual war reached the German coasts. In November 1806, French troops occupied Lübeck and, soon afterwards, Napoleon proclaimed the continental blockade, which forbade all trade and communication with Britain and its allies. It was a fatal blow to Lübeck's shipping; still, in 1807, some trade was possible with Russian and Prussian ports, but when the British navy blockaded Russian ports, only coastal shipping was possible. Thus, 1806 marked the dramatic end of an era.
The Lübeck ship lists provide, as already indicated, an unbroken series of data for the period from 1754 to 1806. Unlike the respective lists of the St. Petersburgische Zeitung, there are no notable gaps. The only exception is the spring of 1806 – for five weeks between 24 April and 30 May, no lists were printed – and there are also two small gaps in September and November. 11 For all the preceding years of the period, just a few weekly or half-weekly lists were found to be missing; all told, these gaps only amount to 77 days. Supposing that the average sailing season was about 270 days, this means that, for 51 years, the proportion of accumulated temporal deficit is only around 0.6%. In the few years with more gaps, the ratio is naturally higher – up to five per cent – but, overall, these deficits only marginally affect the overall reliability of the series. 12
While the coverage of the series is unusually good, there are a few problems with the actual lists. Typically, the orthography of the place names can be quite variable. This concerns the southern European names in particular, but even the Germanized forms of Danish and Swedish names are sometimes perplexing. 13 There are also a few names that cannot not be deciphered at all. Even printed texts can sometimes be unreadable because of typesetting errors, faulty printing, ink spots or faded letters. Fortunately, there are very few missing or unidentifiable place names but, of course, errors with muddled data are always possible. Overall, however, the resulting margin of error seems to be tolerably low.
One simple test of the reliability of the printed ship lists was made by comparing the numbers of ships arriving from and departing to St. Petersburg with the respective data published by Harder-Gersdorff (‘Seehandel’) in her study of Lübeck's Russian trade . In eight cases of the total of 24, the number of arrivals was exactly the same in both sources; in eight cases the Lübeckische Anzeigen's figures were slightly higher; and in eight cases they were slightly lower. The higher Lübeckische Anzeigen figures suggest that there are no errors in the ship lists and that they may only refer to arrivals in ballast (with nothing to pay for). The lower figures, on the other hand, may reveal actual faults, such as missing entries or mistakes when recording the port of departure. However, they may also result from ‘legitimate’ reasons, like voyages that did not come directly from St. Petersburg. As for departures, the Lübeckische Anzeigen's figures always exceeded those presented by Harder-Gersdorff, which merely tells us that a number of ships regularly sailed for the Russian capital in ballast. All told, the test did not cast grave doubts on the Lübeckische Anzeigen's ship lists, and this appraisal is in fact strengthened by the data for one particular year. In 1766, the port of Lübeck recorded no less than 57 arrivals from and 69 departures to St. Petersburg, while the Novgorodfahrer books only registered 38 and 21, respectively. This, however, was a year of exceptional traffic: thousands of emigrants, mainly from Hessen, sailed from Lübeck to Kronstadt, lured by Catherine II's promises of free travel and farmsteads in southern Russia. Accordingly, the ‘surplus’ vessels were loaded with emigrants and were tax-free. 14
In sum, it is evident that the ship lists, while far from being perfect in all their details, do not contain any serious faults or defects. Thus, by exploiting them, a realistic and reasonably accurate picture can be painted of the development, fluctuations and structure of Lübeck's shipping networks in the latter half of the eighteenth century.
III
In the eighteenth century, Lübeck was not a booming city, at least as far as population growth was concerned. From a low point after the Great Northern War, with less than 19,000 people, it grew only slowly, exceeding 20,000 inhabitants in 1780 and attaining 22,500 in 1807. 15 Shipping, however, remained one of the city's economic mainstays: it had a considerable fleet of its own ships and received many foreign vessels in its port. The city council tried to support these maritime interests by pursuing a systematic policy of neutrality in times of war and peace. Lübeck's status as a free imperial city gave additional diplomatic prestige to its foreign policy. 16
Indeed, shipping to and from Lübeck seems to have grown at a slightly faster rate than its population. As Figure 1 shows, its development was far from stagnant. Between 1754–1758 and 1801–1805, the average annual number of arrivals grew from around 370 to over 880, which amounts to a compound annual growth rate of about 1.5% (while that of the population was only 0.2%), and the growth rate of departures was even greater. The actual relevance of such an overall trend can, however, be questioned as the data only reveals the number of ships and nothing of their size. So far, there have only been a few studies on the development of ship sizes in eighteenth-century Baltic shipping. The most representative is Jake V. T. Knoppers’ study from the 1970s. His material consisted of several thousand arrivals at Amsterdam from the Baltic region. According to Knoppers, on-board cargoes grew moderately – thus, for example, in 1754, the average was close to 180 tons, in 1769, 196 tons and in 1789, 202 tons. 17 These figures, of course, do not apply to the port of Lübeck as such – it is obvious that average tonnages could vary from port to port according to the typical cargoes and transport distances – but at least they suggest that average tonnages did not decline but, rather, grew a little. Thus, it can be concluded that the numbers of ships do not exaggerate the actual growth of maritime transport – if anything, they may represent a degree of underestimation.
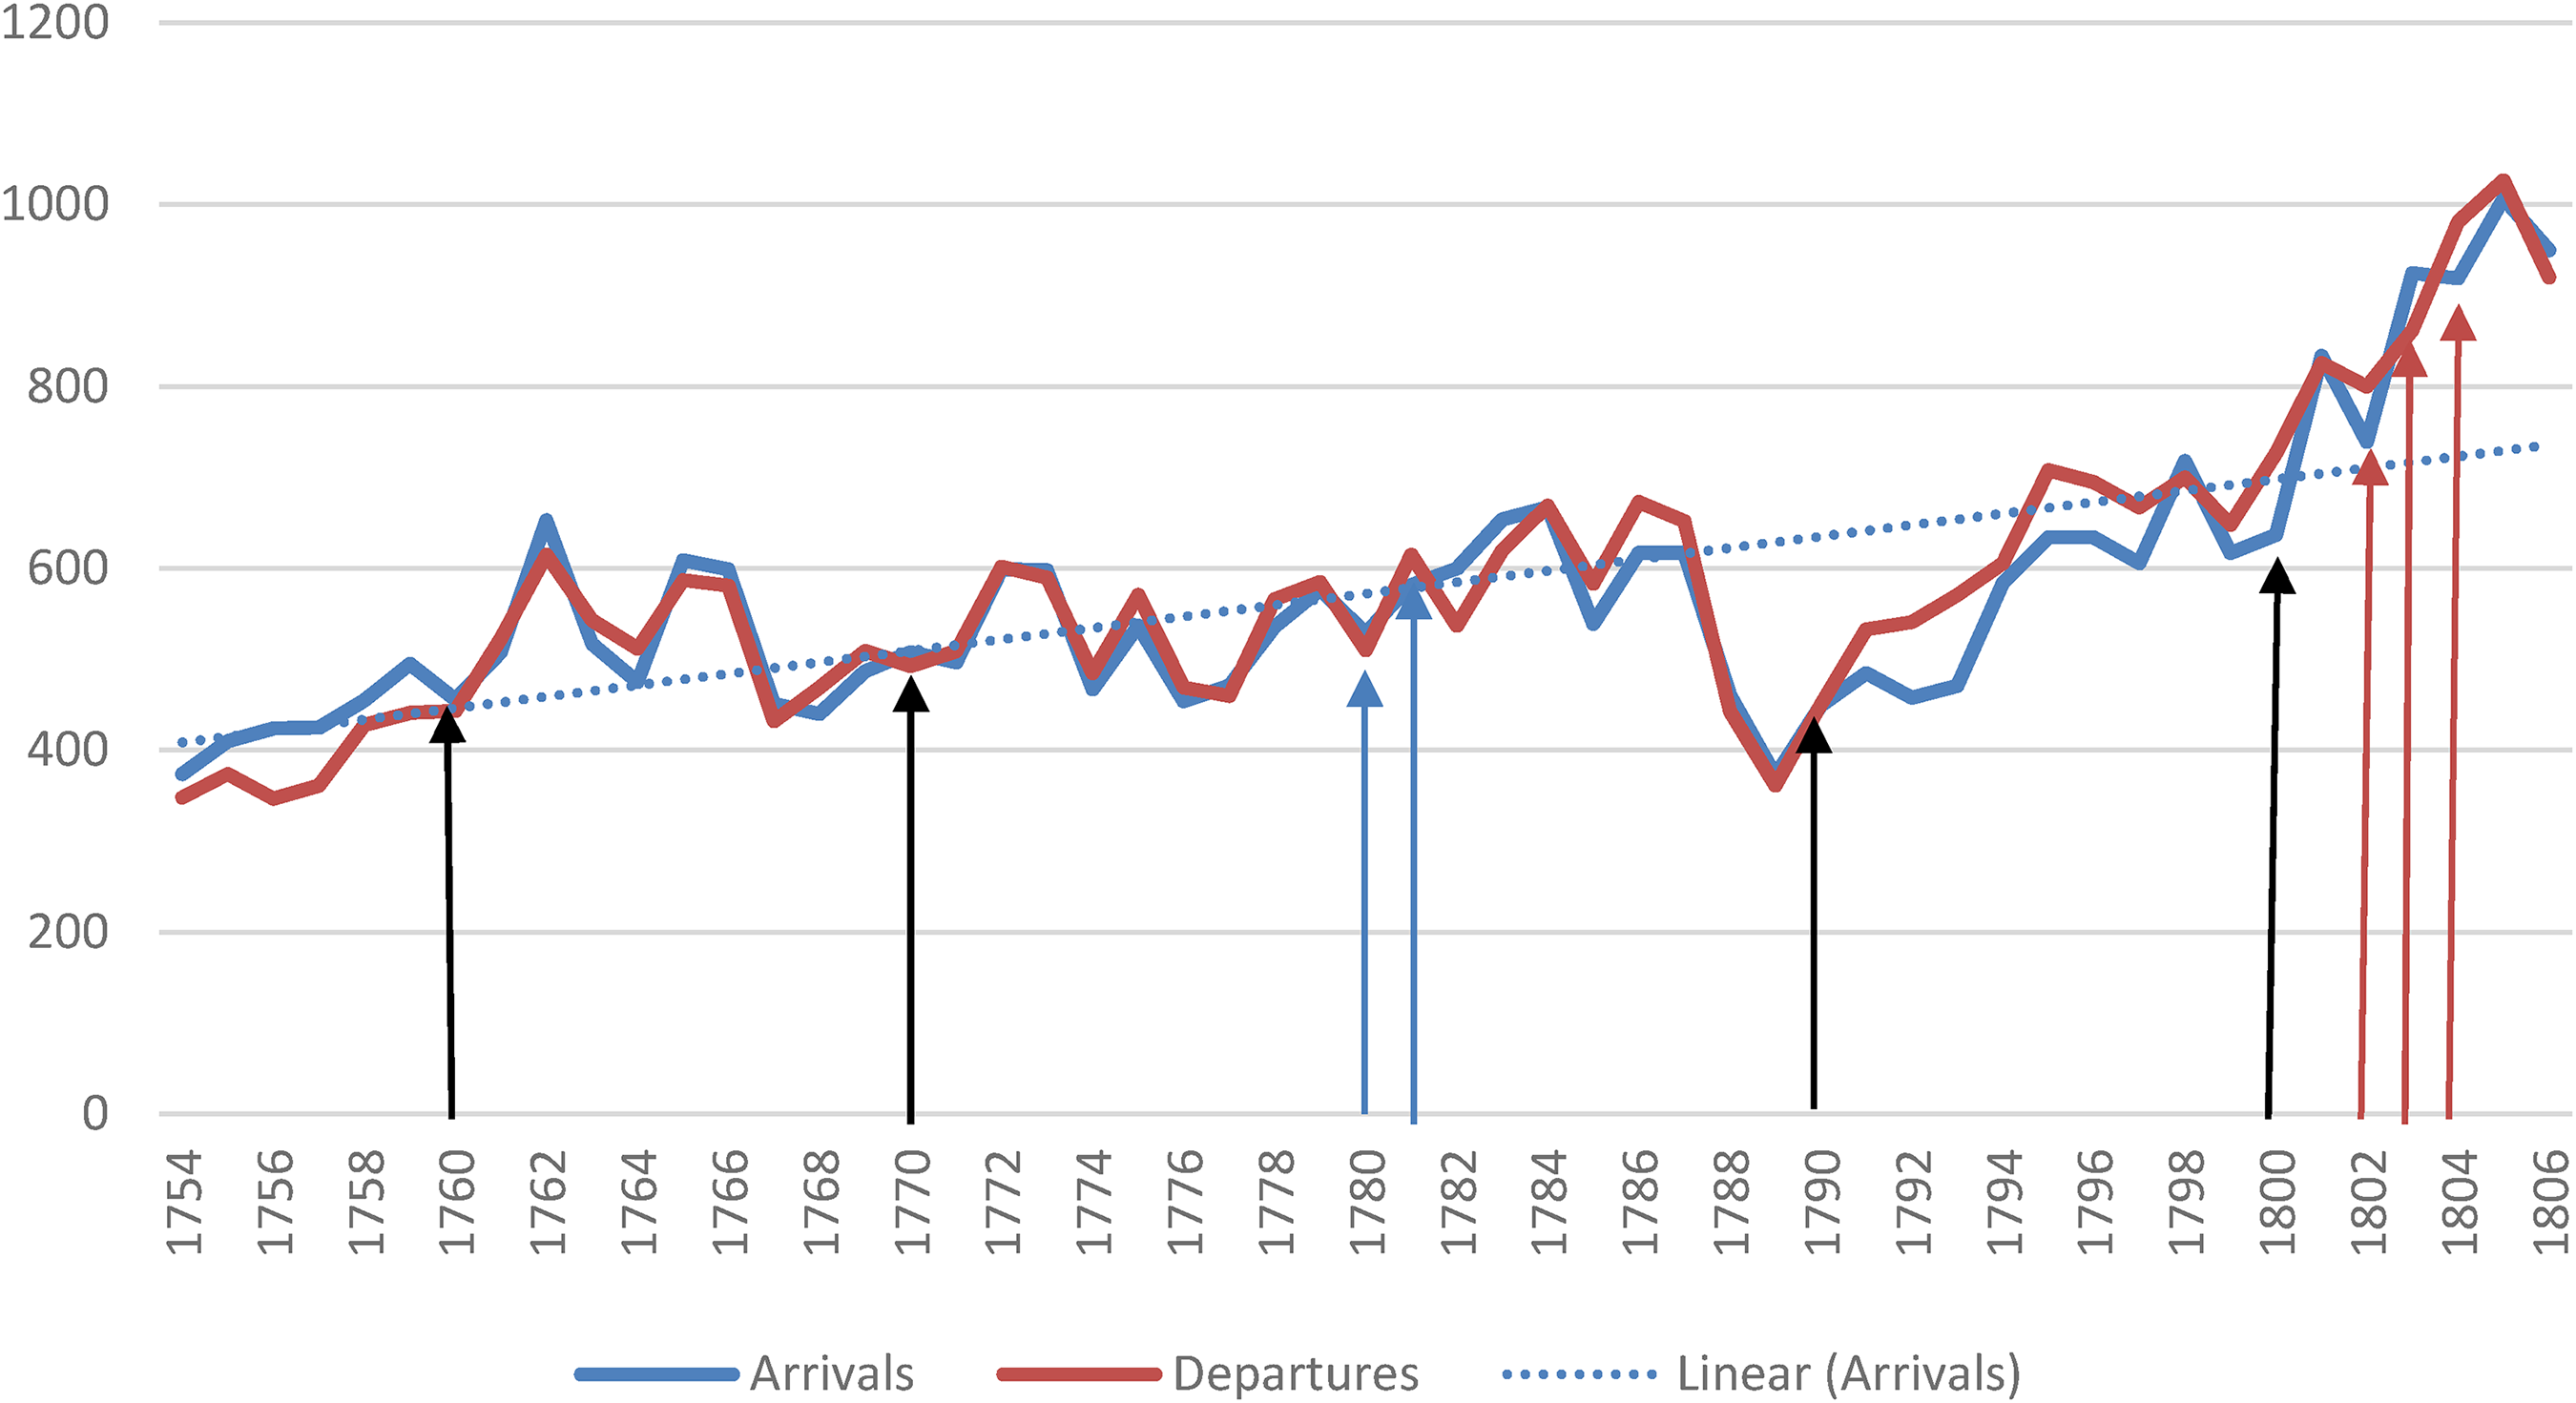
The overall development of arrivals and departures in Lübeck (excluding coastal trade), 1754–1806.
The development of Lübeck shipping was far from regular: it contained both substantial short-term fluctuations and various longer-term oscillations (indeed, if only the Zulagezoll records were available, quite a different picture would emerge). The overall long-term development seems to consist of three phases. From 1754 to 1762, there was a continuous and rather brisk rise, but this was followed by an unstable period with irregular but dramatic fluctuations. There was still a modest trend of growth but it came to an abrupt halt and there was a deep dive in 1788–1789. At its lowest point, traffic in the port of Lübeck dropped to the same levels as in the middle of the 1750s, but then the trend turned again. The last 15 years of the period were a time of rapid – indeed, accelerating – growth.
The first period of growth coincided quite closely with the Seven Years’ War. It is obvious that Lübeck benefited from its neutrality, and such gains were even bolstered by the adversities of some of its Baltic competitors. In the autumn of 1757, Russian troops conquered Memel (now Klaipeda) and, a few months later, they also took Königsberg (Kaliningrad). Even Kolberg (Kołobrzeg) was besieged by the Russians three times and finally stormed in December 1761. All three cities were returned to Prussia when Peter III became czar in January 1762, but after the devastation they had endured, their recovery took time.
The steep drop in the late 1780s also had a martial background. The Russo-Swedish War (June 1788–August 1790) affected Lübeck's shipping as both parties to the war happened to be the city's two most important trade partners . It seems remarkable that a return to normal levels took almost five years. Interestingly, Swedish shipping to Lübeck recovered more slowly than Swedish long trades to western Europe. On the other hand, the outbreak of war against revolutionary France, and in particular the British blockade of French ports in 1793, resulted in additional insecurity for international trade. 18
Even in the last period, the growth was more or less bound up with war. Lübeck was still able to maintain its neutrality after 1790, and this brought with it occasional dividends, as most maritime nations, including Russia, were involved in war. In 1795, the Dutch flag vanished from the Baltic Sea after the French Republic occupied the country and made it a client state – the Batavian Republic. It seems that Lübeck’s ships were able to fill a small part of this vacuum by carrying Baltic products to Dutch ports and increasing their intermediate trade of wine and colonial goods to the Baltic. Lübeck, as well as Hamburg, did not join the League of Armed Neutrality (1800–1801, formed by Russia, Sweden, Denmark and Prussia) and, in the spring of 1801, Prussia occupied Hanover and Danish troops invaded Hamburg and Lübeck for a short time. 19 The occupation of Hanover led to a sudden flight of ships from Hamburg to Lübeck but, irrespective of Prussian and Danish operations, the increasing transit trade in so-called ‘naval goods’ seems to have boosted Lübeck's shipping with the ports of St. Petersburg, Riga and Courland in the longer run. The peace of Amiens brought an end to this exceptional boom period but, as soon as 1803, almost the same pattern was repeated. French troops occupied Hanover in July and, soon thereafter, the ports of Hamburg, Bremen and Emden were closed to British ships. For a few years, Lübeck became the principal gateway for British goods into Germany: in 1803 and 1804, 98 and 139 British ships, respectively, arrived at its port. Even trade with Riga and other Russian ports grew substantially again. According to a much later appraisal, ‘this blooming trade brought to Lübeck a welfare hardly experienced before’. 20 The boom, however, came to a sudden halt in November 1806 when French troops stormed Lübeck.
Strong short-term fluctuations were a conspicuous feature of Lübeck's shipping. This was not unusual in the eighteenth century – similar patterns can be observed in the Kronstadt ship lists. They can, at least partly, be explained by markets that were imperfect in terms of information transmission; in such an economic environment, both production and prices tended to oscillate in the same manner as in the so-called ‘pork cycles’ . On the other hand, it has been proposed that climatic variations could have also caused substantial fluctuations, particularly in a region where ice stopped navigation in the winter. 21 Even at the latitude of Lübeck, a long winter could substantially shorten the potential time of navigation. It is, however, difficult to estimate whether climatic variations affected shipping more than business cycles. While the ship lists are able to tell us how early or late sailing seasons started and ended, we have no independent data for business trends. Across the whole period, the lists record five exceptionally cold years, with the sailing season beginning on 15 April or later and finishing around 15 December. Of these, three coincided with at least modest growth in shipping volumes and only two were years of decline. This cannot be regarded as conclusive evidence.
One interesting question remains to be discussed: How good was the development of Lübeck shipping compared to the general trends in Baltic trades? For such an analysis, we have a good yardstick: the overall number of passages through the Sound. Between 1754–1758 and 1801–1805, the average number of westward and eastward passages increased from over 2,550 to almost 5,600; these figures yield almost the same compound annual growth rate (1.7%) as Lübeck’s arrivals (1.6%). 22 The exponential trends in Figure 2, however, present a slightly bigger difference, but the similarity can still be regarded as tolerably good. On the other hand, Figure 2 shows that periodical differences were substantial; not surprisingly, these differences correspond with the three phases of development presented above. Thus, while Lübeck shipping fared quite well during the Seven Years’ War, traffic through the Sound was at lower levels than before or after the war. From the early 1760s to the mid 1780s, traffic in Lübeck, again, grew much more slowly than that through the Sound. 23 A closer inspection also reveals that the respective short-term fluctuations were often contrary to each other (for example, in 1762–1763, 1766–1767, 1773–1774 and 1777–1779). Interestingly, even the hard winters of 1784–1786 affected Lübeck shipping differently than shipping through the Sound. As for the effects of the Russo-Swedish War, it can be clearly seen that, not surprisingly, it reduced traffic in Lübeck much more than Baltic shipping in general. Finally, it is equally evident that traffic through the Sound stagnated after the outbreak of the French Revolutionary Wars, while a new period of strong growth started for Lübeck.
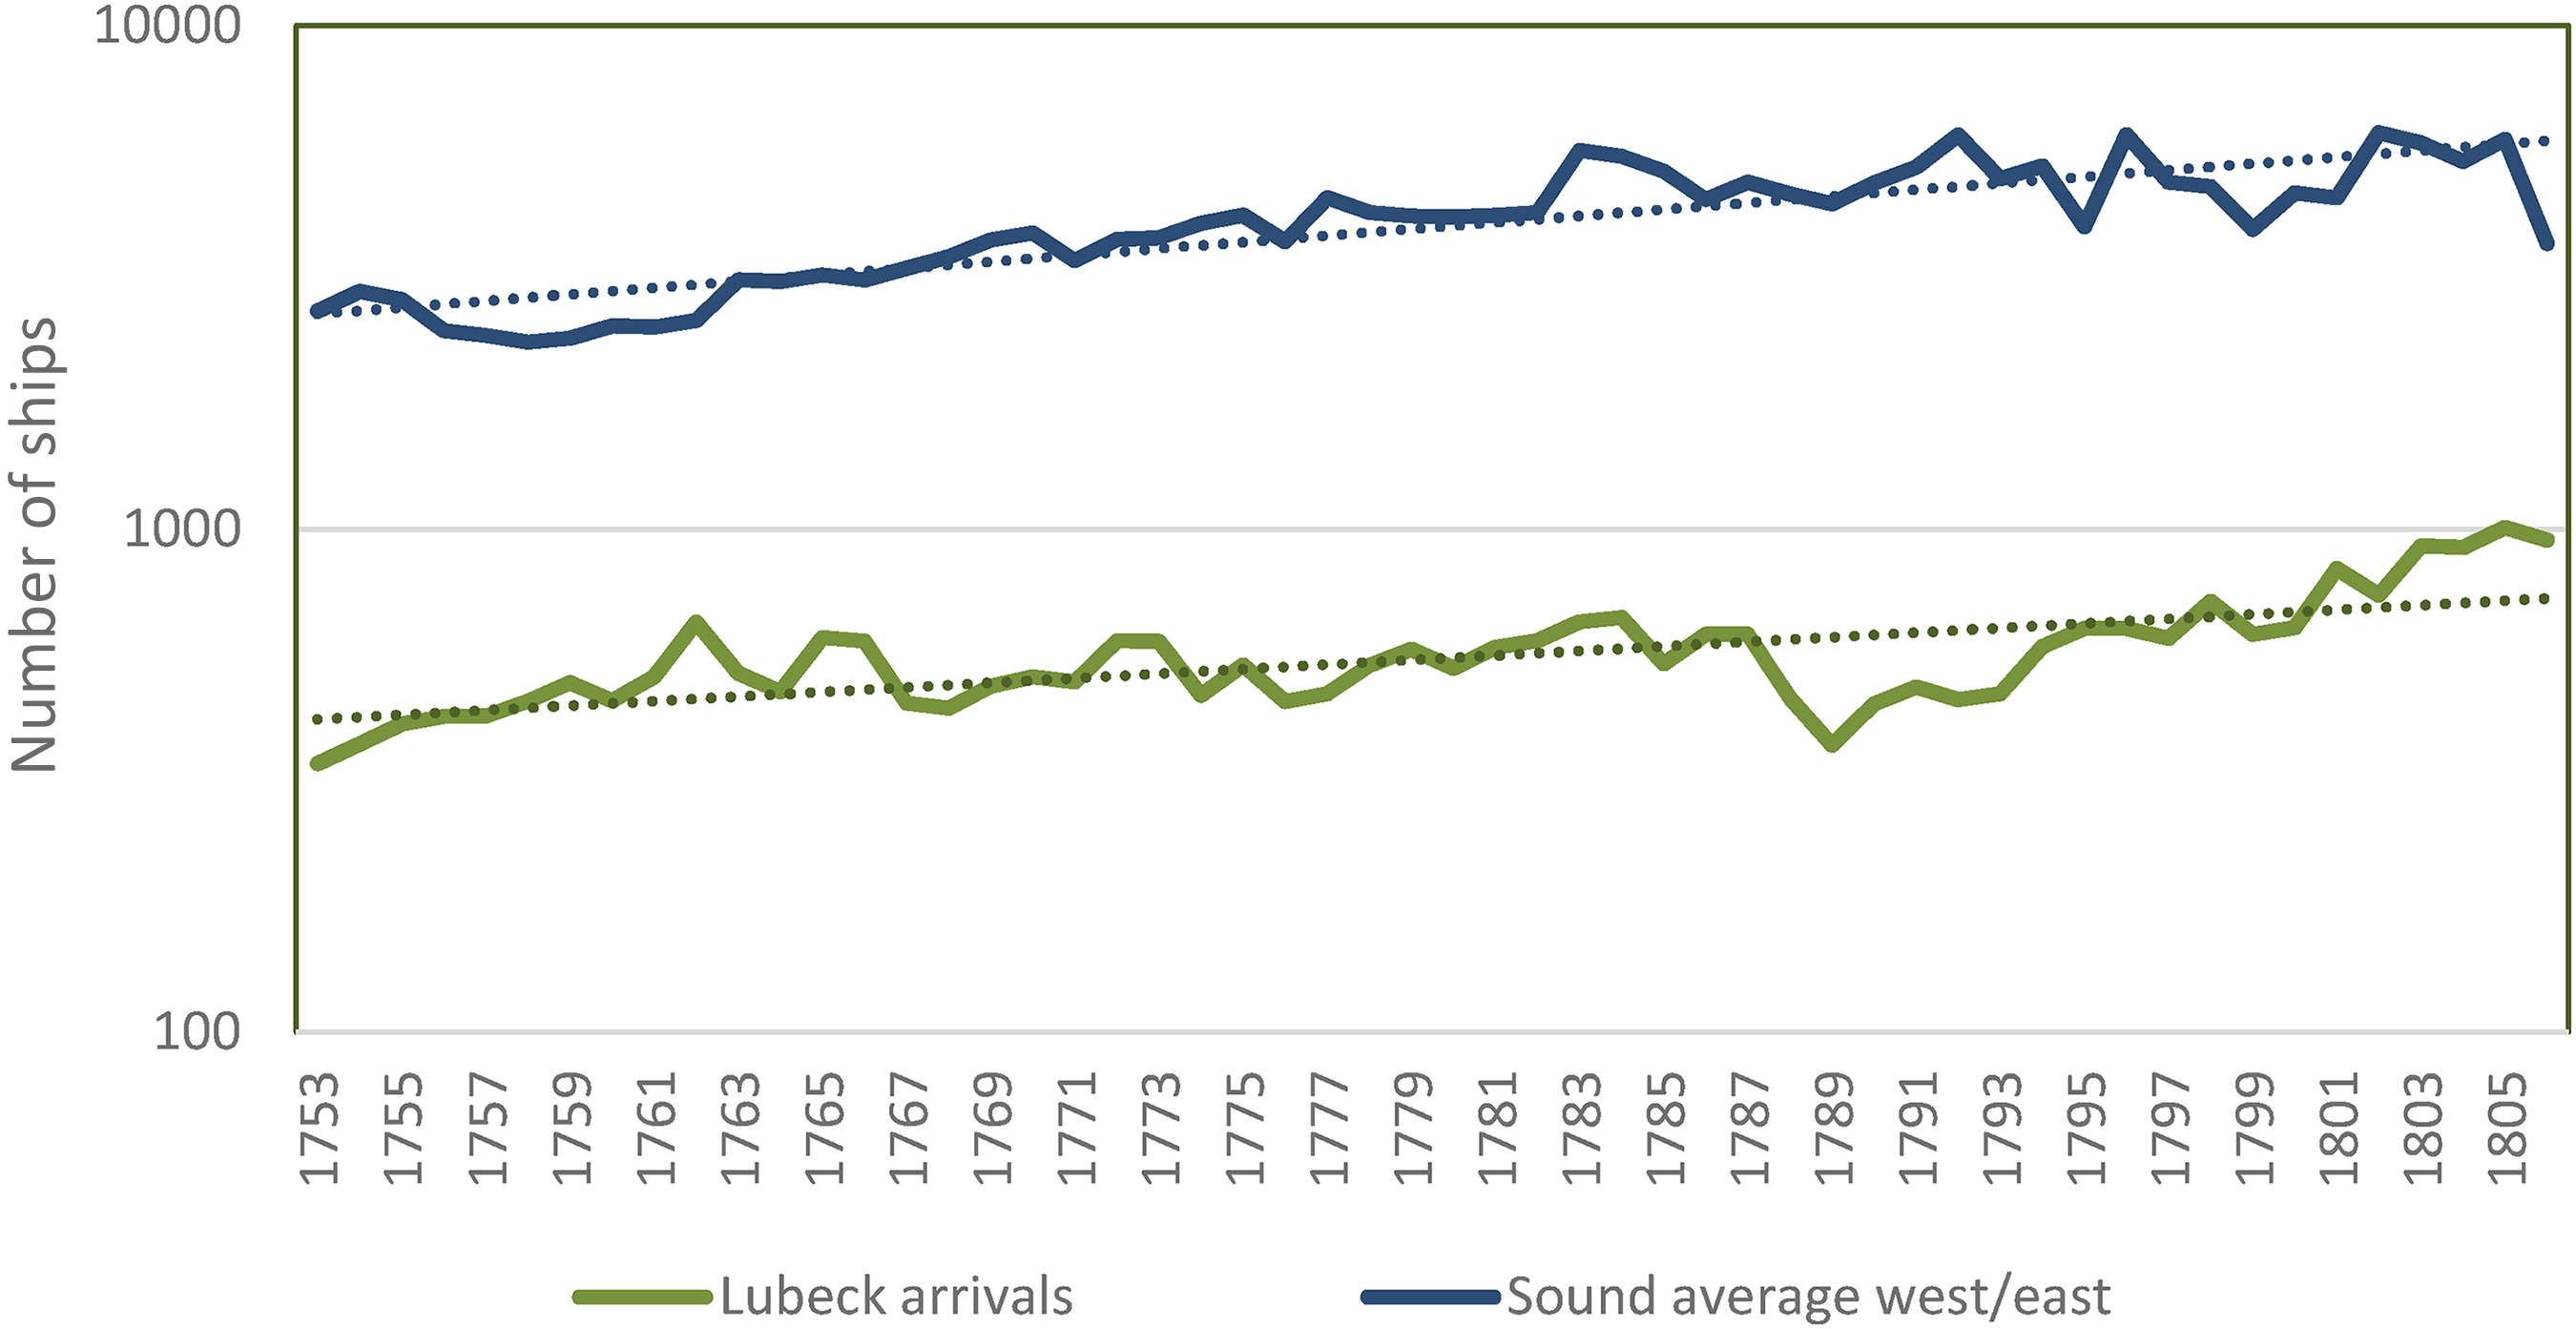
Passages through the Sound and arrivals at Lübeck, 1754–1806 (log scale).
Such discrepancies suggest two conclusions. First, the short-term differences make it difficult to believe that climatic variations played a primary role – it seems obvious that similar weather prevailed in the Sound as in the southern Baltic Sea. Second, contrary fluctuations in the short and even longer term suggest a competitive situation in which the success of one was the loss of the other. The period of 1763–1787, when peace prevailed in the Baltic, may be seen as a demonstration of how the more dynamic western sea powers were gaining an upper hand over the traditional Hanseatic seaports. It can also be concluded that the shipping in the port of Lübeck was more closely connected with the fortunes of war than the blessings of peace.
IV
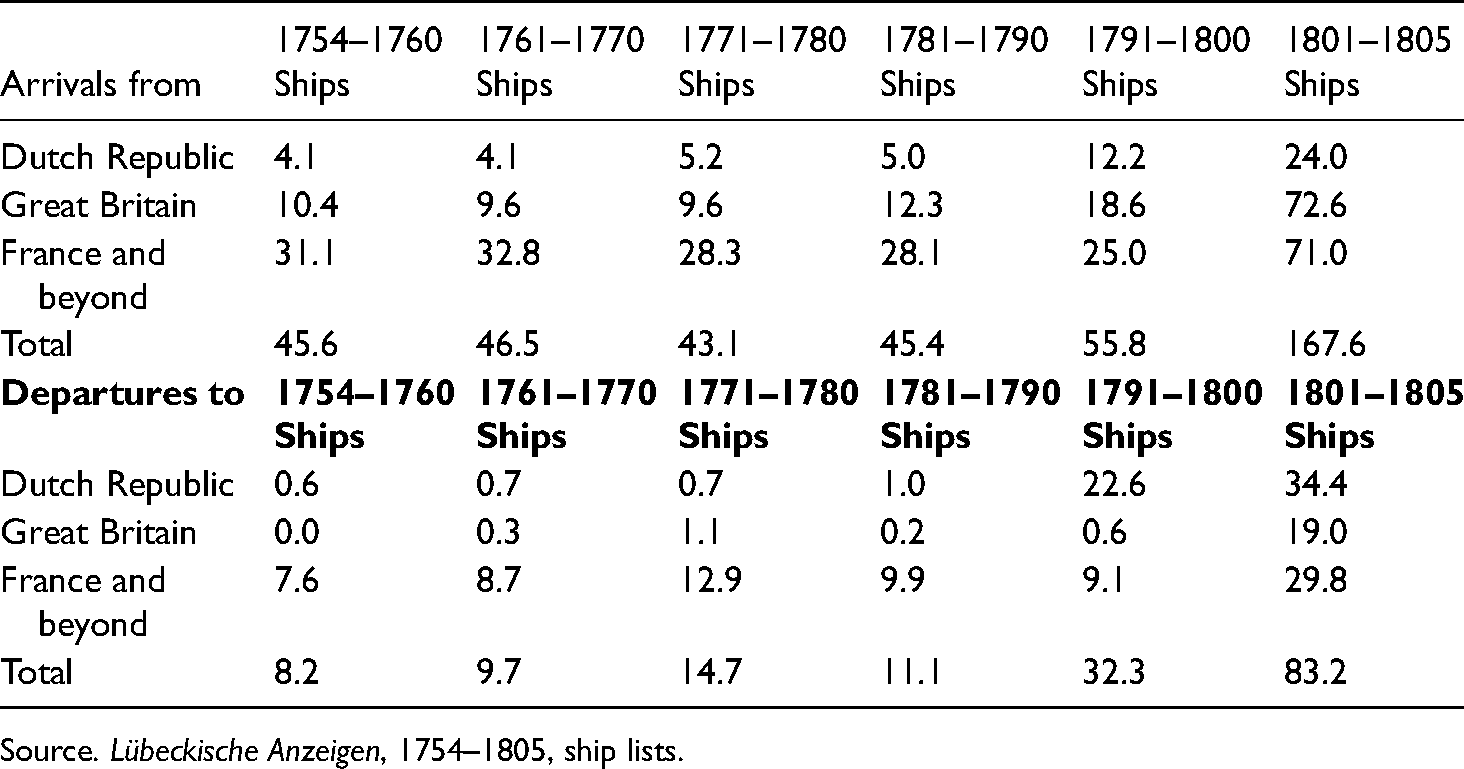
Lübeck was a port which attracted ships from all corners of the Baltic but, as already mentioned, it had remarkably sparse connections with the world beyond the Sound. In the period 1754–1760, only 46 ships a year (on average) arrived from the Dutch Republic, Great Britain or other western European ports, and 20 more from Norway; taken together, they accounted for about 15 per cent of all arrivals. There were even fewer departures to these destinations: 17 ships a year, or only five per cent of all departures (see Table 1). For comparison, the corresponding figures for Kronstadt (1749–1752) were on a totally different scale: 63 per cent of arrivals and 68 per cent of departures. 24
Regional shares of Lübeck's shipping networks, 1754–1805.
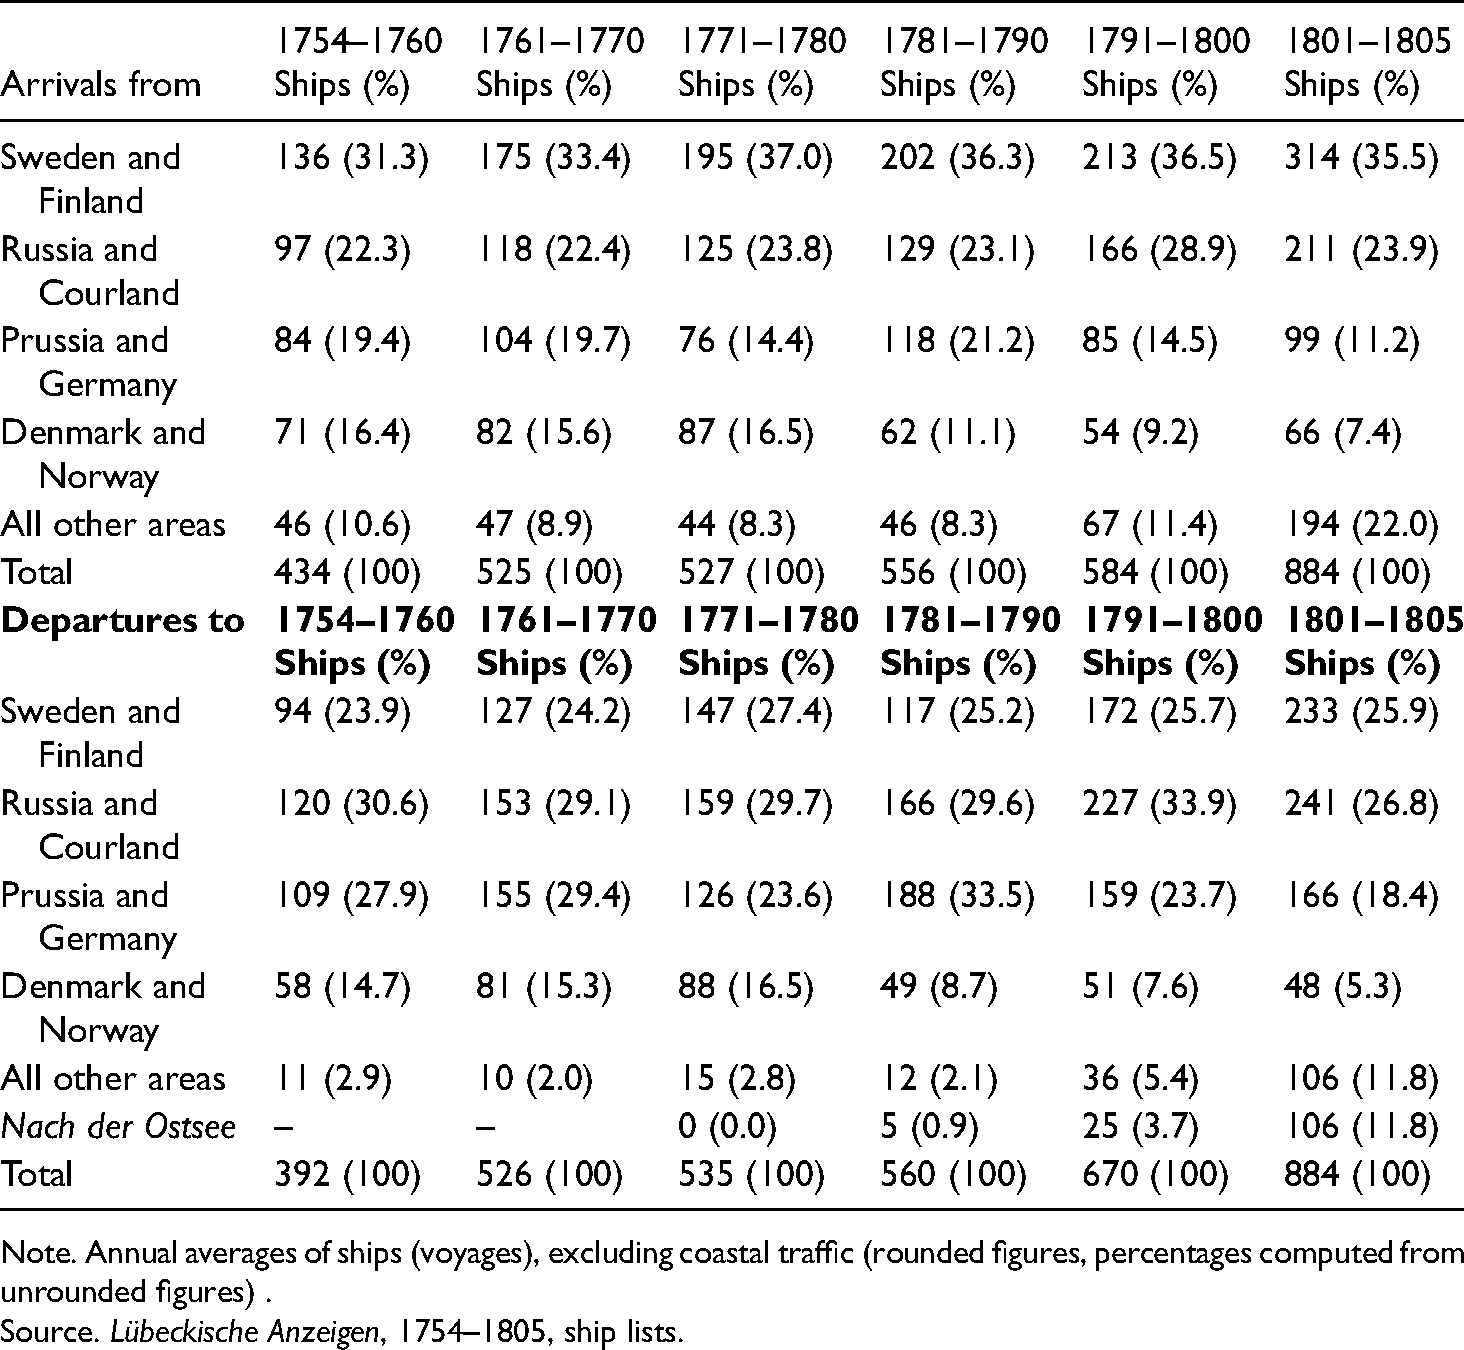
Note. Annual averages of ships (voyages), excluding coastal traffic (rounded figures, percentages computed from unrounded figures) .
Source. Lübeckische Anzeigen, 1754–1805, ship lists.
Arrivals at Lübeck from Sweden and Finland (five-year averages).
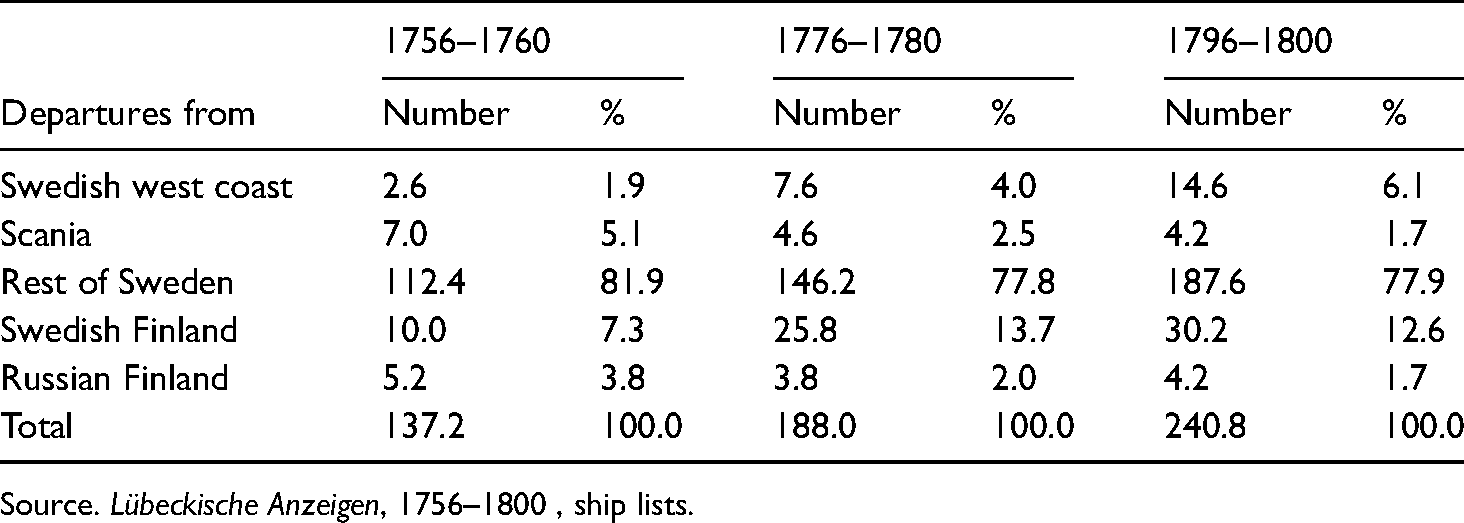
Source. Lübeckische Anzeigen, 1756–1800 , ship lists.
The most arrivals were registered from Sweden – not only from Stockholm and Gothenburg, but also from about 20 smaller seaports on the country's west, south and east coasts. Most of these ships seem to have been Swedish. A number of ships also arrived from the Finnish side (then belonging to Sweden). Moreover, even ships from two eastern Finnish seaports – Fredrikshamn (Hamina) and Wiborg (Viipuri) – which earlier belonged to Sweden but were ceded to Russia in 1721 and 1743, respectively, were regularly seen in Lübeck. All told, they accounted for almost a third of all arrivals. 25
The second largest group of arrivals – almost a quarter – consisted of ships from St. Petersburg and Russian Baltic ports, Narva, Reval (Tallinn), Riga and a few smaller Estonian towns. Libau (Liepaja) and Windau (Ventpils) can be included in this group; they belonged to the Duchy of Courland, which was formally a part of Poland but can actually be regarded as a client state of Russia. 26 In the middle of the eighteenth century, Riga was still the busiest of all these ports. It was particularly important as an exporter of so-called ‘naval stores’.
The next geographical area – the south-east and southern coasts of the Baltic Sea – was politically divided into several spheres. East Prussia (or the Duchy of Prussia), with the ports of Memel (Klaipeda), Königsberg (Kaliningrad) and Pillau (Sovetsk), belonged to the Kingdom of Prussia(-Brandenburg). The old Hanseatic towns of Elbing (Elblag) and Danzig (Gdansk), again (as the rest of the so-called Royal Prussia ), were integral parts of Poland, while the Pomeranian ports of Kolberg (Kołobrzeg), Stolp (Słupsk) and Stettin (Szczecin) had been incorporated into Prussia in 1721. 27 On the other hand, Sweden still retained the western part of Vorpommern, with the ports around Greifswald and Stralsund, as well as Wolgast by the Prussian border. By far the most important city in the whole of this area was Danzig, which sent more ships (mainly Dutch and English) westward through the Sound than any other Baltic port. However, these Prussian and German ports did not maintain intensive trade with Lübeck. All told, they accounted for less than 20 per cent of all arrivals.
As far as the number of ships is concerned, Copenhagen was a more important trading partner for Lübeck than any of the German or Prussian ports. Yet it seems that the typical size of these ships was quite modest. This may have also been the case for Norwegian vessels, which mainly carried herring in their cargo holds. Including Elsinore, Denmark and Norway accounted for about 15 per cent of all arrivals. On the other hand, almost 200 small Danish coastal craft (in addition to over 100 boats from Mecklenburg, Schleswig and Holstein) sailed to Lübeck each year.
The flip side of the coin – departures – presents a somewhat different picture. Almost 60 per cent of the ships were heading for Russian, Courland, Prussian or German ports, while Swedish (and Finnish) destinations represented less than a quarter of the total. This shift in balance suggests that many ships – such as about a quarter of those arriving from Sweden – did not return home from Lübeck but first sailed eastwards. This was also the pattern for a few skippers coming from Great Britain and the Dutch Republic (who are fairly easily traced by their names), who, after unloading their import cargo, sailed to the large export ports such as Danzig, Riga or St. Petersburg.
The structure of Lübeck's shipping networks remained fairly stable until the turn of the century (see Table 1). Arrivals from Sweden accounted regularly for the highest numbers, and the north-eastern sector – Russia and Courland – was clearly in second place. The former’s numbers increased until the 1780s but stagnated thereafter; the latter’s remained at relatively stable levels until the 1790s, when they experienced a sudden increase. Until the turn of the century, the combined share of these sectors increased from a good half to almost two-thirds (65,4%). Reciprocally, the relative weight of Prussia and Germany (with the exception of the 1780s) and, in particular, of Denmark and Norway diminished. Arrivals from all other areas, again, remained at the same levels until the 1790s.
The distribution of departures was not as stable as that for arrivals, and the differences between the various regions were not as clear-cut. Before 1800, Russia and Courland accounted for the highest averages in the decade three times, Prussia and Germany once, and once they were practically on a par. Their combined shares also did not represent any long-term growth and, moreover, in the 1770s and 1790s, departures to Sweden exceeded those to Prussia and Germany.
The last decade of the period – that is, the time after the demise of the old Dutch Republic – brought a distinct (albeit limited) change in the picture. Arrivals from, as well as departures to, ‘all other areas’ increased sharply, in particular after the French occupation of Hanover and the German North Sea ports. Lübeck even ‘inherited’ some remnants of Hamburg's ocean shipping: in 1804 and 1805, the ship lists recorded arrivals from, for example, the USA, Tenerife, Senegal, Bombay and the Isle de France (Mauritius). On the other hand, the number of ships arriving from Sweden, as well as from Russia and Courland, increased in actual numbers, although their percentage shares declined slightly because of the rapid growth in arrivals from beyond the Sound. Even the respective departures grew in actual figures, with Swedish destinations coming closer to those of the Russian sector, as well as exceeding Prussian and German destinations by a clear margin. 28
The partitions of Poland affected a couple of eastern seaports directly. In the First Partition (1772), most of Royal Prussia, including Elbing, was incorporated into Prussia. Danzig still officially remained Polish – it was annexed by Prussia in the Second Partition (1793) – but it was separated from its Polish hinterland by a broad Prussian corridor and Prussian customs dues. Accordingly, it lost its position as the number-one exporter beyond the Sound and it had already been overtaken by Riga in the 1770s. 29 Interestingly, no drastic changes could be seen in Lübeck's shipping to or from Danzig after 1772 or 1793. Given the fairly modest scale of these connections, this was not surprising.
V
It was pointed out earlier that the number of ships does not tell us much more than the visiting frequencies. In a few cases, however, it is possible to gain a deeper understanding of the respective commodity flows – the underlying factors of these shipping movements. The first obvious case is ships from Sweden, which, across the whole period, topped the lists of arrivals. It was suggested above that most of them were also Swedish national vessels . This conclusion is to some degree supported by the names of the skippers, many of whom seem to have been Swedish, but further circumstantial evidence can be drawn from Swedish navigation policies. In 1724, a Produktplacat (decree on imported products), modelled as an imitation of the English Navigation Acts, forbade foreign intermediate imports and, subsequently, even exports on foreign vessels were gradually strangled by discriminating customs tariffs. They affected the export of sawn wood and iron, in particular: in the middle of the eighteenth century, the total dues and charges for a shipload of deal were four times greater for foreign vessels than for domestic vessels. 30 Under such conditions, it seems improbable that Swedish sawn wood could have been carried profitably to Lübeck on German or other non-Swedish vessels. 31
That many of these Swedish ships actually carried sawn wood is verified by frequent announcements in the Lübeckische Anzeigen, which told of auctions of different sorts of boards and deal. Most often they were specified according to origin – Karlskrona, Karlshamn, Kalmar, Visby, Västervik, Helsingfors and other Swedish seaports – and sometimes even tar was offered for sale. Again, there is circumstantial evidence: according to Swedish foreign trade statistics, over 50 per cent (and sometimes almost 60 per cent) of the country's exports of ordinary board (enkla bräder) went to the Baltic Sea area (östersjöområdet). For tar exports, the share for this area fluctuated at around 32 and 48 per cent. 32 In practice, östersjöområdet must have referred to south-western ports like Rostock, Wismar, Lübeck, Kiel and Copenhagen. Seaports further east did not import forestry products; instead, they were exporting them.
Further details on this overall picture are furnished by the reports of local Swedish customs houses. According to Staffan Högberg, who exploited these sources extensively in his dissertation, the Swedish exports of sawn wood to German and Danish destinations were, at least around the middle of the eighteenth century, almost synonymous with the exports from the south-eastern Swedish seaports; these were also the ports that were frequently referred to in the auction announcements mentioned above. 33 Ships from Stockholm also visited Lübeck regularly, but as the lion's share of its timber imports went west of the Sound, the Baltic market was not of primary importance for the capital. 34 Smaller shipments of planks and boards also came from Norrköping, Nyköping and Gävle, plus a number of south and south-western Finnish ports. On the other hand, the Russian Finnish seaports – Wiborg and Fredrikshamn – which, taken together, may have produced more sawn wood than the whole of Sweden, sold most of their products to western Europe and only occasionally sent shiploads to Lübeck. 35
There were also substantial sawmill industries on the Swedish west coast, around Gothenburg and Uddevalla, but they did not usually export timber products to the Baltic at all. 36 Instead, most of the west coast's seaports were preoccupied with herring fishing, which boomed from the late 1750s to the 1790s and the first years of the nineteenth century. During this period, ports like Halmstad, Marstrand and even Gothenburg shipped salt herring to a wide number of Baltic destinations, including Lübeck. 37 Finally, the vast bulk of Swedish arrivals included small vessels carrying different types of farm produce from a number of southern Scanian ports like Ystad, Malmö or Helsingborg. Such local traffic seems not to have extended often to Lübeck, obviously because Copenhagen was a more natural destination. 38
Overall, the export of sawn wood and tar dominated Swedish shipping to Lübeck. A few ports – such as Stockholm, Gothenburg and Gävle – also exported some iron, and ships from Gotland and Kalmar even loaded limestone, but such heavier goods only took up a small part of the total cargo space. The figures presented in Table 2 show that the typical timber and tar ports (even excluding Russian Finland) retained, across the whole period, a share of about 90 per cent of all respective arrivals at Lübeck. This means that such exports grew by at least 80 per cent from the 1750s to the 1790s, and probably even faster as it seems that typical vessel sizes increased. 39 The expansion was fastest around the northern and eastern rims – Finland and the Bothnian provinces. 40 Even the rapidly growing herring exports from the west coast did not challenge the primacy of timber and tar: the numbers, as well as the average sizes, of the west-coast vessels remained small. Moreover, at the same time, visits by Scanian vessels decreased.
The Swedish export of sawn timber, being a light but bulky product, required lots of cargo space. The other side of the coin was that the import cargoes did not need an equal amount of shipping. As far as the Baltic is concerned, the only real bulk goods going to Sweden were grains – mainly rye. Ton for ton, grains were more valuable than deal or tar, but the amounts to be transported could only fill part of the ships that arrived with timber and tar. In the 1750s, the south-eastern Swedish seaports (Västervik–Kristianstad plus Gotland) exported some 41,000 dozen (or 492,000 pieces) of boards and deals a year and imported some 19,000 barrels of rye; allowing for seven dozen deals (84 pieces) and 21.5 barrels of rye per last (or about two tons), the annual transport of the former required almost 6,000 lasts and of the latter about 900 lasts of shipping. 41
This imbalance was clearly reflected in the everyday movement of ships. As already mentioned, the majority of Swedish ships sailed from Lübeck directly back home (or to other domestic ports). As Lübeck was not a grain port – in fact, it imported grains – such bulk cargo was not available there. Moreover, the typical Lübecan bulk commodity – Lüneburg salt – was not popular in Sweden. Of course, returning ships could take home minor amounts of sugar, wine or colonial goods and, at least in smaller towns, such small-scale imports could satisfy a substantial share of local demand; however, they barely occupied any cargo holds. On the other hand, a number of Swedes always continued from Lübeck to more eastern ports for their return cargo. Their numbers fluctuated greatly from one year to the next, but the average proportions varied between 25 and 29 per cent; only in the 1780s, when Sweden imported unusually large amounts of grain, 42 did it rise to 42 per cent; it then went down to 19 per cent in the following decade when imports slumped. Such a rough correlation with imports is a further indication of grain constituting the principal return cargo for Swedish ships.
Systematic research into where the Swedish skippers sailed to for their return cargo would be a very challenging task. Since their nationalities were not recorded, it would be impossible to pick up all of the Swedes among the departures. Moreover, Danish and Swedish names (in particular in Germanized orthography) are sometimes difficult to distinguish from each other. However, in many individual cases, identification is, of course, possible, and it seems that at least Wismar, Swedish Pomerania, Danzig and Riga (and even St. Petersburg) were common destinations. These were also the most important loading ports for Swedish grain imports, although their relative importance seems to have changed across the period. 43
The transits of Swedish ships to Wismar and Swedish Pomeranian ports have left distinct traces in the Lübeck ship lists. Departures to these destinations exceeded regularly arrivals from these ports with a good margin , often by more than 100 per cent. 44 Generally, Pomeranian ports, with good inland agriculture, seem to have attracted more ships than Wismar; however, in the late 1750s (when the Prussians invaded most of Swedish Pomerania and blockaded Stralsund), Wismar suddenly became a better choice for a while. The permanent popularity of Wismar and Swedish Pomerania can be easily explained: being part of the Swedish realm, they enjoyed substantial reliefs in terms of customs dues. On the other hand, Pomeranian grains were not highly appreciated.
Even Russian ports, although they were farther away, could offer similar advantages. Under the Treaty of Nystad (1721), Sweden was granted a permanent license to import a quota of grain customs-free, and this quota was gradually increased. Thus, it is no wonder that Riga became an important grain port for Swedish ships, in particular in the 1770s and 1780s. In terms of price and quality, however, Danzig remained a good alternative until 1772, when the First Partition of Poland (and Prussian customs dues) separated it from its Polish hinterland. Thereafter, it was replaced by East Prussian ports (Königsberg and Memel). 45
The overall picture of Swedish shipping to Lübeck is quite straightforward: with the exception of the west-coast herring, bulk goods dominated not only the outward shipping but also the ‘triangle trade’ of those ships that sailed eastwards for return cargo. As far as more valuable goods are concerned, they remain invisible due to the shortcomings of the data; in purely logistical terms, however, they were unimportant.
VI
Russian ports accounted for the second-highest number of arrivals and departures in Lübeck, but it is possible that this sector was top in terms of trade value. The core of the Russian trade consisted of Lübecan ships which, following the old Novgorodfahrer traditions, carried valuable shiploads of manufacturing and handicraft products, wine, sugar, tobacco, and other colonial goods and luxury items to St. Petersburg, Riga and provincial capitals. 46 In exchange for such ‘general goods’ (Stückgut), they brought back Russian bulk goods, tallow, hemp, flax, rye, vax and leather, as well as grain from Prussia and Poland. Some of these bulk goods – for example wax and jucht leather – could be quite valuable; however, Lübeck had from time to time a positive balance of trade with the Russian Empire. 47
Thus, shipping between Lübeck and Russian ports followed two different modes. Cargoes of Stückgut normally consisted of fairly large numbers of different consignments from various shippers, which the shipmaster undertook to transport to the desired destination. Bulk goods consisted of much larger quantities – just a single consignment or a few consignments on one ship. While the principles of the freight agreements were similar in both cases, collecting a shipload of Stückgut was much more complicated than in the case of bulk goods. Merchants who wanted to send goods to, for example, St. Petersburg needed to know which ships were sailing for that destination, and when they planned to load and depart. Thus, in the early days, a lot of information needed to be distributed by word of mouth – either through specialized shipping agents, local networks like the Novgorodfahrer and Rigafahrer guilds or Schiffergesellschaft (skippers' guild), or maybe even resorting to the services of town criers. Newspapers, of course, were able to spread such news easily and efficiently, but, at least in Lübeck, the old system was obviously regarded to be satisfactory, and the transition to printed information took three decades. In the early 1780s, just a few skippers offered their services in the Lübeckische Anzeigen; it was only in the latter half of the decade that the number of announcements grew rapidly and, in the 1790s, the paper became the dominant media source for all shipping news. 48
Naturally, valuable general goods required less cargo space than typical bulk goods. Thus, a number of ships regularly left Lübeck for Russian ports in ballast. Their proportion can be found by comparing the Lübeckische Anzeigen’s lists of all departures with the Novgorodfahrer books, which indicate how many ships paid customs fees for cargo. In the 23 years from 1756 to 1780 (excluding 1766) for which both sets of data are available, the excess of the former – that is, ships sailing in ballast – was 16 per cent. 49 This tallies fairly well with the data of the entries in Kronstadt from 1744–1752, where 13 per cent of ships arriving from German and Prussian ports came in ballast. 50 In reality, the volumes of export and import cargoes must have differed more than this. Given the great variety of general goods and the fact that they were loaded on ships sailing with more or less fixed schedules, it seems obvious that consignments of Stückgut did not always fill all the actual cargo spaces. In spite of this, Lübecan as well as many other German and Prussian ships accounted for much lower ratios of ballasted voyages than most ships passing through the Sound eastwards – for example, in 1744–1752, 36 per cent of Dutch ships arrived at Kronstadt in ballast and, for the British, the rate was as high as 71 per cent. These ratios reflect the fact that German and Prussian seaports – in particular, Lübeck – played an important role in St. Petersburg's imports; until the 1770s, they even brought more shiploads than the British and Dutch combined. 51
Destinations of ships with general cargo from Lübeck, 1800.
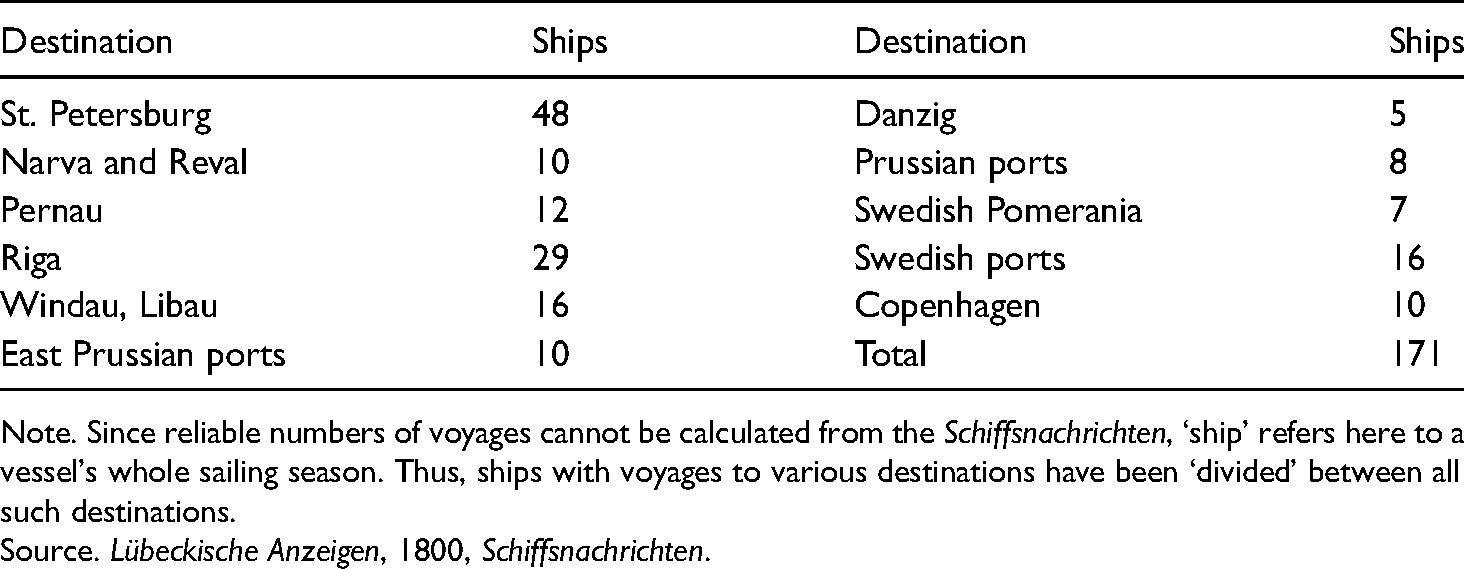
Note. Since reliable numbers of voyages cannot be calculated from the Schiffsnachrichten, ‘ship’ refers here to a vessel's whole sailing season. Thus, ships with voyages to various destinations have been ‘divided’ between all such destinations.
Source. Lübeckische Anzeigen, 1800, Schiffsnachrichten.
Since the time of Peter I, Russia had followed a mercantilist policy, protecting its own production with high import tariffs. They mainly covered simple and cheap goods that the fairly undeveloped domestic industries were able to produce; thus, for example, the import of cheaper British textiles was hampered by high customs charges. On the other hand, more expensive products and luxury goods, which were not made in Russia, enjoyed lower duties, and this was a situation that Lübeck ships, for example, must have benefited from. 52
The Russian navigation laws offered foreign shipowners other opportunities for minimizing trading costs. Peter I had tried to boost the country's merchant fleet by attracting ships from abroad to sail under the Russian flag. In order to qualify as Russian, foreign skippers only needed to replace a certain number – usually two-thirds – of their crew with ordinary Russian sailors. As they were willing to work for lower wages than western sailors, this was a very economical way to achieve customs freedom. However, such maritime immigration remained quite modest – not least because the supply of Russian sailors was limited. In 1747 and 1748, only nine ‘Russian’ ships (that is, with St. Petersburg as their home port) on average paid the Sound toll; not surprisingly, all the skippers had Dutch or Low German names. 53 Gradually, the popularity of this ‘flag of convenience’ increased and, in 1786–1787 (that is, just before the Russo-Swedish War), on average 14 St. Petersburg ships were recorded at Elsinore. However, the French Revolutionary Wars seem to have chased the Russian flag from western European waters. 54
Among these pseudo-Russian skippers, there were a few possible Lübecan family names. However, there were not many, which is unsurprising since the old Hanseatic town regarded Baltic rather than North Sea and Atlantic trades as its Moedernegotie (‘mother of trades’). Unfortunately, there are no sources for the 1760s or 1770s which could tell us whether traders from Lübeck had accepted to fly Russian flags of convenience. The first indication of such practices can only be found around the middle of the 1780s, when a number of skippers advertising in the Lübeckische Anzeigen reported flying the Russian flag. At first, they were mainly Rigafahrers but soon even skippers sailing to St. Petersburg and Reval followed suit. The war between Sweden and Russia, however, made all of them return to their old (‘Lübeckischer ganz neutraler') flag but, after peace was concluded, the Russian colours soon recovered their popularity. In 1796, advertisements for no less than 80 ships (all obviously home from Lübeck) sailing to Russian ports can be found in the Lübeckische Anzeigen. Of these, 51 were flying the Russian flag and only 25 retained the domestic colours of Lübeck (for four, no information on their flags was published). 55 After 1799, the shipping news of the Lübeckische Anzeigen did not mention flags anymore, but it seems that these flag-of-convenience practices continued as long as the war was not disturbing Baltic shipping. According to published statistics for 1800–1806, on average almost 50 arriving and 50 departing Russian-flag ships a year were recorded in the port of Lübeck. 56 Very probably, all of them belonged to Lübeck shipowners.
St. Petersburg trade can be regarded as a mainstay of Lübeck's Russian shipping: not only did it carry forward the old Novgorodfahrer traditions, but the new, rapidly growing Russian capital developed into a first-class market for German and colonial luxury goods. Interestingly, this also seems to have been a remarkably balanced trade, with most outward-sailing ships rounding out their enterprise with a return voyage. As Table 3 demonstrates, the number of arriving ships (with the exception of 1801–1806) exceeded that of departing ships only moderately, which accords with the fact that incoming cargo required slightly more space than outgoing cargo. Another interesting feature is that there were few outsiders; indeed, it seems as if the Novgorodfahrers at least had been able to retain this trade in a more or less closed shop. On the other hand, the growth of Lübeck's entrepôt trade was hampered by the growing direct shipping from French and Iberian ports to St. Petersburg, part of which was carried out by the capital's flag-of-convenience tonnage. 57 Still, even Lübeck's shipping to St. Petersburg was able to grow at least moderately. In the 1760s, 1770s and 1780s, arrivals from as well as departures to St. Petersburg increased at an average rate of almost two per cent a year – that is, slightly faster than all Baltic traffic in the port of Lübeck. However, very rapid growth was experienced in the 1790s after the almost total demise of St. Petersburg's shipping beyond the Sound. Once again, Lübeck was able to benefit from the fortunes of war.
Number of voyages between Lübeck and Russian and Courland ports (five-year averages).
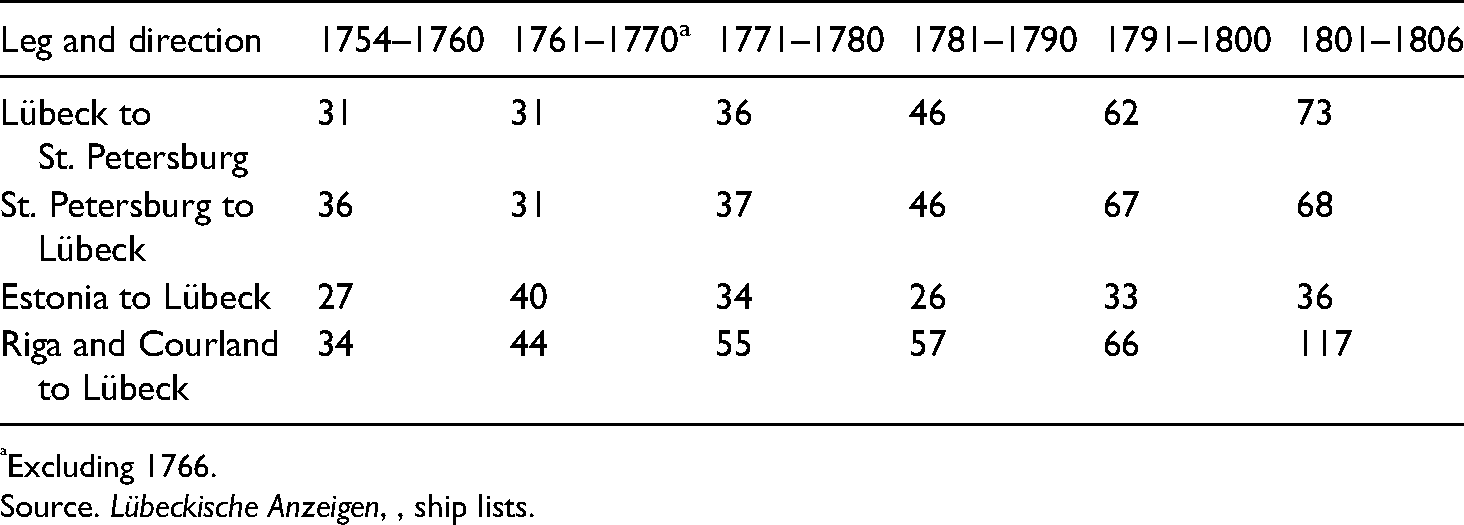
Excluding 1766.
Source. Lübeckische Anzeigen, , ship lists.
The importance of St. Petersburg is also demonstrated by the later ‘shipping news’ (Shiffsnachrichten) of the Lübeckische Anzeigen (a continuation of the skippers’ announcements in a more systematic format). As Table 4 shows, in 1800, two-thirds of all prospective cargoes of general goods were destined for Russian and Courland ports, and over 40 per cent of the latter went to the capital. For the participating ships, Russian trade was a full-time occupation, with most ships sailing on average two round-trip voyages each summer, either twice to the capital or combining a St. Petersburg trip with another to Riga, Reval or Pernau (Pärnu).
However, in addition to regular outward-and-return voyages, the eastern Baltic waters were crossed by a number of British, Dutch, Swedish and other foreign ships sailing from Lübeck to Narva, Riga, Königsberg or Danzig in ballast, in order to load a bulk cargo of grain or ‘naval stores’, and with no intention of returning to Lübeck. Therefore, departures exceeded arrivals by a large margin. This means that only the figures for arrivals are directly related to Lübecan shipping interests. As Table 3 demonstrates, the number of ships arriving from Riga and Couronian ports tended to be slightly higher than the number of ships from St. Petersburg, and grew at a roughly equal rate. Shipping from Estonian ports seems to have played a more modest role and did not increase on a par with other Russian shipping.
Rather few ships with general cargo sailed from Lübeck to East Prussia, Danzig or Stettin. On the other hand, voyages from these ports to Lübeck were quite numerous, which suggests that they were of some importance in Lübeck's imports. Unfortunately, the information in the Lübeckische Anzeigen's ship lists is far too scant to draw any further conclusions.
Around the middle of the eighteenth century, Lübeck was clearly the biggest German actor in the trade of St. Petersburg, and probably for all Russian Baltic ports. According to the ship lists of the St. Petersburgische Zeitung, in 1744–1748 it accounted for no less than 47 per cent of all arrivals with cargo from German and Prussian ports. In terms of cargo volume, its share must have been even higher. In second and third place were Rostock and Kiel, which traded with fairly small vessels: the former imported mainly apples and pears while the latter specialized in oysters and other seafood. 58 This was, of course, the time of the War of the Austrian Succession (1740–1748), with Lübeck reaping the full benefits of its neutral position. The situation was repeated during the Seven Years’ War. According to the statistics published by Anton Friedrich Büsching, Lübeck accounted for about 55 per cent of all German and Prussian arrivals at Kronstadt in 1758–1761. 59 Again, given the small size of Rostock and Kiel vessels, the actual proportion of the cargo volumes may have been almost 70 per cent.
In times of peace, Lübeck had to contend with more modest rates – about 40 per cent in 1749–1752, 37 per cent in 1765–1768 and 30 per cent in 1772–1786 (these ratios have not been corrected for the small cargoes from Rostock and Kiel). However, in spite of declining ratios, it sent more ships to St. Petersburg than any other German or Prussian competitor. Yet it is undeniable that Lübeck lost much of its former dominance in this trade. The main challenge came from Stettin, which only gained direct access to the Baltic in the 1760s. Thereafter, it rapidly became the primary seaport of Brandenburg-Prussia, the maritime gateway to Berlin. However, in 1794, Lübeck still sent 54 ships to Russian Baltic ports while respective Prussian ships amounted to no more than 33. 60
As mentioned earlier, ships returning from Russian ports were regularly fully loaded. Lübeck was, in fact, a major importer of various Russian products. In 1764, it was recorded as the third largest importer of Russian goods after Great Britain and the Dutch Republic, and it must have maintained this ranking for the best part of the late eighteenth century. In addition to hemp, flax and jucht leather, tallow was imported in great quantities. In 1749–1765, Lübeck's imports exceeded, on average, the tallow transports through the Sound by 50 per cent. 61
VII
In the period 1750–1790, about half of the ships that sailed through the Sound were Dutch and British. 62 Against this backdrop, it is remarkable that Lübeck's shipping remained, until the 1790s, almost totally independent of these great maritime powers. The low numbers of ships from Great Britain and the Dutch Republic are clearly shown in Table 5. Even the visiting frequencies of small Norwegian vessels, loaded with salt herring, exceeded these numbers by a wide margin.
Lübeck's annual averages of ships (voyages) beyond the Sound (excluding Denmark, Norway and the Swedish west coast).
Source. Lübeckische Anzeigen, 1754–1805, ship lists.
On the other hand, Lübeck received on average 30 ships a year from French Atlantic, Iberian and Mediterranean ports. This may be unexpected for a seaport that concentrated on Baltic shipping. However, these long traders did not represent any new or exceptional enterprises – on the contrary, they were carrying on a tradition that started in the late sixteenth century. 63 Moreover, in the eighteenth century, they had become strongly connected with Lübeck's Moedernegotie – in fact, they can be regarded as a vital appendix to its Baltic networks. As already mentioned, wine, sugar (raw as well as refined), coffee and other colonial goods played an important role in exports to Russia and other eastern and south-eastern Baltic ports. Voyages to France and beyond were maintained simply in order to ensure that the city always possessed sufficient supplies of these goods, not just for its own consumption but also for re-export. 64
In spite of its importance, this seems to have been trade that did not expand – at least the numbers of ships dropped slightly. However, this small decline was very probably compensated for by an increase in average ship sizes. Examples from the Sound Toll Registers suggest that, in the 1780s, Lübeck ships (or at least their cargoes) were about 20 per cent larger than in the 1750s. 65 Such marginal growth is explained by a constraint that effectively checked Lübeck's French trade: the competition from Dutch shipping. During the War of the Austrian Succession, this check had been temporarily removed when the Dutch Republic joined the coalition against Prussia and France and was closed off to the latter's wine and salt ports. Lübeck shipowners quickly seized the opportunity, built new ships and doubled their direct imports from French ports. 66 Such a windfall was not repeated during the Seven Years’ War, with the Dutch Republic remaining neutral. Lübeck still managed to retain most of the earlier gains but, on the other hand, it seems not to have profited much from the Anglo-Dutch naval conflict, or from the demise of the Dutch Republic. Overall, the French Revolutionary Wars obviously resulted in a modest decline, while, after 1803, the closure of German North Sea ports caused a sudden boom by making Lübeck the main gateway of French, Iberian and Mediterranean products to western Germany.
The arrivals in Lübeck from France and beyond present a very clear – and classic – pattern. About three-quarters of the ships came from Bordeaux and a few other French Atlantic ports; the ratio was slightly lower in the 1780s and 1790s, and it was only after 1803 that arrivals from Spanish, Portuguese and Mediterranean ports exceeded those from France by a clear margin . The Sound Toll Registers show that this was traditional wine trade. Bordeaux was by far the most popular port, and almost all ships carried wine, spirits and vinegar. Other typical imports were plums and prunes, but really large consignments of sugar or coffee were less common, obviously because they were also imported from Copenhagen. Salt was mainly brought from Portugal (St. Ubes/Setubal), but since Lübeck had the salt deposits of Lüneburg close by, its imports of Atlantic or Mediterranean salt remained modest; usually only about 10 per cent of the ships arrived with salt. 67
On the other hand, Lübeck could offer only a limited selection of export goods for the wine ports. The most common local product was oak staves for wine barrels, but they did not fill many cargo holds. Therefore, as Table 5 indirectly suggests, about two-thirds of the ships sailed to French and Iberian ports with cargo from St. Petersburg, Riga, Danzig or other eastern Baltic ports, or in ballast.
The Sound Toll Registers also reveal that Lübeck's shipowners participated actively in the wine trade. Across the whole period, with the exception of the 1760s and 1801–1805, domestic ships had a clear majority of arrivals from French and Iberian ports , and actually dominated the trade in the 1770s and 1780s (Table 6). Dutch ships were still quite common in the 1750s and 1760s but, after the Anglo-Dutch naval conflict, they almost disappeared from Lübeck's wine trade.
Average annual numbers of arrivals (ships) at Lübeck from French and Iberian Atlantic ports.
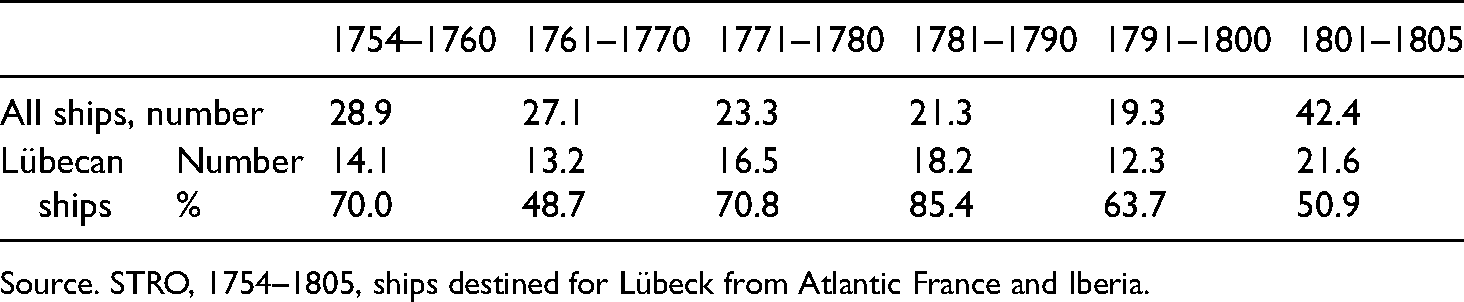
Source. STRO, 1754–1805, ships destined for Lübeck from Atlantic France and Iberia.
It is obvious that a high proportion of French, and even Iberian, imports were re-exported with other Stückgut on ships sailing from Lübeck to Russian and Prussian ports, including Danzig and Stettin. In addition, Lübeck received wine and other products by river transports; for example, around 1800, its overall imports of wine fluctuated from two to five million litres a year. 68 Thus, Lübeck was an important Baltic entrepôt, or trans-shipment centre, where goods were imported and re-exported. Of course, it could not match Amsterdam (from which Lübeck also trans-shipped many different goods, such as tobacco) but, after the Anglo-Dutch naval conflict, Amsterdam's role as an entrepôt for the Baltic world declined significantly. Lübeck naturally benefited from such a development, not only in terms of its own trans-shipments but also by being able to increase direct shipments of wine and salt from southern Europe to several other Baltic ports (for example, St. Petersburg, Riga, Königsberg, Danzig and Stettin). The annual average number of such ‘cross-trading’ voyages rose from two or three in the 1750s to 11 in the 1780s. 69 However, during the following less peaceful decades, the average dropped to about five. It is also possible that some Lübeck skippers sailed beyond the Sound under the Russian flag.
VIII
In sum, the implicit question posed in the title of this article needs to be readdressed. If ‘twilight’ is understood to be synonymous with ‘stagnation’ or ‘slow decline’, it is not an appropriate metaphor for the development of Lübeck’s shipping in the late eighteenth century. As has been estimated, the traffic in this port grew at almost the same rate as all the traffic through the Sound. Accordingly, it could be termed ‘average’ rather than ‘slow’ or ‘stagnant’.
However, the average levels were quite modest in comparison with the fastest-growing national contingent. While the overall compound growth rate for the port of Lübeck (1754/1760–1801/1805) was 1.6% a year, the number of British ships passing through the Sound during the same period increased by an annual average rate of 2.3%. At the other end of the scale, Dutch ships, while still retaining a narrowing majority until the late 1770s, increased in number in the 1750s, 1760s and 1770s by only an average of 0.2% a year. Moreover, their numbers dropped abruptly in the early 1780s (the time of the Anglo-Dutch naval conflict) and did not regain their earlier levels before the demise of the old Republic (1795). The average growth of traffic in Lübeck also compared favourably with the growth of Swedish merchant tonnage, as well as Swedish transits through the Sound. 70
These comparisons must, of course, be understood as suggestive rather than significant. First, it must be remembered that the numbers of ships are a very crude surrogate for actual cargo volumes (or values). Moreover, the data for Lübeck does not refer to a national shipping sector but to port traffic, which, typically, consists of vessels flying a number of different flags. Unfortunately, comparable data can only be found for a number of Russian ports (Table 7).
Average annual numbers of arrivals at Lübeck and a number of Russian Baltic ports, 1754–1797 (excluding coastal vessels).
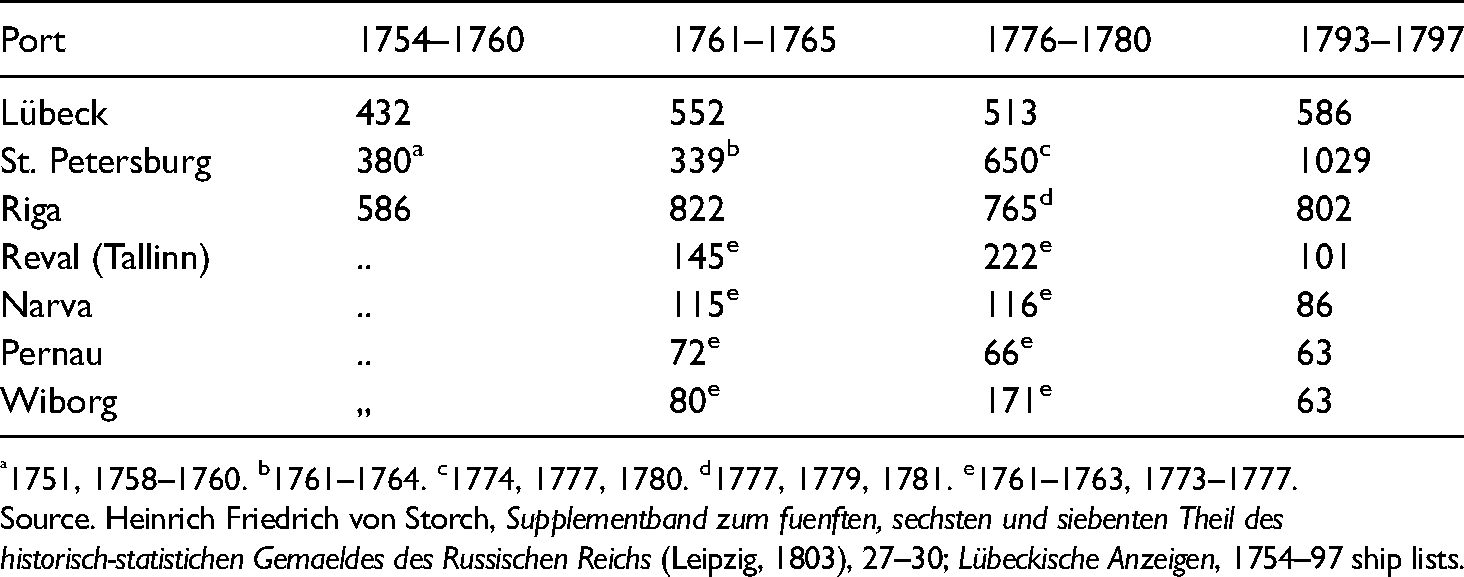
1751, 1758–1760. b1761–1764. c1774, 1777, 1780. d1777, 1779, 1781. e1761–1763, 1773–1777.
Source. Heinrich Friedrich von Storch, Supplementband zum fuenften, sechsten und siebenten Theil des historisch-statistichen Gemaeldes des Russischen Reichs (Leipzig, 1803), 27–30; Lübeckische Anzeigen, 1754–97 ship lists.
Of the other Baltic ports, Danzig attracted the largest number of ships. In the 1750s and 1760s, it sent on average about 600 vessels a year westward through the Sound, which suggests that its total figures clearly exceeded those of Riga (for which the corresponding annual rate was about 400). However, its foreign trade suffered substantially from the First Partition of Poland, with passages through the Sound declining to about 400 a year; accordingly, Riga – and probably even St. Petersburg – overtook Danzig in the 1770s. Riga, on the other hand, lost its first place to St. Petersburg in the 1780s. 71
It seems that in the 1750s and 1760s, Lübeck was still (even excluding coastal shipping) the third busiest Baltic port after Danzig and Riga. In the following decades, its traffic grew slowly, in particular compared to St. Petersburg, and the port slumped to fourth place, if not lower. 72 This decline is fairly easy to explain – it was an obvious consequence of its weak links with the most dynamic economic agent in the Baltic: British shipping. This, again, was due to the fact that Lübeck could not offer the commodities that the British ships were looking for. It is also clear that, for transporting German products to western Europe, Hamburg's geographical position was much more favourable. However, the exceptional ‘fortunes of war’ after 1800 rapidly pushed Lübeck quite close to the top, but this short-term triumph ended in a total collapse during the so-called Franzosenzeit (‘French period’, 1806–1813). Still, it would be too simplistic to interpret the port's early and late booms as random bursts of good luck; rather, they were the fruits of neutrality, which was the permanent guiding star for the senate of Lübeck.
It is clear that Lübeck was no ‘twilight’ port but one of the top four or five in the Baltic. It was also, in spite of usually receiving relatively few British or Dutch ships, a rather cosmopolitan port. According to the statistics for the year 1800, ships flying the domestic flag of Lübeck (161 arrivals and 174 departures) only amounted to a quarter of all shipping (again, excluding coastal vessels) – that is, clearly lower than the share of almost 40 per cent for Swedish ships. 73 These statistics, however, did not account for all Lübeck-owned ships; ships with Russian flags (54 arriving and 55 departing), all belonging to burghers and skippers of Lübeck (as already pointed out), should also be included. Thus, the real domestic share of shipping amounted to about a third. However, the rapid growth of foreign shipping in the following years, as well as the lack of growth of domestic tonnage, reduced this share back to about a quarter. 74
No reliable statistics for the Lübeck merchant fleet exist for the late eighteenth century. Rough estimates, however, can be made by consulting the published port statistics and the Lübeckische Anzeigen's shipping news. In 1800–1801, Lübecan and ‘Russian’ ships recorded a total of 232 arrivals and 254 departures on average. 75 It seems realistic to suppose that ships on normal Baltic routes made two round voyages a year, while those sailing to French ports or beyond (21 arrivals and 25 departures) managed only one. Such simple arithmetic yields a rough estimate of 136 arriving and 152 departing vessels. The shipping news in the Lübeckische Anzeigen, again, recorded about 170 different ships in 1800, but these, of course, included an unknown number of foreign vessels. Supposing that almost all (112) ships in the Russian trades, as well as half of those sailing to Danzig, East Prussian and Prussian ports (29 vessels), were Lübecan, a conservative minimum for the domestic general cargo fleet sailing in the Baltic would be about 130 vessels. Since most long traders sailing to France and beyond were not mentioned in the shipping news, these 20–25 ships should be added to the figure, as well as an unknown number of those departing in ballast or sailing with bulk cargo. Such additions would result in a total fleet of at least 155–160 ships, which agrees fairly well with the estimation deduced from the departure statistics. According to Lübeck's ‘Schiffsbuch’, the average size of newly built vessels in the 1790s was about 60 German Kommerzlast. 76 Supposing that this was the average of the actual fleet, the total Lübecan tonnage amounted to around 9,000–9,500 lasts. As the German last was a somewhat bigger unit than the Swedish last, this figure would correspond to about 11,000–12,000 Swedish lasts or 21,000–22,000 British tons. 77
Unfortunately, the first years of the nineteenth century are the only dates for which this kind of estimation is possible; for earlier periods, no reasonable data seems to be available. Of course, the growth of traffic in the port of Lübeck suggests that there may have been some domestic tonnage growth as well. In this respect, the most interesting sector is shipping to Russian ports. As it was dominated by Lübeck ships, it had at least a moderate correlation with tonnage development. As Figure 3 illustrates, arrivals from Russian and Courland ports show an undeniable trend of growth. Because of strong short-term fluctuations (in particular for Riga) and the resultant large margin of error, a meaningful average rate of growth cannot be estimated, but a specific pattern of development can still be discerned. Between the early 1790s and about 1800, there seems to have been rather rapid growth (something like five per cent a year on average), while in the 1760s, 1770s and 1780s the rate must have been much slower (probably less than one per cent a year). However, since Lübeck experienced an unusually strong shipbuilding boom in the 1740s, it seems possible that, in the 1750s, the city's merchant fleet may have comprised about 100 ships and – as the average size of new ships then was already about 60 lasts – a total tonnage of around 6,000 (German) lasts. 78
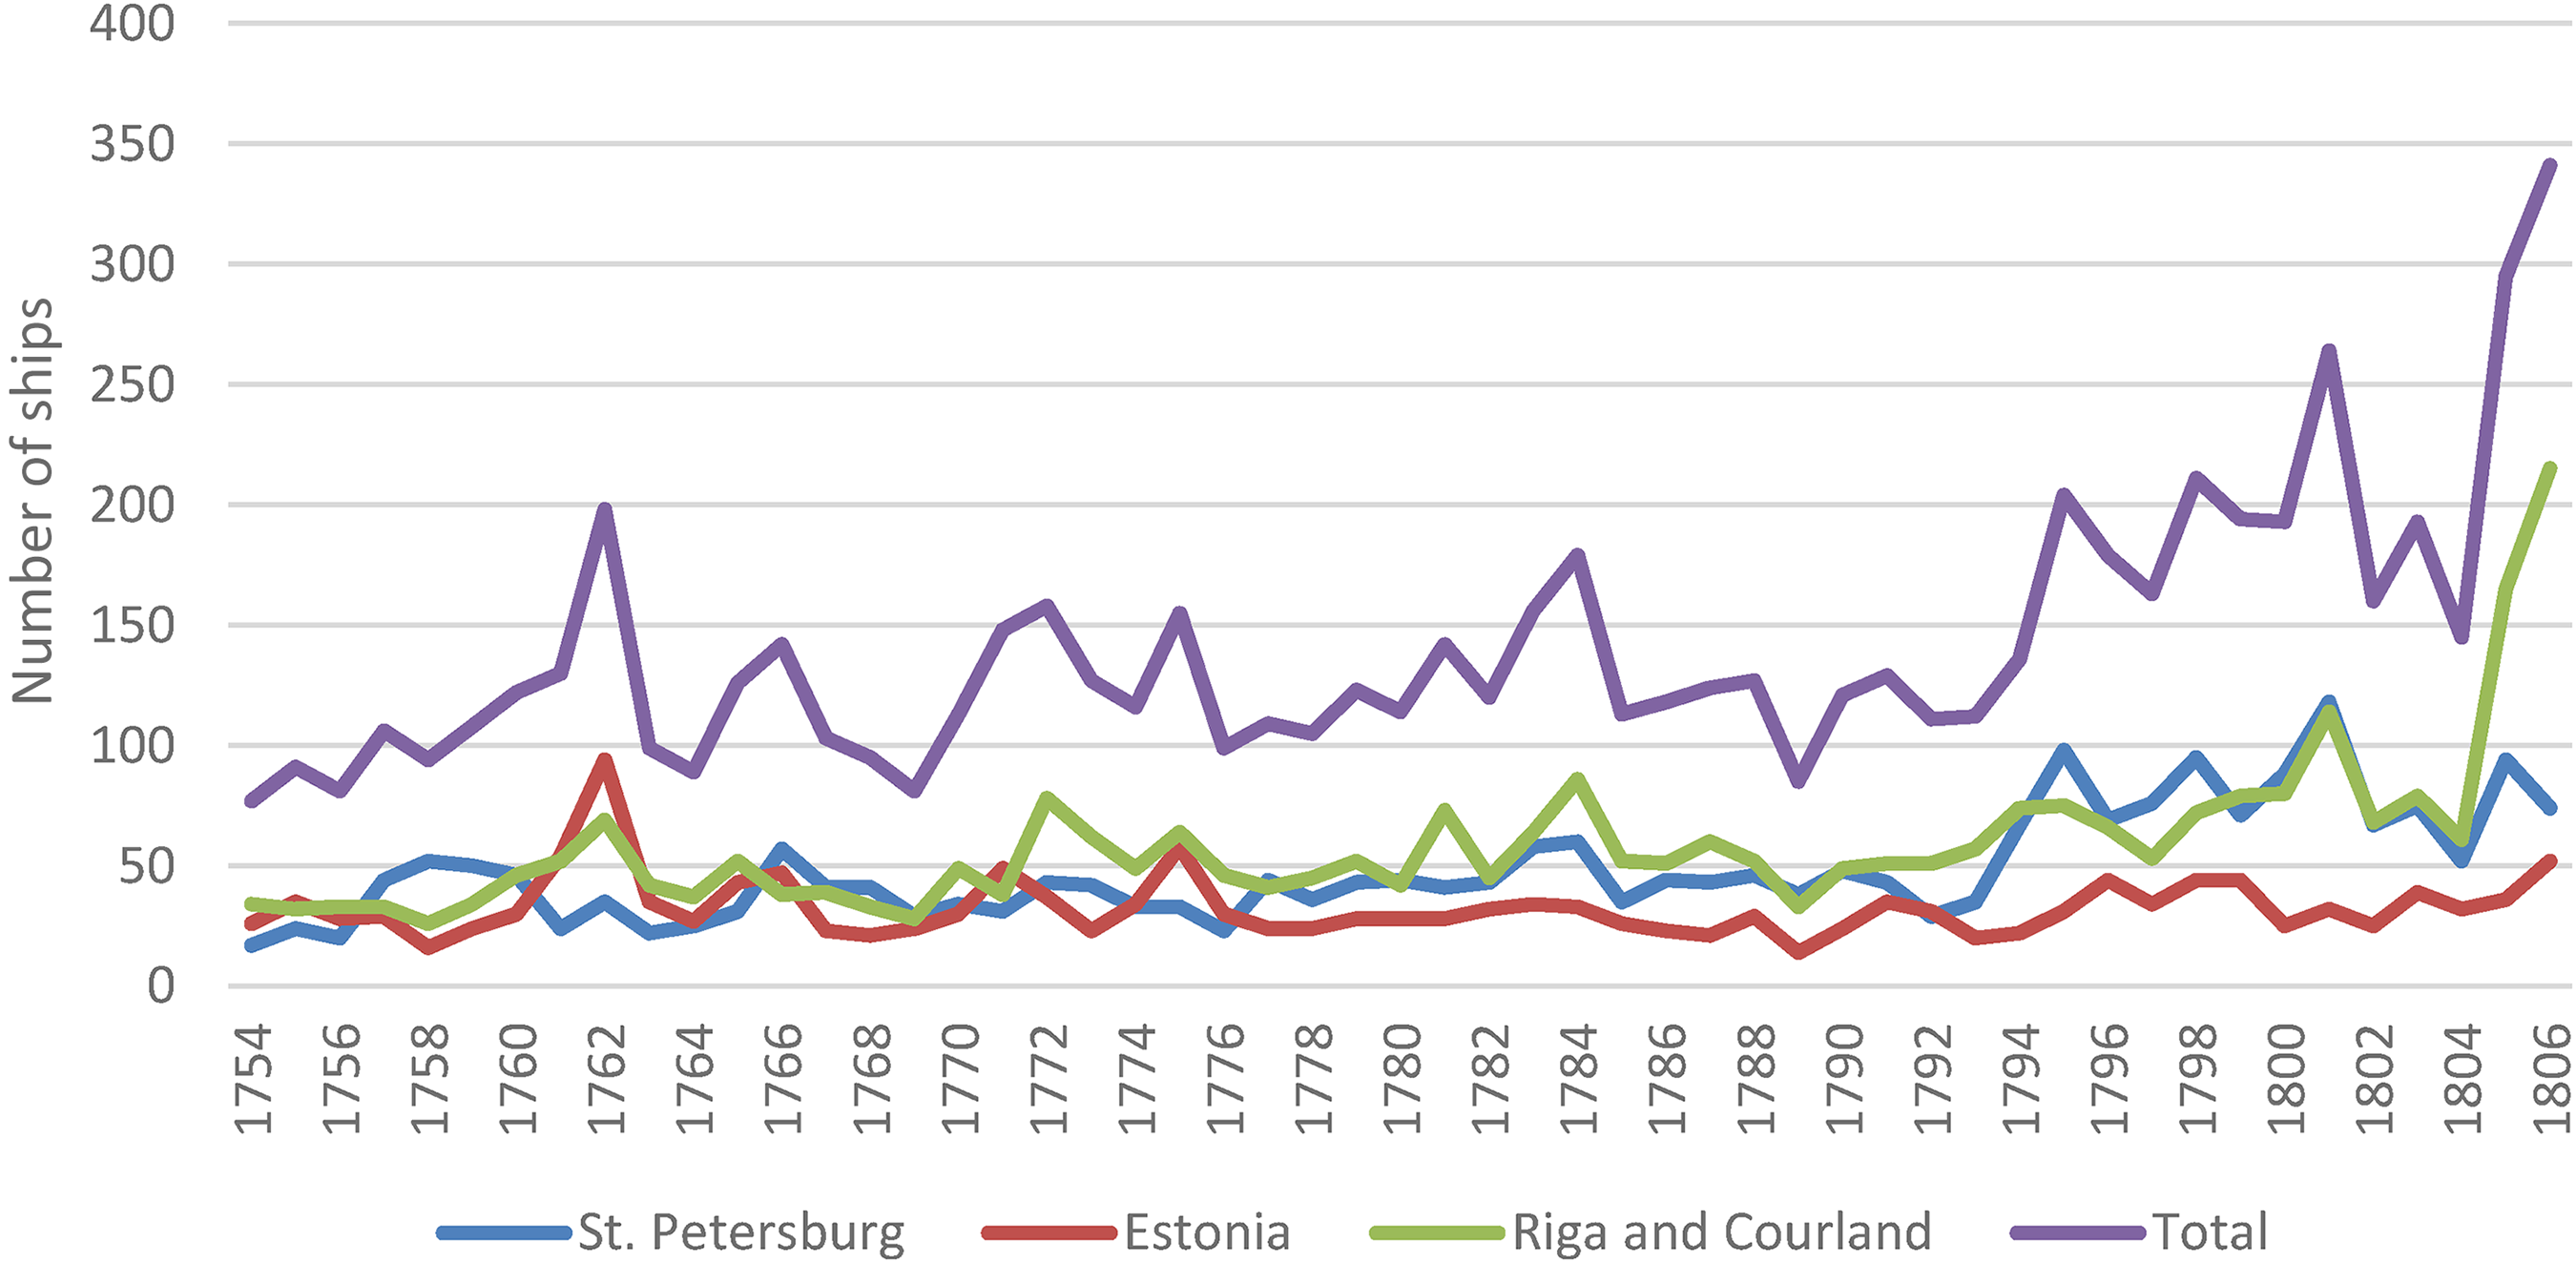
Arrivals at Lübeck from Russian and Courland ports, 1754–1806.
As substantial as the merchant tonnage of Lübeck was around 1800, it could not quite match that of some of the other Baltic centres of the shipping industry. Very probably, Copenhagen was the biggest: in 1806, its merchant navy counted about 400 vessels and a total tonnage of 25,500 (Danish) lasts (over 50,000 British tons). 79 The capital of Sweden, Stockholm, was a good runner-up, having in 1803 almost 250 ships with a total capacity of 14,600 Swedish lasts (almost 27,000 British tons). Even Gothenburg recorded 142 ships and over 13,000 lasts, and Flensburg (in the Duchy of Schleswig) almost 300 vessels at close to 15,000 lasts. On the other hand, Lübeck's merchant fleet seems to have exceeded the largest fleets in Swedish Pomerania – those of Barth (8,090 lasts) and Stralsund (6,260 lasts). 80 Interestingly, the average compound growth of tonnage per year seems to have been as fast or slightly faster in Lübeck than in Sweden (excluding Finland and Pomerania); however, in the case of Lübeck, most of the growth was accumulated during the two decades before the French occupation. 81
Basically, it is not surprising that a port city of 25,000 people had a smaller merchant navy than capitals of 100,000 (Copenhagen) and 75,000 (Stockholm) inhabitants. 82 Against this backdrop, it could even be said that Lübeck was moderately successful. Moreover, compared with its population size, Lübeck had an exceptionally busy port. In the 1760s, its foreign-trading throughput (arriving and departing traffic) seems to have been roughly at the same level as that of Stockholm, but while the latter grew only marginally, traffic in Lübeck (as already seen) increased briskly from the 1780s. At the end of the century, the port (excluding coastal shipping) recorded 650–700 arrivals as well as departures (or a total throughput of about 80,000 lasts) and, during the last boom, both traffic figures approached 1,000. Accordingly, they exceeded the corresponding volumes of shipping in Stockholm (about 56,000 lasts in the late 1790s) by a clear margin. 83 At that time, the port of Lübeck seems to have been a good match for even Copenhagen – at least if we only account for ships in foreign trades. 84
That a smallish city could support port traffic on such a scale can be explained simply by the fact that two-thirds, or more, of the ships were non-Lübecan visitors. Such significant participation of other flags in the city's maritime transports allowed local merchants to expand their import, export and trans-shipment operations without incurring the capital costs and running expenses of employing their own ships. This differed substantially from Danish and Swedish strategies: Copenhagen and Stockholm, and even many smaller ports, built big merchant fleets, which not only carried the bulk of their foreign trades but also participated actively in international transports. To be successful, the Lübecan strategy, of course, required that the port could attract sufficient numbers of prospective carriers, and that was – even in times of peace – guaranteed by the scope and intensity of the city's traditional shipping networks. Accordingly, Lübeck can be rated as an important and successful entrepôt, a distribution and trans-shipment centre, and was obviously more successful in this capacity than as a shipowning port. As an entrepôt, it may have been on a par with Copenhagen. While the Danish capital was an important re-exporter of West Indian and Far Eastern products, the numerous Danish provincial ships imported many everyday consumer goods from Lübeck. 85
IX
Compared to its Late Medieval heyday, Lübeck had, of course, experienced a relative decline, falling in the shadow of ports like Amsterdam and Hamburg. However, this does not necessarily mean that its tonnages, or volume of traffic, had fallen into actual decline. 86 Reliable quantitative data only exists for the late seventeenth century: in 1672–1691, according to a number of Zulagezoll accounts, almost 1,600 vessels on average arrived in the port of Lübeck. This figure, however, also included no less than 900 small coasters and boats from Denmark and Schleswig-Holstein (plus an unknown number of similar coastal craft from Mecklenburg and Wismar), which suggests that the number of arrivals of ships on longer trades must have been around 500–600. This seems to have been a fairly prosperous era for the city – ‘a recurrence of old hanseatic times’ – and, indeed, 500–600 was as high a number as, or even a higher number than, the corresponding figures in the late eighteenth century. 87 However, the overall tonnage of non-coastal ships amounted to less than 19,000 lasts, which means that their average size was only about 30 German lasts (or over 35 Swedish svår läst). 88 As the typical averages around 1800 seem to have been over twice this (around 60 German or 75 Swedish lasts; see note 78), it seems certain that overall tonnages at the port of Lübeck had grown impressively from the late seventeenth century.
On the other hand, these two data sets reveal remarkable long-term continuity. First, the northern and north-eastern sectors were strong in both the late 1600s and the latter half of the eighteenth century: excluding coastal traffic, Sweden, Finland and the north-eastern coasts of the Baltic attracted over half of Lubecan shipping in both cases, while the share of Prussia and Germany (or deutsche Ostseehäfen ) was less than a quarter. Arrivals from French and Iberian ports in the late seventeenth century may have exceeded the late-eighteenth-century numbers, but Dutch and British vessels were equally rare in both periods. 89 Thus, Lübeck's overwhelmingly north-east Baltic orientation was a permanent feature.
However, there was one striking difference: the proportion of coastal shipping was much smaller in the eighteenth century than 100 years earlier. From over 900 arrivals, the number had shrunk to about a third. Such a radical decline may have resulted from an increase in the typical size of coastal vessels, but stagnating demand may also have been a contributing factor. The main commodities brought by these small vessels were simple everyday consumer goods such as grain, fish or firewood, and as the population growth was very slow – in fact, Lübeck's population decreased from the late seventeenth to early eighteenth century – the local demand for such goods was not able to support expanding coastal shipping. 90
Compared with the conclusions drawn in this study, a very different picture of Lübeck was presented by the Swedish economic historian Erik Lindberg in an article published in 2009. Lindberg aimed to explain why early modern Lübeck and Danzig ‘failed’ and ‘followed paths of stagnation and decline’. The premise of failure and stagnation was verified solely by the demographic development of the cities, and the analysis was carried out despite ‘the unfortunate absence of trade statistics and other data’. 91 At least as far as Lübeck is concerned, empirical data on shipping and trade can actually be found, and it does not support any signs of failure and decline.
Footnotes
Declaration of conflicting interests
The author declared no potential conflicts of interest with respect to the research, authorship and/or publication of this article.
Funding
The author received no financial support for the research, authorship and/or publication of this article.
Author biography
Yrjö Kaukiainen is Emeritus Professor of European History (previously of Economic History) at the University of Helsinki and a former President of the International Maritime Ecomis History Association. His research has focussed, in particular, on the history of shipping in the eighteenth, nineteenth and twentieth centuries, as well as the history of information transmission in the nineteenth century.