
Abstract
In the late eighteenth century, Copenhagen was the second biggest urban centre in the Baltic Sea area. Its port was both an international terminal and the paramount shipping centre of the Danish–Norwegian monarchy. In the 1750s, over 80 per cent of arriving ships still came from the different parts of the monarchy, but this proportion diminished gradually to two-thirds and, in terms of tonnage, foreign vessels probably accounted for about 60 per cent of the incoming cargo at the beginning of the nineteenth century. Traffic in the port of Copenhagen grew slightly faster than overall shipping through the Danish Sound and, at the end of the period, Copenhagen was, on a par with St. Petersburg, one of the busiest ports in the Baltic Sea area. Its role in the commodity flows between eastern Baltic ports and western Europe remained modest, but in several other trades it became more closely integrated with international shipping.
I
The premodern expansion of northern European shipping gave Copenhagen a first-class logistical position, alongside a maritime passage that rapidly grew in importance. Just 20 nautical miles to the north, at Elsinore (Helsingør), all ships sailing through the Danish Sound had to stop in order to pay a toll to the Danish Crown. While these dues became the monarchy's most important source of income, they did little to attract foreign ships to the port of Copenhagen – at least that was not what the Danish government aimed at. In the eighteenth century, many maritime nations, following the example of the British seventeenth-century Navigation Acts, still tried to protect and promote their own shipping by restricting the trading rights of others. The Nordic monarchies of Denmark and Sweden also had their own ‘navigation acts’. 1
In the middle of the eighteenth century, Copenhagen was not only the capital of the Danish–Norwegian realm. With a population of about 80,000 (1769), 2 it was the biggest urban centre in the whole of the Baltic area except for St. Peterburg, which passed it only in the 1740s. In those times, the monarchy also ruled the North Atlantic possessions of the Faroe Islands, Iceland and Greenland, as well as a few West Indian islands, trading posts and forts in West Africa, and small colonies and trading stations on the Indian subcontinent. The economic exploitation of these possessions and colonies was – in typical European fashion – implemented by more or less monopolistic Crown-sponsored trading companies (the Asiatic Company, West India and Guinea Company, and Icelandic Company). After the 1750s, some liberalization of the company system took place, in particular concerning the Atlantic companies, but trading in the colonies or possessions remained forbidden for foreigners. 3 The seats of these companies were in Copenhagen and most of the investors were wealthy Copenhagen merchants. Thus, it is no wonder that Copenhagen had a totally dominant position in Danish shipping. According to an estimation for 1787, its merchant tonnage was almost three times larger than that of all other Danish seaports combined, 4 and of all arrivals in Denmark recorded in the Sound Toll registers, Copenhagen’s share fluctuated between 75 and 85 per cent. 5
In the eighteenth century, the former hegemony of the Netherlands was fading and, gradually, British shipping gained an upper hand in the Baltic. Even the Danish–Norwegian monarchy was one of the rising maritime powers: according to an estimation of 1786–1787, its merchant tonnage was probably the fourth largest in Europe after Great Britain, France and the Netherlands. 6 Such a success story has naturally inspired Danish historians and, accordingly, eighteenth-century shipping has been an important topic in Danish economic history. A common challenge for the study of European shipping before the nineteenth century has been the scarcity of easily available and reliable tonnage data, and Denmark is no exception. 7 On the other hand, Danish research has benefitted from excellent sources of another type – above all, the so-called Algerian sea passes, which record, since 1747, all Danish (and Norwegian) ships destined to the seas south of Cape Finisterre (at the north-west corner of Spain). 8 Moreover, Denmark has a series of Sound Toll registers, which contain data on all traffic through the Øresund from the late fifteenth century to 1857. Sections of this data were published as printed tables between 1906 and 1953; however, the tables did not proceed beyond the year 1783. 9 Subsequently, the development of new computer technology made it possible to continue publishing the tables in a new and more comprehensive format: in the early 1970s, a project to computerize the Sound Toll registers between 1784 and 1795 began at the University of Odense. This project continued until the early 1980s and the new database was introduced in a concise book, containing both source criticism and fundamental analyses, by the initiator and leader of the project, Hans Chr. Johansen. 10 The Odense Sound Toll database was designed in an era before the Internet and could only be accessed via Danish Data Archives (until a revised Internet version appeared). The present Sound Toll Registers Online (hereafter, STRO) is thus a vast improvement, not only because it can be easily exploited online but, above all, also because it comprises all of the data from 1429 to 1857. 11
The vast amount of STRO data also offers new opportunities for the study of Danish shipping in the eighteenth century. Not only does it allow the charting of voyages of Danish ships that did not sail south of Cape Finisterre, but it also makes it easier to set Copenhagen shipping (as well as that of Denmark) in a wider international context. Earlier Danish research has, quite naturally, focused on the development of the national merchant navy, while interest in shipping movements at a more general level seems to have been modest. Moreover, the general picture of Danish eighteenth-century shipping still contains a few gaps and shortcomings. 12 Thus, there has been an emphasis on longer trades – obviously reflecting the source situation − while shorter-range shipping and, in particular, Baltic connections have been observed somewhat briefly and less systematically. For example, the only overall figures for Danish shipping movements are those published by the Odense Sound Toll project for the years 1784–1795. It can also be claimed that the established picture of tonnage development, presenting the 1750s and 1760s as a stagnant period and the times after about 1775 as florissante (‘flourishing’ – a term used by Ole Feldbæk), has been based mainly on second-hand tonnage data, which cannot be regarded as reliable. In this respect, a notable exception is the high-quality tonnage estimations for 1787 from the Odense project. 13
Aiming at the wider international context referred to above implies that, in this study, Copenhagen will not be regarded primarily as a shipowning centre but rather as a terminal of national and international maritime trades. Its situation on the Danish Sound, the meeting zone of the Baltic and North Sea areas, made it an ideal place for participating in the commodity flows from eastern Baltic ports to western Europe – as well as the respective countercurrents. On the other hand, being the capital of a maritime and colonial realm, it was also the mercantilist centre of intra-monarchy shipping connections. Therefore, one of the most interesting questions concerns how Copenhagen managed to combine such different functions: Did Copenhagen develop into an active participant in international maritime trades or did it remain a passive door watch, mainly husbanding its position as the centre of an early modern thalassocracy. Moreover, last but probably not least, another important factor must be accounted for: the domestic markets of the metropolis.
This article examines the relative importance of these elements in the development of Copenhagen shipping between 1750 and 1806, looking at their major implications for the entire Danish maritime sector. As a matter of course, the first step towards such an analysis consists of creating a reliable and comprehensive quantitative data set of shipping movements in Copenhagen (see the following section and Tables 1a–1c and 2). Such new evidence will constitute the foundation of this study.
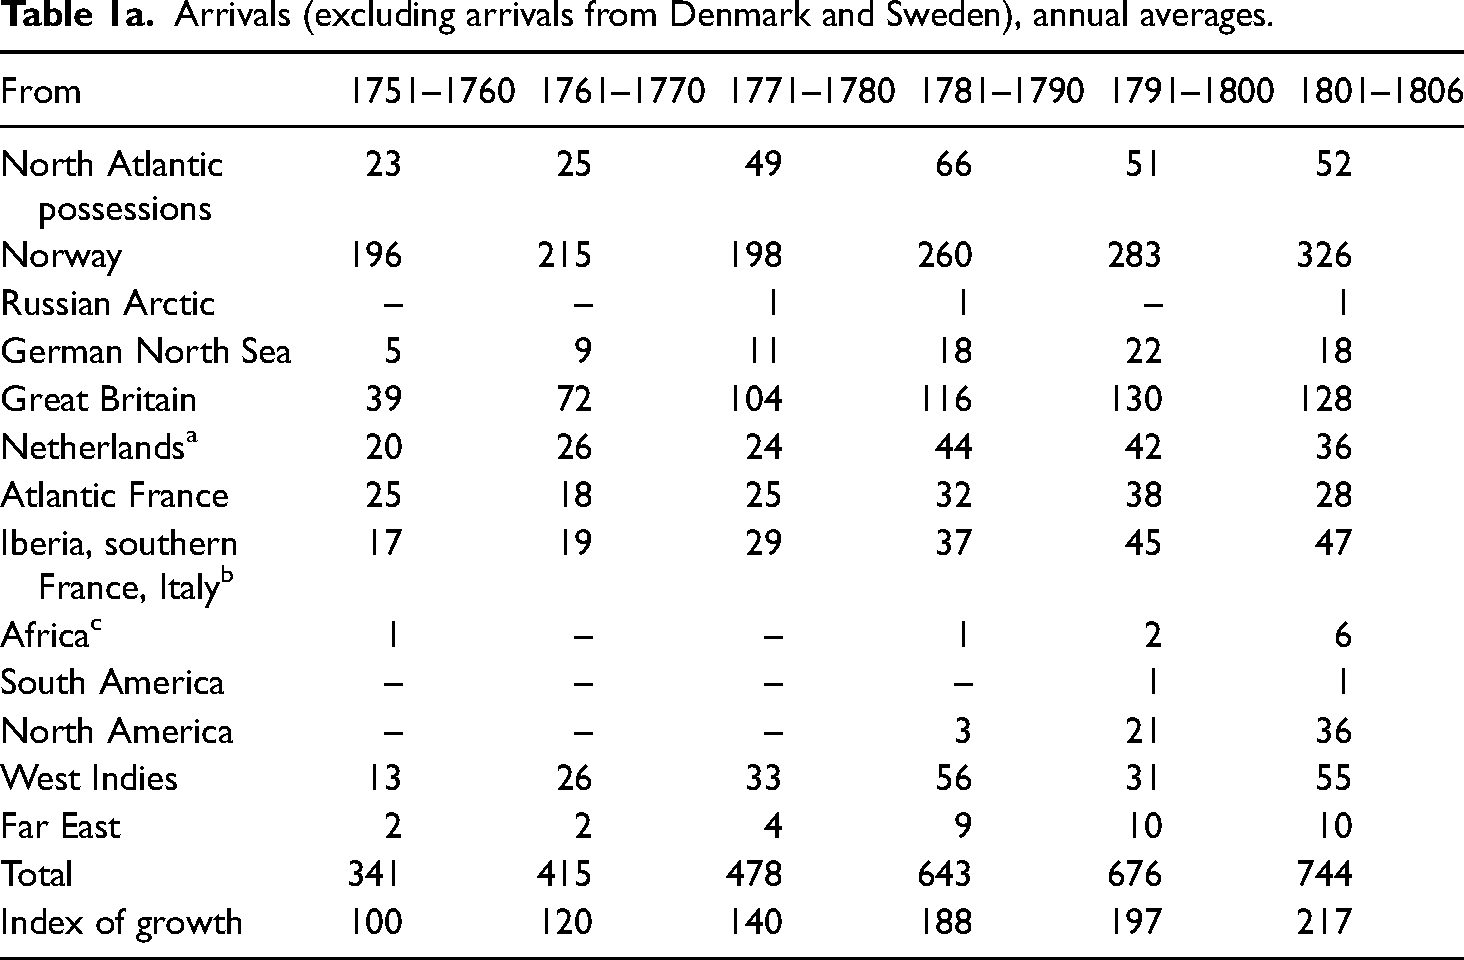
Arrivals (excluding arrivals from Denmark and Sweden), annual averages.
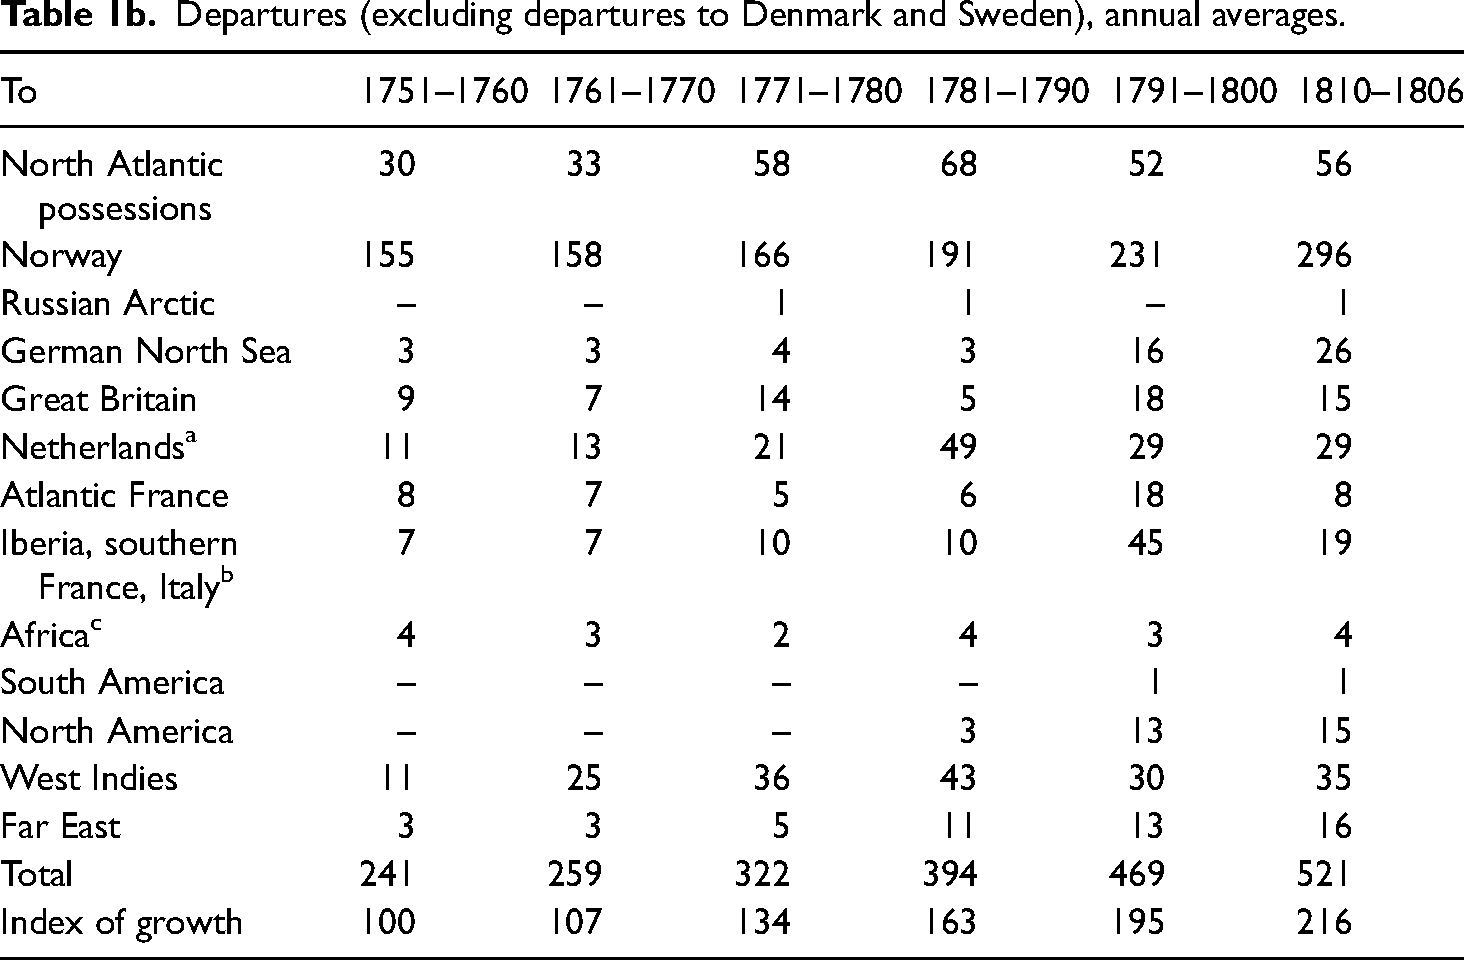
Departures (excluding departures to Denmark and Sweden), annual averages.
Percentage distribution of arrivals in Copenhagen: Sectors A–C and selected regions.
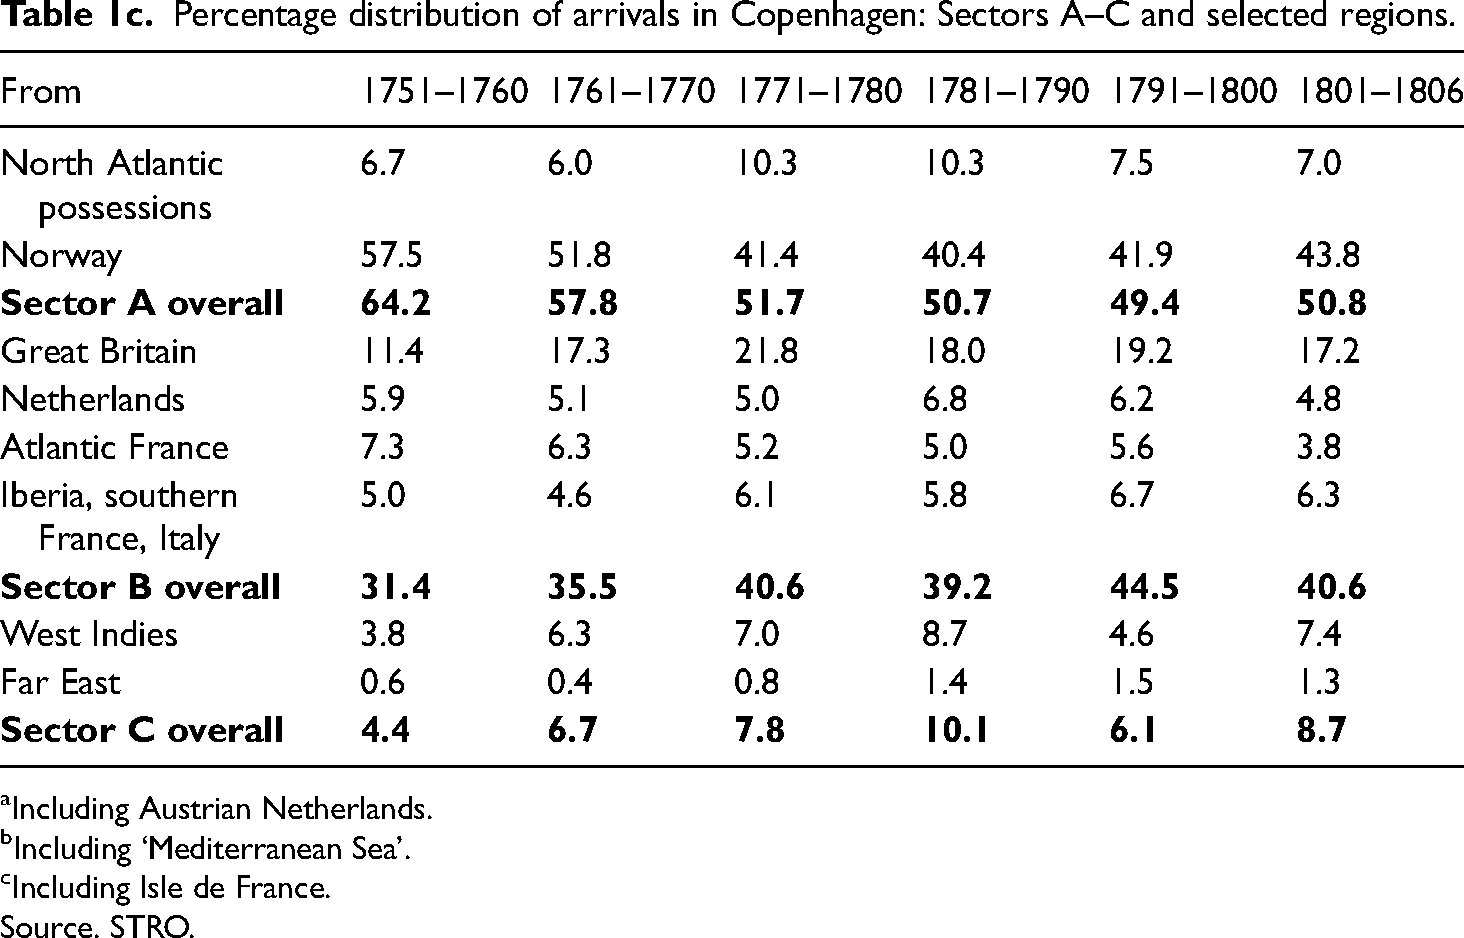
Including Austrian Netherlands.
Including ‘Mediterranean Sea’.
Including Isle de France.
Source. STRO.
Arrivals in Copenhagen, estimated tonnages (Danish commercial lasts).
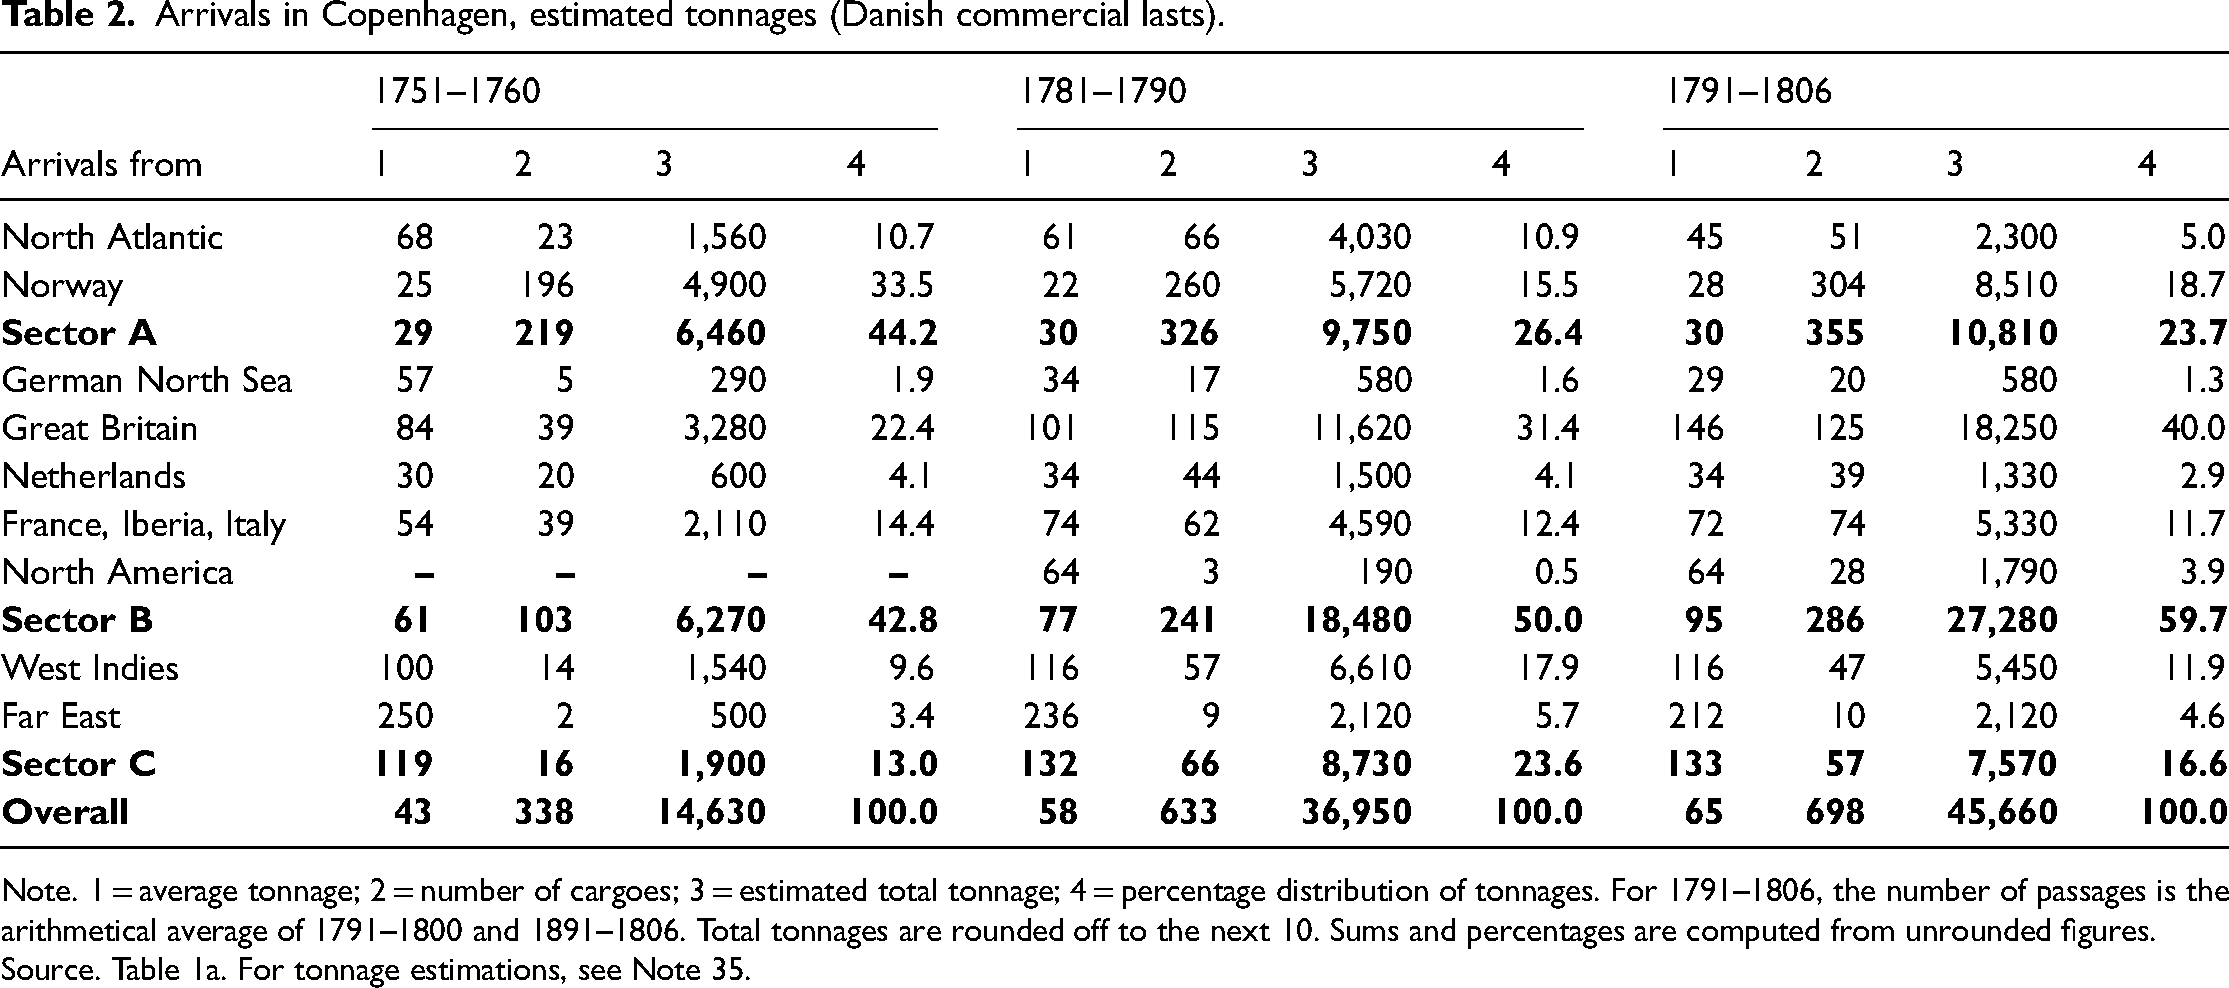
Note. 1 = average tonnage; 2 = number of cargoes; 3 = estimated total tonnage; 4 = percentage distribution of tonnages. For 1791–1806, the number of passages is the arithmetical average of 1791–1800 and 1891–1806. Total tonnages are rounded off to the next 10. Sums and percentages are computed from unrounded figures.
Source. Table 1a. For tonnage estimations, see Note 35.
II
The Sound Toll registers offer a first-class view of Copenhagen's shipping and the proximity of Elsinore implies that the toll station exercised tight control over shipping movements north of the capital. The reliability of these records has been discussed extensively across several decades; the common understanding seems to be that the data does not suffer from numerous or serious defects. 14 Since the establishment of the huge STRO database, it has become easier to use the records, in particular as the user interface offers powerful tools for searching, classifying and combining different types of data. A few caveats should still be kept in mind, however.
First, recording and downloading old handwritten data, particularly on a scale such as this, is a process that is impossible to accomplish without making mistakes; in addition to misreading, coding errors are possible – for example, it has been found that sometimes a westward voyage has been interpreted as an eastward one and vice versa. 15 Such errors may be detected by comparing (when possible) a query result with the corresponding data in the printed Sound Toll tables; of course, the best, but more arduous, option is to check the individual voyage records for obvious inconsistencies between departures/destinations and cargo. Even with perfect data, problems will be caused by the irregular orthography of geographical names, often complicating regional classifications. However, the STRO database offers an extremely helpful tool in the form of standard geographical names that are linked with all known name variables and also collected under the umbrellas of ‘small regions’ and ‘big regions’. Unfortunately, at the time of writing, neither of these umbrellas was functioning correctly, 16 which means that a lot of the data could only be accessed at the level of individual ports. Moreover, the standard STRO names may differ from modern standards, as well as from the port names recorded by the Odense Sound Toll database. 17
The geographical scope of the STRO data has a couple of limitations. First, it records domestic (Danish) shipping only sporadically. Even more restricting is the fact that the Elsinore toll station was not able to trace ships after they left Copenhagen for Baltic destinations, nor did its information systems cover arrivals at the capital from such eastern ports. Some of the missing eastbound ships can be caught if they sailed later to destinations west of the Sound, but vessels staying within the Baltic remain totally invisible. Fortunately, this lopsided picture can, at least to some extent, be supplemented with another type of source material, which is able to present a more panoramic view of Copenhagen shipping.
In the eighteenth century, newspapers started to be published in many cities around the Baltic Sea and, typically, they printed lists of shipping movements in their ports. The first Danish newspaper, Kiøbenhavnske Danske Post-Tidender (1749–1762) – a forerunner of the well-known Berlingske Tidende − followed suit from the beginning with lists of arrivals and departures in the port of Copenhagen. 18 In addition to the skippers’ names and ports of departure or destination, a brief description of the cargo was recorded for arriving vessels. Unfortunately, the newspapers did not regard this data as very important – in fact, shipping lists were quite often omitted if other more important news demanded space. This concerned lists of departures in particular and resulted in substantial gaps that make it difficult to collect comprehensive annual data. The publishing of shipping lists was discontinued in the autumn of 1755 but, fortunately, interest in shipping news resumed after the newspaper was given a new title (De til Forsendelse med Posten allene privilegerede Kiøbenhavnske Tidender, 1762–1808) and slightly revised layout. It started printing weekly and, subsequently, monthly and annual statistics of ships and their cargoes in the port, and in 1765 a regular series of ship lists began again. This time, the lists were edited more meticulously than in the 1750s: for a number of years, there were few gaps in the data, albeit that it was, unfortunately, rationalized by omitting all information on cargoes. The consistency of the data gradually grew worse, again concerning departures, and the number of gaps increased. In the autumn of 1771, shipping news was again put aside, and this decision was not reversed in the eighteenth century. 19 Thus, the chronological scope of these sources falls regrettably short; notwithstanding, they can reveal valuable information about the structures and economic realities of the Baltic, as well as coastal trade connected with the port of Copenhagen.
III
The Sound Toll registers reveal that, between January 1751 and December 1806, almost 32,000 vessels sailed from the North Sea to Copenhagen. They came from a wide area, stretching from Archangel and Spitzbergen in the north to South America in the south-west 20 and China in the Far East. The registers also demonstrate that the traffic grew substantially across these 56 years: in the 1750s, the annual number of arrivals fluctuated at around 330 and 380, while at the beginning of the nineteenth century it was approaching, and once even exceeding, 1,000. 21
This development, however, was far from steady or regular; on the contrary – it is characterized by a number of dramatic fluctuations (see Figures 1a and 1b). Certainly, it must be kept in mind that the numbers of voyages are more sensitive to business cycles than tonnages (and, moreover, the linear scale of the figures exaggerates the relative differences, particularly at the upper end of the scale). Notwithstanding, the overall picture does not present any smoothly progressing economic growth and the figures do not tally too well with the development of tonnage, as presented by the earlier historiography. 22 On the other hand, the data confirms the established view of major fluctuations being connected with years when war was disturbing the normal conditions of maritime trade. As Denmark managed to stay outside all these conflicts, its shipping was able to profit from its neutral status. 23 During the Seven Years War, such profits seem to have been fairly moderate, but they at least sufficed to break the earlier downward trend. A much bigger boom was occasioned by the American Revolutionary War (1775–1783): the Danish neutral flag attracted rapidly increasing trade after 1778 when France made an alliance with the rebelling American states, thus falling into war with Great Britain. An even faster growth in shipping was experienced during the Anglo-Dutch naval conflict (December 1780 to January 1783), which eliminated an important competitor for a couple of years.
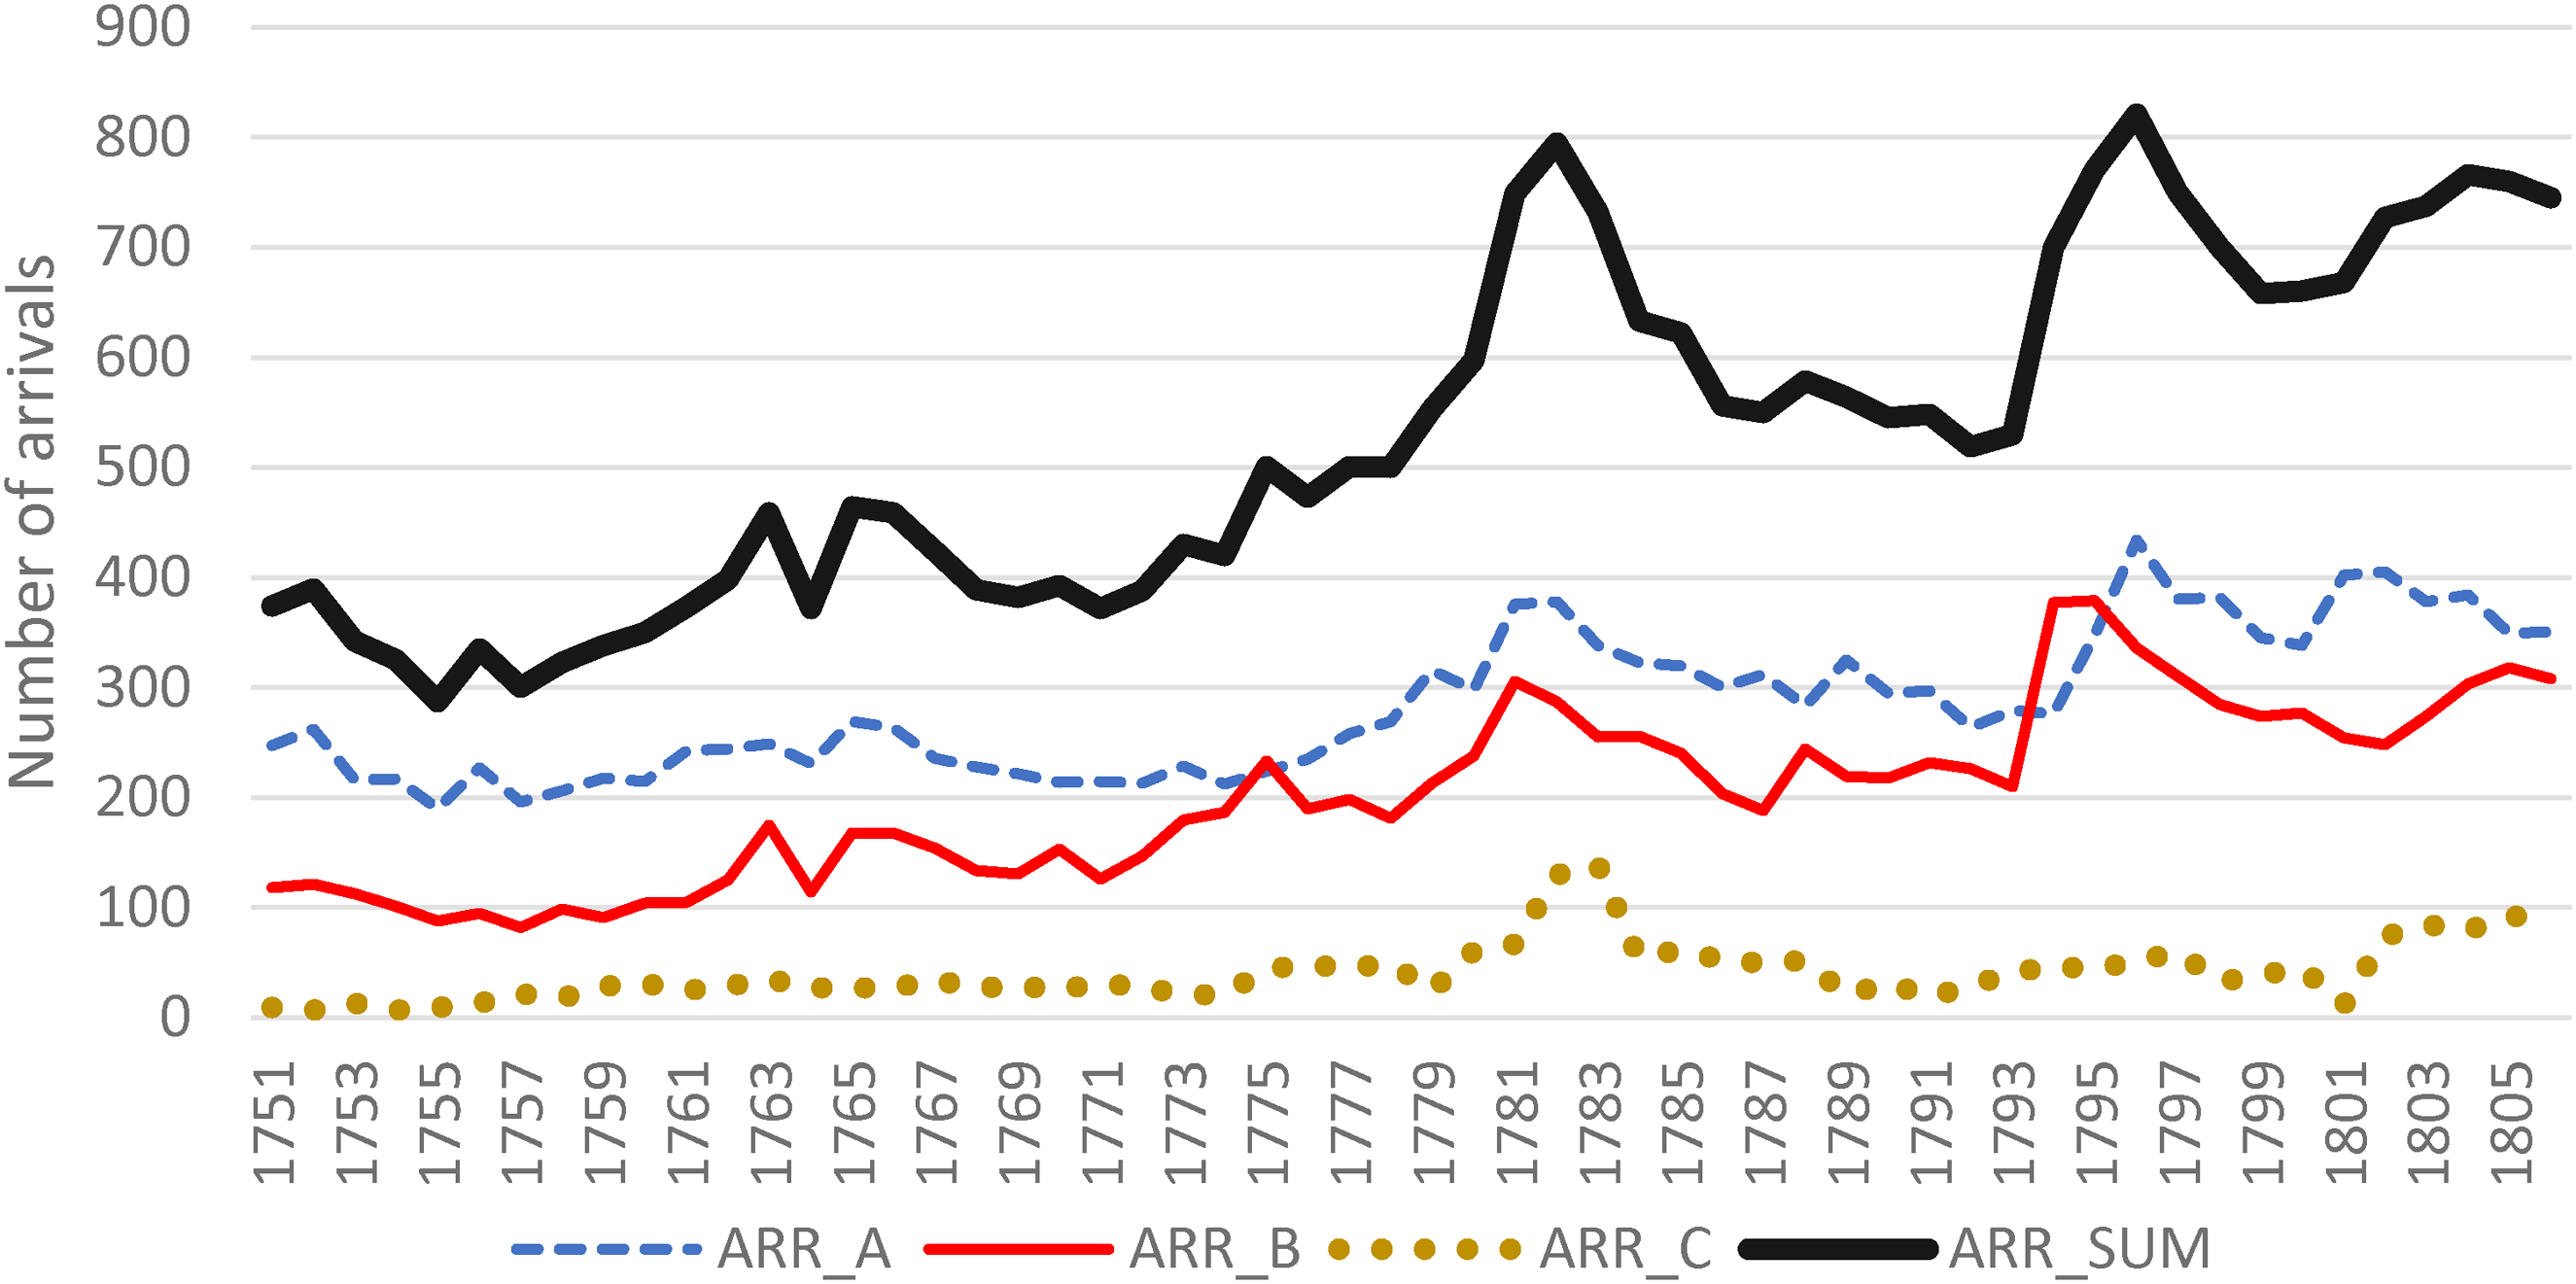
Sound Toll data, arrivals in Copenhagen, 1751–1806 (excluding arrivals from Denmark and Sweden).
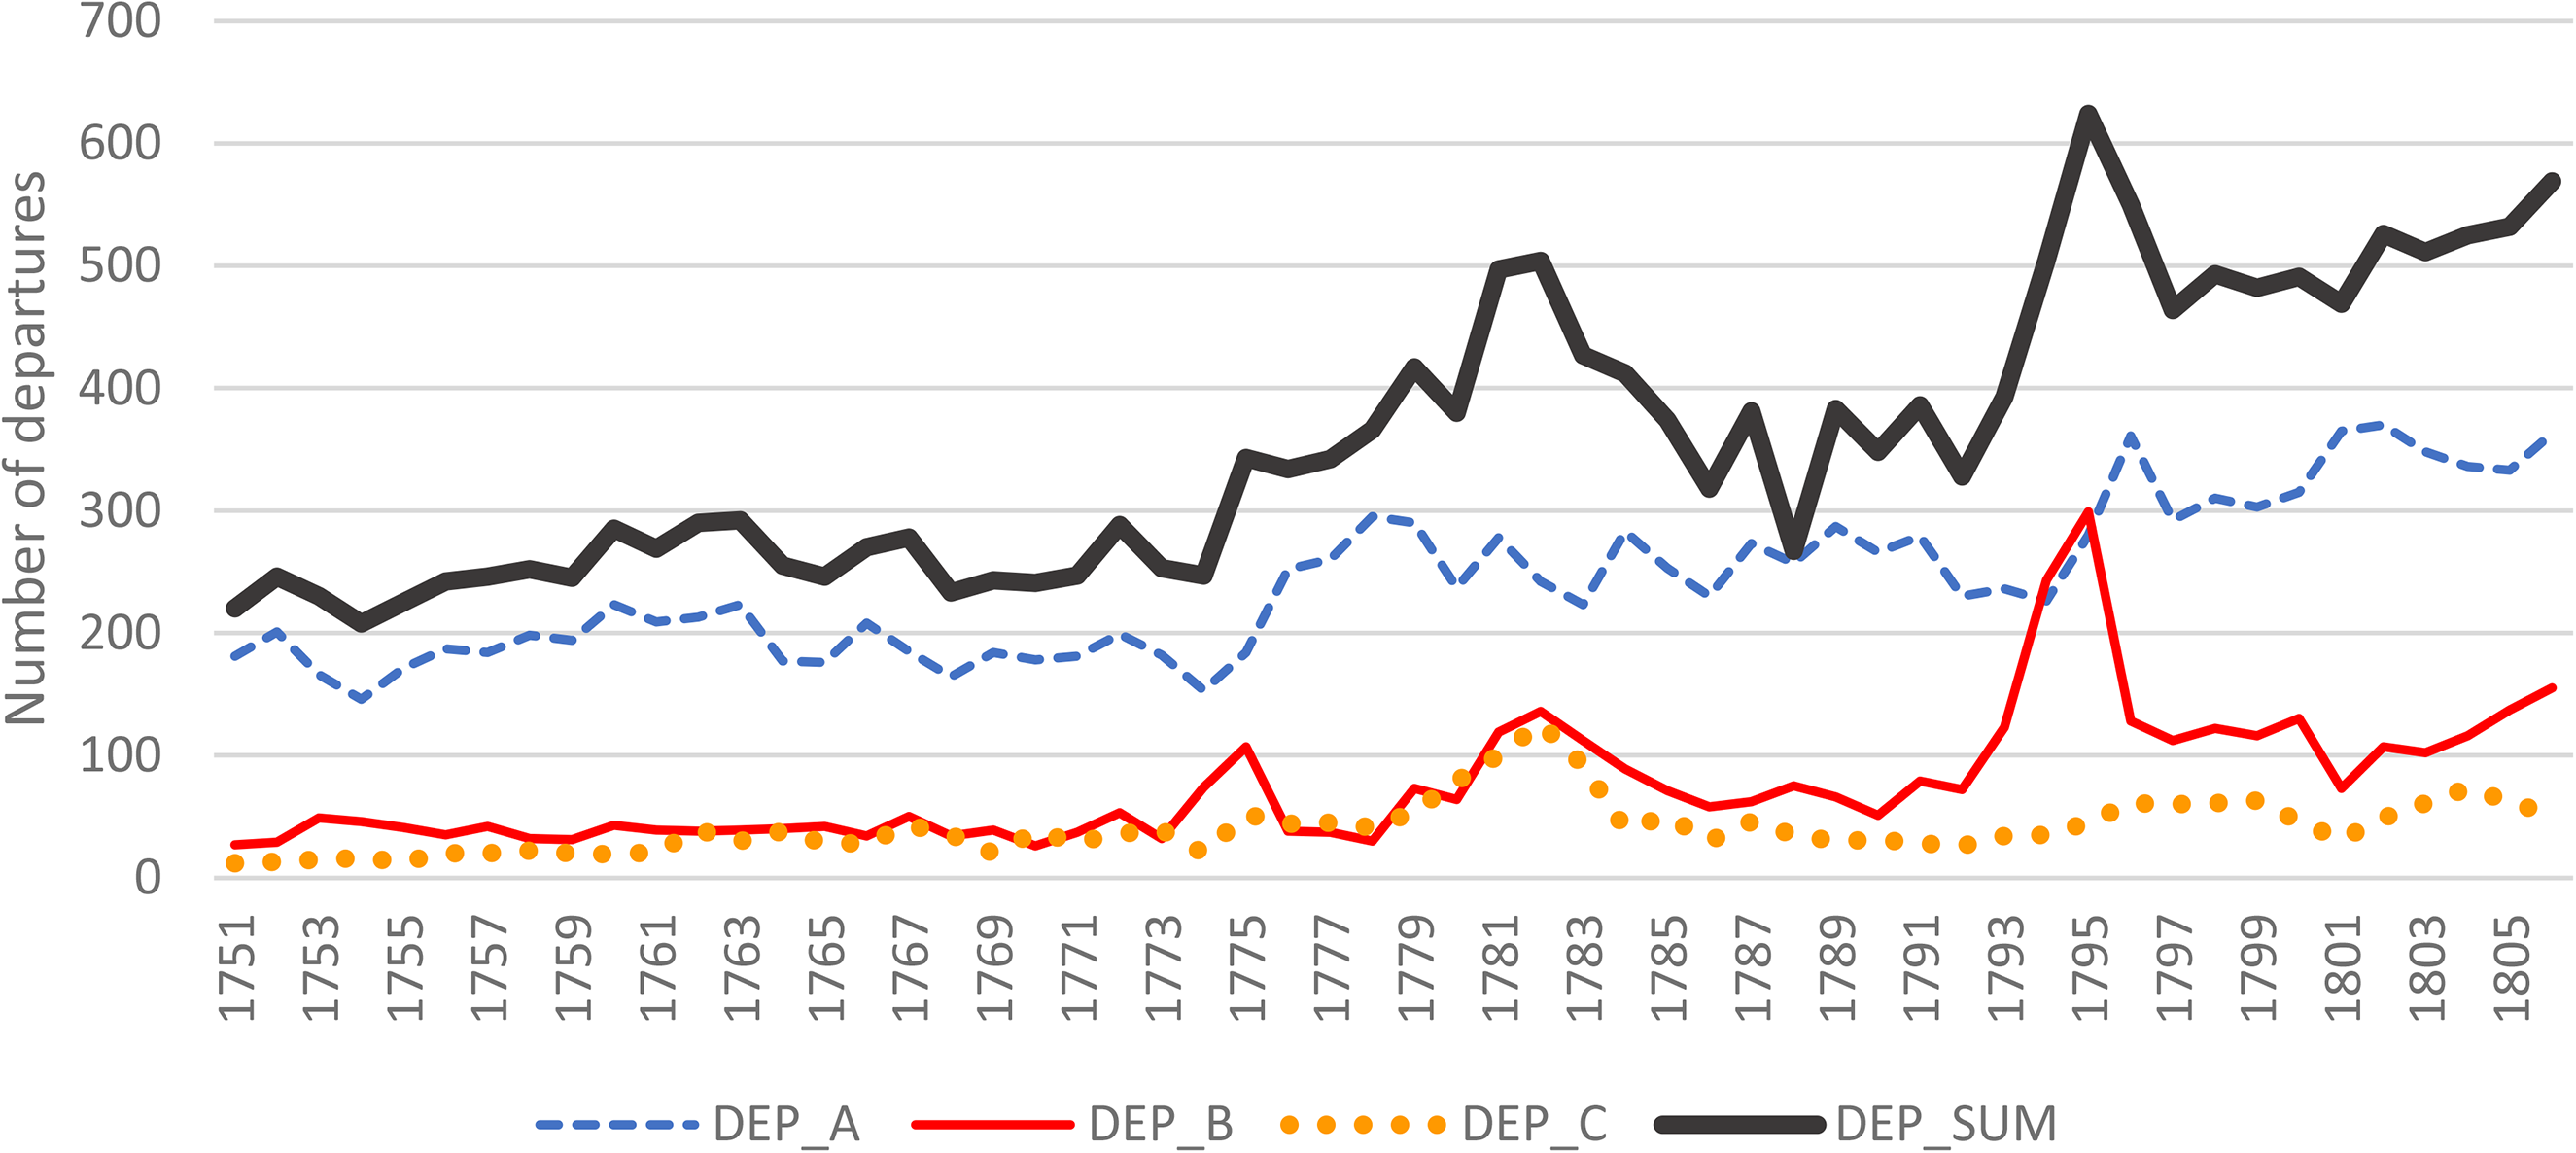
Sound Toll data, departures from Copenhagen, 1751–1806 (excluding departures to Denmark and Sweden).
If the boom was spectacular, the following crash was almost as dramatic: in a few years, arrivals in Copenhagen had declined by almost a third. The meagre times only ended with the outbreak of the French Revolutionary Wars, when the British navy started to blockade French ports (1793) and the Danish neutral flag became a valuable asset once again. Moreover, when the French advanced into the Austrian Netherlands in 1793–1794 and, in the following year, invaded the Dutch Republic – after which Dutch ships practically disappeared from international shipping – one of the beneficiaries was Denmark. 24 Of course, the war eliminated the French flag from most routes, but this barely helped Danish shipping.
Denmark tried to strengthen its position by joining the Second League of Armed Neutrality with Russia, Prussia and Sweden in 1800, but the League had collapsed by the following spring after the assassination of Tsar Pavel and the First Battle of Copenhagen (2 April 1801), where a strong British fleet crushed the Danish navy. Copenhagen's merchant shipping, however, survived quite well and, after the short Peace of Amiens, traffic in the port enjoyed a modest growth, in particular after France occupied Hanover in the summer of 1803. In the following years, Napoleon's victories in central Europe brought his armies closer to the Baltic coast. In the autumn of 1806, they crushed the Prussian army and, in November, conquered Lübeck. Just two weeks later, Napoleon issued his famous decree on the Continental Blockade. The following summer, even Russia was forced to withdraw from the war. At this stage, fearing that Denmark would be forced to accept French occupation, Britain decided to prevent its navy falling into French hands. After the savage bombardment of Copenhagen in September 1807, the British captured the remaining Danish navy. Not surprisingly, the inevitable aftermath of the British attack was that Denmark accepted an alliance with Napoleon and joined the Continental Blockade. For its shipping, this was a fatal act, which ended practically all maritime contacts westward. From 700–800 arrivals in Copenhagen in 1805–1806, the number dropped to a mere 196 vessels in 1807, most of which were from Britain and Sweden; the following year, there were only 50 arrivals from Sweden and French-controlled ports. 25
IV
The shipping that crowded the port of Copenhagen consisted of several, far from homogeneous elements. To emphasize this diversity, Figures 1a and 1b present separately the development paths of three main sectors of non-coastal trade; the corresponding decadal figures can be found in Tables 1a, 1b and 1c. 26
In Sector A, the North Atlantic possessions (Iceland, the Faroes and Greenland) represented domestic (semi-colonial) shipping, which was solely reserved for Danish and Norwegian vessels and, in practice, dominated by merchants of the capital. These also were trades with cargo being guaranteed in both directions: food and other necessary provisions for the peripheric settlements were carried on the outward leg and local products like fish, meat, wool and blubber on the homeward journey. Accordingly, shipping presented the simple pattern of out-and-back voyages. However, moderate deviations from the equilibrium can be detected. Typically, of all the ships departing to the North Atlantic possessions, around four-fifths returned to Copenhagen. Obviously, their returning cargoes were also in demand elsewhere, in other Danish and Norwegian towns and probably even abroad – for example, Amsterdam.
Norway's shipping was different insofar as even foreign ships could trade in its ports – providing, of course, that they followed the rules of the Danish navigation act. In practice, Norwegian shipping with Copenhagen was similar to the North Atlantic trades in being dominated by domestic tonnage; however, the average size of ships was smaller (and also smaller than that of Norwegian long traders). Most of them also followed the pattern of simple ‘return’ voyages. Yet they presented a different type of imbalance than the North Atlantic: the number of arrivals in Copenhagen regularly exceeded the number of departures.
The third sector, which could be called ‘colonial’, was similar to Sector A in being a trade only allowed for domestic actors. As for the Far East, the Crown-sponsored trading company, the Asiatic Company (Asiatisk Kompagni), remained the principal actor from 1730, although even private trade was possible in India. 27 On the other hand, the Danish West India and Guinea Company was dissolved in 1754 and the Crown took over the administration of these colonies. Accordingly, trade with the West Indies and Guinea was opened up to all Danish shipping; in practice, however, it remained dominated by Copenhagen merchants for a long time thereafter.
The Far East trade also consisted of straightforward ‘return’ voyages, and each departing ship was expected to return to Copenhagen after a two-year expedition. Typically, the ships carried eastward a cargo of silver and some European consumer goods, returning from China with tea, porcelain and pepper, and from India mainly with textiles.
Return voyages also dominated West Indian shipping. Outward, most of the ships carried different provisions and other consumer goods straight to the islands, but around a third of the departures were first destined for the Danish Gold Coast stations with military and food provisions, or occasionally for Madeira with grain. 28 A few ships even carried slaves from Africa to the West Indies; however, they, as well as the slave markets on the Danish island of St. Thomas, can be regarded as part of the international slave-trade networks rather than separate Danish enterprises. 29 Typically, ships that left for West Indian or Guinean destinations in late autumn returned to Copenhagen the following spring or summer.
Sector B, western Europe and the European Mediterranean, was the most diverse of the three. It also differed clearly from the other sectors by presenting a more or less competitive market or markets. In terms of shipping volumes, imports dominated this sector in Copenhagen. Two main commodity flows accounted for the best part of them: coal (and some lead) from Great Britain and wine and salt from France, Portugal, Spain and Italy. In contrast, Denmark's exports were less voluminous. The main items were grain and other food provisions; products from Iceland, the Faroes and Greenland (fish, meat, wool and blubber); West Indian products (sugar, tobacco, coffee and cotton); and different ‘Chinese goods’. In many countries, the import of grain was burdened with high customs duties, lifted only in years of famine, which effectively limited the growth of exports. It also seems that most of the West Indian sugar was consumed in Denmark, Norway and the duchies; exports of refined and raw sugar remained modest. 30 However, it has been estimated that, in the late eighteenth century, 80 per cent of Indian and 90 per cent of Chinese goods were re-exported, although the Sound Toll registers cannot reveal the actual volumes or destinations. 31
The specific value of Danish export goods must have been higher than that of British coal, but they demanded far less cargo space. This difference can be seen clearly in the numbers of ships arriving in and departing from Copenhagen (Figures 2a and 2b). While the differences between arrivals and departures were quite modest for both Norway and the Atlantic possessions (which, being in opposite directions, partly eliminated each other), the respective curves were far apart in the case of the second sector – typically, arrivals exceeded departures by a margin of 60 to 75 per cent. These margins were smaller only in connection with three exceptional peaks in the departure curve: in 1775, a large quantity of Danish oats was exported to England and Scotland; in 1782, during the Anglo-Dutch naval conflict, traffic between Copenhagen and Amsterdam experienced a brief boom; and, in 1794–1795, large amounts of grain were shipped from Copenhagen to France (see section VIII, below). In all three cases, increases in departures were also reflected in the number of arrivals as many ships (typically in ballast) were attracted to the port in response to the extraordinary demand for outgoing cargo space.
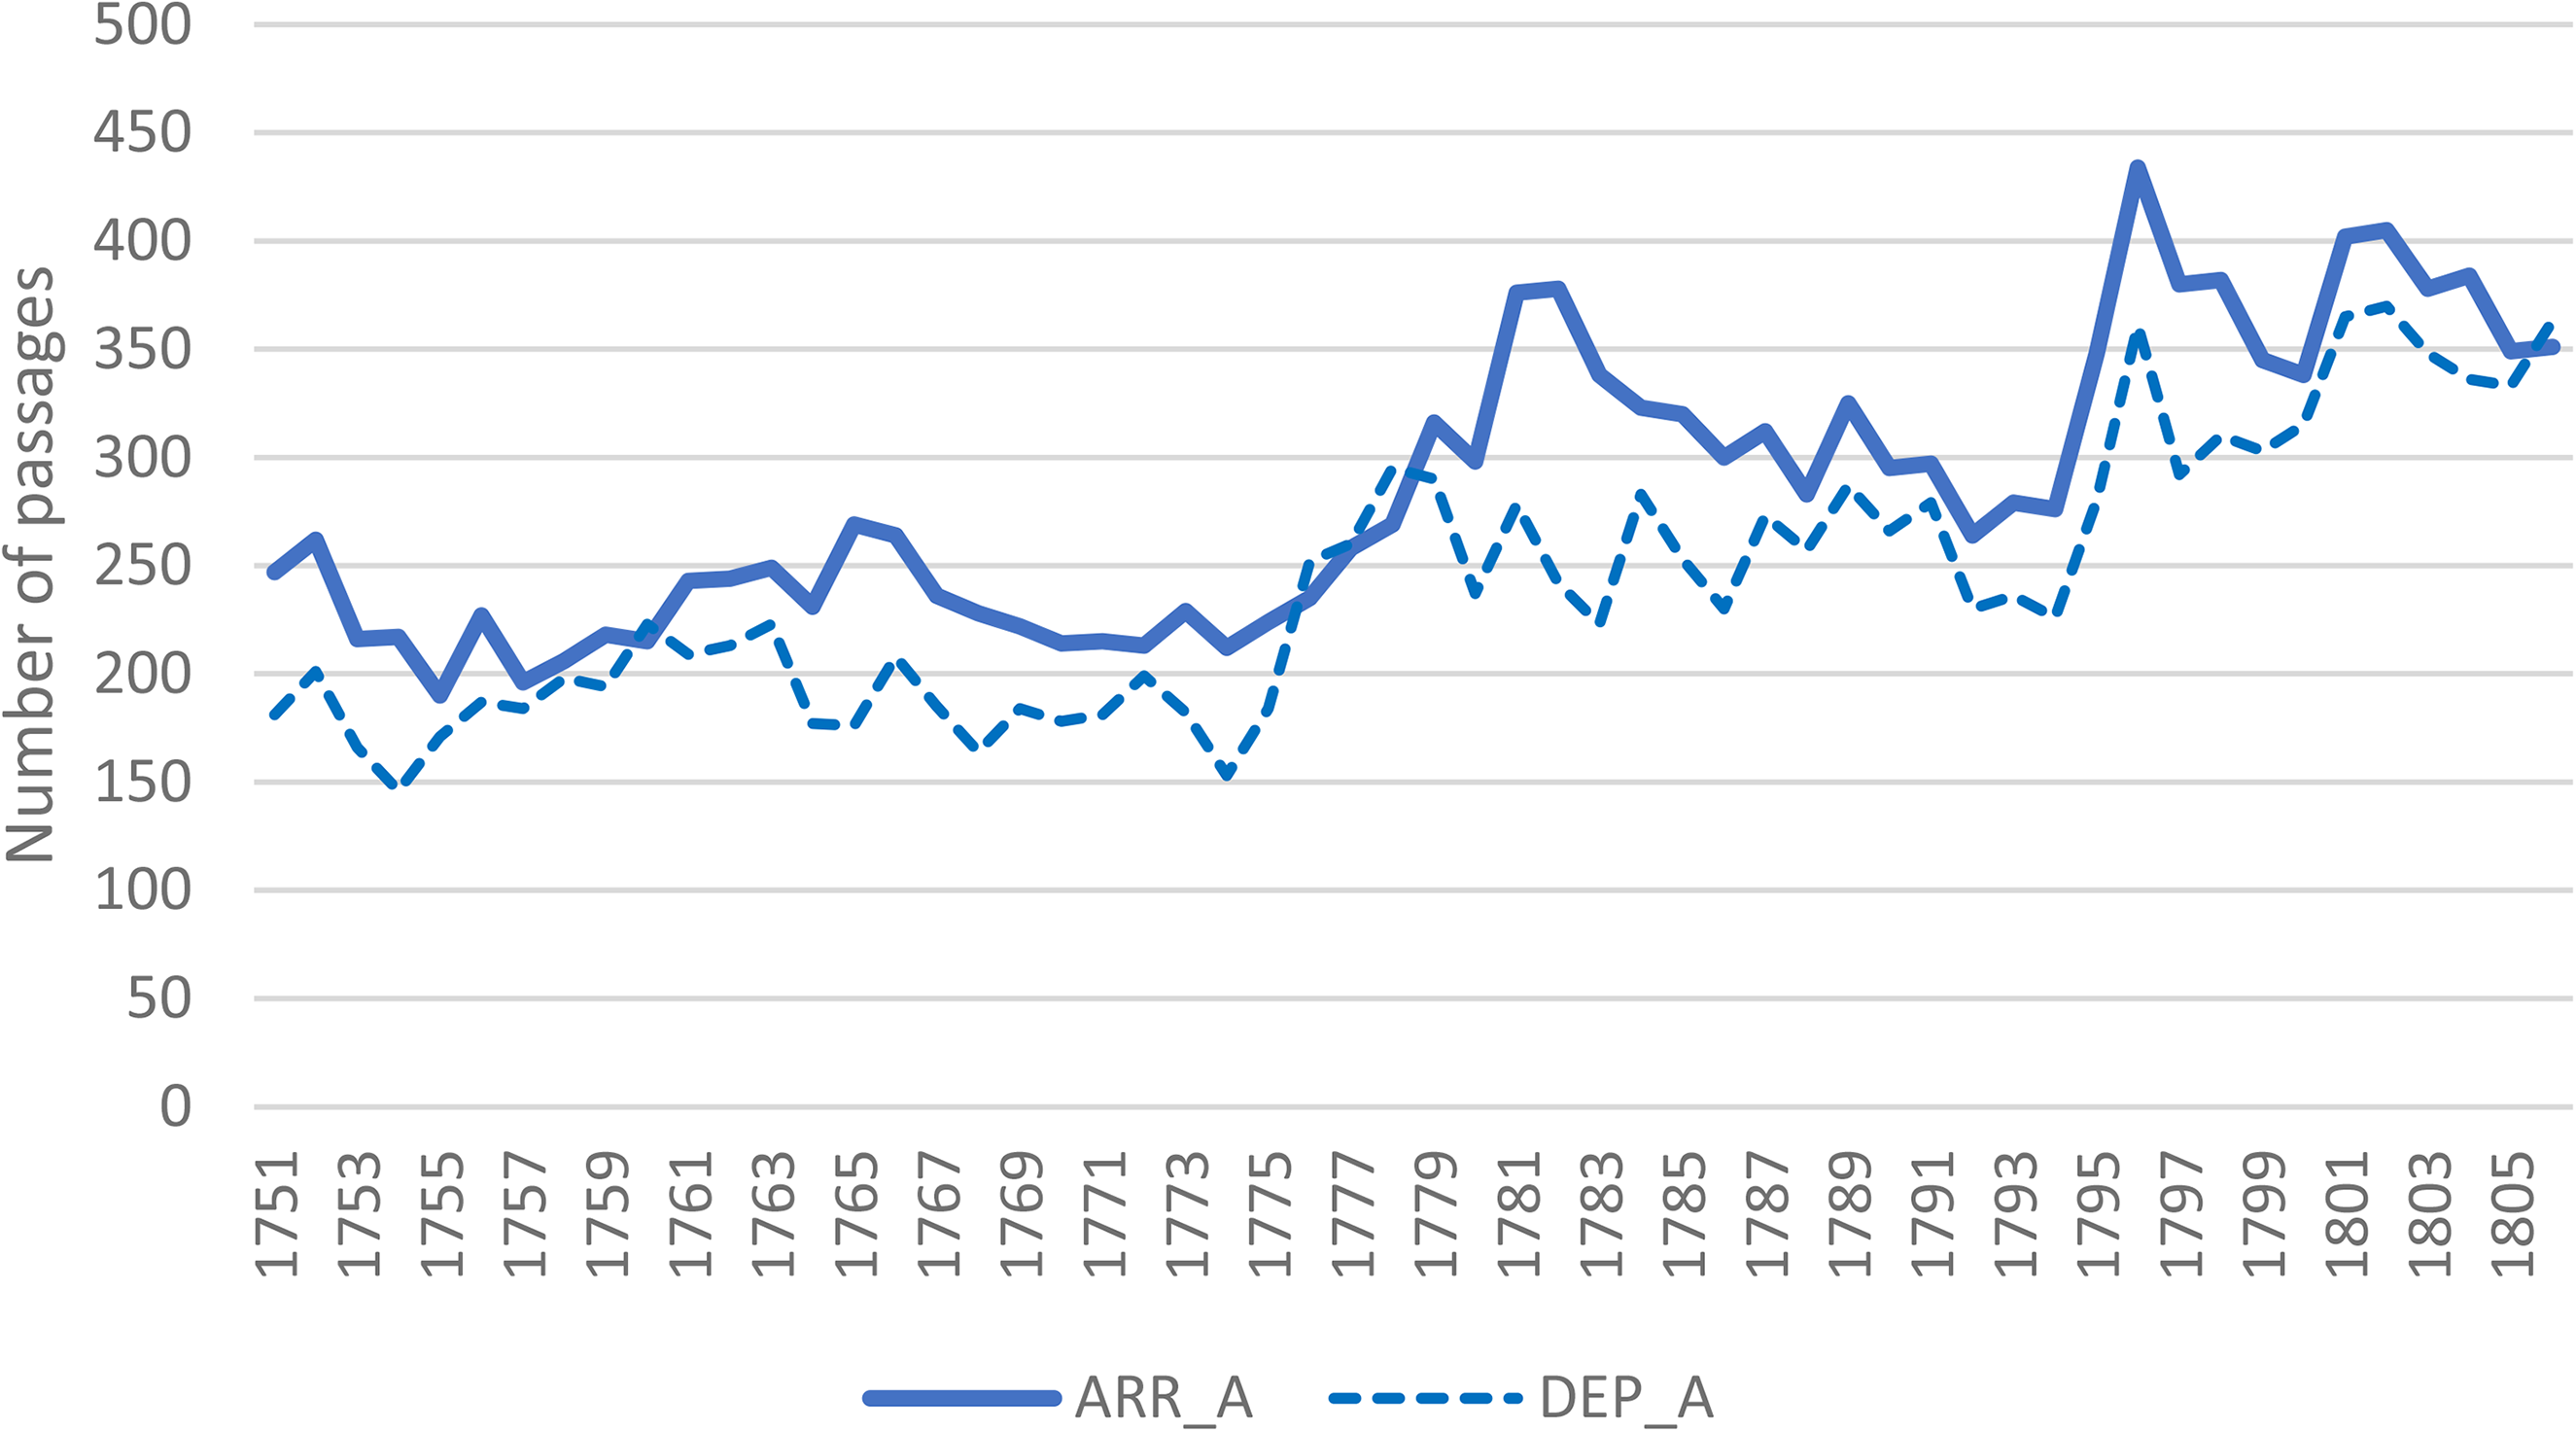
Arrivals in and departures from Copenhagen, 1751–1806, Sector A: Norway and the North Atlantic possessions.
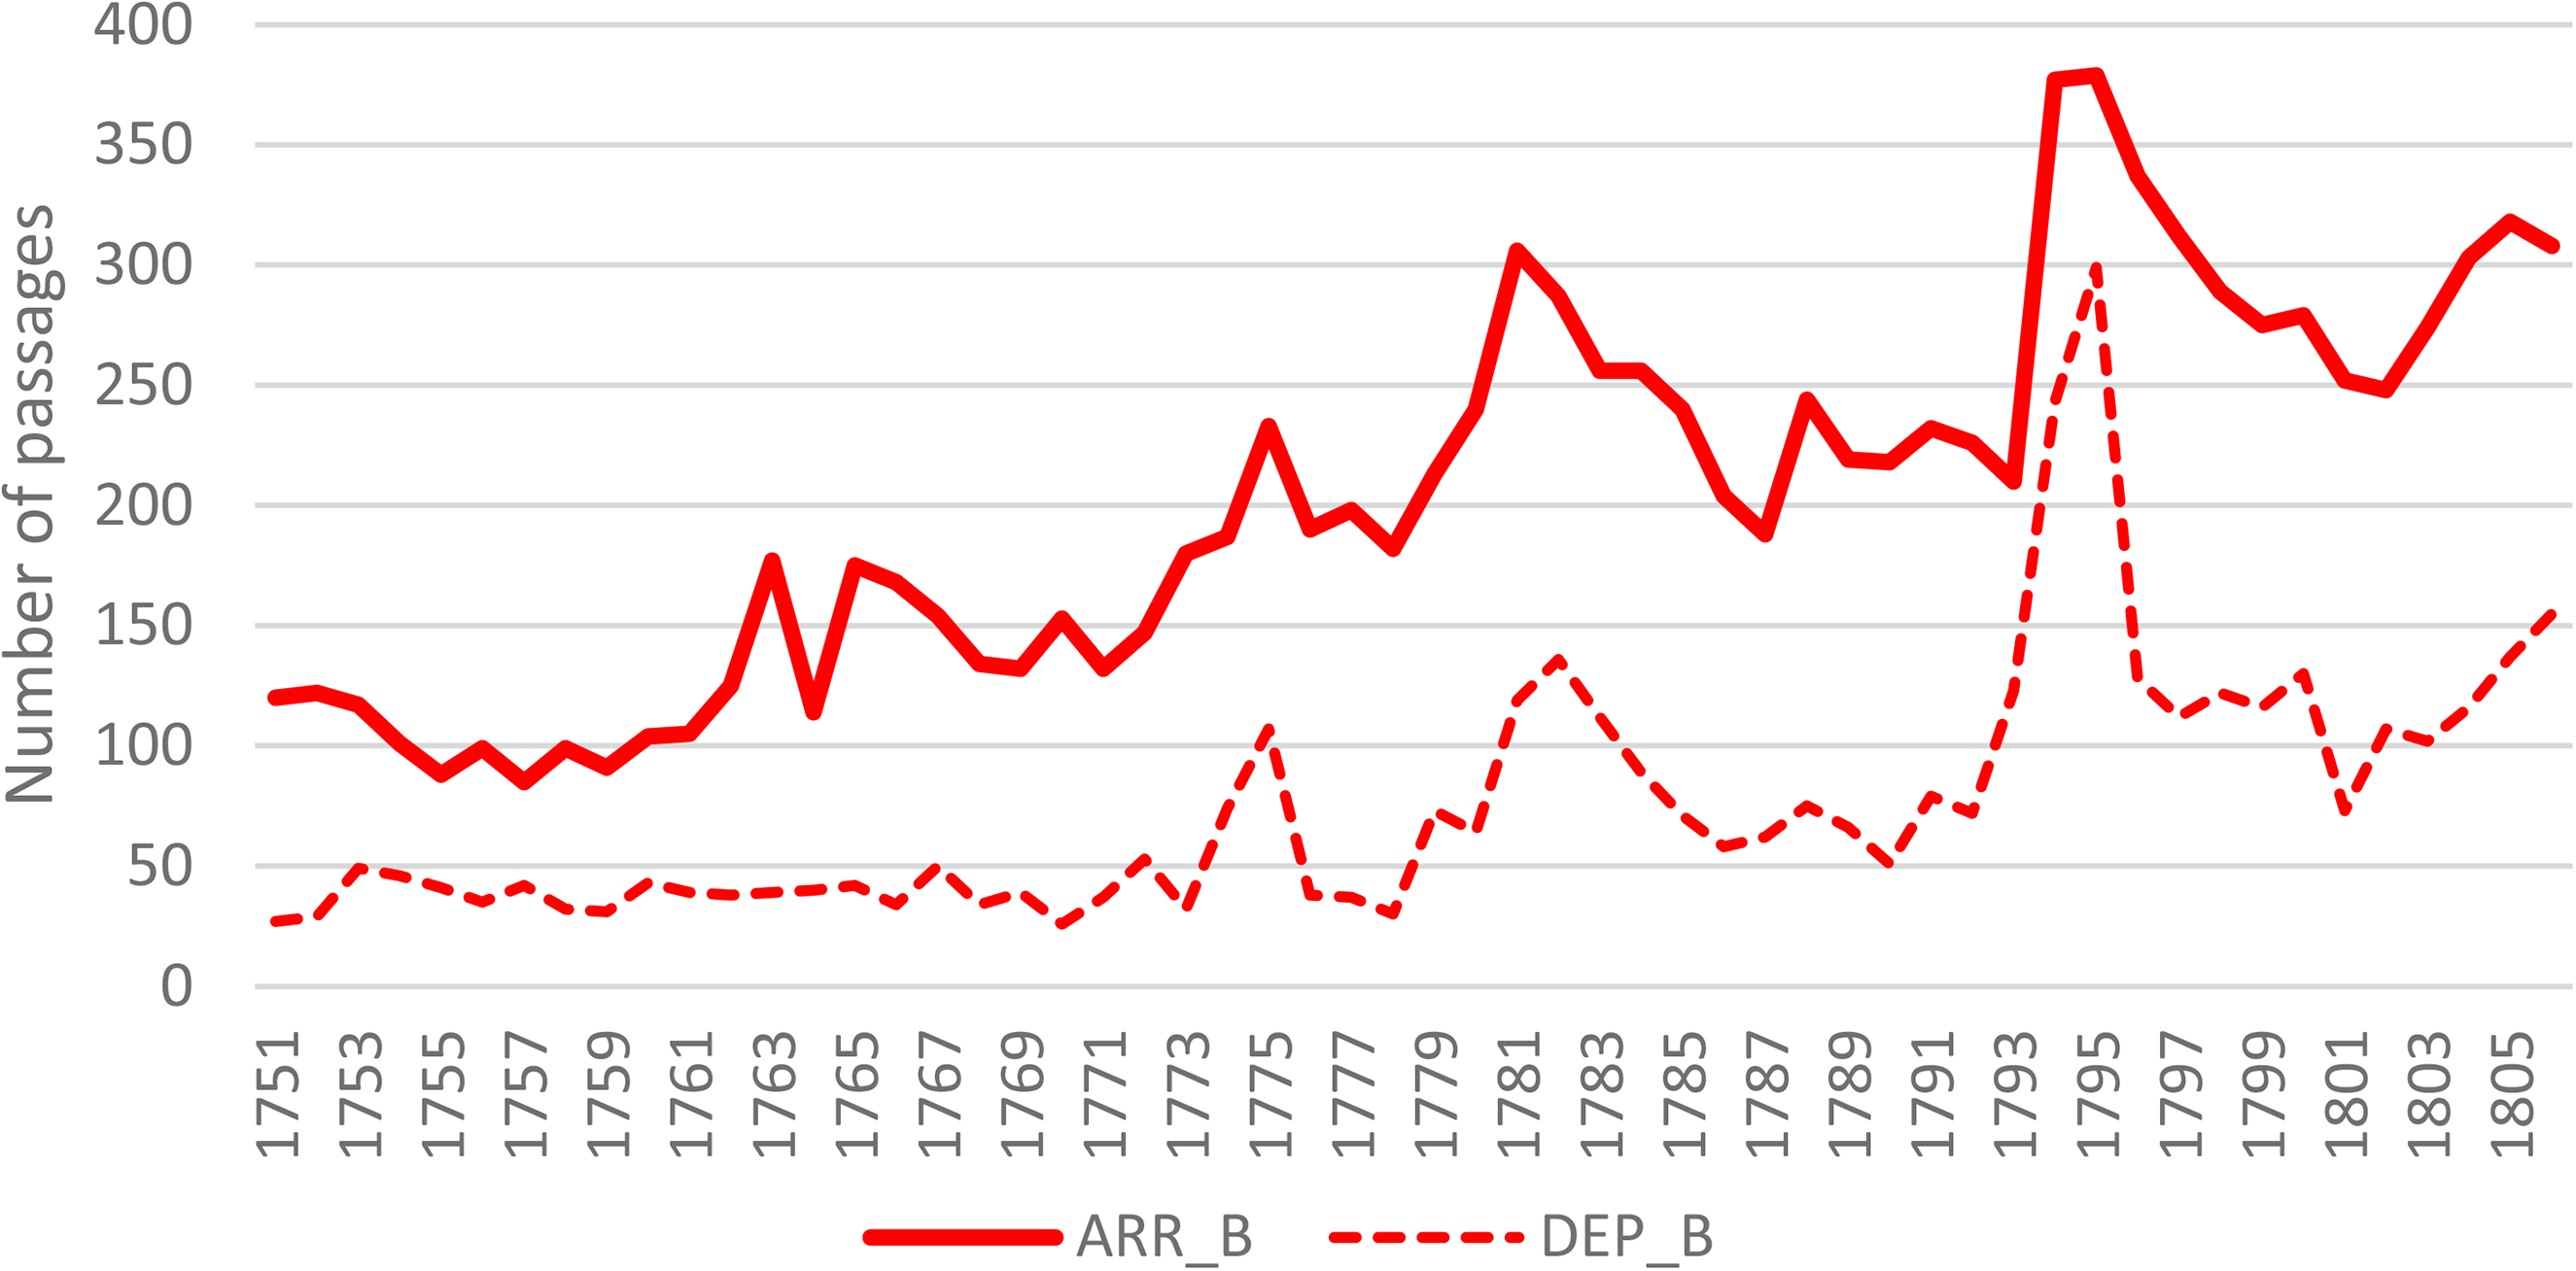
Arrivals in and departures from Copenhagen, 1751–1806, Sector B: western Europe and the European Mediterranean.
Comparison of Sound Toll-registered arrivals in and departures from Copenhagen, 1751–1806 (arrivals minus departures, annual averages).
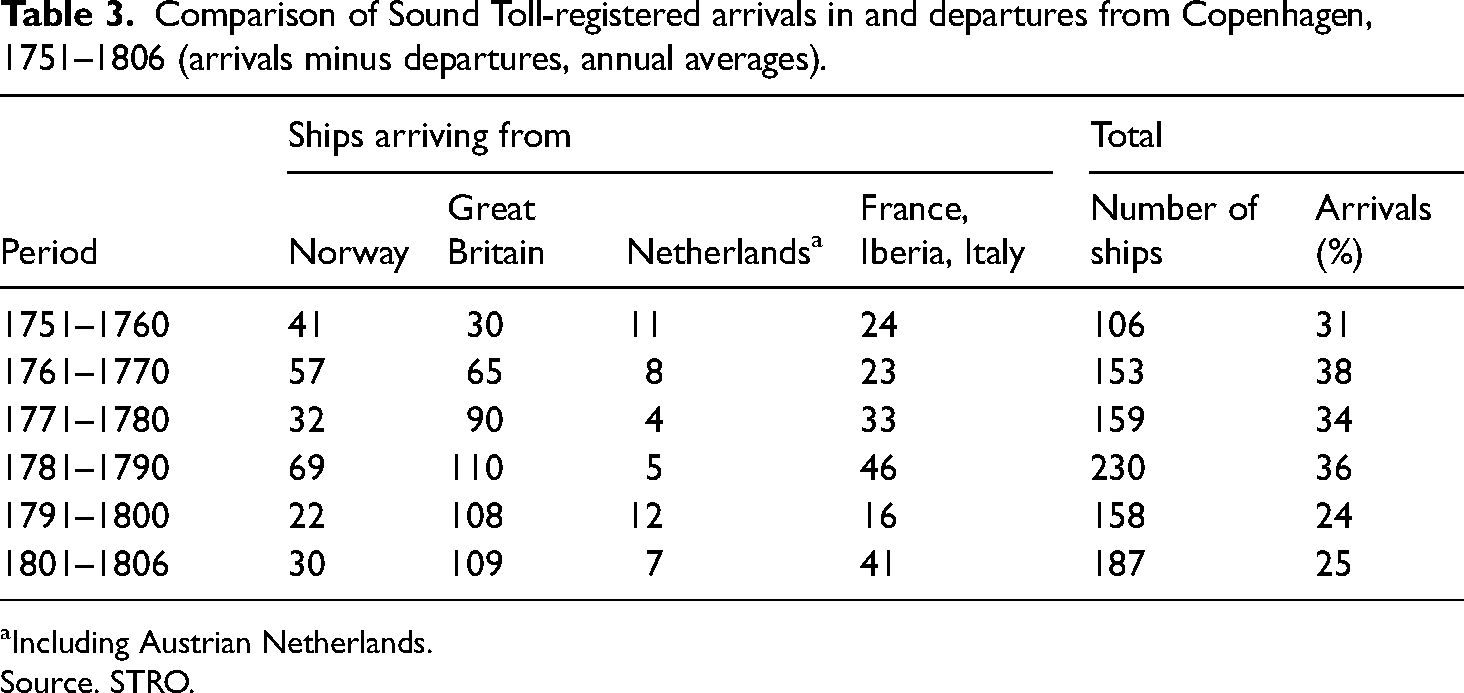
Including Austrian Netherlands.
Source. STRO.
The overall growth rates were almost identical for arrivals and departures; only the growth tracks differed slightly. Until the 1780s, arrivals increased more quickly – obviously in connection with the relative growth of Sector B – but in the 1790s the trend reversed. Looking at the development of various sectors, the biggest changes took place during the first three decades. They included a drop in Norway's relative share by 17 per cent, as well as the rise in Great Britain's by a good 10 per cent.
Strictly speaking, Tables 1a and 1b just show visiting frequencies, which makes no distinction between small and big ships. The lack of tonnage data means that they may be defective, if not directly misleading, parameters of actual shipping volumes. Although it seems that ship sizes did not grow rapidly during the eighteenth century, 32 this problem remains significant in a case like Copenhagen, whose shipping, consisting of a great variety of different trades, covered the whole contemporary size scale, from open boats of three lasts from southern Norway to the China ships of almost 500 lasts. 33 Fortunately, finding (at least) crude data of tonnages is not too difficult. Although the Sound Toll accounts did not systematically register ship sizes, they often present such information (in Danish commercial lasts) for Danish and Norwegian ships. Moreover, the cargoes of foreigners were recorded in such detail that it is possible to roughly estimate the vessels’ carrying capacities, in particular if the cargo was measured by weight or by the number of standard containers, like barrels. In fact, such data – as well as ship lists from Danish ports – has already been exploited by the Sound Toll 1784–1795 project, resulting in an inventory of the Danish merchant navy in 1787, which even specifies average ship sizes in various trades. 34 Unfortunately, that research did not include foreign vessels. Therefore, I collected some additional data by sampling the Sound Toll registers of the 1750s, 1780s and the first years of the nineteenth century. The average lastages from the samples, as well as the Danish 1787 data, make it possible to estimate the tonnages of different origins and trades. 35
Moreover, the visiting frequencies include ships that stopped in Copenhagen to unload just part of their cargo or arrived in ballast. Fortunately, their numbers were so small (probably less than 20 vessels a year on average) 36 that they only marginally affected the overall picture. Even that margin has been partially discounted in Table 2 by excluding all ships with a part-cargo from the estimations.
There are definite weaknesses in this tonnage data. This concerns, in particular, ships that carried so-called ‘general cargo’ (stukgoed or stückgut – that is, a variety of different goods), for which only a monetary value was recorded, as well as ships with light cargo, such as flax or hemp bales or different wood products. Accordingly, some (incalculable) margin of error must be accounted for. However, even with such weaknesses, this estimation takes us much closer to the actual commodity flows than mere passage rates. 37
Two developments stand out very clearly. The first is the relative decline of Sector A: in the 1750s, it accounted for over 40 per cent of the estimated cargo but declined, across three decades, to about a quarter and, subsequently, slightly lower. As a counteraction, the rise of Sector B, which already in the 1750s was almost on a par with the northern domestic sector, seems much more systematic than the earlier passage data. It also becomes increasingly obvious that this development was first and foremost linked with British shipping. Finally, the ‘colonial’ long trades grew quite modestly overall, in spite of two booms around 1780 and after 1800. The newcomer – North American trade – could not challenge them.
Table 2 also suggests that the average tonnage of the ships that arrived in Copenhagen rose by about 50 per cent in a half century, more in fact than has been believed, at least as far as Baltic shipping is concerned. However, even this rise depended mainly on the growth of British shipping. At the same time, the tonnages in the oceanic long trades grew hardly at all and, in the North Atlantic trades, declined by a third. In any case, the estimated overall tonnages arriving in Copenhagen trebled between the 1750s and the first years of the nineteenth century. Most of this growth, however, had already taken place before 1780. In this respect, the trend remains similar to that suggested by the passage data.
V
The traffic data presented above is, of course, imperfect since an essential sector of Copenhagen shipping falls beyond the scope of the Elsinore toll station. Indirectly, however, some outlines of the missing Baltic shipping can still be deduced from the Sound Toll data. As has been seen above, the visible (registered) departures from Copenhagen always fell short of the corresponding arrivals by a wide margin. This margin, of course, consisted of ships that departed in an eastward direction, continuing their voyage to the Baltic.
As Table 3 shows, arrivals exceeded departures by a fairly permanent thirty percent, only declining a bit in the 1790s. Such a large proportion is no surprise in the western European Baltic trade. Traditionally, the westward flows of commodities, grain, raw materials, forest products (‘naval stores’) and other bulky goods regularly exceeded the eastward countercurrent by a good margin. A perfect example of these economic realities is ships from Great Britain, which were mainly destined for St. Petersburg and Riga, as well as East Prussian ports or Danzig (now Gdansk). 38 Since few managed to find an outward cargo to their final destination, a good alternative was to carry coal to Copenhagen, which lay just by the shortest route (even Stockholm and several other Baltic ports started to receive British coal cargoes). It is no wonder that, from the 1760s, British ships account for the highest numbers in Table 3, often exceeding 50 per cent of the total deficit. In terms of tonnage, their share must have been even higher. 39
Compared with the British, Dutch Baltic traders seldom visited Copenhagen on their eastern voyages. This was simply because, if they could not find a cargo of stukgoed (wine, sugar, tobacco or other consumable goods) to Riga, Danzig or other eastern ports, they sailed the whole way in ballast. Copenhagen did not attract them as the city was fairly self-sufficient as far as wine, sugar or other colonial goods were concerned, and even the demand for typical Dutch ballast cargo (such as bricks and roofing tiles) was low in Copenhagen. In fact, most of the trade between Amsterdam and Copenhagen was carried on small or moderately size short-sea vessels.
A fair share of Norwegian ships, around 20–25 per cent, also sailed in ballast eastwards from Copenhagen. Unlike the British, most of them were just looking for grain, a product that was in short supply at home. Usually, they loaded grain in Riga, Königsberg (now Kaliningrad), Danzig and other Baltic ports – until 1795, only three per cent of Norwegian imports of grain consisted of Danish cereals. In addition to the Norwegians, many foreign ships, as well as a few from Copenhagen, participated in this trade. 40
The fourth group of ballasted eastbound ships consisted of those that were deployed in trade to French Atlantic, Iberian or Mediterranean ports. The principal goal in this case was to supply Copenhagen with wine, spirits, salt and other southern European products. Paying for these imports, however, was a potential problem because Denmark could not supply sufficient volumes of goods that were in demand in wine-and-salt-producing countries. Therefore, Danish shippers often replenished their exports with typical Baltic commodities, such as timber products (sawn wood, barrel staves), tar, hemp or linen. Accordingly, many ships started their southern European voyages by first sailing eastwards in order to load a cargo of Baltic products. 41
The case of Copenhagen, however, does not fully fit with this model. The proportion of ships sailing directly from the capital to southern destinations was fairly high – about two-thirds of departures in the 1750s and frequently more than a half (see Tables 4 and 5); even the number of departures in ballast was at first around a quarter, but declined rapidly from the 1760s. These figures are, however, in a sense misleading. A closer look at the cargoes indicates that ships departing from the capital were loaded with similar goods to those that sailed to southern Europe directly from Baltic ports. In the 1750s, timber cargoes (boards, deals, spars, barrel staves) dominated, but gradually the share of other goods increased. ‘Chinese goods’ like tea and porcelain became common in the 1760s, as well as East Indian and West Indian products a little later. In the mid 1790s, grain cargoes boomed for a short time, but subsequently the selection of goods grew more balanced. Interestingly, a fairly high share of these commodities was of foreign origin: a lot of timber products seem to have come from Sweden or Pomerania; iron and steel also came from Sweden; there was tallow from Russia; grain was more often fremmend (‘foreign’) than Danish; and even British coal was sometimes sent to French and Iberian ports. At least in these cases, Copenhagen merchants were involved in simple re-exportation or redistribution.
Copenhagen ships bound for French, Iberian and Italian ports (average annual number of passages).
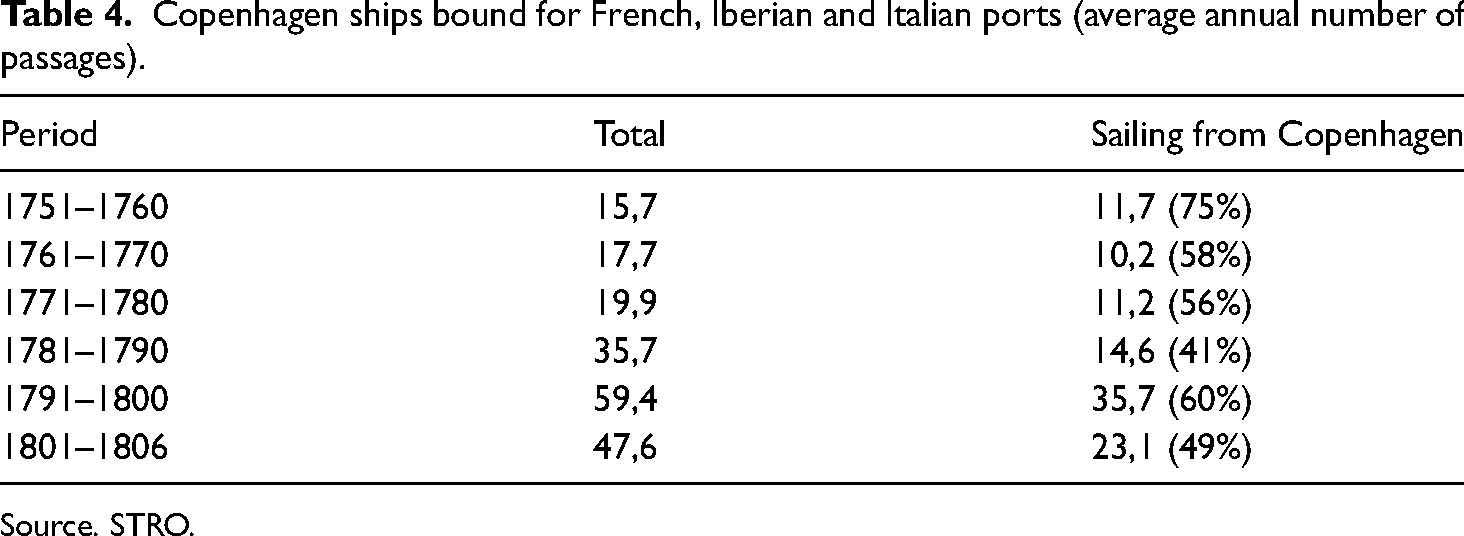
Source. STRO.
Major cargoes on Copenhagen-based ships bound from Copenhagen to French, Iberian and Italian ports (annual averages, small or inadequately defined cargoes not included).
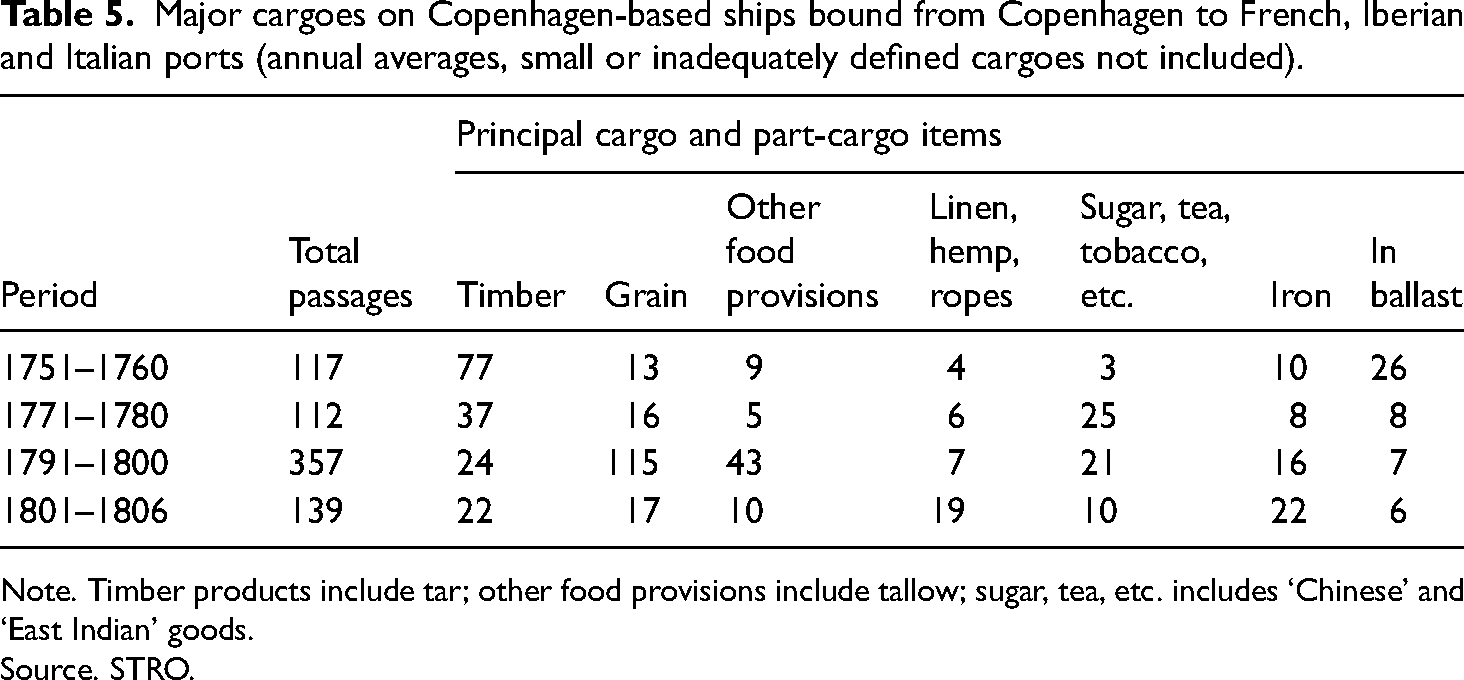
Note. Timber products include tar; other food provisions include tallow; sugar, tea, etc. includes ‘Chinese’ and ‘East Indian’ goods.
Source. STRO.
What was the idea behind such routing of goods via Copenhagen? At least a couple of explanations seem feasible. If cargoes from Baltic ports arrived on small ships, transport economies could be improved by loading them on a bigger vessel before starting a long southward voyage. 42 Moreover, stocks of fairly valuable Chinese, East and West Indian or Greenland products were steadily coming to Copenhagen, and they could only be exported customs-free from Danish ports. Since they usually required relatively little cargo space, it was highly reasonable to combine them with a bulk cargo. Even in other cases, stowing a ship could be optimized by combining light commodities with, for example, iron. Finally, loading a southbound ship in Copenhagen made it possible to prepare an optimal blend of commodities that were in demand at the port of destination.
Copenhagen's shipping with France and southern Europe was not very extensive, at least in comparison with the Dutch. According to Kiøbenhavnske Tidender, 106 ships arrived in 1766 at the anchorage of Texel (at the western entrance to the Zuider Zee) from Bordeaux, bound for Amsterdam. 43 This figure was three times higher than contemporary arrivals at the Danish capital from all French Atlantic ports. However, Danish southern European shipping involved elements that cannot be accounted for by just studying arrivals in Copenhagen. Many ships left late in the autumn and, after delivering their cargoes, remained for the following sailing season in the south, carrying different tramp freight between Mediterranean ports. The next spring, they loaded salt or wine and other local produce and returned home after an absence of two or sometimes more years. This means that the numbers of arrivals and departures underestimate the actual volume of this trade. According to the tonnage data of 1787, 65 Copenhagen ships were sailing to ‘France and the Mediterranean’; 44 around the same time, the annual numbers of passages to such destinations (according to STRO) fluctuated between 42 and 23. This means that, on average, a ship visited Copenhagen typically once every two years. More information on Mediterranean shipping can be found in the catalogues of Algerian sea passes. They show that this was also a trade that flourished in times of war, when neutral ships were able to replace the ships of belligerent nations. Thus, the numbers of sea passes show a moderate peak during the Seven Years War and higher peaks in the early 1780s, as well as after 1793. 45 Mediterranean trade was particularly important in the Schleswig and Holstein ports of Flensburg, Aabenraa and Altona – for example, in 1787, these three ports deployed 188 ships to ‘France and the Mediterranean’. 46 Even Norwegian ships participated in great numbers – their share seems to have fluctuated between a third and more than a half of all sea passes for Mediterranean voyages. In comparison, Mediterranean trade played a modest role in the capital: in around 1760, as well as in the early 1780s, Copenhagen-based ships procured only about 20 per cent of Algerian passes for the Mediterranean, and the number was even lower around the turn of the century, at 10–15 per cent. There were only higher numbers in 1794–1795, but that was an exceptional moment in history, as will be discussed later. 47
For Danish shipping in general, the Mediterranean trade was an important growth boost during the last decades of the century. It was perhaps even more important for Norway. Compared to Denmark and the duchies, Norway enjoyed substantial comparative advantages with its staple exports – timber products and dried cod – both of which were in demand in Iberian and Mediterranean countries. Sweden–Finland enjoyed similar advantages (save cod), which was clearly seen in the high volumes of its Mediterranean shipping. According to the contemporary Swedish shipping statistics, over 400 ships (representing a good 60 per cent of the total tonnage) were staying in southern waters in 1782–1783. 48 In the first years of the nineteenth century, the annual number of Swedish Algerian sea passes rose to almost 700; this figure, however, also included Swedish Pomerania. 49
VI
The triangular trade between Denmark, eastern Baltic ports and southern Europe represents a special type of Baltic connection, with Copenhagen acting as a kind of intermediate terminal. More typically, however, it was a final terminal, receiving cargo from German, East Prussian, Russian and Swedish ports, as well as sending ships to these destinations – a trade that must have been common and vibrant, although it has left no traces in the Sound Toll records. Fortunately, some data on such traffic can be found in the ship lists published by the Københavnske Tidender. 50
These ship lists contain a large amount of shipping information – they are literally crammed with the names of skippers arriving and leaving the port of Copenhagen. The bulk of them, however, refer to quite small vessels, which supplied the capital with grain, other food provisions, firewood and building materials. Copenhagen was such a big urban centre that, as far as maritime transport was concerned, its catchment area covered all of the Danish islands and the east coasts of Jutland, as well as those of Schleswig and northernmost Holstein. Eastward it reached even farther: the ship lists of the 1750s record a group of unnamed arrivals, pommerinker and dasser – that is, boats from Pomerania and the Darß Peninsula (west of Rügen). They also brought firewood to the city, and the pommerinke area seems to have included the coasts of Stettiner Haff. 51 A precise calculation of the coastal shipping attracted to Copenhagen is difficult to present; coastal shipping and other Baltic shipping were often closely intertwined. Firewood boats came also from the Swedish side, and Hanseatic towns like Lübeck, Rostock and Stettin participated in supplying the Danish capital with day-to-day necessities – how many ships or boats were involved overall can only be guessed at. In any case, excluding boats from Sweden and western Germany, the shipping lists of 1753 suggest that the number of visits by named coastal skippers may have been almost 1,800 and that of pommerinker and dasser close to 1,000 – thus, the total was approaching 3,000. 52
In spite of being saturated with small coastal vessels, the Copenhagen ship lists seem to record the movements of bigger ships quite carefully. The arrival data published in the newspaper agrees with the corresponding departure records of the Sound Toll – at least insofar as no lists were missing. This is, indeed, an important reservation: as mentioned above, the ship lists have many gaps. This concerns, in particular, the 1750s. In this decade, the gaps are so frequent that comprehensive annual series for arrivals can only be constructed for the years 1752 and 1753 and, even then, about 10 per cent of the half-weekly lists are missing. In the following decade, the situation is clearly better and a tolerably complete series of arrivals (with the rate of missing half-weekly data at below five per cent) covers a period of five years (1766–1770). On the other hand, the data on departures is so much worse that a reliable survey cannot be presented for any single year of the 1750s and, even for the 1760s, a sample of only two years (1766 and 1767) was possible. Accordingly, there are two separate pieces of data, one for the time just preceding the Seven Years War and the second for a period following its end (Table 6).
Copenhagen arrivals from and departures to Baltic ports, 1752–1770, according to the Kiøbenhavnske Tidender (average annual passages).
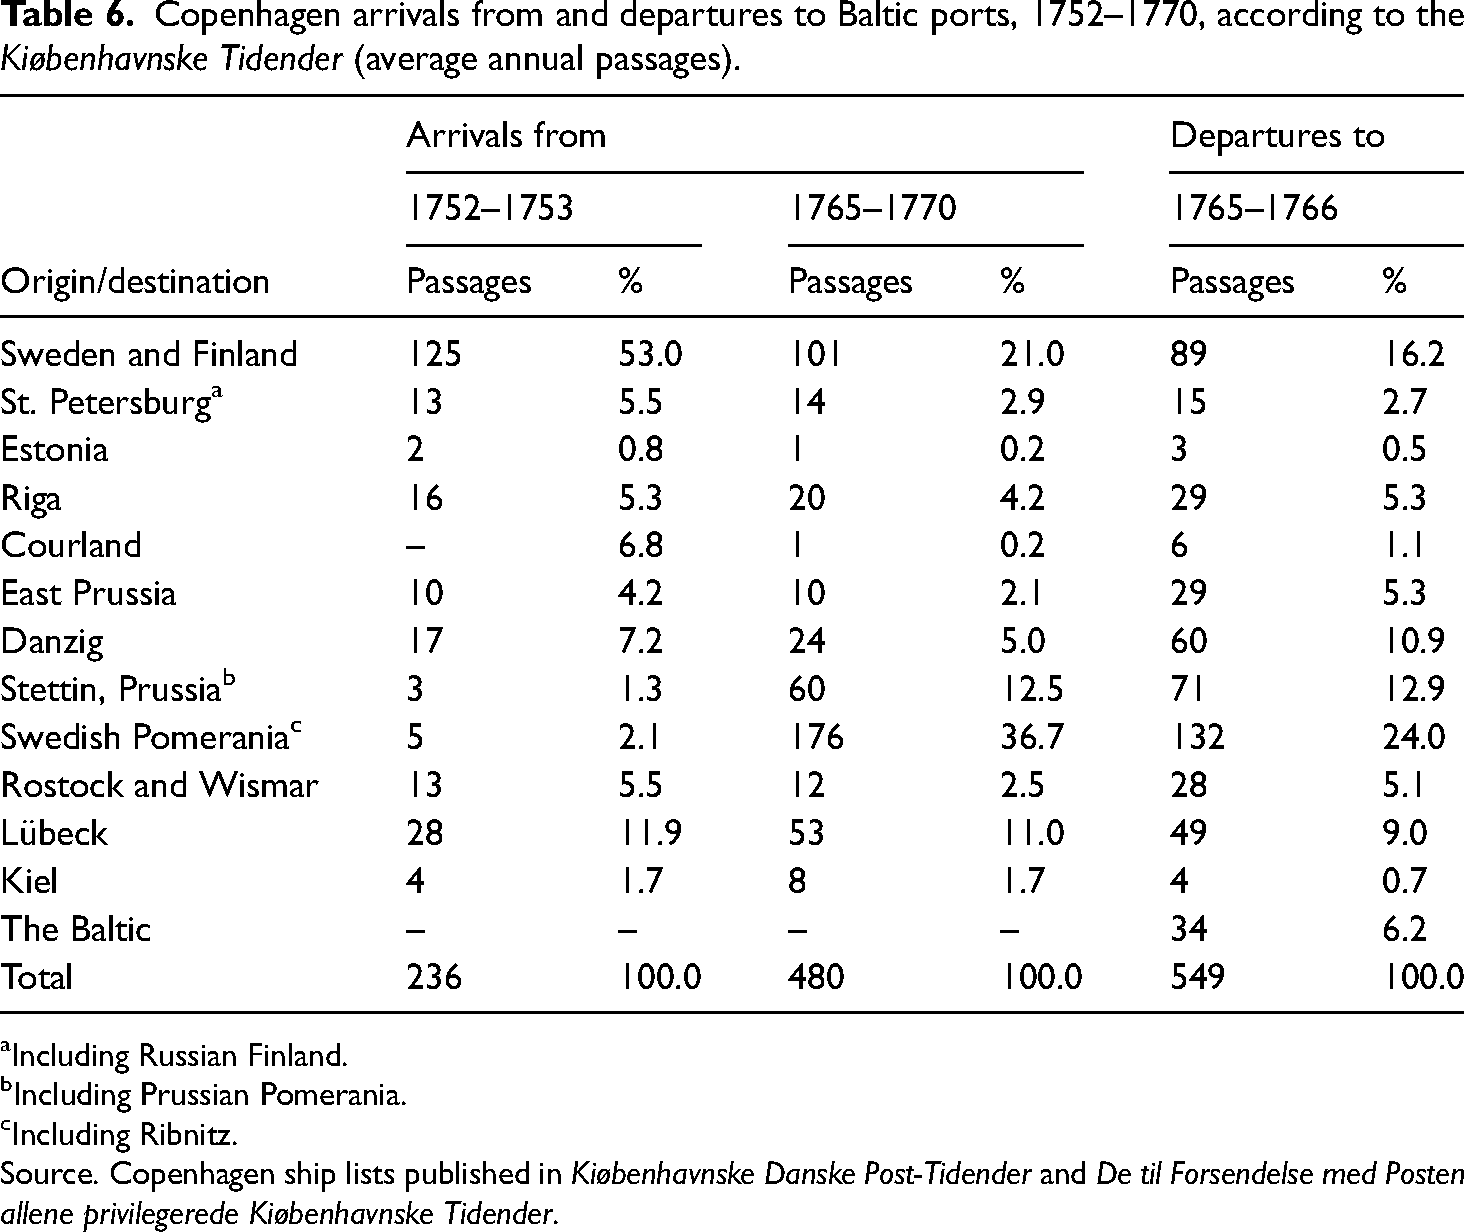
Including Russian Finland.
Including Prussian Pomerania.
Including Ribnitz.
Source. Copenhagen ship lists published in Kiøbenhavnske Danske Post-Tidender and De til Forsendelse med Posten allene privilegerede Kiøbenhavnske Tidender.
At first glance, the data sets of the 1750s and 1760s are surprisingly incongruous. The total number of arrivals for 1766–1770 exceeds the figure for 1752–1753 by a full 100 per cent. However, closer examination shows that almost all of the difference can be accounted for by just two regions: Swedish Pomerania and the eastern coast of Vorpommern (which was ceded to Prussia after the Great Northern War). As huge as this growth is, an obvious explanation can be found for it. In the 1760s, the ship lists no longer classified pommerinker or dasser as a separate category and they were included in the numbers of other Pomeranian vessels. In this process, however, the earlier 900 firewood cargoes shrunk down to something like 200 arrivals. This is explained by a major change, with small open firewood boats being replaced by bigger decked vessels; accordingly, a smaller number of vessels were needed to carry the firewood. 53 Parallel with these developments, many peasant-skippers established themselves as burghers in local towns; already in around 1765, over half of the Pomeranian vessels came from Stralsund and the smaller towns of Demmin, Anklam, Wolgast, Greifswald, Barth and Ribnitz. 54 Some of these towns also had bigger ships for Baltic navigation and even a few that sailed west of the Sound. This, again, shows how Baltic and coastal trades could be interwoven and difficult to separate from each other.
As mentioned earlier, the old Hanseatic towns of Kiel, Lübeck, Rostock and Wismar were involved in coastal trade. However, the most important of them, Lübeck, also sent bigger ships to Russian and other eastern Baltic ports and participated in the French and Iberian wine and salt trades. Moreover, Lübeck ships carried bigger stückgut cargoes (often including various Russian goods) to Copenhagen. Indeed, compared with Lübeck, Copenhagen's direct contacts with Russian and East Prussian ports, as well as Danzig, were modest – around 70 arrivals a year against Lübeck's close to 200. 55 On the other hand, departures from Copenhagen to these ports – on average 142 in 1765–1766 – clearly exceeded the respective arrivals. As far as specific destinations for eastbound voyages were recorded, the deficit was smaller for Russian ports than for East Prussia and Danzig, 56 but, in addition, there were many ships that were cleared for a voyage to ‘the Baltic’ (a vague definition that was popular among British skippers) and they also were aiming for different Russian or East Prussian ports or Danzig. The net result was that only half of these 140 ships returned to Copenhagen – the rest must have sailed westward through the Sound. This data confirms the earlier circumstantial evidence: Copenhagen was a popular stepping stone for ships with the final aim of loading a full westbound cargo at the eastern edge of the Baltic.
One aspect was common for both Lübeck and Copenhagen shipping: ships from Sweden accounted for the most numerous non-coastal categories of entries. Even in this respect, Lübeck was number one: in the 1750s and 1760s, Copenhagen received an average of about 120 and 100 ships a year, while the numbers in Lübeck approached 140 and 180, respectively. This difference can be explained by a handicap that was met by the Swedes in Denmark: their principal export goods – timber products and iron – were the same as those of Norway. Moreover, the plentiful Swedish west coast herring could not be exported to Denmark but had to be sent to the Baltic – for example, Lübeck.
Fairly realistic numbers for Copenhagen's non-coastal Baltic shipping can be estimated by discounting all voyages from Pomerania as well as from Wismar, Rostock and Kiel, since most of them took place in small coastal craft. On the other hand, in order to compensate for the exclusion of their possible (but undefinable) Baltic-going ships, it seems reasonable to include all shipping from Lübeck (in spite of its equally undefinable coasters). Following these simple rules of thumb, the crude number of Baltic-trade arrivals in Copenhagen can be estimated (with a correction of 10 per cent for the early 1750s and a small upward rounding for the late 1760s) 57 at about 230 in both periods, and the corresponding number of departures at 300. Determining the average lastage of these vessels is not easy because the size scale was wide. In the 1760s, British ships measured typically 80–90 lasts and those that loaded Baltic products for southern Europe probably around 50. Swedish ships carrying tar or timber were usually around 50 lasts, but all other vessels sailing within the Baltic must have been smaller – between 20 and 40 lasts or less. 58 Accordingly, it seems reasonable to guess that the Baltic shipping arriving in the capital in the late 1760s represented a total cargo capacity of some 7,000−8,000 Danish lasts. This amounted to about half of the contemporary capacity of western arrivals or a third of the grand total. 59 Thus, it can be concluded that, while Baltic shipping was a substantial element in Copenhagen shipping, western trades still played a more primary role.
VII
In spite of their narrow chronological scope, the printed ship lists of Copenhagen were able to paint a fairly good overall picture of the capital's Baltic shipping. Strictly speaking, this picture can only reflect the structures and economic realities of the 1750s and 1760s, but such structures were usually slow to change – just like the spectrum of tradable goods in various eastern Baltic ports. On the other hand, short-term fluctuations could be quite powerful – as was seen in Copenhagen's ‘western’ shipping. Such conjunctures, of course, had no straightforward connections with economic structures.
After 1770, the only reliable Danish series with a Baltic connection is the indirect data of ships departing from Copenhagen for Baltic ports (that is, the excess of arrivals over departures, as seen in Table 3). While this covers the whole remaining period until 1806, it tells nothing of shipping in the opposite direction – nor can we expect that the ratio between ships passing the Sound and those bound for Copenhagen remained constant for over three decades. As far as the latter traffic is concerned, we only have a couple of small peepholes: data on ships coming from St. Petersburg and Lübeck. As can be seen in Table 7, neither set of data tells of an expansive trade. Lübeck, of course, being so close, accounts for a high numbers of voyages (with fairly small ships), but the traffic stagnates after the 1770s. Passages from St. Petersburg, on the other hand, present an increasing trend, although the scale of the trade was modest. However, the latter data can only be found until 1786.
Arrivals in Copenhagen from Lübeck and St. Petersburg (annual averages).
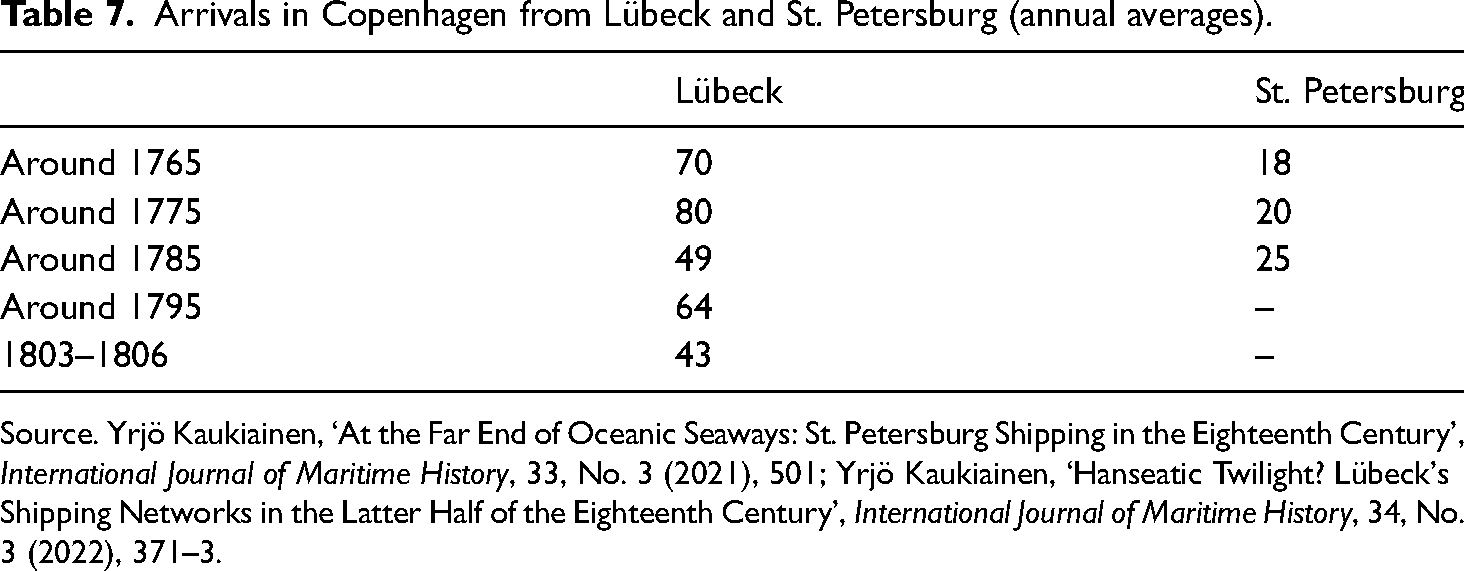
Source. Yrjö Kaukiainen, ‘At the Far End of Oceanic Seaways: St. Petersburg Shipping in the Eighteenth Century’, International Journal of Maritime History, 33, No. 3 (2021), 501; Yrjö Kaukiainen, ‘Hanseatic Twilight? Lübeck's Shipping Networks in the Latter Half of the Eighteenth Century’, International Journal of Maritime History, 34, No. 3 (2022), 371–3.
There is one further, albeit problematic, peephole: ship lists from Danzig can be found in the Danziger Anzeigen. 61 In addition to the names of skippers, they include brief notes on cargoes. Unfortunately, they usually do not specify the ports of origin or destination, but only the countries in question; more detailed data can only be found for 1795. 62 Thus, except for that single year, it is not possible to find precise data for Copenhagen, only for Denmark. Moreover, Danzig was special in two respects. First, it was the foremost warehouse for grain in the Baltic and, therefore, its shipping could fluctuate hugely – not just because of business cycles but also because of harvest fluctuations. Still, in 1765, some 250 Danish ships visited the port, but the numbers declined clearly in the following century. Already at the beginning of the 1770s, numbers were decreasing, but a sharper decline followed the First Partition of Poland (1772). While Danzig maintained its independent status, it was severed from its hinterlands by a Prussian zone and Prussian customs, which soon undermined its economic development. 63 These were such essential variables that they must be taken into account, even with regard to Danish and Copenhagen shipping.
Figure 3 shows a sharp rise in 1785–1786. This is explained by the last real subsistence crisis in Denmark, which led to massive imports of grain to Copenhagen. 64 The demand for tonnage was so great that even ships sailing normally in Mediterranean and Iberian trades were attracted to the Baltic in such numbers that the respective southern voyages clearly declined (see Figure 4b). Another high jump in 1793–1794 was, in contrast, of mercantile origin: grain was hoarded in Copenhagen in order to be exported to France (see section VIII, below). Except for these abnormal years, the volume of Danish shipping seems very modest and no long-term trend can be detected.
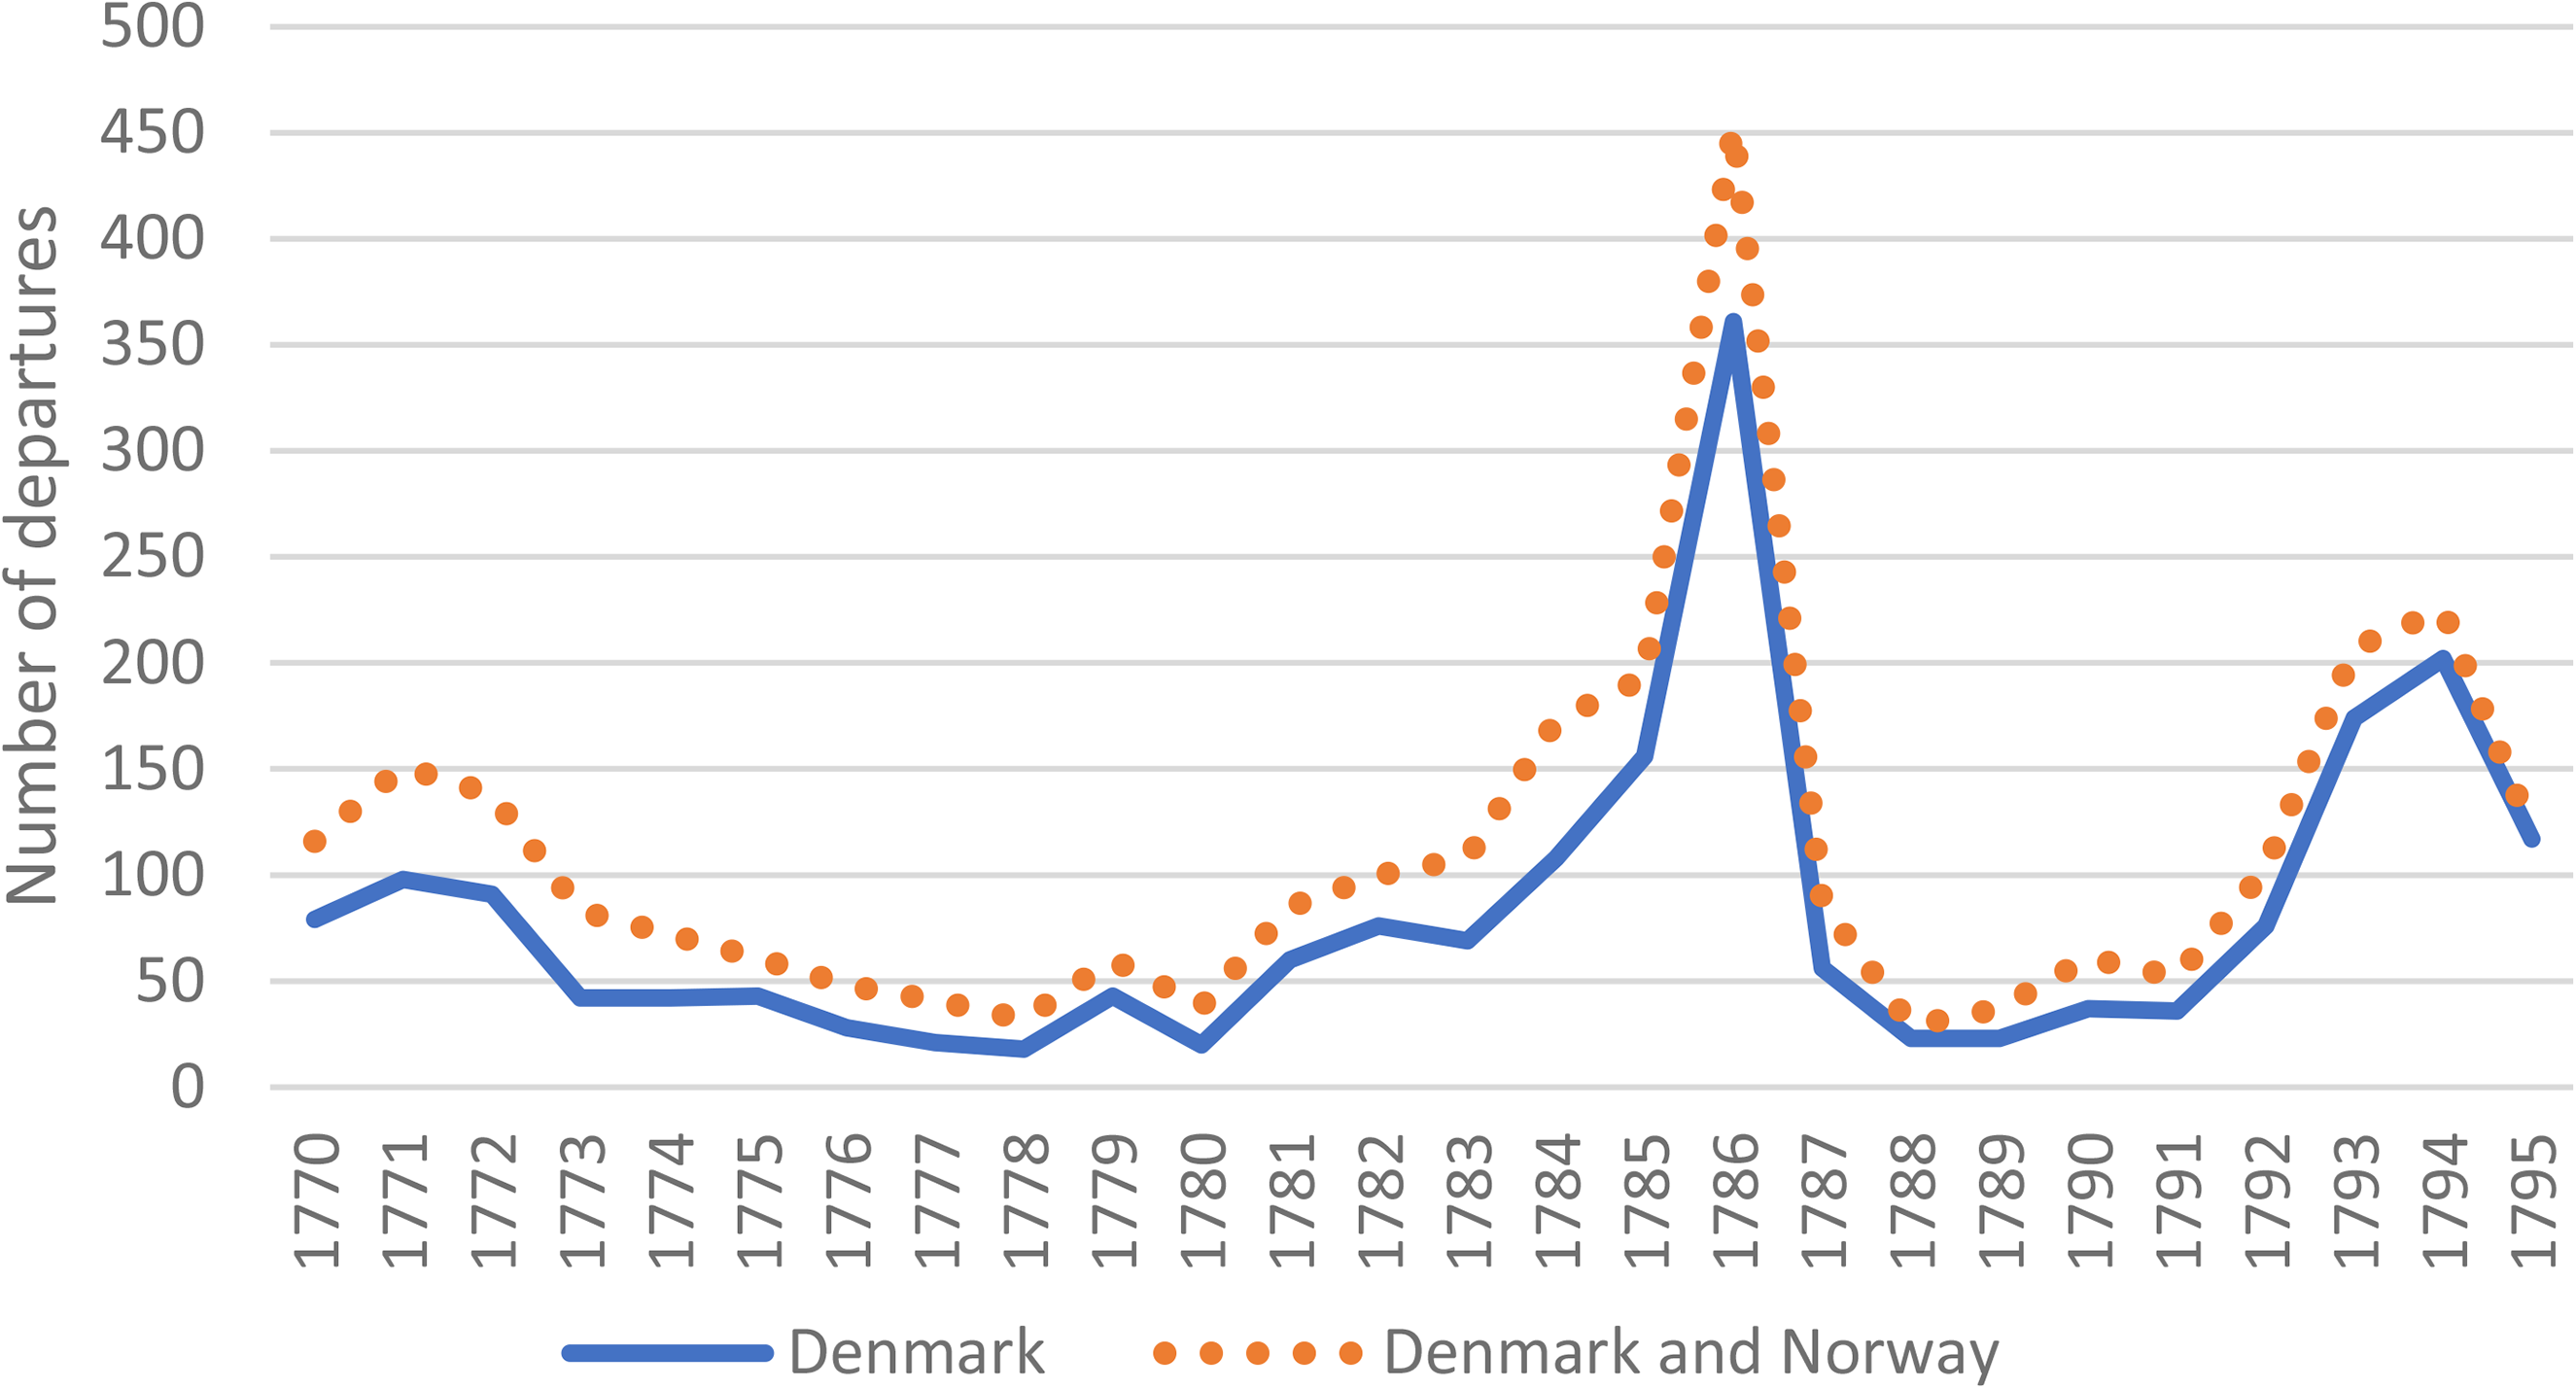
Departures from Danzig to Denmark and Norway, 1770–1795. 60
Further hints of Copenhagen's Baltic shipping can be found from the tonnage data of 1787. According to this source, the capital had 47 ships (with a total lastage of almost 1,900) deployed mainly in Baltic trades. 65 In the late 1760s, the corresponding number – supposing that ships sailing from Copenhagen to Danzig or farther made two return trips a year and those on short trades four or five – could have been around 50, roughly the same number as 20 years later. However, it seems very probable that even a few non-Copenhagen vessels carried Baltic cargo to the capital in the 1780s. In 1787, Flensburg, Aabenraa and Altona had some 140 vessels deployed in ‘other’ trades’; excluding Altona, most of them very probably were sailing in the Baltic. 66 Moreover, as the average size in 1787 rose to 40 lasts, the overall capacity might have grown by a quarter.
Later, Danish shipping to Russia seems to have increased slowly, just as the fragmentary St. Petersburg data suggests. According to a contemporary statistical publication, in 1773–1777, Russian Baltic ports counted 177 visits a year by Danish vessels; in 1793–1795 (when Courland had been incorporated into Russia), the number grew from 213 to 298, subsequently jumping to 572 and 462 in the following two years. 67 The most obvious explanation for this sudden boom is that Danish ships sailing to Libau and other Courland ports now became included in Russian statistics (of course, it is also possible that Dutch traders were sailing under the Danish flag after the demise of Dutch shipping in 1795). However, even if Danish Russian trade did not experience any real boom, the numbers suggest that, in addition to 90–100 vessels recorded in the earlier statistics, 240–280 more had been sailing regularly to eastern Baltic ports. Many of them may have come from Danish provincial ports: according to the data published by Monrad Møller, in 1798, there were 180 voyages from Baltic ports (excluding Lübeck), of which 90 per cent (158 voyages) went to Copenhagen. 68 Obviously, a similar, or bigger, Baltic boom was experienced in Flensburg and Aabenraa, 69 and it seems probable that many of these ships, like those from Danish provincial ports, carried their cargo to Copenhagen. Thus, while the capital was not very active in the Baltic trades, it still received increasing amounts of cargo from Russian and, very probably, other eastern Baltic ports. Compared with the situation in the 1760s and 1770s, this was a substantial growth. Most of the vessels may have been fairly small, around 15−20 lasts, but with more than 300−400 voyages a year, the commodity flows probably exceeded 5,500−6,000 Danish lasts.
Unfortunately, a major group of Baltic entrants – those from Sweden – happens to be the most difficult to document after the 1760s. At the same time, it is the easiest to outline. Sweden not only restricted imports by its ‘navigation act’ (produktplakatet) but also decreed discriminative customs dues, which prevented the export of iron and sawn timber on foreign vessels. 70 Accordingly, all ships that brought these key products from Sweden to Copenhagen must have been Swedish. Is it unsurprising that the 1787 data on Copenhagen-based shipping does not mention a single vessel deployed in Swedish trade.
Swedish foreign-trade statistics provide quite a good record of the destinations of the most important exports goods, such as iron, tar, sawn wood and herring. As far as shipping volumes are concerned, the most important items were sawn wood and limestone: they demanded more of the available cargo space than any other exports. 71 The most important destinations for Swedish sawn wood, representing between a third and a half of the total exports, were the ‘Baltic countries’ (östersjöländerna). However, this only concerned the westernmost Baltic coasts; no regions east of Rostock imported wood products – they were exporters. Accordingly, the main recipients of Swedish sawn wood were Lübeck, eastern Holstein and Schleswig and Copenhagen plus, on a much smaller scale, a few neighbouring ports. In the 1760s, as seen before, Lübeck received 50 per cent more Swedish ships than the Danish capital, and this probably reflected differences in import volumes. Some idea of later developments can be gained by comparing the relative growth of Swedish sawn-wood exports to ‘Baltic countries’ and the arrivals of Swedish ships in Lübeck (Table 8).
Swedish exports of sawn wood to the Baltic countries and arrivals of Swedish ships in Lübeck.
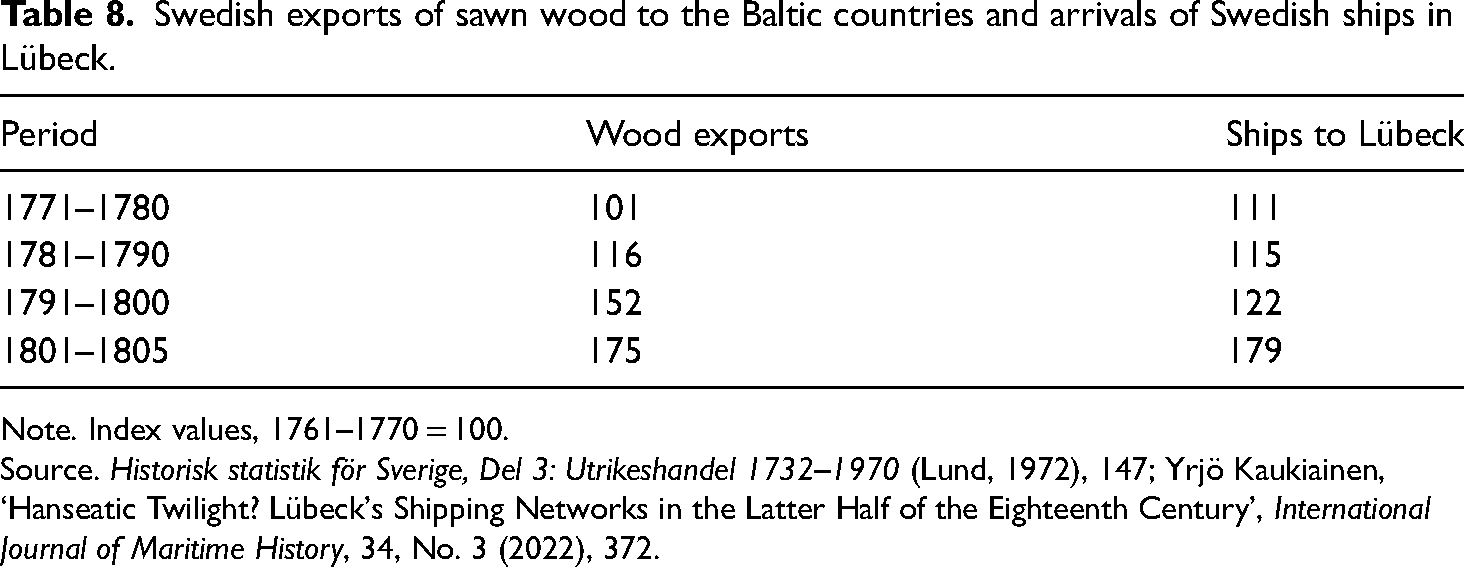
Note. Index values, 1761–1770 = 100.
Source. Historisk statistik för Sverige, Del 3: Utrikeshandel 1732–1970 (Lund, 1972), 147; Yrjö Kaukiainen, ‘Hanseatic Twilight? Lübeck's Shipping Networks in the Latter Half of the Eighteenth Century’, International Journal of Maritime History, 34, No. 3 (2022), 372.
In spite of certain irregularities, both series developed in the same direction and presented fairly similar overall results: an increase of about 75 per cent. Such similarity suggests that no fundamental redistribution of imports took place after the 1760s between Lübeck and Copenhagen. Accordingly, we may suppose that arrivals from Sweden in Copenhagen increased from about 100 to somewhere between 150 and 200, probably representing some 9,000 Swedish lasts. In spite of this brisk growth, Baltic trades did not increase in their overall importance. On the contrary – as the total tonnage of western arrivals in Copenhagen trebled between the 1760s and the turn of the century (probably exceeding 40,000 lasts), the proportion of Baltic cargo (guesstimated at 15,000 lasts) seems to have dropped below a third (25–30 per cent). 72
VIII
In the history of Danish shipping, and in particular that of Copenhagen, the 1750s and 1760s have been characterized as a stagnant period, while the times after about 1775 have been termed florissante. This emphasis on a sudden sharp turn in the path of growth is mainly based on earlier uncertain tonnage statistics. According to figures that, still in the early 1990s, seem to have been the only available, the tonnage of Copenhagen skyrocketed from around 10,000 lasts before 1777 to almost 29,000 in the next five years. 73 However, the voyage data presented in this study makes it difficult to believe that the jump in 1777–1782 was so steep. 74 It suggests that some growth had already taken place in the late 1750s, as well as between 1771 and 1777 (see Figures 1a and 1b).
As ships in short-sea shipping made many more annual voyages than ocean traders, the voyage data cannot provide a reliable yardstick for comparing trade-specific transport volumes. Therefore, it is better to look separately at the development of different sectors. This has been done in Figures 4a and 4b. In this case, the data is presented on a logarithmic (ratio) scale, which shows relative changes correctly. Thus, we can see that the curves for arrivals from Norway, the North Atlantic and Great Britain flow quite smoothly, without any sudden transitions towards a ‘flourishing’ mode. On the other hand, the curves for West India and the Far East fluctuate dramatically and the former, in particular, presents a steep peak in the early 1780s, coinciding almost perfectly with the war between Britain and France, as well as the Anglo-Dutch naval conflict. Another prominent peak can be found for Atlantic France in 1794–1795. This peak appears even sharper in the data for departures (see Figure 2b).
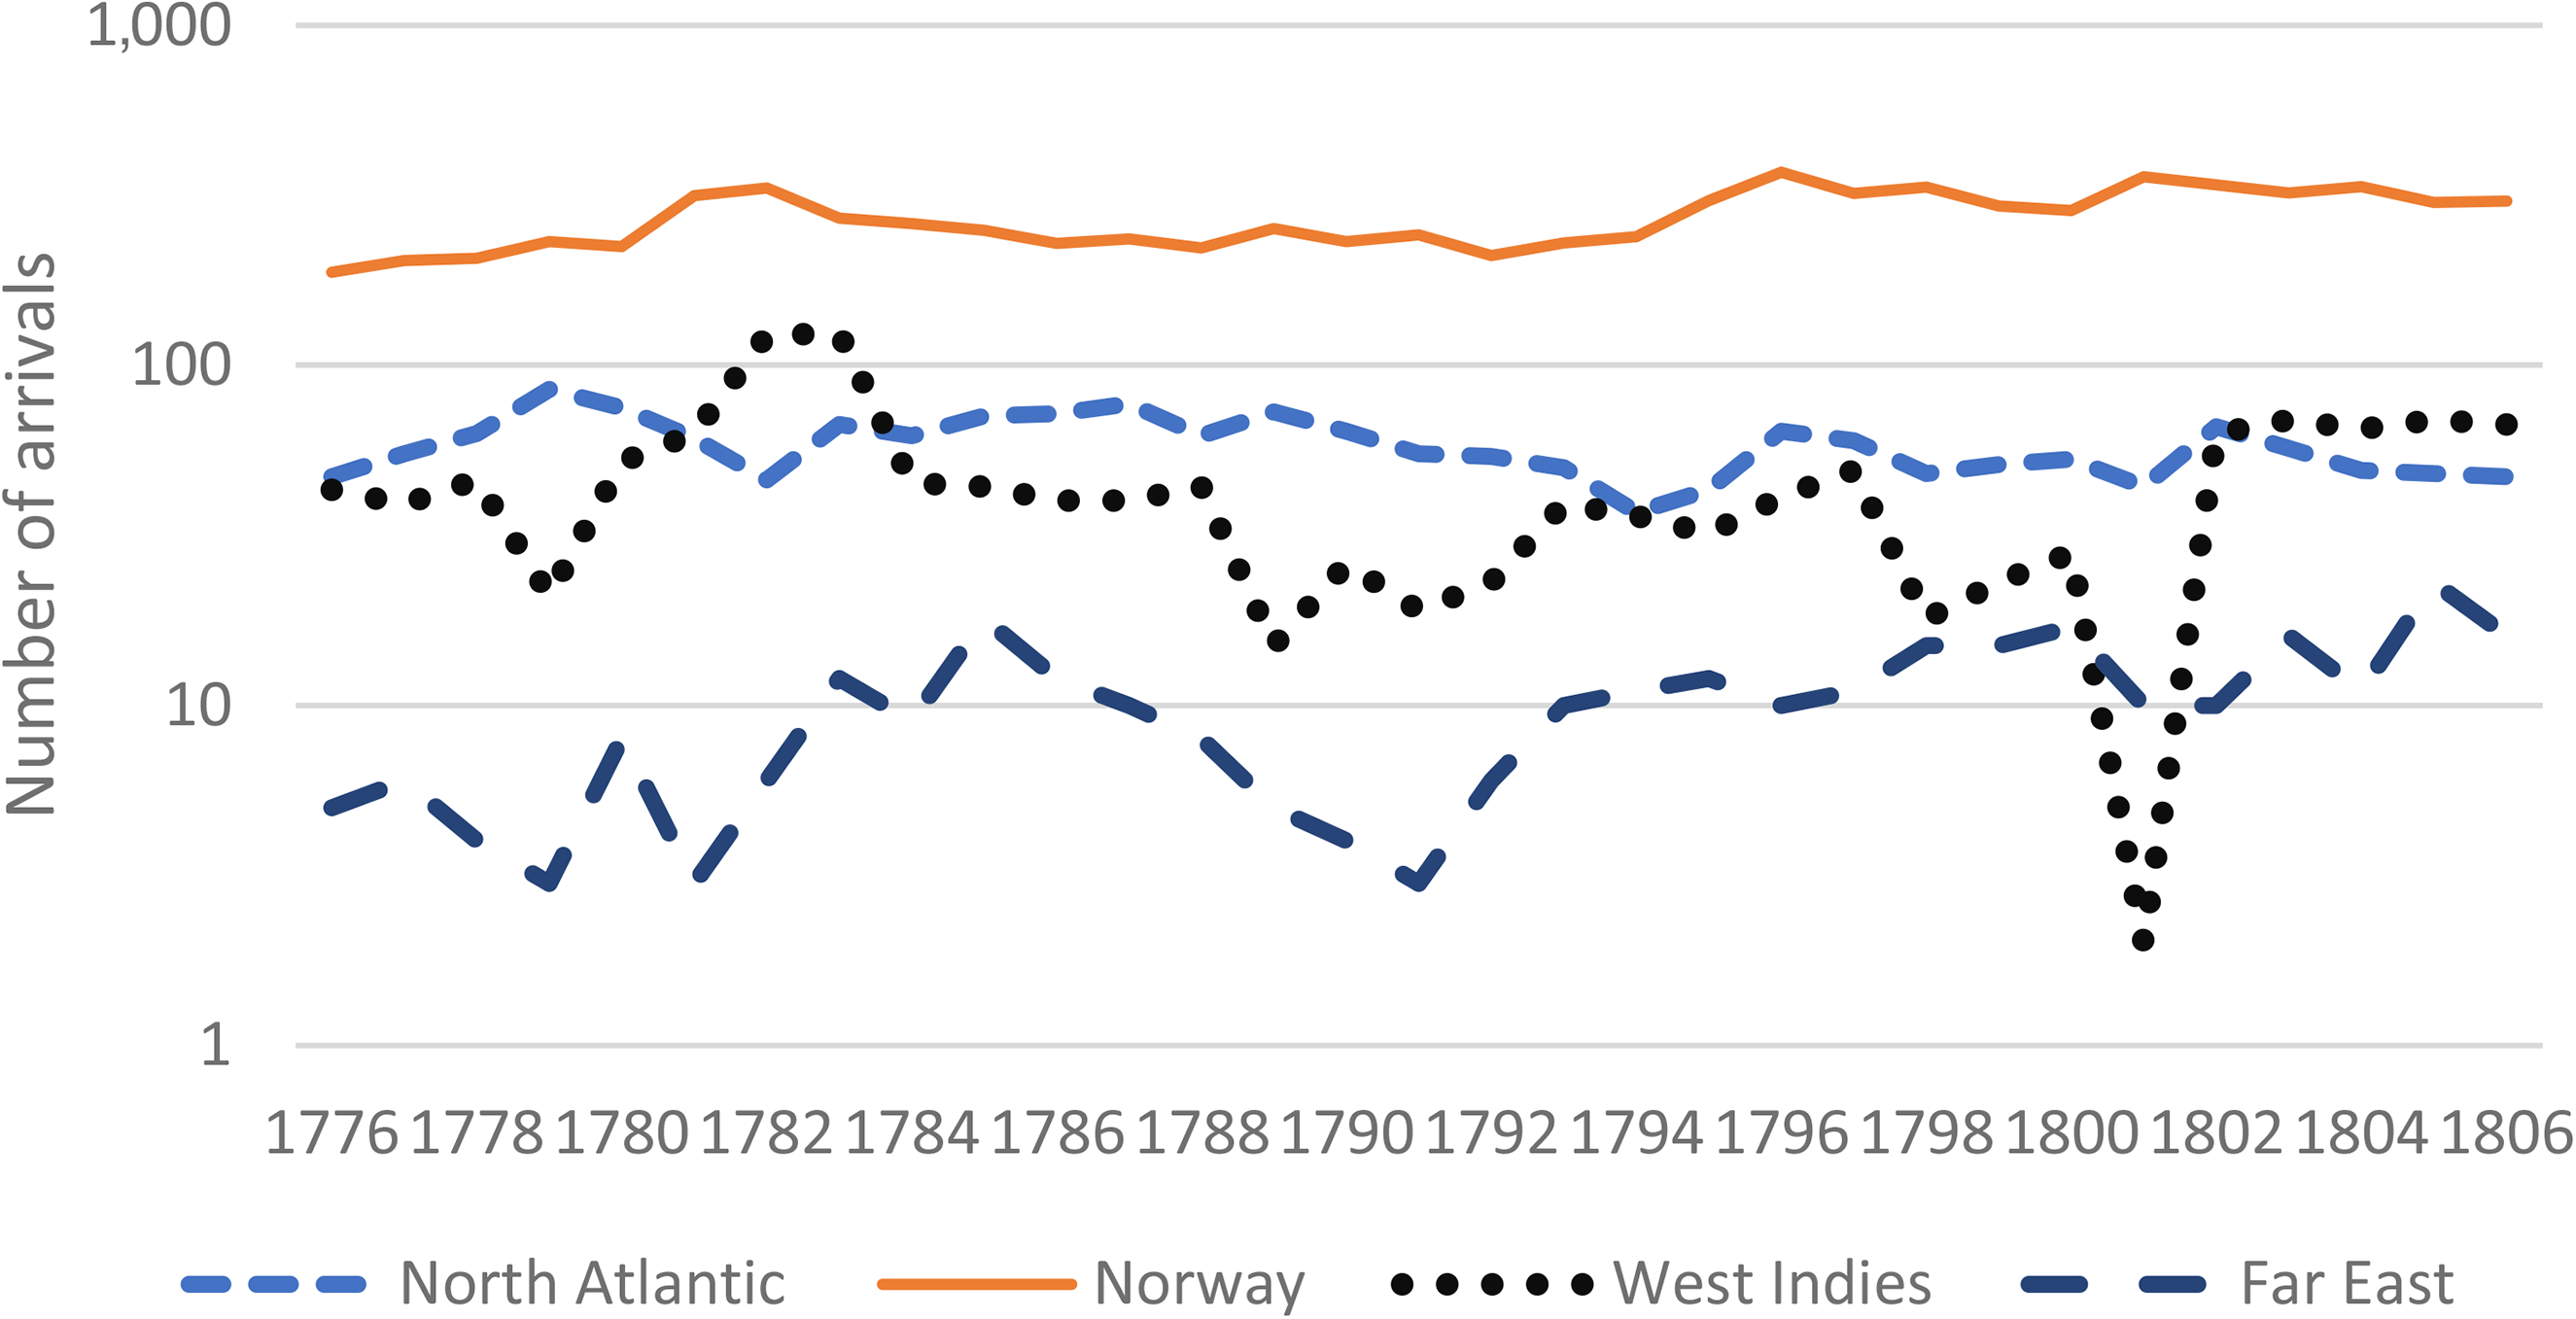
Arrivals in Copenhagen of different trades, 1776–1806: domestic and ‘colonial’ trades.
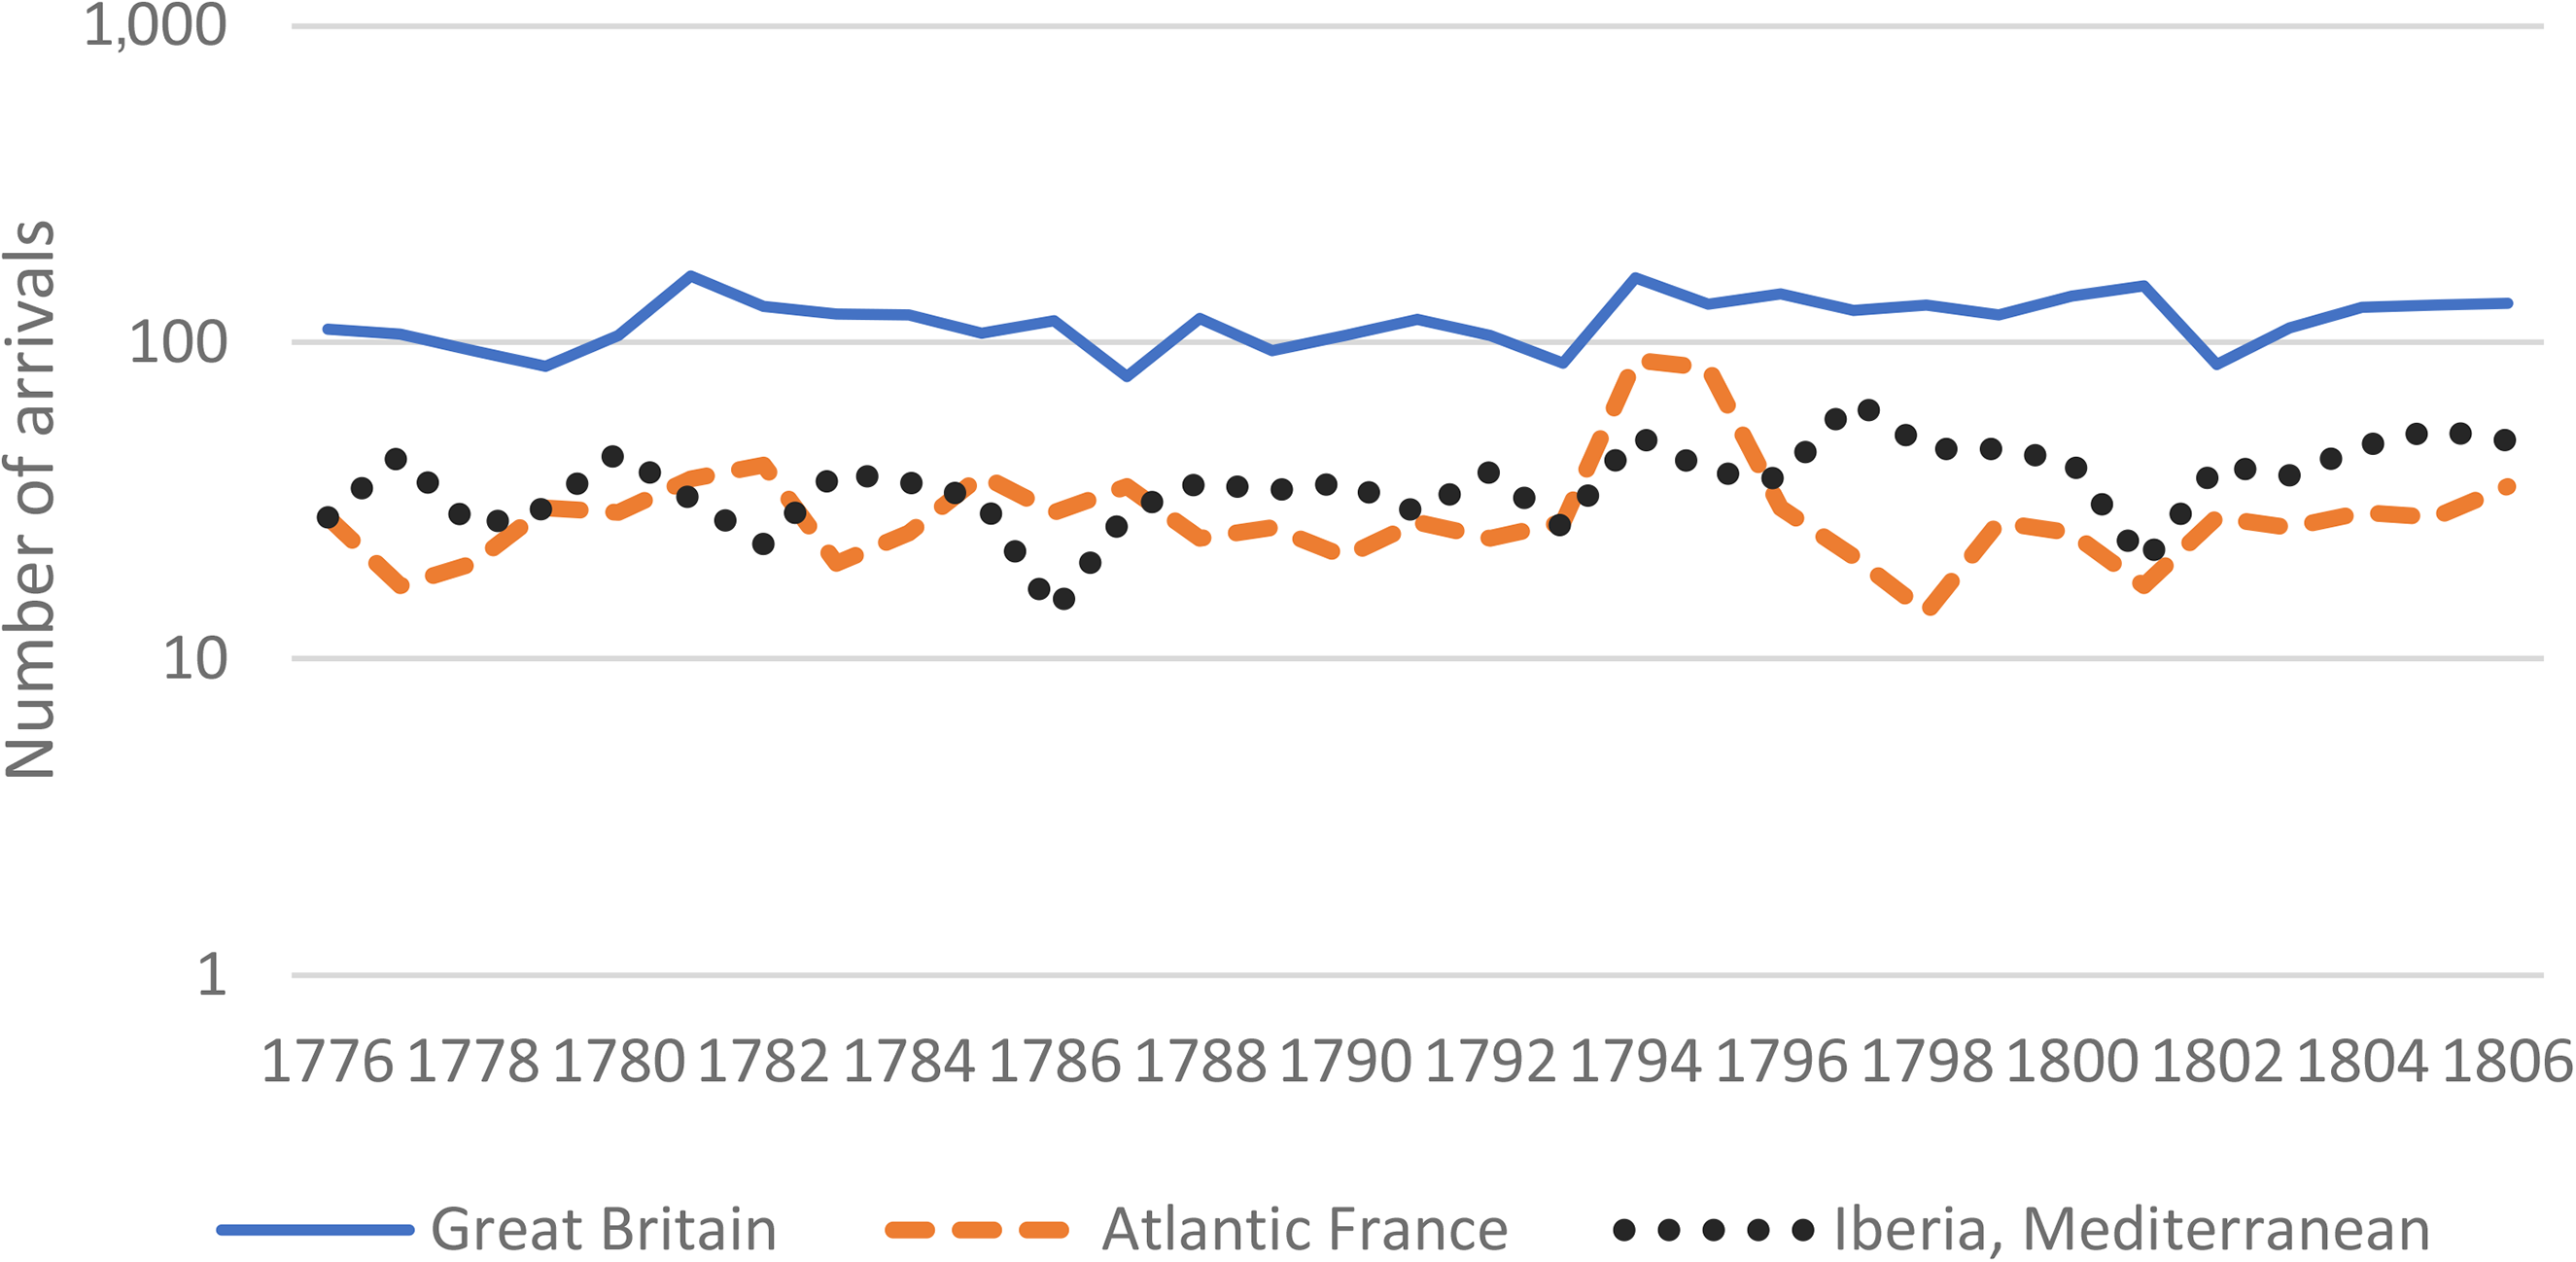
Arrivals in Copenhagen of different trades, 1776–1806: ordinary foreign trades.
West Indian shipping was, in fact, at the core of the first peak mentioned above. Before the American Revolutionaty War, some 40–50 Danish ships were deployed annually in this trade. 75 The unexpected French attack on British Domenica (in September 1778) seems to have caused a shock for Caribbean sugar and coffee producers. As the war disturbed both British and French shipping, neutral ships were soon in great demand. Already in 1780, arrivals in Copenhagen from the West Indies exceeded the pre-war level, and the number more than doubled over the course of the next two years. However, the overall growth seems to have been higher than this. In just three years (1780–1782), a total of 421 ships, bound for the West Indies, were supplied with Algerian sea-passes, while corresponding arrivals to Copenhagen from West Indies amounted to 259 – and only 182 were ships based in the capital. 76 This means that, at the height of the boom, Copenhagen's own tonnage did not dominate and even some forty percent of cargoes went to other ports than the capital. 77
Such growth – over 30 per cent a year – tells of the substantial influx of new tonnage, even in Copenhagen. Some tonnage was probably removed from the Greenland trade (which employed ships big enough for the Caribbean): parallel with the West Indies boom, arrivals from Greenland in Copenhagen almost halved. Similar redeployments may also have taken place in other ports in the monarchy, such as Altona and Flensburg. Some increase also resulted from new building and the buying of second-hand tonnage from abroad. However, it is obvious that a substantial share of the tonnage additions consisted of foreign ships with pro forma changes of flag. 78 Most cargoes were loaded in the Danish West Indies, but even Spanish Santo Domingo, as well as French Martinique and Port au Prince, were recorded as ports of departure. 79 The rules of neutrality required all cargo to be brought to Danish ports, but this rule was not strictly followed. It seems probable that most of the goods landed in Copenhagen were later re-exported to other destinations.
The Treaty of Paris (September 1783) brought an abrupt end to this lucrative trade. Arrivals from the West Indies in Copenhagen dropped by two-thirds; as an indication of a return to the earlier normal, even the Greenland trade recovered. On the other hand, excessive Danish investments during the war boom resulted in substantial laid-up tonnage in the mid 1780s. 80 The West Indies trade improved slightly with the onset of the French Revolutionary Wars but experienced an extremely deep dive in 1801 – obviously the short war with Britain stopped most of Danish shipping for a period. A new rise and a fairly good stable period ensued in the following years and continued until the end of 1806.
Danish Far East shipping also experienced its own war booms. However, the first of these, at the beginning of the 1780s, was so brief that only a few Danish shipowners managed to profit from it. 81 Better fortunes were met by Danish shipping in the 1790s after the British naval blockade had severed French and, after 1795, also Dutch connections with their overseas colonies. Several Danish ships sailed beyond the Cape of Good Hope in order to carry sugar, coffee and other colonial goods from Isle de France (Mauritius) or Batavia to Europe (a few British and Dutch tried their fortunes with Danish sea passes). During the armistice and short peace (1801–1803), this camouflage shipping naturally stopped but, when war broke out again, it was quickly resumed. As Figure 4a shows, Danish Far East trade fared unusually well until the fatal year of 1807. 82
The boom of the mid 1790s was a totally different story. As noted above (see Figure 3), great quantities of grain were imported from eastern Baltic ports to Copenhagen from 1792, obviously speculating on a rise in grain prices after the war against France broke out in April. When Great Britain joined the war in February 1793 and blockaded French ports, France started to buy provisions from North America and neutral northern European states – in particular, Denmark. Copenhagen merchants found this a profitable trade and the first shipments of grain were sent in August 1793. Much bigger volumes – mainly Baltic wheat and rye – were imported and re-exported until the end of 1795; during this time, over 300 shiploads were sent to France, with practically all of them loaded in Copenhagen. 83 It is obvious that these transactions were also organized and coordinated in Copenhagen, and the capital even provided over one-third of the participating ships. The fleet also included many ships from Norway, the Danish provinces and Sweden (including Swedish Pomerania), a few from Holstein, five North Americans plus one from Emden. All these ships were flying neutral flags, thus trying to avoid interventions by the British navy. At first, the transports were camouflaged with papers indicating false destinations in Portugal and Spain (and such destinations were also registered in the Sound Toll). Around 50 ships were seized by the British but, at least in 1795 when Britain suffered bad harvests, the confiscated ships were only taken to British ports, where the cargo was bought and unloaded, and freight was paid. Accordingly, false destinations were no longer needed. 84 It seems obvious that, for most shipowners, this was a very profitable business.
In some respects, this export ‘boom’ was a similar short-term fluctuation to that in 1786 when over 500 shiploads of grain were imported from Danzig alone to relieve the subsistence crisis in Copenhagen. However, these were the only boom-like phenomena in the shipping data of Copenhagen between 1790 and 1806. Of course, it should be remembered that arrivals in or departures from the capital reflect the development of Mediterranean trades quite poorly. However, as far as Copenhagen is concerned, the numbers of Algerian sea passes reached their highest levels exactly around the middle of the 1790s, declined clearly afterwards – in particular, because of conflicts with the Barbary states – and only recorded a small rise around 1805. 85 Thus, it seems that, as far as shipping in the port of Copenhagen is concerned, the ‘flourishing’ period consisted of a few short bursts of activity rather than sustained longer-term growth. Moreover, these bursts typically concerned only limited sectors of shipping – any substantial growth on a broad front could not be detected in the capital's shipping.
The parameters of growth presented in Table 9 are based on the earlier estimates of tonnages (Table 2), which means that they should be understood as crude approximations. Yet the differences between the main sectors of shipping are so pronounced that they clearly exceed potential margins of error. It seems that intra-monarchy and colonial trades did not experience very good overall development. Thus, Sector A (North Atlantic and Norwegian trades) presents only modest growth and Sector C, while experiencing top-rate growth until the 1780s, declined during the two last decades. By far the best overall performance was in Sector B, which comprised the genuine foreign trades. Not surprisingly, the dominating element, as far as arrivals are concerned, was British ships, but their role was extremely one-sided: they carried only a few cargoes from Copenhagen.
Growth ratios of estimated tonnage in various sectors of Copenhagen shipping according to arrivals recorded in STRO.
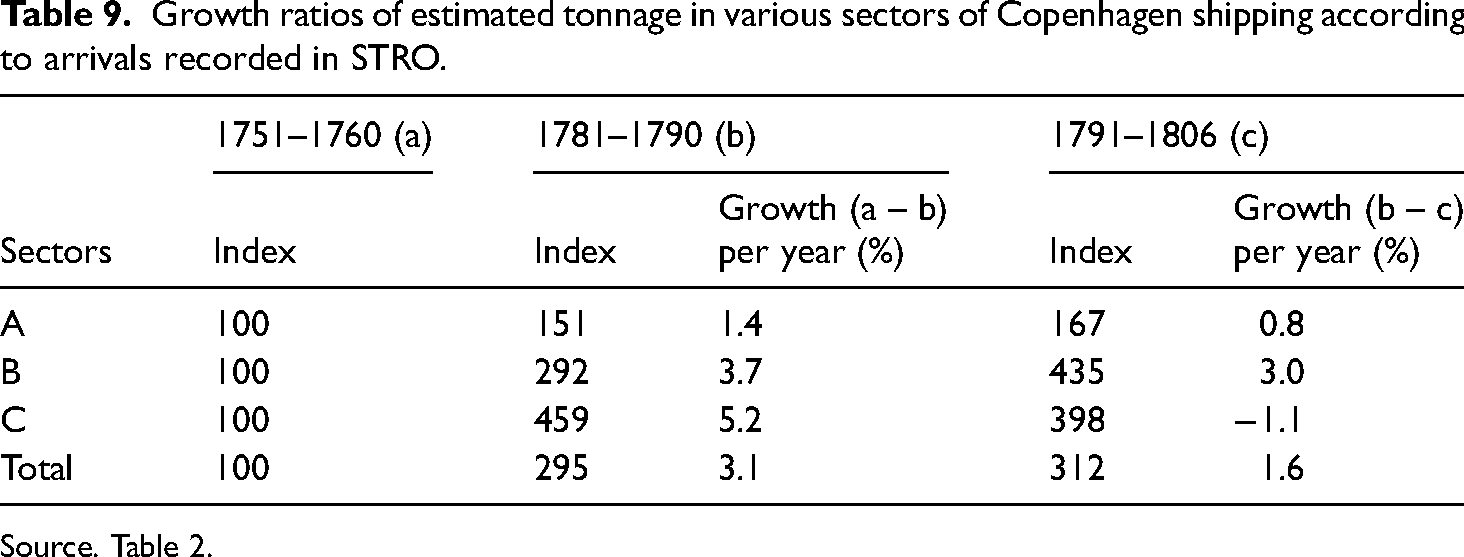
Source. Table 2.
One final conclusion remains to be presented. It seems that Copenhagen-based shipping was the critical element in this less-flourishing development. This is clearly seen in the tonnage of the capital's merchant navy. According to the available statistics, it declined from a high of about 30,000 lasts in 1782 to about 22,000 lasts in the mid 1790s; 86 while the following years saw a modest recovery to almost 26,000 lasts, this brief growth was followed by a new period of stagnation, and then, of course, the catastrophe after 1807. 87 The voyage data of Copenhagen-based ships (see Figure 5) tallies quite well with these tonnage statistics. It shows few traces of long-term flourishing – rather of the contrary.
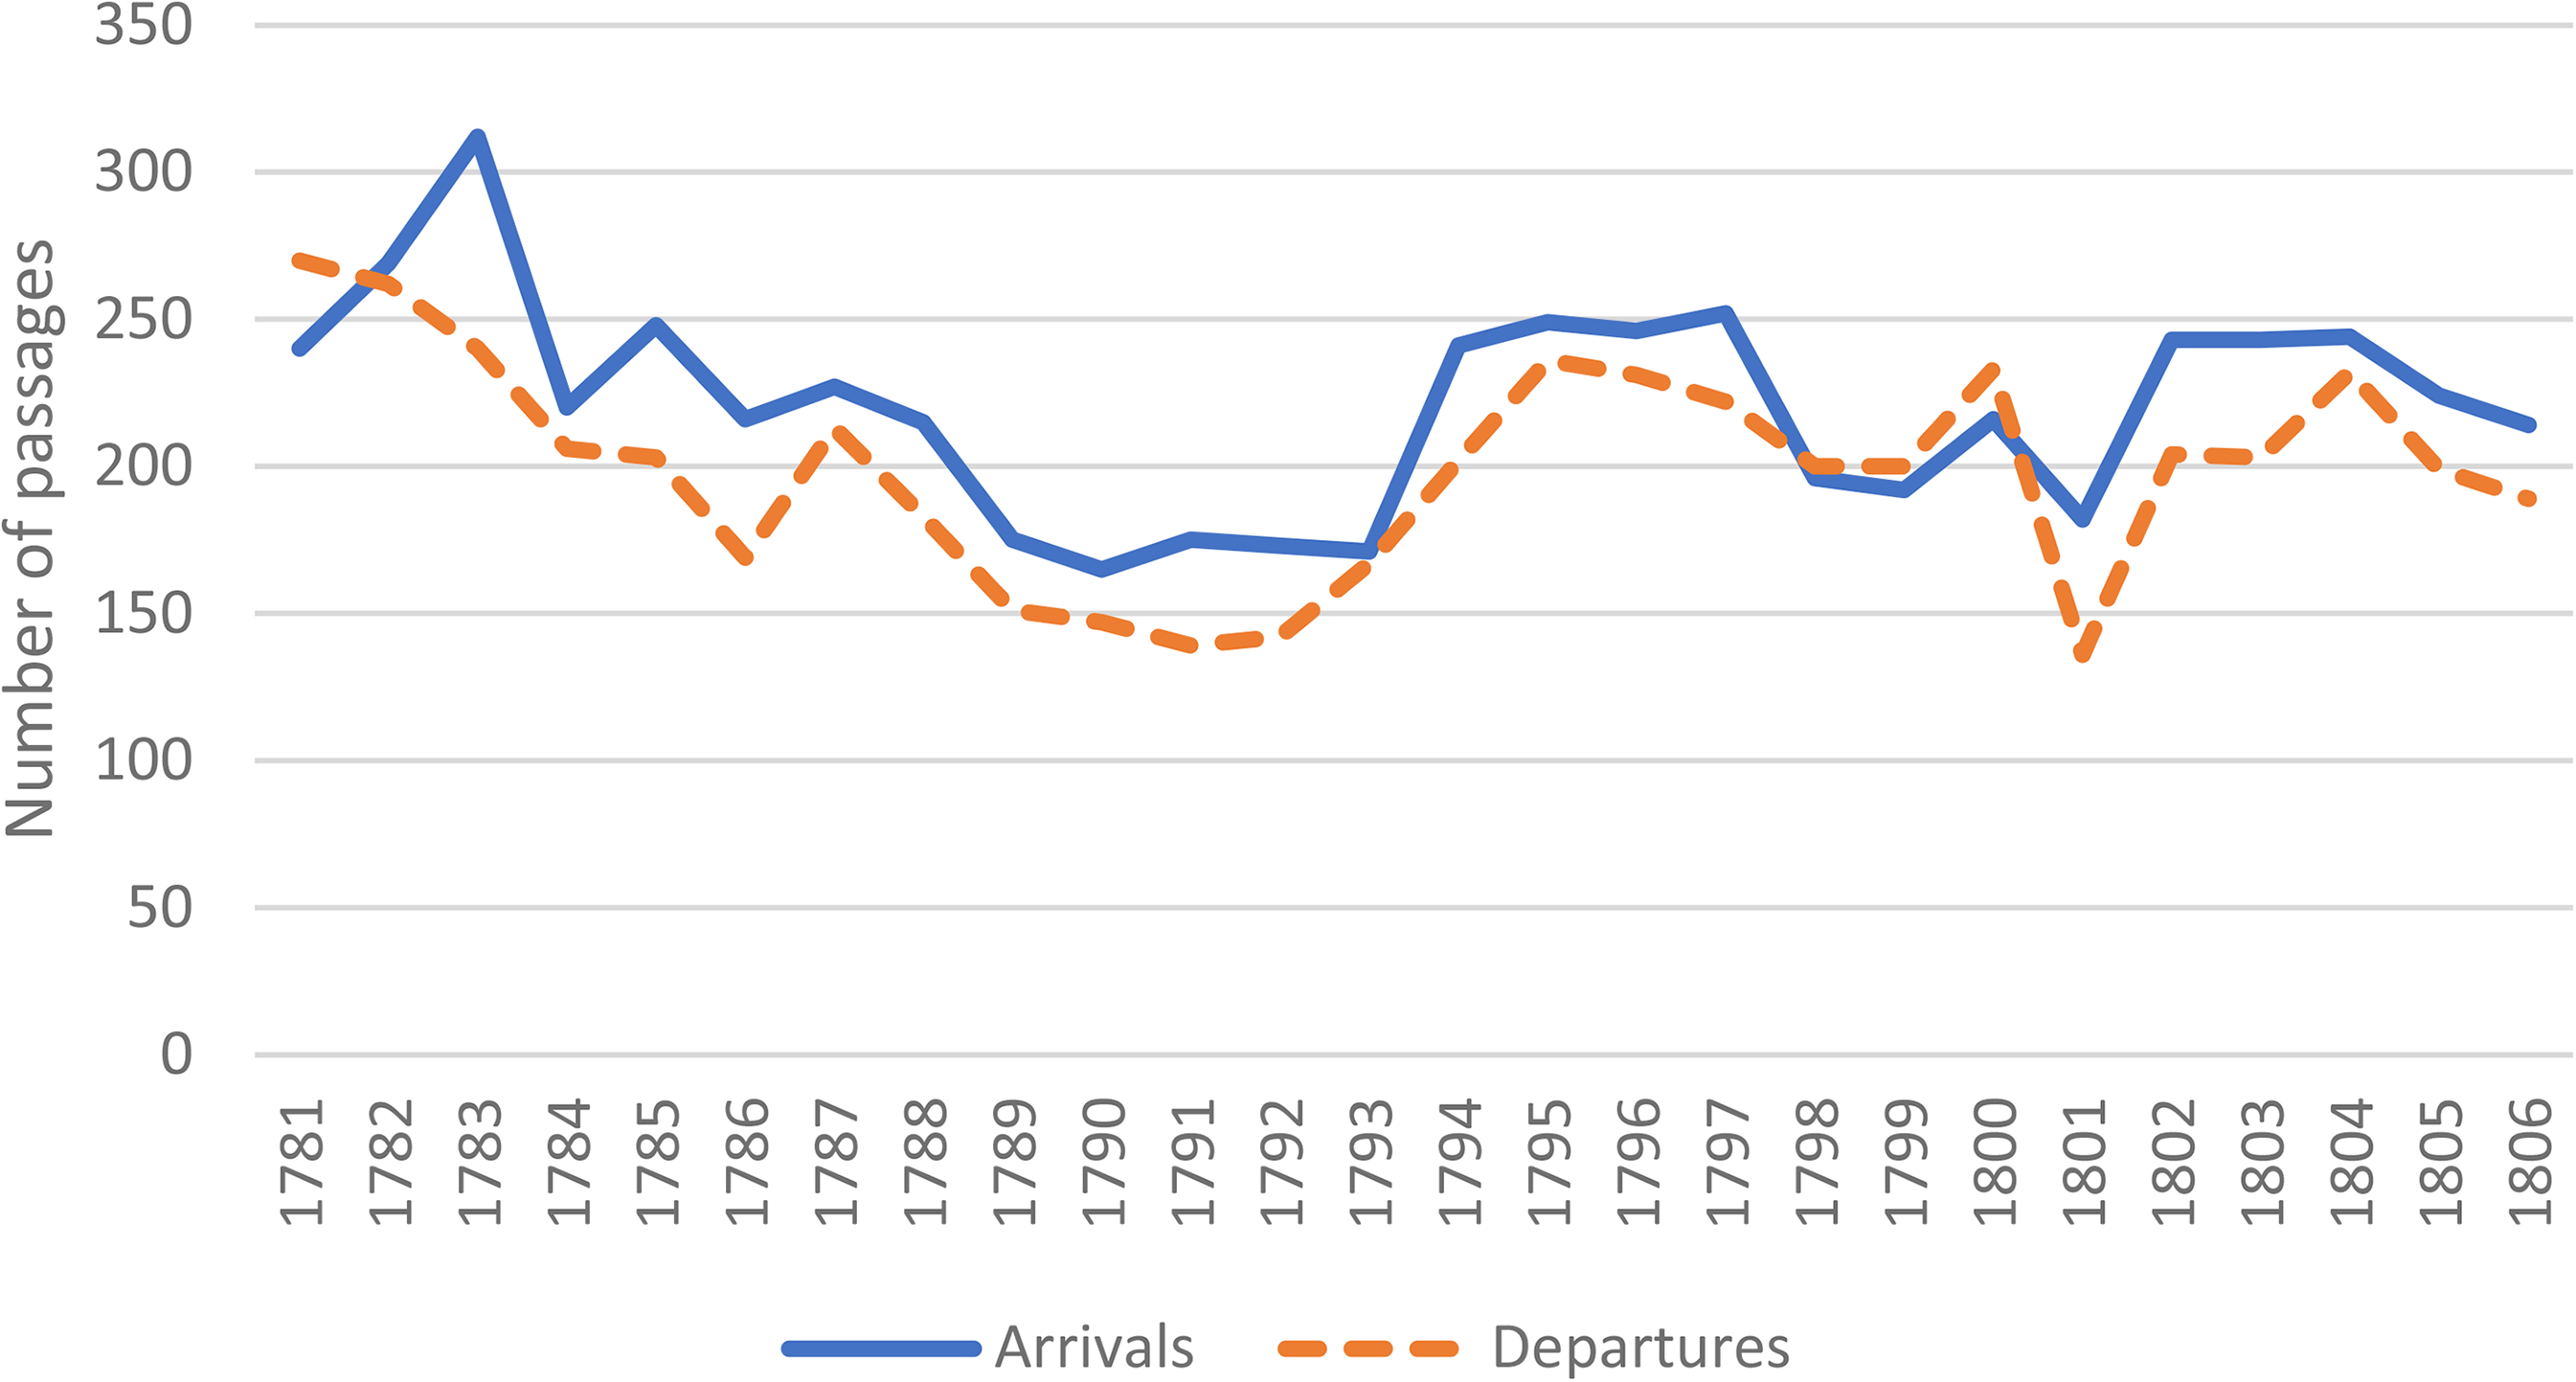
Copenhagen-based ships: western arrivals in and departures from Copenhagen, 1781–1806.
In other parts of the Danish monarchy, shipping fared better across these 25 years. In the Danish provinces – that is, seaports other than the capital – the overall tonnages grew from about 8,000 lasts in 1780 to almost 14,000 lasts in 1806. 88 Even two East Schleswig ports, Flensburg and Aabenraa, enjoyed fairly flourishing times: from 1780 to 1800, the former's tonnage trebled from 5,000 to almost 15,000 lasts. 89 Norway seems also to have been among the more successful regions: from about 47,000 lasts in 1787, its merchant navy grew to almost 53,000 lasts in 1797, thus achieving a share of 39 per cent of the monarchy's overall tonnage. 90 Accordingly, if there was any post-1780 success in Danish shipping, it depended on seaports other than Copenhagen.
IX
As already pointed out, steadily increasing numbers of Copenhagen-bound foreign vessels were recorded in Elsinore. In spite of this, domestic ships – that is, ships with their home in the Danish monarchy – were still in the clear majority at 67 per cent at the beginning of the nineteenth century. Thus, it was a totally different world than the ports of, for example, Kronstadt or Danzig, where domestic vessels only accounted for a small fraction of the total number of vessels. However, numbers had already dropped substantially from the average of about 85 per cent in the 1750s. 91 Moreover, if ‘domestic’ is defined in a narrower sense, only comprising vessels from Denmark proper, the figures are lower. They also present a systematically declining trend from almost 60 to less than 40 per cent (see Table 10). In contrast, the capital's share improved clearly until the 1780s but then plummeted, finally reaching an all-time low of below 30 per cent. As a net result, the role of Danish provincial shipping from abroad to Copenhagen diminished to a mere tenth of all western arrivals. Compared with such substantial changes, it seems surprising that Norwegian ships maintained a fairly stable share of the port's shipping.
Shares of domestic ships sailing to and from Copenhagen as recorded at Elsinore, 1751–1806.
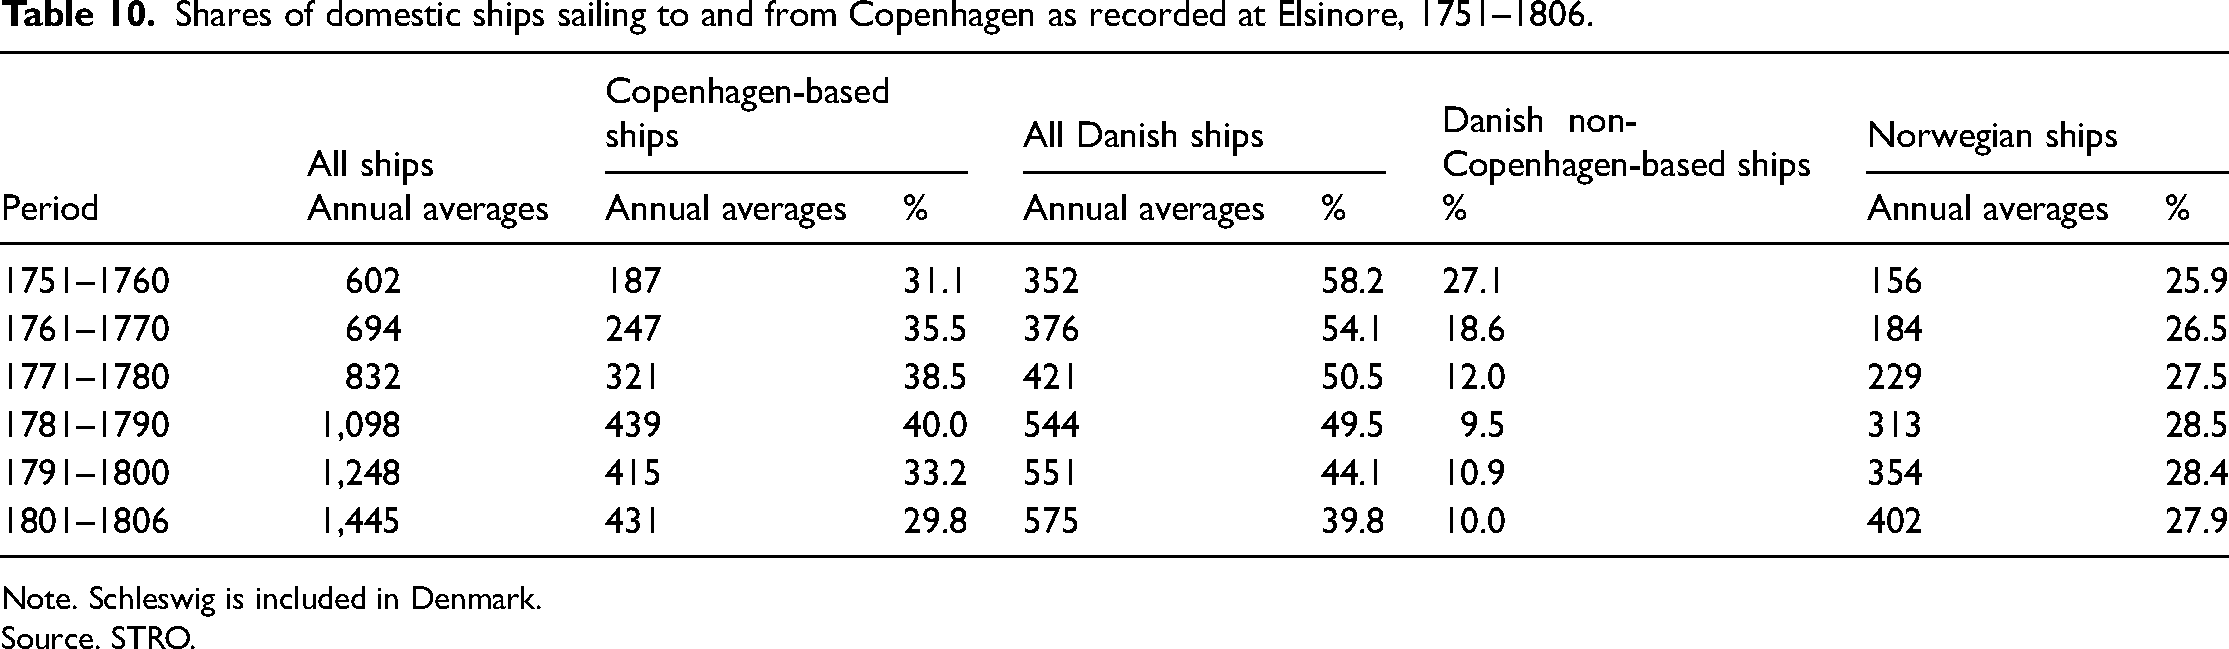
Note. Schleswig is included in Denmark.
Source. STRO.
For the Baltic sector, a reasonable estimation can be made using the data of the late 1760s. In this case, there were two directions with high foreign participation: arrivals from Sweden barely included any Danish ships and in the traffic between Lübeck and Copenhagen, German vessels seem to have been in the majority. 92 Supposing that the proportion of Danish ships in other Baltic trades was the same as in the Sound – excluding the Pomeranian firewood trade – the overall percentage of foreign arrivals from the Baltic amounts to 70–75. Reciprocally, this would decrease the overall rate of domestic arrivals in Copenhagen by about 10 per cent from the contemporary westward ratio (54 per cent) computed above.
While many aspects of the subsequent developments of Danish Baltic trades remain obscure, two essential changes can be detected. The obvious growth of Swedish imports brought more foreign ships to Copenhagen but, on the other hand, increasing numbers of Danish ships sailed to Russian ports. Even if no reasonable estimations can be made, it seems evident that these two developments counterbalanced each other to some degree and, accordingly, drastic changes in the balance between foreign and domestic shipping do not seem probable.
An abundance of foreign vessels was something that a mercantilist shipping policy would try to prevent. The capital's own shipping had a fairly positive record until the 1790s but declined thereafter to slightly lower levels than in the 1750s. A closer look at foreign shipping also shows that its growth mainly resulted from a few sectors. The first, of course, was the British trade, which contributed greatly to the overall growth of Copenhagen's shipping. Towards the end of the period, the growing North American trade – which was dominated by American ships – became a new foreign element. At the beginning of the nineteenth century, these two regions accounted for slightly more than half of all foreign ships. However, to put things into perspective, it should also be pointed out that, around 1800, arrivals from Norway were almost as high as those from Britain and North America, albeit that its ships were much smaller.
In the Baltic, Swedish ships were an equally important foreign element as the British and American ships on the western side. Taken together, these three groups, accounting for more than 300 arrivals at the turn of the century, represented roughly a third of all ships destined for Copenhagen. In one respect, they were similar: they imported domestic products from their respective countries – a trade that no ‘navigation act’ tried to prevent. 93
X
Fundamentally, the port of Copenhagen played a few different roles. First, it was the centre of coastal trade, which provisioned the metropole of over 80,000 people with food, firewood, building materials and other everyday necessities. As seen above, this function employed hundreds of small ships from the Danish provinces, Sweden and Pomerania – according to one estimation for the 1780s, about 550 solely from Denmark 94 – which each year delivered 3,000 or more shiploads of such commodities. 95 With the growth of the population, the volumes of imports grew: those of firewood (in spite of British coal), from almost 50,000 fathoms in the 1760s to over 60,000 in the 1780s (which seems to have been the apex), and of grain, from about 200,000 barrels in 1760 to 260,000 at the turn of the century. 96 In this role, Copenhagen was predominantly a receiving port. Coastal sailors naturally did some shopping in the city but such goods only filled a few odd corners of their vessels. 97
However, a proportion of the coastal cargo was distributed further afield. The second role of Copenhagen was to function as the centre of a maritime empire and a provider for its distant parts in the north as well as the south. Many Copenhagen ships loaded food and other necessities for either Iceland and other northern possessions or the Caribbean islands − and even military equipment for Guinean forts. In return, the ships brought different ‘colonial’ goods, from dried cod and whale blubber to sugar and coffee. The China trade, however, was a case apart: the Danish factory in Canton was not a real colonial agency but rather a commercial embassy.
Copenhagen’s chief role – at least as conceived by the Crown – was to act as the prime and privileged terminal for foreign imports and exports. This special role was strongly expressed in 1726 by an act declaring it the sole inlet for imports; although the Crown was soon forced to revoke the act, the capital, in practice, continued to enjoy its superior position with little competition. 98 To some degree, Copenhagen embodied typical mercantilist ideals: it collected products from the Danish colonies and subsequently exported them, thus promoting an active balance of trade. Such an ideal, however, could not be applied to all foreign trade: there were a number of major imports that the colonies could not supply, such as salt and wine. As seen above, Denmark lacked proper exports to pay for these imports, but the dilemma was solved by trans-shipping Baltic timber products or grain over Copenhagen (or through the Sound) to Atlantic France and Iberia. Such re-exports were not a Danish specialty; ships from Lübeck also sailed westward and southward with cargoes of timber and other eastern Baltic commodities.
In Lübeck, the system of trans-shipments was developed a step further so as to include eastward trades. Imports from wine and salt ports grew to volumes that clearly exceeded local demand, so large portions of them could be re-exported to other Baltic ports – in particular, St. Petersburg and Riga. Thus, acting as a middleman between south-west Europe and the Baltic world, the city was developing into an important entrepôt – that is, distribution and trans-shipment centre. The example it emulated was, of course, Amsterdam, which in the seventeenth century was the principal transmitter of salt, spices, wine, and other southern and colonial products to the Baltic countries. Still, after the middle of the next century, Amsterdam remained a serious challenger to Lübeck. 99
Did Copenhagen also act as an entrepôt for the Baltic ‘backwaters’? The modest scale of its Baltic shipping does not suggest equally active trans-shipments as those from Lübeck: in the early 1750s, some 60 voyages were annually made from Copenhagen to Danzig and East Prussian and Russian ports, while the corresponding figure for Lübeck amounted to over 150; in the late 1760s, again, the typical number of voyages was 70 from Copenhagen and about 200 from Lübeck. 100 Such an impression also finds support in the ship lists of the Danziger Anzeigen: the majority of Danish ships arrived at this port in ballast. In 1770, only 24 of the 124 Danish arrivals carried a cargo of stückgut (such as sugar, coffee, spices or manufactured goods), while three carried wine and just one salt; in 1795, the numbers were even lower – 21 of 117 ships from Copenhagen. 101 The evidence is, of course, narrow but at least it seems that the overwhelming majority of eastern Baltic voyages by Danish (Copenhagen) ships were connected with westward cargo (timber or grain to Copenhagen) rather than eastward trans-shipments of ‘western’ products to eastern ports. 102
On the other hand, Copenhagen received slightly more wine from French and Iberian ports than Lübeck – for example, in 1781–1783, the average import was 3,080 tuns (903 litres) a year while the respective volume for Lübeck was 2,850 tuns. 103 This data indicates an interesting discrepancy: the seaport with higher rates of eastward re-exports counted slightly lower numbers of import cargo from relevant southern ports. The fact that Lübeck also received wine by river transport obviously lowered the demand for Atlantic wine, but there was an more important factor to explain this seemingly illogical difference. As the population of Copenhagen was four to five times bigger than that of Lübeck, its consumption of wine exceeded the respective demand of the smaller city by a large margin. Accordingly, the Danish capital had − at least relatively speaking − a smaller import surplus available for re-export.
The big difference between imports and re-exports suggests strongly that the local metropolitan market was very important for Copenhagen-based shipping. For shipowning merchants, a strategic priority was to satisfy the capital's demand: with their privileged position, importing foreign consumption goods and selling them to the well-to-do classes must have been a lucrative, low-risk trade. In comparison, redeploying ships off the traditional wine and salt trade would have incurred substantial opportunity costs. 104 The terms seem to have been similar in West Indies and Far East shipping, which was also dominated by the capital's shipowners − and both represented the traditional ‘rich trades’. They even fared tolerably well from the mid 1790s and this, probably in combination with the unhappy memories of excessive speculation in the early 1780s, may have confirmed traditional attitudes, resulting in so-called ‘path dependency’. On the other hand, the capital's strong domination of the Far East and West Indies trades may reflect a comparative advantage (for example, good financial networks) in such capital-intensive shipping. Conversely, the modest participation in the flourishing Mediterranean trade may not have depended just on the traditional or over-cautious attitudes of shipowners. The success of Danish, Norwegian and Swedish shipping in the Mediterranean has been explained by the fact that, apart from their neutral flags, they had a major competitive edge in terms of low shipbuilding costs and low wages for sailors. 105 An axiomatic understanding is that these comparative advantages were at a prime in the peripheries and weakest in the central regions. On the Scandinavian scale, Copenhagen was the supreme centre, and thus hardly able to enjoy the comparative advantages of the northern peripheries. Accordingly, it may be suggested that the opportunity costs of not participating in the Mediterranean trades were much lower in Copenhagen than, say, Bergen or Gävle. Of course, the few of the flourishing seaports in the Danish monarchy, such as Flensburg and Aabenraa, were not on the periphery. However, they were also not endowed with populous and wealthy urban home markets like Copenhagen. Thus, facing limited profits when importing southern products for local consumption, a better alternative for them was to earn money by transporting goods between foreign ports.
It seems clear that Copenhagen shipowners did not share in the success of some of the other Danish seaports in the 1790s. Notwithstanding, the capital's merchant navy remained the biggest in the realm. The port of Copenhagen fared even better: in the long run, its traffic increased slightly quicker than the overall traffic through the Sound (see Figure 6). 106 In terms of visiting ships, it actually surpassed a number of its Baltic competitors in this period. In the 1760s (and until 1772), Danzig seems to have attracted the largest numbers, with 1,000–1,300 arrivals a year; Königsberg (600–800 ships) and Riga (on average, 635 ships) are the runners-up. Even at that time, Copenhagen, with 640 non-coastal arrivals, was among the biggest Baltic ports, ahead of, for example, Lübeck (on average 525 arrivals) and St. Petersburg (300–400 arrivals). In the 1780s, Copenhagen moved to the top with 900–950 annual arrivals, narrowly passing Riga (875 ships on average), St. Petersburg (802 ships) and Memel (700–800 ships), with Danzig (610 ships) now clearly trailing behind. On the verge of the Continental Blockade, Copenhagen still remained close to the top with St. Petersburg, Riga and Köningsberg, all accounting 1,000–1,100 arrivals; however, Danzig had then regained its former primacy with 1,200–1,900 arrivals. 107
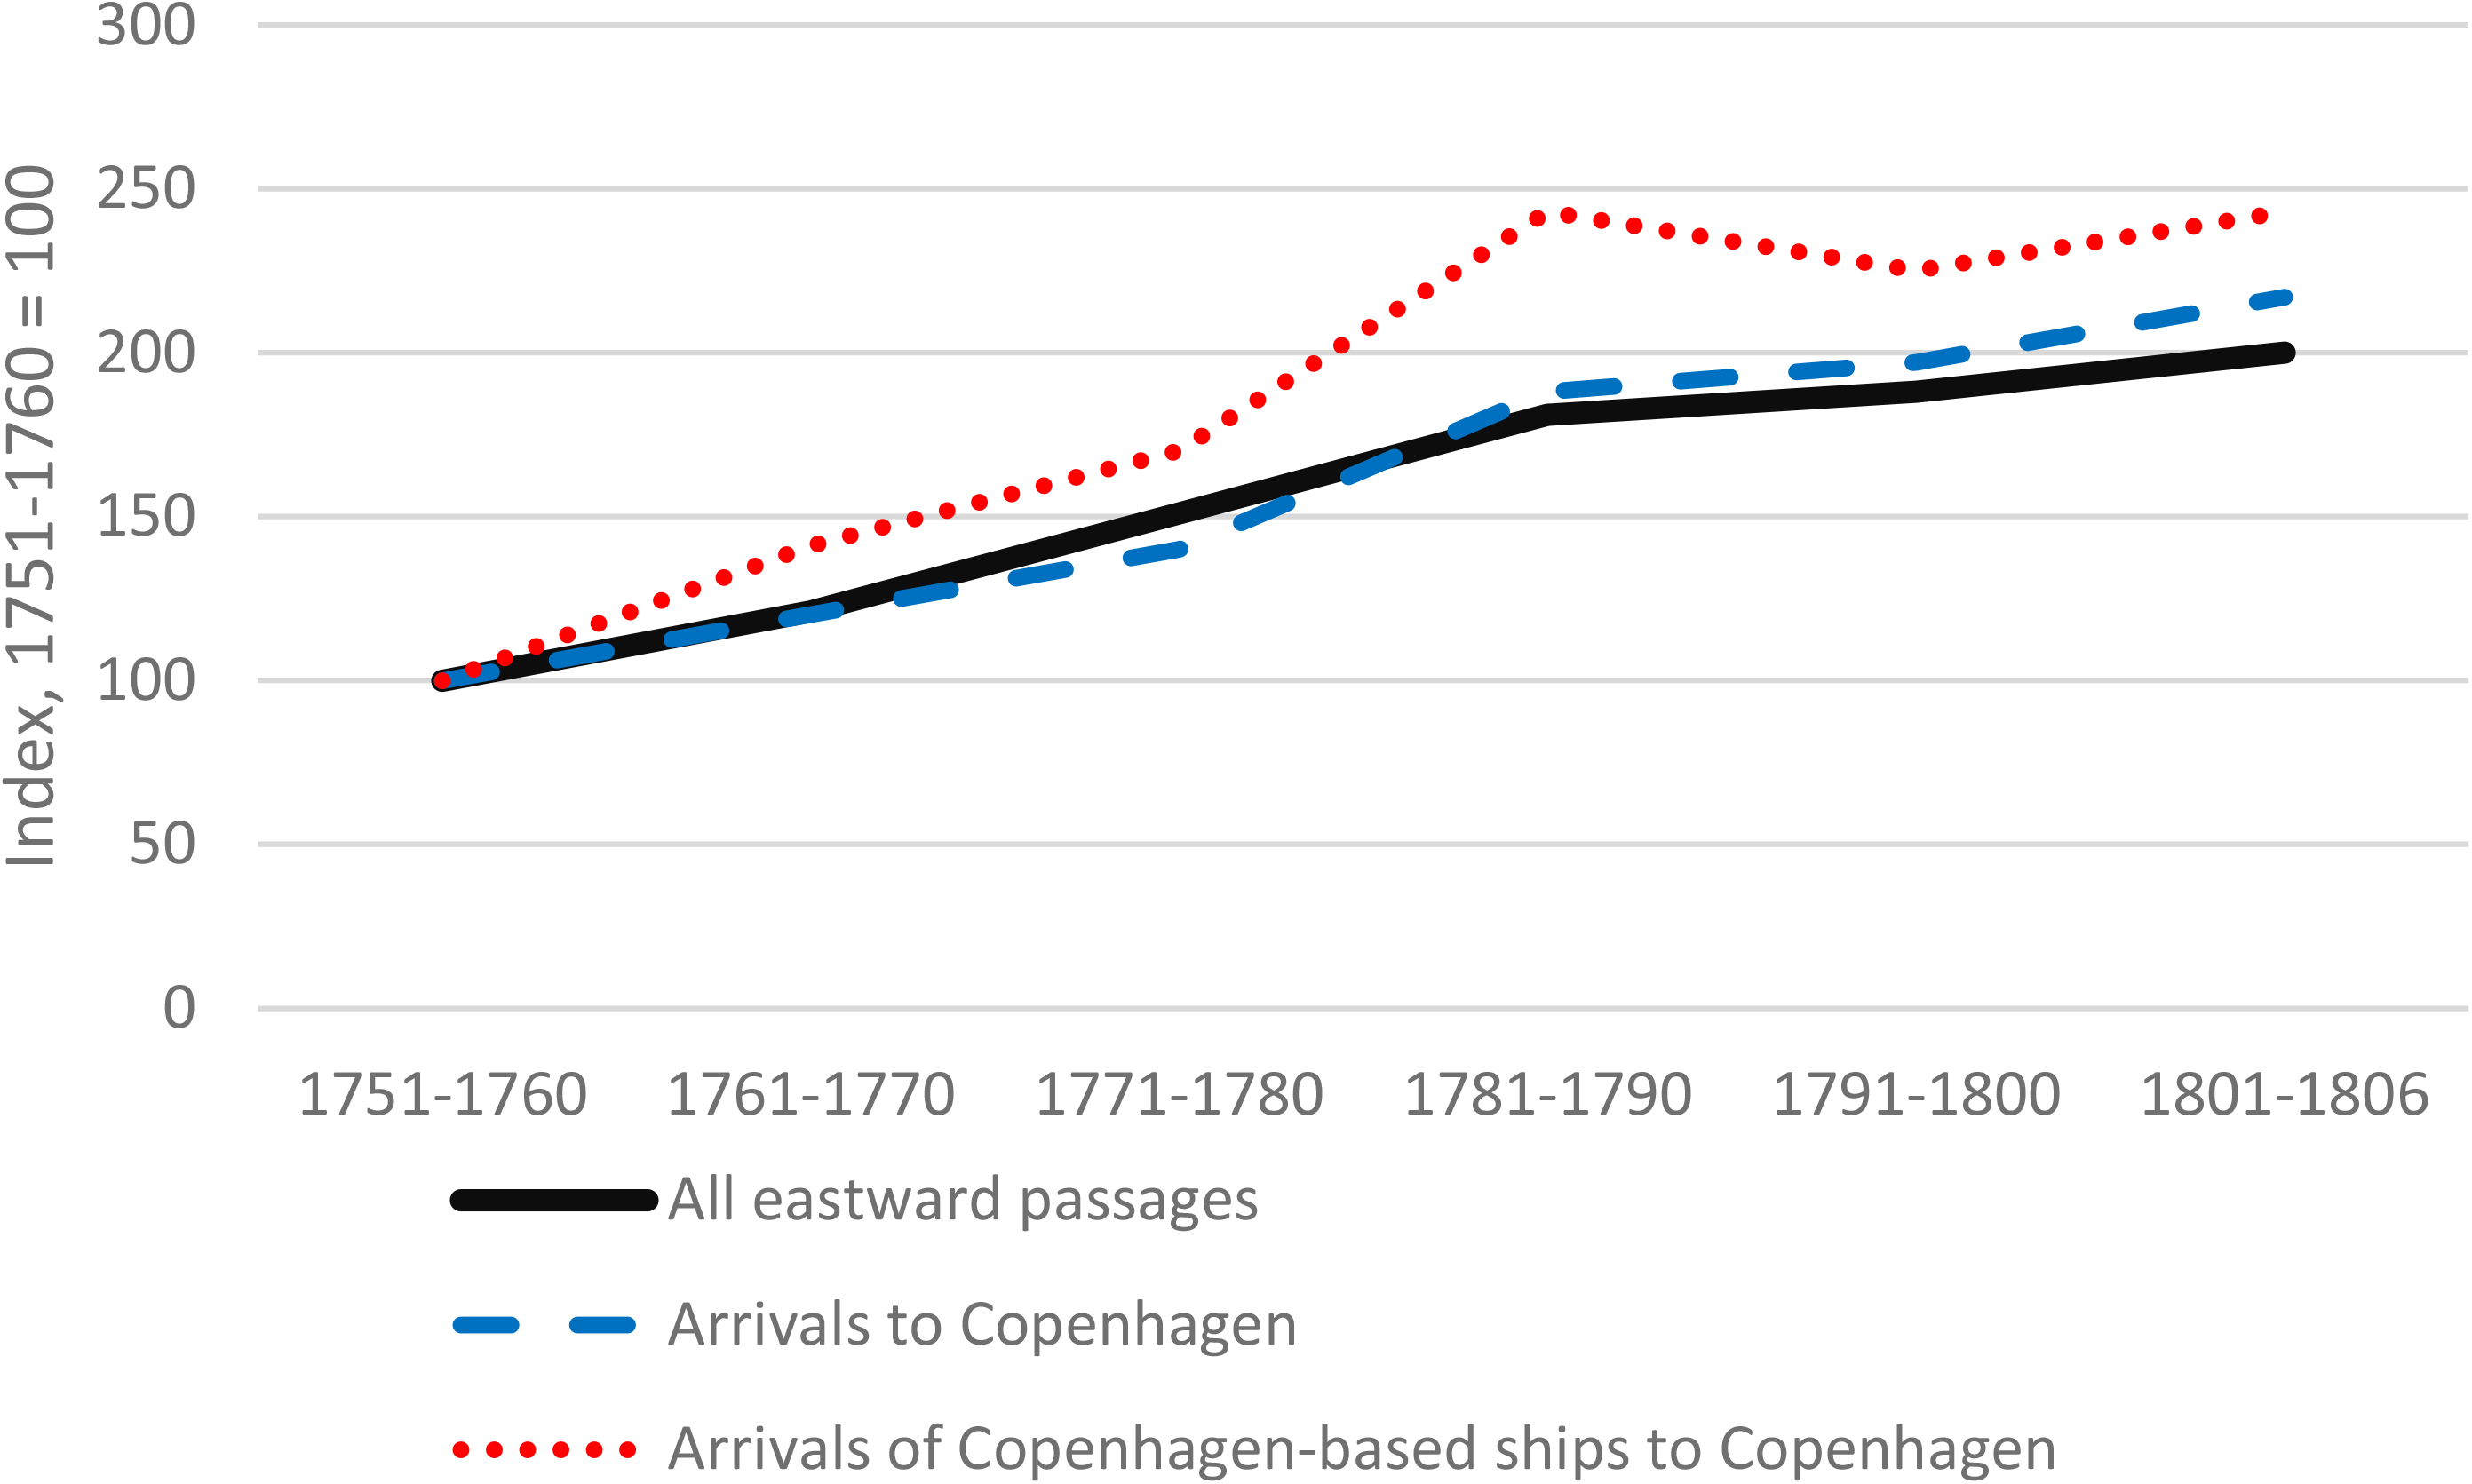
All arrivals in Elsinore and Copenhagen from the west, 1751–1806.
In certain respects, Copenhagen differed greatly from the large eastern Baltic ports. First, the latter had only a small number of their own ships. Accordingly, most of the ships visiting them were foreign – in particular, British and Dutch – and a large proportion of the departing cargo also went beyond the Sound. In this respect, St. Petersburg was number one, with only a quarter or fifth of its departures to Baltic ports. In Riga, the corresponding ratio was somewhat greater – typically 30–40 per cent – while in Danzig (at least before 1772), the Baltic proportion amounted to over 40 per cent. For Copenhagen, the Baltic, as seen above, clearly mattered less than western trades, and even British and Dutch shipping represented only 20−25 per cent of arrivals and smaller fractions of departures. 108 Thus, it may be claimed that Copenhagen's role in the big commodity flows westward through the Sound remained fairly modest. On the other hand, contrasting the slow relative decline of intra-monarchy shipping, the number of foreign arrivals at the port grew fivefold across five decades. 109 This fact can be taken as proof that Copenhagen's integration with international shipping had clearly increased. In this process, the real ‘engines of growth’ were such trades (Sector B) that represented at least an embryo of competitive freight markets.
Footnotes
Funding
The author received no financial support for the research, authorship and/or publication of this article.