
Abstract
Werner Scheltjens has estimated the commodity flows through the Sound by converting the original measures of the Sound Toll records into metric tons. The note discusses the merits and problems of this approach. It points out that weight units are not the best parameters from the viewpoint of shipping since the weight of the goods is poorly related to the actual requirement of shipping space.
Werner Scheltjens’ recent book, North Eurasian Trade in World History, 1660−1860, is an ambitious exercise in ‘Braudelian’ macro history. Moreover, it presents the first ever attempt to estimate the overall material bulk of the commodities that passed through the Danish Sound before the abolishment of the Sound Toll in 1857. As this will hopefully catalyse more research in this subject area, it is of particular merit that the author has made his data and workings (the Tetradas data files) available for other scholars. 1
Scheltjens believes that the commodities paying the Sound Toll were recorded according to the measuring systems of the respective ports of loading – that is, they were not converted into Danish weights and measures. Thus, in order to be able to accumulate all the commodities into a metric-sum total, he collected the perplexing variety of premodern weights and measures found in all the ports from which Elsinore received duty-paying cargo and converted them into a single modern denomination: the metric ton. He found the necessary conversion factors in a French-language handbook of old and new weights and measures, published in 1840. 2
According to Scheltjens, the principle of accepting local weights and measures of loading was confirmed in the Dutch–Danish Treaty of Kristianopel (13 August 1645) and subsequently in the Treaty of Copenhagen (15 June 1701).
3
However, the treaty of 1645 (which was written in Latin) did not deal with weights and measures at all; it only exempted Dutch ships from the examination of their cargo, allowing them instead to present a relevant bill of lading from the port of departure. It was only in the Dutch–Danish Treaty of Copenhagen where it was stated that the lasts, measurements and weights of the commodities for which [the toll] must be paid by the last, measurement or weight shall be considered [geconsidereert] and accepted [genomen] in the same way as they have been counted [gereckent] at the place where they had been loaded.
4
As can be seen from the above quote, the regulation on weights and measures was written in somewhat general terms and did not require the strict systematic application of the standards of the ports of loading. Moreover, this Dutch–Danish agreement did not concern other nations as a matter of course. Still, it seems to have affected the toll procedure to some degree. In the 1970s, the Danish project to computerize the Sound Toll records between 1784 and 1795 (which became the prototype of Sound Toll Registers Online) mapped out all the weights and measures found in the relevant Sound Toll books and also converted them into modern metric units. In a publication summarizing the project, Hans Chr. Johansen’s lists 74 different eighteenth-century weights and measures, often with commodity-specific variations. 6 This list also contains some information on how different weights and measures were applied at Elsinore. Perhaps the most interesting feature is that, as far as grain cargo was concerned, the standard was the Dutch rye last of about 2,900 litres. As cereals from some Baltic ports had been measured in local lasts, they were normally converted into Dutch lasts in the Sound; sometimes, however, the local lasts were recorded in the books but then ‘a different toll rate was used’. 7 Overall, Johansen's list gives the impression that conversion to Danish (and Dutch) units was the normal procedure but foreign, unconverted units could also be recorded in the Sound Toll registers. Doing so was particularly normal for measures with no Danish counterpart (such as the British coal measures of chaldron and keel).
The evidence presented by Johansen leads to an inevitable conclusion: the Sound Toll registers contain data converted into Danish weights and measures as well as unconverted ‘raw’ data representing the scales of several other ports. Johansen identified the two types of data by a tedious method – comparing the recorded volumes of commodities with their respective toll rates. Unfortunately, he does not present any estimations of their relative proportions; the reader, however, gets the impression that the ‘Danish mode’ was the more common. Repeating Johansen's comparisons across the entire Sound database seems, regrettably, not to be a realistic option: it would require too much labour and computer time. Thus, converting the weights and measures into metric units according to the Danish standards seems as good as, or probably even better than, other alternatives.
Yet it must be admitted that Scheltjens’ Tetradas project has served as a valuable wake-up call in pointing out an issue that has not been problematized before. Even if this metrological problem seems extremely difficult to solve, it is certainly worth discussing how significant the differences are between local weights and measures, and how substantial variations may occur in the overall estimations. Basically, the principal metrological systems were fairly similar across the Baltic world and western Europe, and it is therefore relatively easy to survey the local variations using just a few examples. In Table 1, this has been done by selecting two common units of weight and volume – the pound (approximately 450 grammes) and the anchor (approximately 36 litres), which both formed the basis for escalating series of units. 8 It can be seen that while the overall variations were wide (the pound being 16 per cent and the anchor 14 per cent of the average), the standard deviations were much lower (5.5% and 4.3%, respectively). It should also be mentioned that Copenhagen (as well as Elsinore) was close to the top on both scales (six per cent above the average for the pound and three per cent for the anchor). This would suggest that, for example, 100 ship-pounds of hemp or 100 fads of wine would have rated slightly higher in the scales of many other Baltic ports.
Variations of basic weights and volumes in a number of Baltic and North Sea ports in the early nineteenth century.
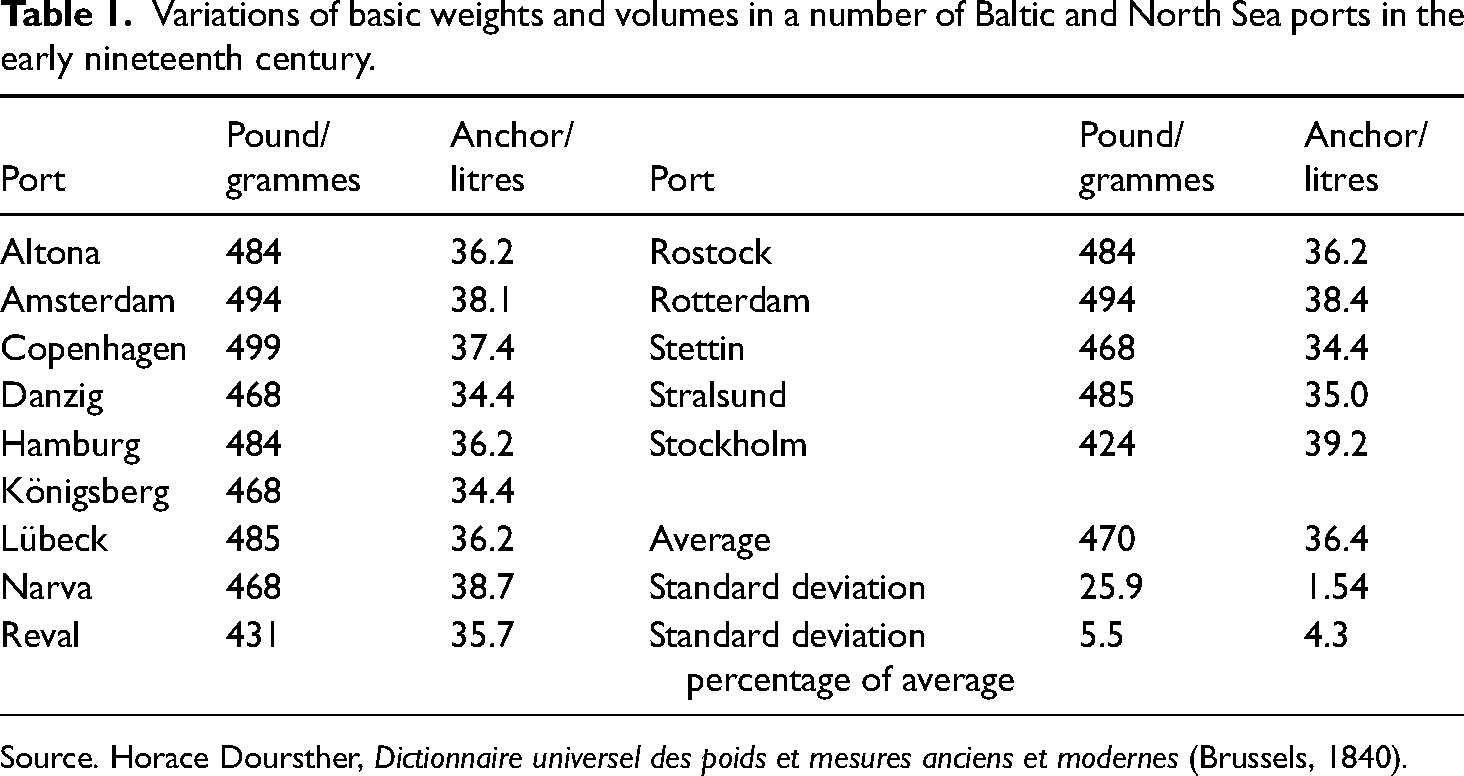
Source. Horace Doursther, Dictionnaire universel des poids et mesures anciens et modernes (Brussels, 1840).
To put things into perspective, it must be noted that, in addition to measurement issues, there were other sources of error in the Sound Toll registers. As domestic (Danish and Norwegian) vessels did not pay tolls for domestic goods, even their long-trade cargoes (or parts thereof) were not accounted for. The same goes for Swedish ships, which were exempt from the regular dues until 1720. Moreover, many cargo records are missing information on weights or volumes (for example, only stating ‘some cargo’, ‘provisions and cargo’ or the value of the goods). From Scheltjens’ long list of commodities and consignments passing through the Sound, it seems that different ‘unknowns’ amount to no less than around 30 per cent of the cases. 9 However, most of them involve small Danish or Norwegian coastal vessels, which represent a very small share of the total traffic through the Sound. 10
Excluding the ‘unknowns’, almost two-thirds of the individual commodity records seem to contain precise information on weights or volumes, whether in accordance with Danish or other standards. Another 15–20 per cent only indicate the number of items (pieces or dozens). 11 While such measures are not affected by local variations, they can be converted into realistic weights only provided that the relevant materials and sizes are known. In this respect, the Tetradas conversions include certain weaknesses and could be substantially improved by considering two recent research studies (those of Nathan Callagher and Lauri Karvonen). 12
The long-term picture presented by Scheltjens in the first chapter of North Eurasian Trade in World History (for which the precise numbers can be found in the Tetradas total-turnover file) will certainly be tested by future research in due course. My impression is that, in spite of certain problems with the original data and measurement standards, at least the broad outlines of this picture rest on reasonably firm foundations. Although it is pioneering work, it does have a kind of predecessor: the Danish Sound Toll 1784–1795 project presented the annual total statistics of 12 export and 3 import commodities; the volumes, however, were not converted into metric tons. This project's most interesting offering was a closer look at the year 1787, for which the total westbound tonnage as well as the volumes of several important export commodities were estimated. 13
These estimations contrast interestingly with Scheltjens’ data for the same year. While, according to Johansen, almost 850,000 tons of shipping sailed (mainly fully loaded) westward through the Sound, 14 only about 570,000 metric tons of goods were estimated to have been exported in the same direction. 15 At first glance, such a significant difference might be thought to suggest a large error in one of the estimations – or both. Fortunately, however, this is not the case: the two numbers deal with different things. Scheltjens’ estimation records the overall weight of goods while Johansen evaluates the total cargo space these goods required aboard ships. The demand for cargo space did not depend primarily on the weight but more often on the volume of the goods to be carried. Of course, a ship could not be loaded with so much weight that its seaworthiness suffered; however, in reality, most cargo consisted of relatively light goods, which filled all the cargo space long before the ship was sinking too low in the water. In the eighteenth century, typical sailing vessels had between four and five cubic metres of hold for each last (Danish or Swedish), 16 which means that, optimally loaded with all cargo space full and the ship ‘down to the marks’, 17 the average specific gravity of the cargo was around 0.6 (or it required 1.7 cubic meters per ton). Such a ratio is still fairly typical today, as the figures in Table 2 show.
Examples of nineteenth–twentieth-century stowage factors (cubic metres per cargo ton).
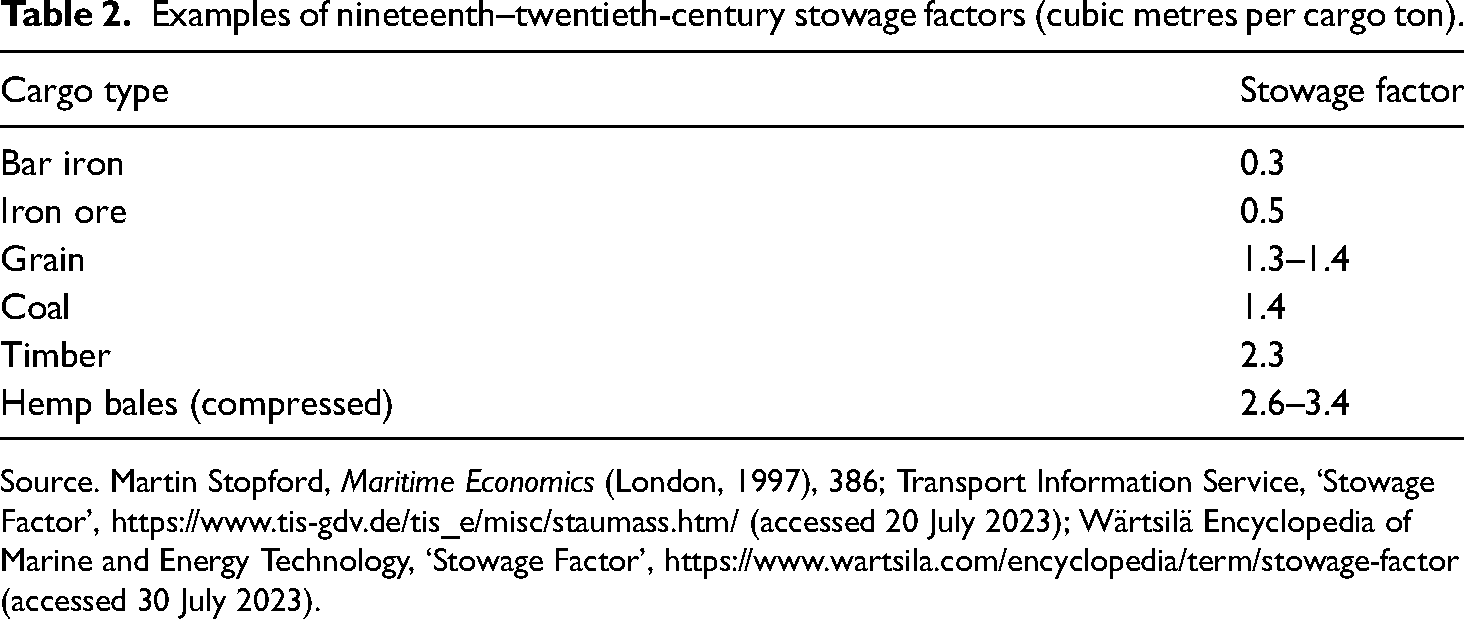
Source. Martin Stopford, Maritime Economics (London, 1997), 386; Transport Information Service, ‘Stowage Factor’, https://www.tis-gdv.de/tis_e/misc/staumass.htm/ (accessed 20 July 2023); Wärtsilä Encyclopedia of Marine and Energy Technology, ‘Stowage Factor’, https://www.wartsila.com/encyclopedia/term/stowage-factor (accessed 30 July 2023).
That heavy weights were not the main challenge to maritime transport can be seen clearly if we compare Johansen's estimations of commodity-specific shipping volumes and the corresponding accumulated weights in the Tetradas files for 1787. As Table 3 shows, light commodities regularly accounted for higher amounts of shipping space than their Tetradas weights would predict, while the case of heavy goods was the reverse. Of course, we have to understand that Johansen's estimations cannot be taken as precise transport statistics. However, they are enough to demonstrate how distorted a picture would be gained from weight data alone. While Tetradas suggests that balks and iron topped the list of commodities with about 11 per cent each, Johansen's estimations rate balks undisputedly as number one, with a share of 35 per cent, 18 and discount iron, with a mere 4 per cent. For the most important import commodity – salt – the metric tons indicate a share of 19 per cent, while Johansen's figures rate it just below 10 per cent.
Estimations of volumes and weights of major commodities, 1787.
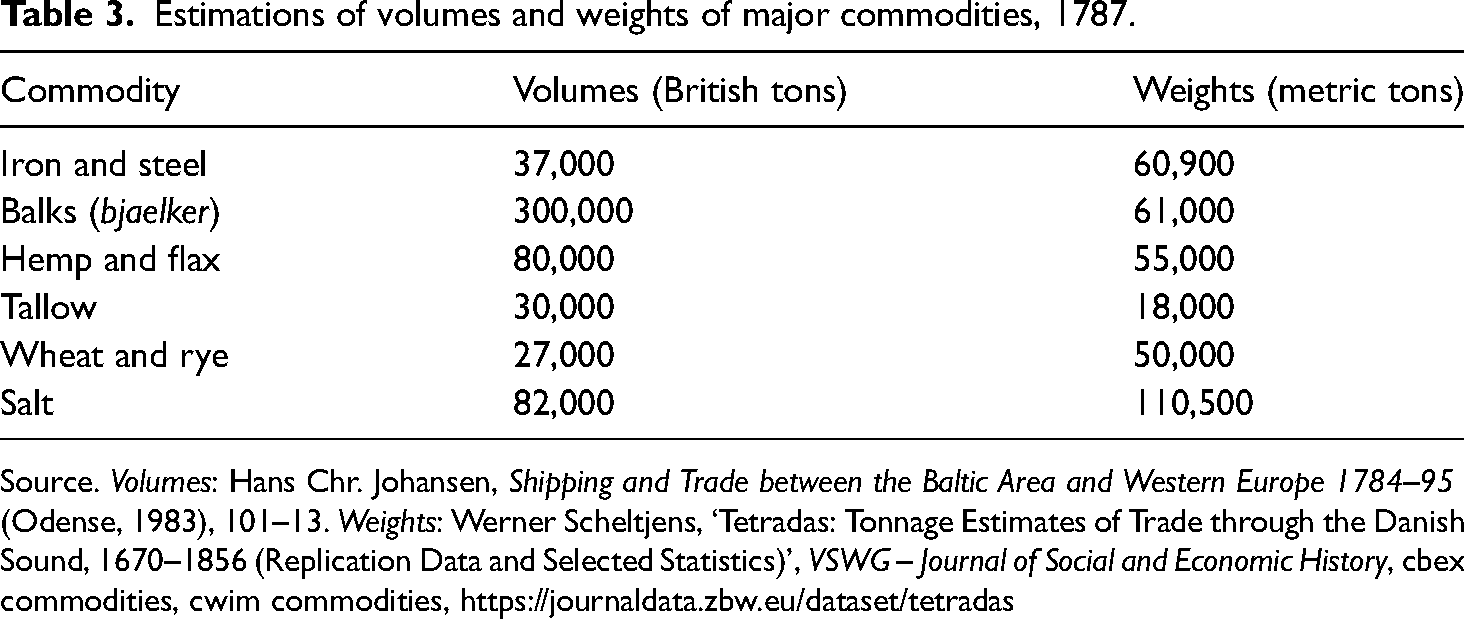
Source. Volumes: Hans Chr. Johansen, Shipping and Trade between the Baltic Area and Western Europe 1784–95 (Odense, 1983), 101–13. Weights: Werner Scheltjens, ‘Tetradas: Tonnage Estimates of Trade through the Danish Sound, 1670–1856 (Replication Data and Selected Statistics)’, VSWG – Journal of Social and Economic History, cbex commodities, cwim commodities, https://journaldata.zbw.eu/dataset/tetradas
It may, of course, be said that the data in Table 3 presents a comparison of two ‘relative truths’ based on two different methods of assessment. However, in another context, when comparing the shares of different national tonnages passing through the Sound, weight data (metric tons) cannot be maintained as a realistic yardstick. This leaves us with only one real parameter: the numbers of ships and their tonnages.
Table 4 compares Johansen’s tonnage estimations 19 with the Tetradas figures for 1787. Unfortunately, the comparison is marred by the fact that Johansen did not estimate eastward passages at all, while Tetradas presents flag-specific data only for the total turnover (of which eastward cargo only represented a third). In any case, a number of interesting peculiarities can be found. It can be seen that for both Great Britain and the Dutch Republic, Johansen's estimations of westbound cargo exceed the Tetradas west and east figures; only in the case of Sweden do the latter exceed the former – and by an impressive margin. This can only be explained by the fact that Sweden was, along with Russia, the largest Baltic exporter of iron. Accordingly, the high specific weight of this commodity inflated its share of sea transport – it was, in fact, higher than that of the Dutch Republic, which was not an important carrier of Baltic iron.
Estimations of transport volumes by major shipping nations transiting the Sound, 1787.
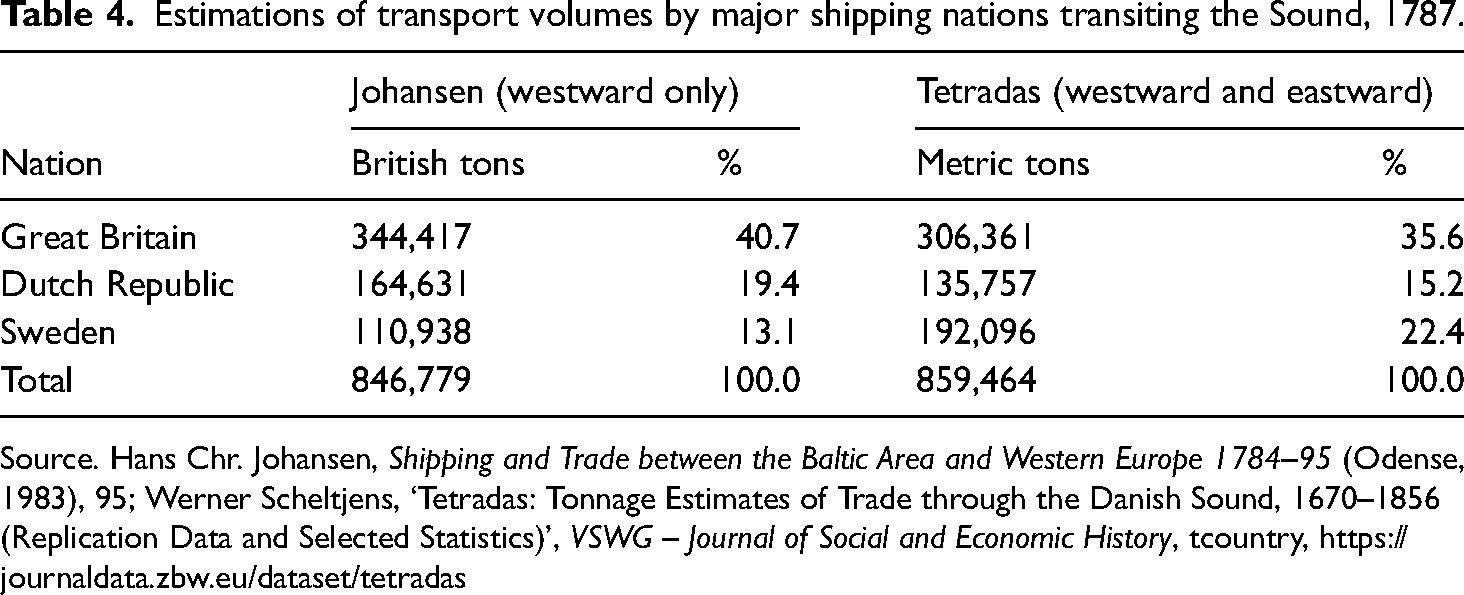
Source. Hans Chr. Johansen, Shipping and Trade between the Baltic Area and Western Europe 1784–95 (Odense, 1983), 95; Werner Scheltjens, ‘Tetradas: Tonnage Estimates of Trade through the Danish Sound, 1670–1856 (Replication Data and Selected Statistics)’, VSWG – Journal of Social and Economic History, tcountry, https://journaldata.zbw.eu/dataset/tetradas
Summing up, it seems clear that weights were not the most important parameter in maritime transport – quite the contrary. They were literally dead weights and do not really tell us how the commodities flowed through the Danish Sound on board the actual ships. However, in moderation, it may be admitted that weight was a more important factor in stevedoring, as well as overland and canal transport. In both of the latter cases, horses were normally the motive power, which set definite limits (lower on roads than canals) on the respective haulages. On the other hand, light goods could be stacked fairly high on both wagons and canal barges, thus improving their stowage factors. On ships crossing open seas, this was not possible: the freight had to be protected from the elements and only very moderate amounts – mainly masts and other heavy timber – could be carried on deck without impairing a ship’s stability and sail handling. 20
In spite of the obvious limitations, the weight data of the different commodities is invaluable. It constitutes the first step towards a better understanding of these commodity flows. The next obvious step (in addition to continuing to improve the weight data) would be to collect representative samples of stowage factors 21 and, by applying them to the weight data, produce new transport data in terms of the tonnage, or space on board, that different westward and eastward cargoes required. Such a second step would bind the weight data directly to shipping and to the actual commodity flows.
Footnotes
Declaration of conflicting interests
The author declared no potential conflicts of interest with respect to the research, authorship and/or publication of this article.
Funding
The author received no financial support for the research, authorship and/or publication of this article.
Notes
Author biography
Yrjö Kaukiainen is an emeritus professor of European History (previously of Economic history) at the University of Helsinki and a former president of the International Maritime Economic History Association. His research has focused, in particular, on the history of shipping in the eighteenth, nineteenth and twentieth centuries, as well as the history of information transmission in the nineteenth century.