
Abstract
Since the late sixteenth century, parallel with the growth of West-European ocean shipping, seaborne connections between the North and Baltic seas increased constantly. The rising maritime powers, the Dutch Republic and Great Britain, carried to the Baltic colonial and manufacturing produce in exchange for grain and raw materials, thus connecting the area with their oceanic trades. These commodity flows are amply illuminated by the Sound Toll records. In contrast, evidence of intra-Baltic shipping is fragmentary and imperfect, with many gaps. Such an imbalance of sources implies a drawback: we do not know how dominant the West-European connections actually were in Baltic shipping. Fortunately, there are a few primary records that shed light on intra-Baltic shipping, notably the ship-lists of the port of Cronstadt published by the Russian and German-language journal Sankt Peterburgskije Vedomosti/St. Petersburgische Zeitung from 1744. The port of Cronstadt is particularly interesting as it constitutes the extreme eastern terminus of sea routes from the wider world. No comprehensive data from these ship-lists have hitherto been published. Utilising them, this article analyses the main trends in the development of St. Petersburg's shipping connections within the Baltic Sea as well as with the regions beyond the Danish Sound.
Keywords
I
Since the late sixteenth century, parallel with the growth of West European ocean shipping, seaborne connections between the North and Baltic seas increased markedly. Accordingly, the ‘North European Mediterranean’ was connected to ocean shipping networks. The rising maritime powers, the Dutch Republic and, subsequently, Britain, were the key players in this process: in the best part of the seventeenth century, and until the 1790s, they accounted for over a half of all shipping passing through the Danish Sound. 1
It is obvious that the role of intra-Baltic seaways diminished in importance compared with the heydays of the Hanseatic League. However, the extent of this contraction is difficult to fathom. While the Sound Toll Registers make it possible to sketch a reliable overview of seaborne connections between the Baltic world and Western Europe, they do not reveal what happened within the Baltic. In the early eighteenth century, there was certainly a lot of shipping that never passed the Sound; indeed, at least in Sweden, only the biggest seaports were allowed to send their ships to the North Sea and beyond, while others had to be content with Baltic or domestic trades. Unfortunately, the extent of such shorter trades is difficult to estimate, at least as far as the early modern period is concerned. Not only would this entail collecting data for many seaports in various countries – instead of relying on a single central resource like the Sound Toll Registers – but the task is rendered more difficult by sources that, if not totally missing, are often fragmentary, imperfect and infested with wide gaps. Thus, it is no wonder that only a limited number of historical studies on Baltic shipping in the seventeenth and eighteenth centuries can be found. Such rare examples are Elisabeth Harder-Gerstorff's studies of Lübeck's Russian trade, as well as the works of V.V. Doroshenko and Maria Bogucka on the seventeenth-century trade and shipping of Riga and Danzig, respectively. 2
In the eighteenth century, St. Petersburg (or rather its outport Kronstadt) stands out as one of the most interesting Baltic seaports. Not only was it the eastern ‘bitter end’ of Baltic shipping, but also the prime gateway to a huge hinterland. As an outlet of Russian raw materials it may be perceived as the heir to old Novgorod, but now it was also a rapidly growing capital with a significant upper- and middle-class population; consequently, it was a major consumption centre where demand for western and colonial products and luxuries was strong. Fortunately, it generated a reasonable volume of source material, which makes it a rewarding subject for research.
It is unclear whether the eighteenth-century archives of Kronstadt customs have been preserved. However, different extracts of customs data can be found in printed sources. Chronologically, the most extensive are the series of ship-lists published in the St. Petersburg newspapers, the Russian-language Sankt Peterburgskije Vedomosti and the German-language St. Petersburgische Zeitung. 3 The earliest – at least in the Zeitung that I have used 4 – are from 1744 and the series continues until the end of 1786. There are a few periods with no published lists (the latter half of 1761 and the years 1762 and 1771 – which may reflect wartime censorship), while microfilms (and probably even the original volumes) are missing for the years 1753–1755, 1757–1760, 1778 and 1780–1782. Even in some other years, a few issues are missing and quite often the published lists contain sundry gaps. Such gaps are so numerous in 1763, 1764 and 1770 that the representativeness of remaining data becomes doubtful. Therefore, these years have been excluded from the statistics presented in this article.
The newspaper was published twice a week (Tuesdays and Fridays) and during the sailing season ship-lists were printed with varying frequencies, typically once a week. It is unclear how much data the paper received from the Kronstadt customs but, in any case, they only published rather brief summaries. Unfortunately, the editors’ selection of data to be published varied from time to time. The printed lists always stated the names of skippers (but not their nationality or domicile) and the ports of departure or destination. Precise dates of arrivals and departures were not always recorded; alternatively, ship movements were specified by wider timespans. Exactly as in Sound Toll accounts, no tonnages (or lastages) were recorded and, as only very brief information about the cargo carried (mit Ballast, Güthern, Stückgut, Wein etc.) is presented, no estimations are possible. Moreover, data on cargo only concerned ships entering the port, and even this information discontinued after 1756. Arriving and departing ships are both listed with separate running numbers, which is a very useful feature: a missing number reveals a ship being missed when printing the lists. Moreover, total numbers can be found (at the end of the sailing season) even when several individual entries are missing.
In addition to the Vedomosti/Zeitung ship-lists, there are statistical publications by three well-known eighteenth-century political arithmeticians, Anton Friedrich Büsching, Benedict Franz Hermann and Heinrich Friedrich von Storch. All three collected data on St. Petersburg shipping; Büsching for 1736–1764 (arrivals) and 1761–1763 (departures); Hermann for 1778–1787 (arrivals); and Storch, partly relying on the data collected by Büsching and Hermann, for 1703-1797 (arrivals). 5 While only presenting crude totals, they are useful in filling gaps in the Zeitung data as well as stretching it beyond 1786. They also contain data on other Russian ports and statistics on the foreign trade of St. Petersburg and the country as a whole.
II
The outlines of the data are summarized in Table 1 as four-, five- or three-year averages. A more detailed presentation of the total numbers of vessels arriving at, and departing, Kronstadt is provided in Figure 1, which also records ships at Elsinore (Helsingör) that came from Kronstadt/St. Petersburg, according to the Sound Toll Registers online (STRO). An alternative variable, the number of ships coming from Kronstadt according to the old Sound Toll tables (STab), 6 is included. As a few unexpected ‘bugs’ were encountered in the STRO (in 1769 and 1771, in particular, a number of westbound ships were recorded as eastbound 7 ), a check using older data, with a good reliability record, was deemed useful.
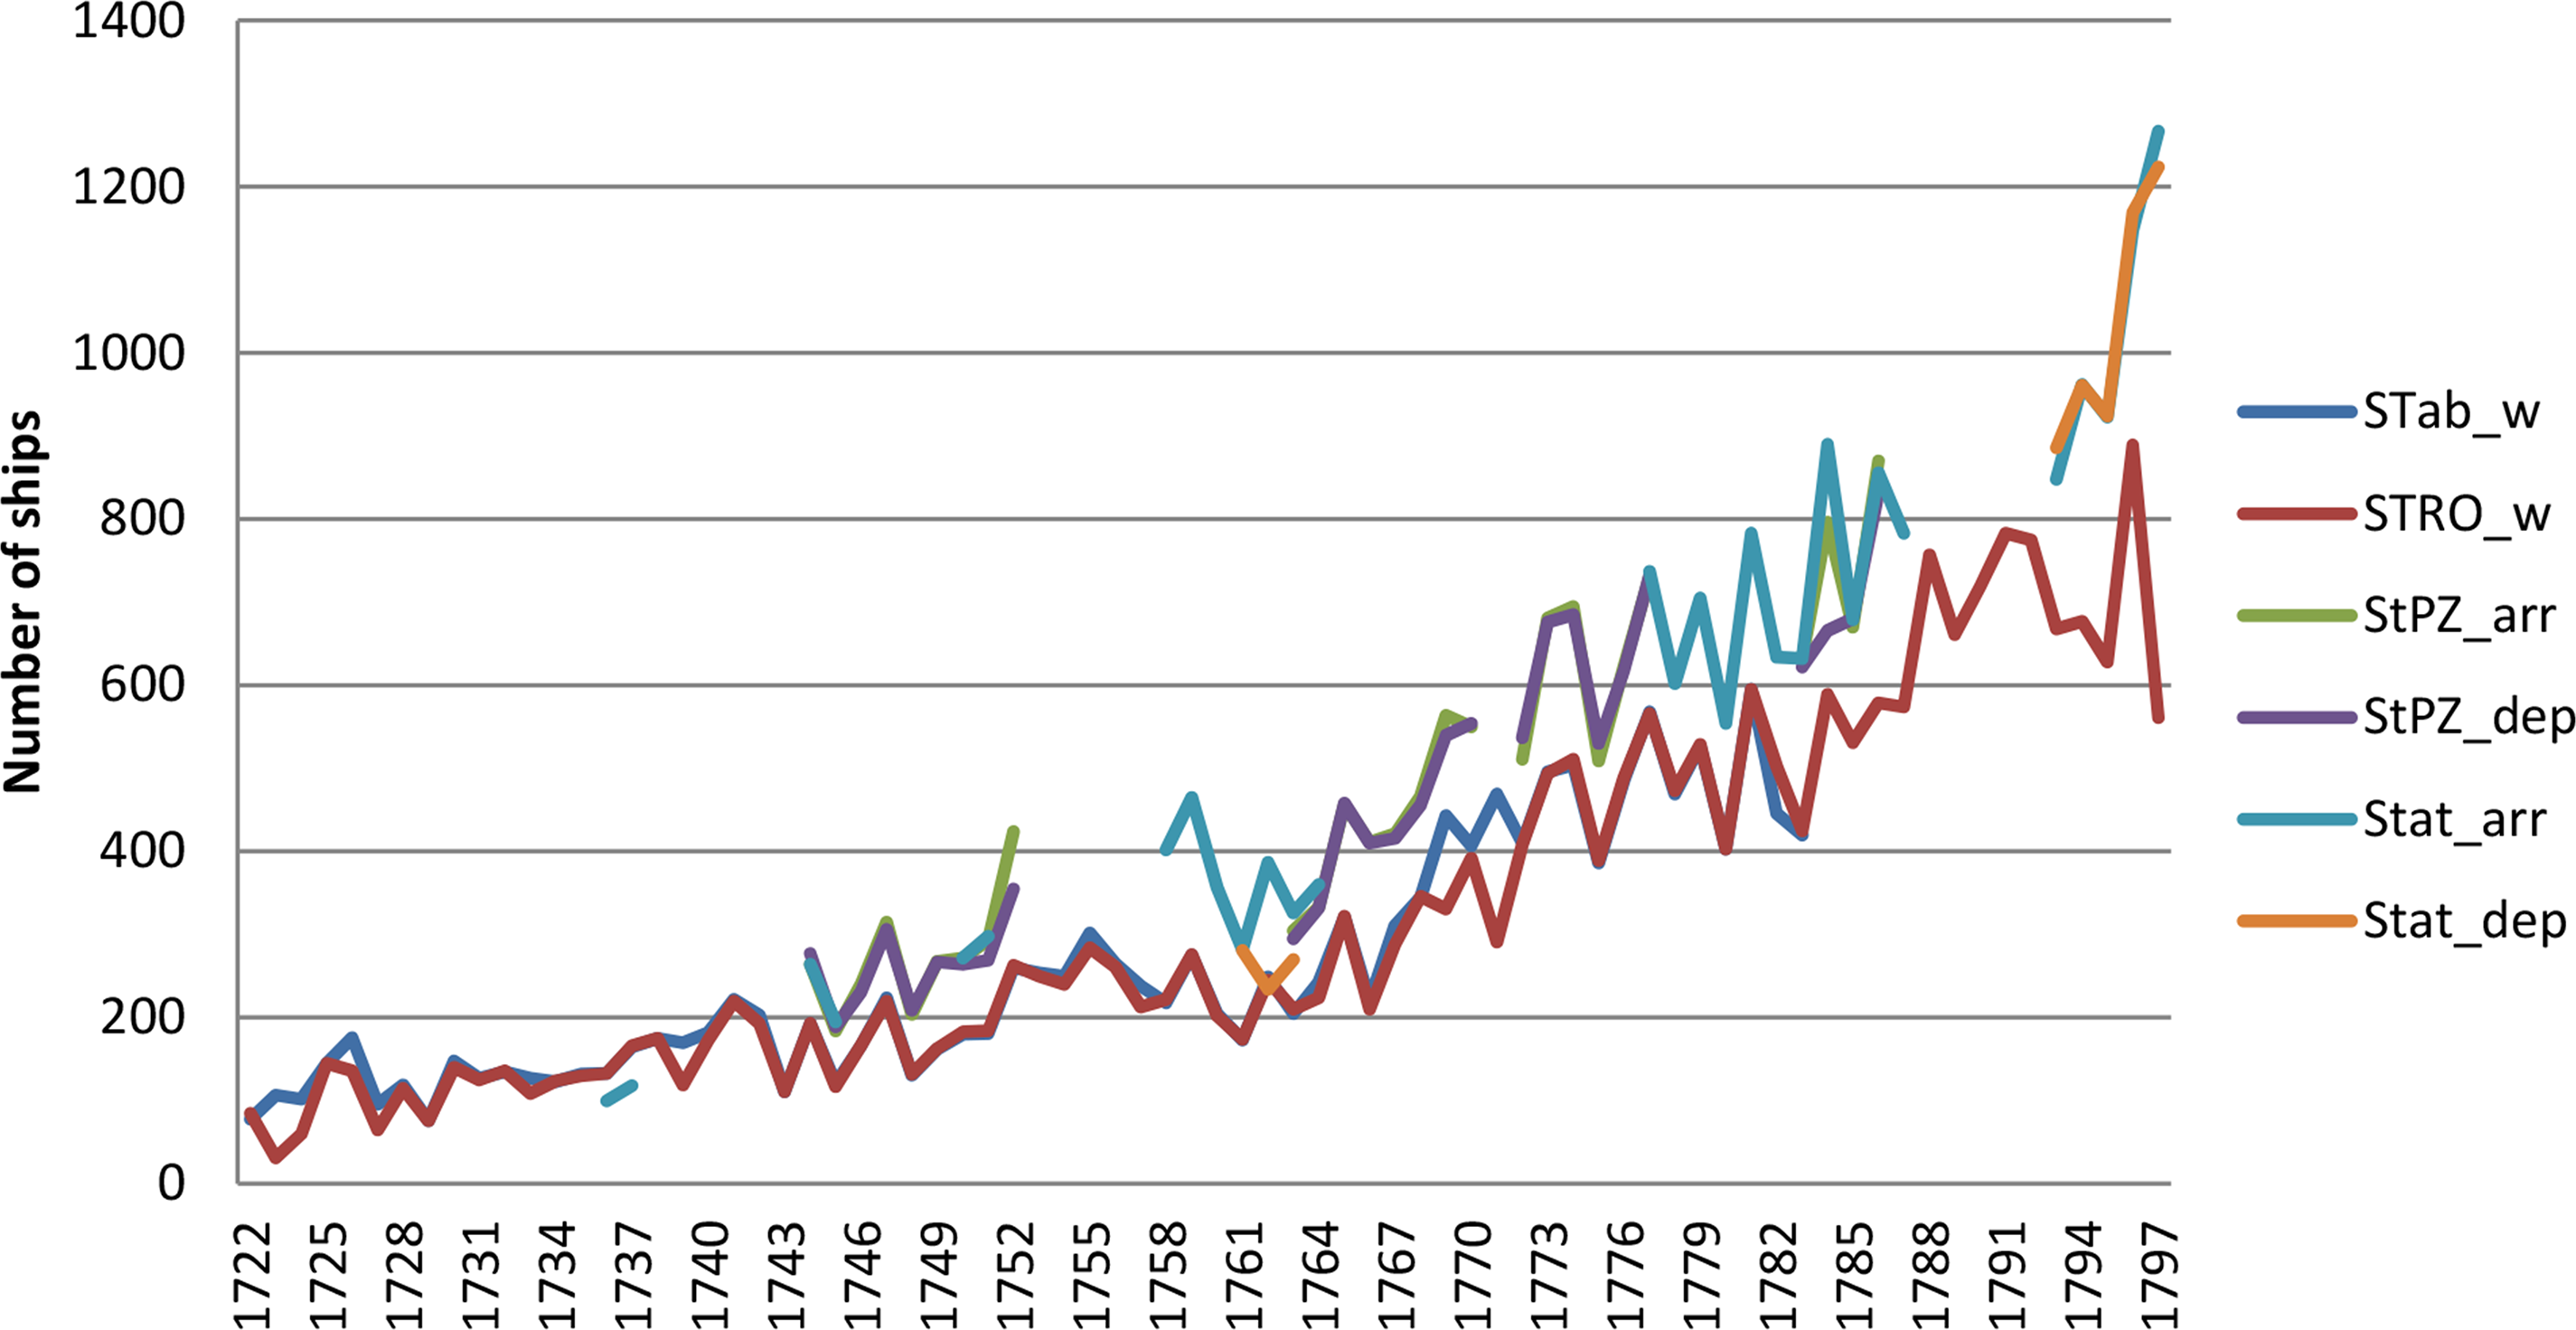
Shipping to and from St. Petersburg, 1722–1797. Source: Table 1. ‘Stat’ refers to the statistical publications by Büsching, Hermann and Storch (see footnote 5).
St. Petersburg shipping data in Sound Toll Registers and St. Petersburg Zeitung's ship-lists (Number of ships, four- or five-year averages, except 1756 and 1770).
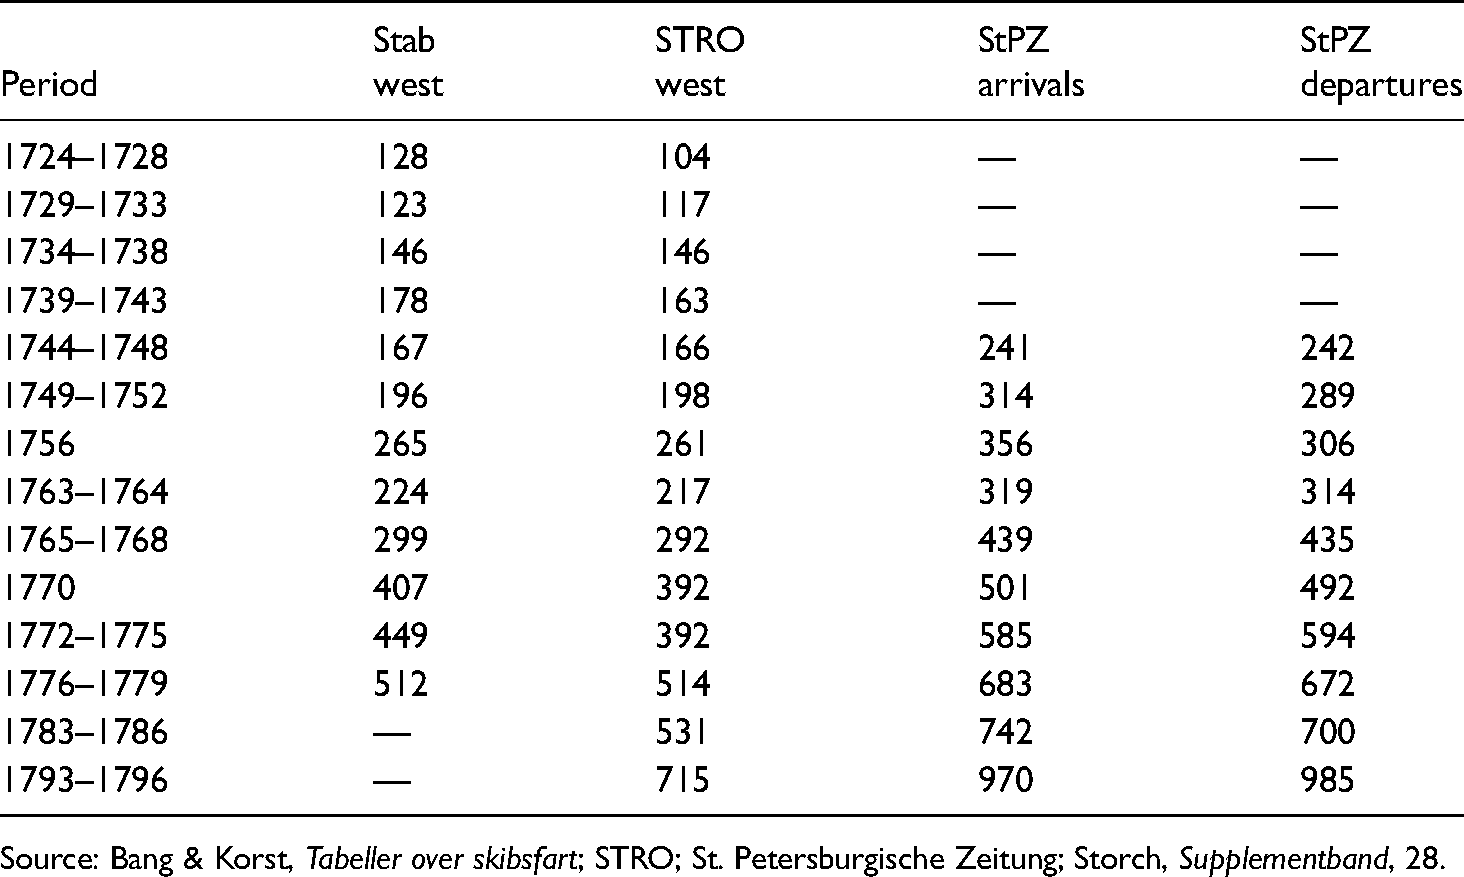
Source: Bang & Korst, Tabeller over skibsfart; STRO; St. Petersburgische Zeitung; Storch, Supplementband, 28.
For a total newcomer among seaports, 8 St. Petersburg attracted a fair amount of shipping during the reign of Peter I. After his death, it fared less well, in particular after the imperial court moved back to Moscow, and a resurgence only started when the court returned in the 1730s. These conclusions should, of course, be drawn with reservations since they can only be based on the Sound Toll records, but contemporary data on Lübeck's trade with St. Petersburg agree fairly well with them. 9 For the rest of the century, however, the development of the new port was a real success story: from the mid-1740s to the mid-1790s, the number of ships visiting Kronstadt increased four-fold, on average almost 3 per cent per year. In terms of shipping, it was soon the second Russian port after Riga, which it almost matched in the 1770s before becoming number one in the 1790s. However, as far as the overall value of imports and exports is concerned, it seems to have passed Riga before the 1750s. 10
On the other hand, as Figure 1 demonstrates, short-term fluctuations were quite strong, suggesting unstable or volatile development. This volatility may be connected with slow communications, which created oscillations of supply and prices similar to the so-called ‘pork cycles’. Climatic variations, such as the length of the winter, could also give rise to substantial fluctuations, with a late start to the sailing season tending to cut the number of voyages irrespective of business cycles. 11
The speed of growth also varied in longer cycles. Distinct recessions in traffic through the Sound (or at least some slowing down of the growth) can be seen in the 1740s and the late 1750s–early 1760s. Both seem to have been connected with warfare; that is, the War of the Austrian Succession (1740–1748) and the Seven Years War (1756–1763). On the other hand, these conflicts mainly harmed West European ship-owners while intra-Baltic traffic to St. Petersburg fared better, in particular during the years from 1758 to 1768. 12 The American Revolutionary War (1775–1783) and its ‘appendix’, the Anglo-Dutch naval conflict (1780–1784) also retarded the growth of West European shipping to St. Petersburg, but the Russo-Swedish war (1788–1790) only resulted in a moderate drop in 1789. 13 The latter, however, was a prelude to the unstable era of French Revolutionary and Napoleonic wars, with the outbreak of war in 1792 precipitating a deep dive in passages through the Sound. For the Baltic Word, a real turning point was the downfall of the Dutch Republic and the creation of the new Batavian Republic as a ‘client state’ of France in January 1795. In the wake of this transformation the Dutch merchant navy was wiped from the market: in 1795, only two ships passed the Sound under the Dutch flag, and none entered Kronstadt in 1796 and 1797. 14
III
As Table 1 and Figure 1 demonstrate, total numbers of arrivals and departures in Kronstadt always exceeded the corresponding figures at the Sound by a clear margin, thus indicating a substantial Baltic element in the shipping of the Russian capital. Through the Kronstadt ship-lists, the size of this Baltic component can be gauged for both arrivals and departures. Table 2 also estimates the number of departures to Baltic destinations in the mid-1790s, as this can computed from the Sound toll records by subtracting the St. Petersburg arrivals from the number of departures from Kronstadt (for arrivals this method cannot be used as the figures for departures to Kronstadt miss a number of ships). 15
Baltic arrivals and departures at Kronstadt.
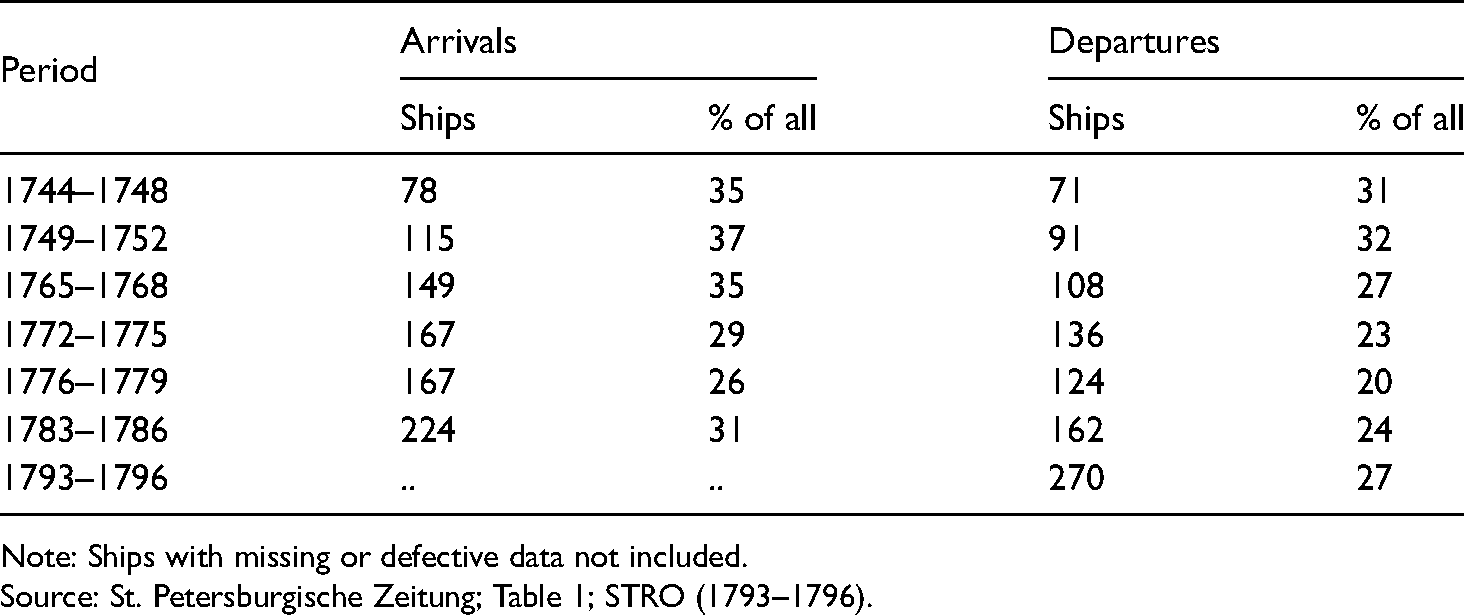
Note: Ships with missing or defective data not included.
Source: St. Petersburgische Zeitung; Table 1; STRO (1793–1796).
Table 2 demonstrates that Baltic arrivals. 16 always clearly exceeded respective departures. There is a simple explanation to this imbalance in that the ‘Baltic element’ consisted of two distinct spheres, the southern or German and Prussian seaports, and the northern or Swedish, Finnish and Baltic shores. The latter was more or less connected with the traffic from beyond the Sound, with numbers of non-Baltic vessels delivering cargoes to ports like Stockholm and Reval (Tallinn). Subsequently, many of them arrived at Kronstadt in ballast and loaded there a cargo for non-Baltic destinations. Accordingly, arrivals from this area exceeded corresponding departures by a hefty margin (typically 70–80 per cent) and, in spite of accounting far fewer ships than the German and Prussian coasts, this imbalance explains the excess of Baltic arrivals at Kronstadt. For German and Prussian ports, on the other hand, arrivals and departures were in a fairly good balance; in the 1740s, departures slightly exceeded arrivals, while from the 1760s onwards the contrary became the rule. 17
Both arrivals and departures, however, present a common trend: a systematic relative decline starting in the 1760s and reaching the low point in the latter half of the following decade, after which a distinct growth can be observed both in relative and, in particular, actual terms. The decline was obviously connected with the rapid growth of shipping from beyond the Sound, which also started in the 1760s. The new growth, again, can probably be connected with the decline of Dutch shipping to St. Petersburg, which opened more opportunities for Baltic, in particular German and Prussian, shipping.
IV
The overall figures for arrivals and departures at Kronstadt are by no means perfect indicators of actual shipping volumes. Not only have we no data of ship sizes but, for most of the period, we do not have information on their loaded condition. Yet, the Sound toll data tell us that there were great systematic differences in this respect. While practically all ships left Kronstadt fully loaded, a substantial proportion of them arrived in ballast, without having paid for a cargo to Russia. This was particularly typical of British ships, no less than 60–75 per cent of which arrived in ballast, and even among the Dutch the proportion amounted to some 30–45 per cent. 18 And, as these ships represented 70–80 per cent of all Kronstadt shipping, the same also applies to the overall figures of shipping passing the Sound. In principle, this imbalance reflects the differences between eastward and westward trades: the former often consisted of fairly valuable finished products and so-called colonial goods, which required less cargo space than Russian primary or semi-finished exports.
Sound Toll records present accurate data on arrivals in ballast. After Danish customs inspection such vessels were freed from the toll and were only charged a lighthouse fee of two rigsdalers. Even Kronstadt lists specified ballasted arrivals until the late 1750s, but not afterwards. Therefore, continuous and systematic data can only be found for ships that passed the Sound. However, even the data on ships destined to St. Petersburg in ballast must be corrected to include vessels that, at Helsingör, declared ‘Baltic’ as their destination, whereas they were actually bound for Kronstadt. Moreover (as mentioned before), a number of loaded ships, British in particular, first discharged a cargo in Baltic ports, such as Copenhagen, Reval (Tallinn) and Stockholm, and then sailed in ballast to Kronstadt. 19
According to Table 3, normally about 55–60 per cent of ships from Western Europe arrived in ballast. On the other hand, ballasted voyages were less common among arrivals from North German and Prussian ports. In the 1740s and 1750s, as long as relevant data were available, average ratios for the latter only amounted to 13 per cent. After that, there is nothing to suggest a drastic change. As already mentioned, entrances from German ports regularly matched the number of corresponding departures, which suggests that cargoes to St. Petersburg may have employed about as many ships as homeward cargoes. Thus, it seems that low ballast ratios were a more or less constant feature of these trades.
Arrivals to Kronstadt in ballast from beyond the Sound.
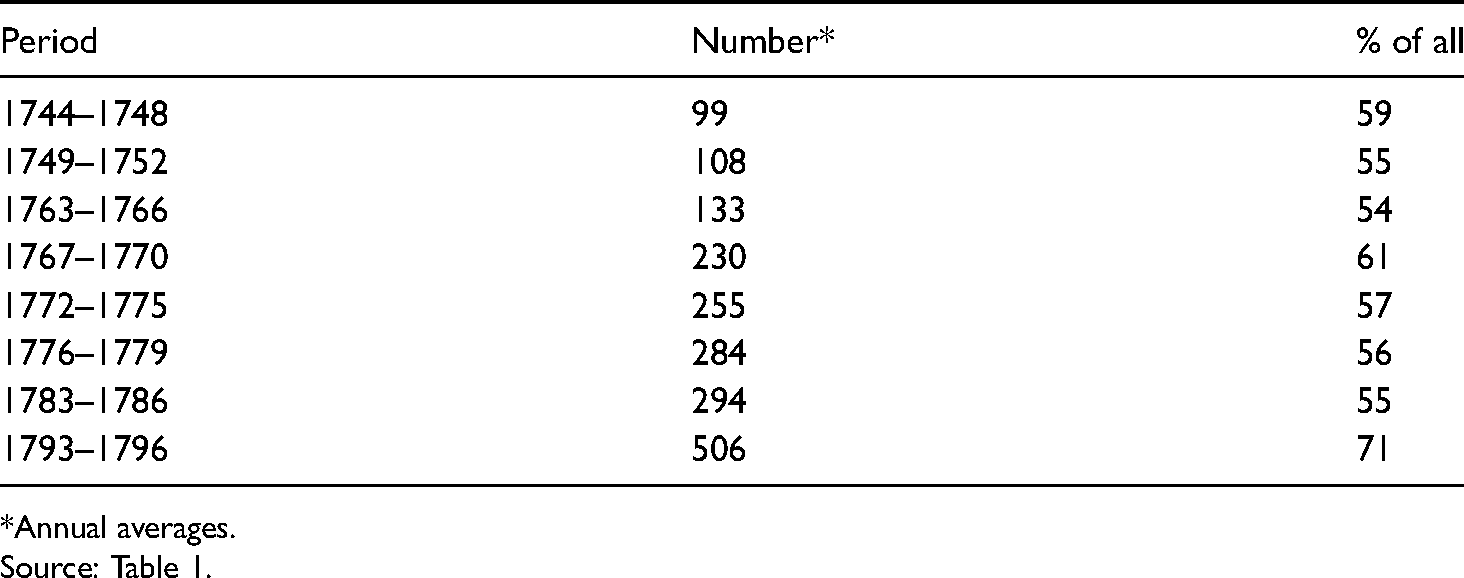
*Annual averages.
Source: Table 1.
For 1744–1752, fairly complete data relating to import cargoes can be compiled from the Kronstadt ship-lists. Accordingly, about 45 per cent of these cargoes came from the Baltic area, while almost 40 percent (38.6%) emanated from Prussian and North German ports. Cargoes from the latter even exceeded the number of those from the Dutch Republic and Britain, taken together (see Table 4). This is by no means surprising: the vast German hinterland was able to supply abundant export cargoes to the ports. This refers especially to Lübeck, which was connected by the Elbe (and the medieval Stecknitz canal) to the rich handicraft and manufacturing industries of Saxonia, as well as the Leipzig Fairs. A share of Hamburg's exports to the Baltic area was also diverted to Lübeck, thus avoiding the Sound toll. Lübeck even had good access to plentiful bulk-goods, such as Lüneburg rock salt. 20
Arrivals in Kronstadt, 1744–1796 (Annual averages: A = all arrivals, B = with cargo; estimates in brackets).
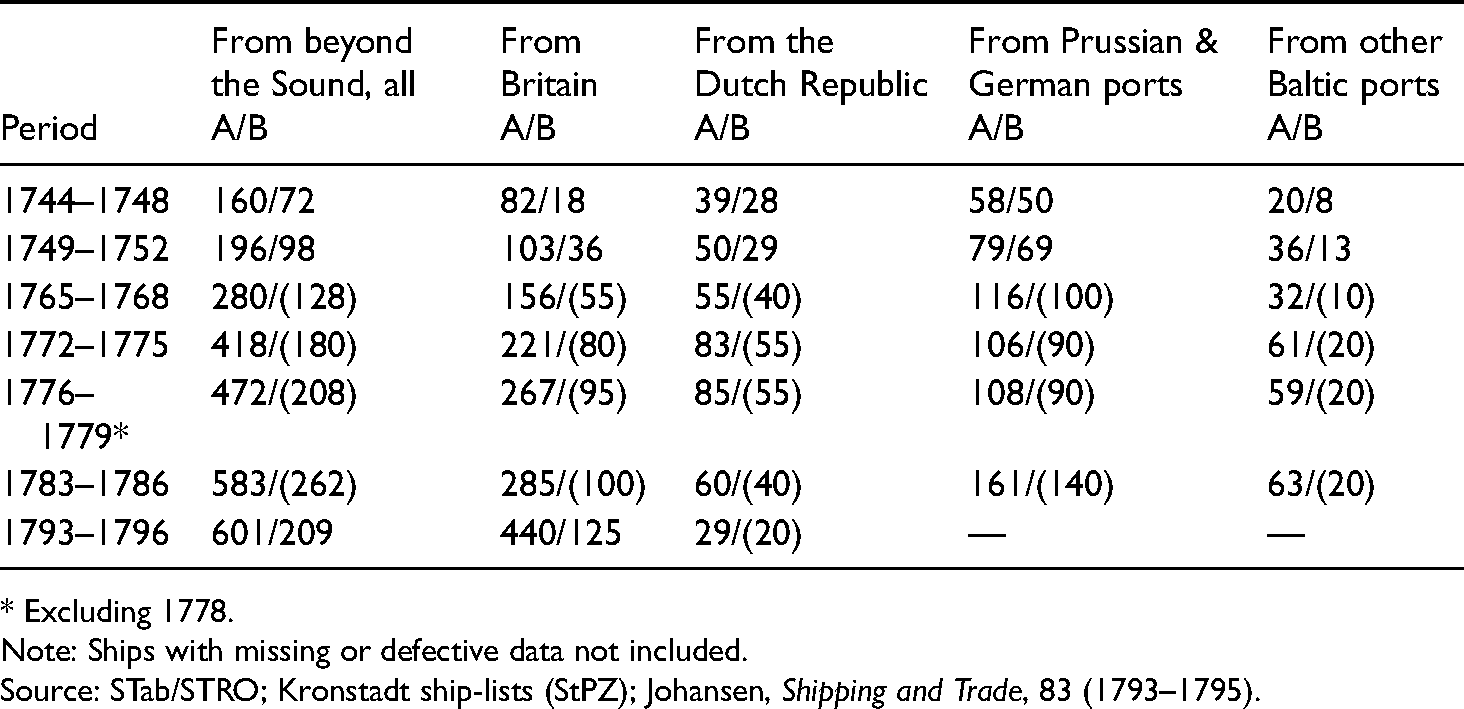
* Excluding 1778.
Note: Ships with missing or defective data not included.
Source: STab/STRO; Kronstadt ship-lists (StPZ); Johansen, Shipping and Trade, 83 (1793–1795).
As the ship-lists lack any measure of ship size, the data tells of visiting frequencies rather than cargo volumes. Common sense, of course, suggests that the average Baltic vessel was smaller than the typical British and Dutch ship. This assumption is also supported by the estimations, based on cargo volumes of 1787, made by Johansen's Danish Sound Toll project, which found that the average size of British and Dutch ships (233 and 250 British tons) was about a third higher than the overall average (175 British tons). 21 Even the Kronstadt ship-lists suggest that some vessels from the Baltic's southern shores were rather small, particularly ships from Rostock, which brought shiploads of apples and peaches every autumn, as well as those from Kiel, which supplied the imperial court and aristocratic houses with oysters and lemons. On the other hand, many ships from Lübeck, Stettin (Szczecin) and Danzig (Gdansk) regularly visited Bordeaux or Portuguese salt ports, as well as carrying cargo within the Baltic, and they seem to have been almost as large as the British and Dutch blue-water sailors that entered Kronstadt. 22 Thus, the difference in average cargoes may not have been so extensive, that it would overturn the assumption that imports from the southern Baltic shore played an important role in St. Petersburg.
As was mentioned before, the wars of the 1740s and 1750s may have harmed the maritime trade of western sea powers, and indirectly favoured their BaItic competitors, in particular those based in German and Prussian ports. It is therefore possible that the tables were turned after the peace treaties of 1763. Unfortunately, after 1752 Kronstadt arrivals data can only be found for 1756 – and as the Seven Years War broke out in May this was a very exceptional year. However, even the total figures reveal a drastic turn of trend in the 1770s (as, indeed, was already seen in the overall development of the ‘Baltic element’): whereas arrivals from German and Prussian seaports still increased rapidly in the 1760s, the growth was replaced by a sudden stop and modest decline in the following decade. 23 This probably reflected the economic disturbances in the German hinterland caused by the Seven Years War. However, the trend altered again in the 1780s with arrivals from the southern Baltic seaboard exceeding earlier levels by a clear margin. Crude estimates of import cargoes, based on the earlier ballast ratios, are presented in Table 4. 24 They suggest that, even after the decline, import cargoes from the Baltic southern coast may well have amounted to roughly the same numbers as those from Britain – and higher than those from the Dutch Republic. On the other hand, the contribution of northern Baltic ports seems quite small. The estimate for the 1780s should, however, be taken with a pinch of salt as it seems that small cargoes of fruits and seafood may have increased above the average, although this also was the period when Lübeck enjoyed a positive trade balance with Russia. 25
V
In spite of being the main inlet for foreign luxury goods destined for St. Petersburg's aristocracy, Kronstadt's commerce was basically dominated by exports. The overwhelming majority of departing ships were fully laden with Russian primary goods or semi-finished products like timber, sawn wood, hemp, flax, tallow, leather, grains and bar iron, which always exceeded incoming cargo volumes by a clear margin. 26 These export trades were dominated by British ships, which were given an early boost by the Anglo-Russian Commercial Treaty of 1734. 27 By the mid-1740s, ships destined to Britain (most of which were British-owned) accounted for about 40 per cent of all departures from Kronstadt, and by the late 1770s and early 1780s, this proportion had risen to 45 per cent. Being larger than average vessels, their share of actual cargo volumes was even higher, probably around a half in the 1780s. 28
Between the early 1740s and mid-1780s, departures from Kronstadt to British ports trebled; a growth factor that pertained to all the shipping outward bound beyond the Sound. At the same time, departures to Baltic destinations only grew by a factor of 2.3 and Prussian and German seaports just managed to double their traffic. Departures to the Dutch Republic, in contrast, barely grew at all; indeed, they contracted dramatically during (and after) the Anglo-Dutch naval conflict (1780–1784).
The fastest growth of all, albeit from a very low base, was evident in the carriage of export cargoes to French, Iberian and Mediterranean ports. In fact, the growth must have been even faster than the numbers in Table 5 suggest. Since the early 1770s, the Kronstadt ship-lists introduced a new but ambiguous classification: increasing numbers of ships were recorded as departing ‘to the Sound’ (nach dem Sund). 29 While such a destination almost seems equal to ‘missing data’, it was perfectly logical and reflected the realities of contemporary shipping. Many skippers left Kronstadt not knowing their final destination and sailed first to Elsinore (Helsingör) where more up-to-date orders could be received by mail or from shipping agents; such a strategy was particularly useful for long-distance traders. It is, of course, far from certain that all ships departing ‘to the Sound’ were bound for France or beyond; however, many of the skippers in question had names of Dutch or Low German origin, which suggests that the proportion of ships sailing to British ports was fairly modest among them. It can also be noticed that the numbers of ships ‘to the Sound’ largely fill the void that suddenly appeared after 1775 in the column headed ‘France and beyond’.
Departures from Kronstadt, 1744–1796 (Annual averages).
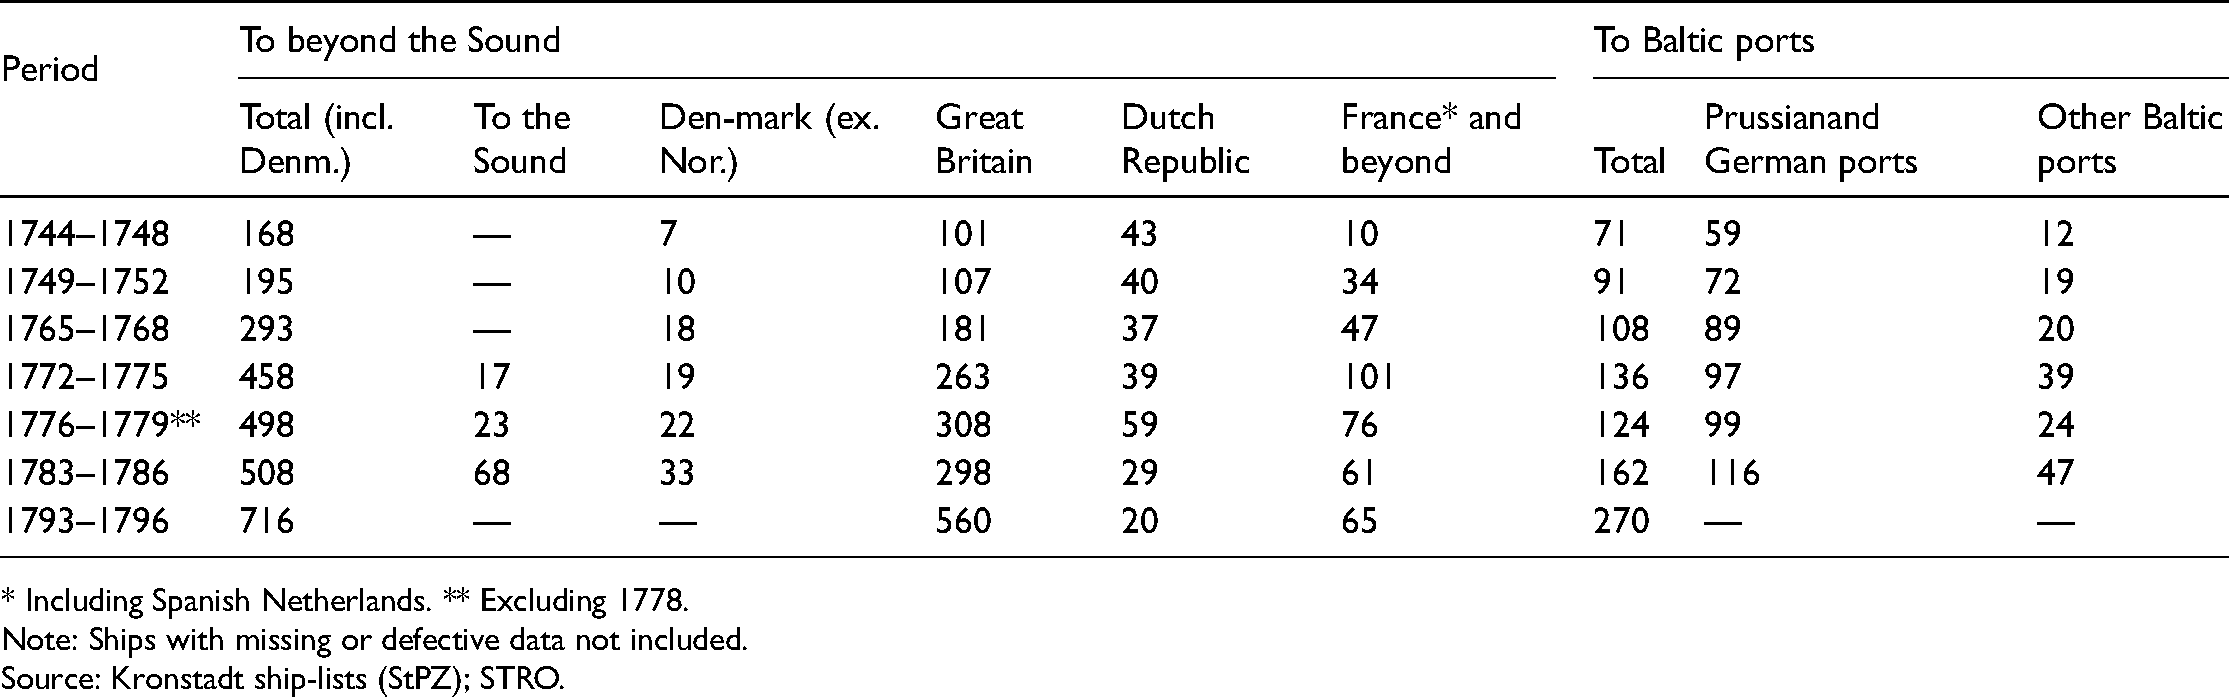
* Including Spanish Netherlands. ** Excluding 1778.
Note: Ships with missing or defective data not included.
Source: Kronstadt ship-lists (StPZ); STRO.
The rapid growth of exports to Britain undoubtedly reflected the accelerating economic growth of that country during the late eighteenth century. The reduction in Russian exports dues, notably in 1766, served as an additional boost to this trade. On the other hand, the big imbalance between British imports and exports can also, at least partly, be explained by Russia's policy of protecting its manufacturing industries. Import dues for lower-quality textiles and iron products were so high that they effectively strangled British imports or, rather, directed them to high-quality categories. 30 The demand for the latter, however, was too limited to fill the holds of all ships sailing to Kronstadt. Thus, it is no wonder that the majority of British ships arrived in ballast.
The case of the Dutch Republic was quite the opposite. In the late eighteenth century, its domestic economy grew hardly at all, which resulted in, for example, the collapse of demand for urban construction. Thus, the Republic, unlike Britain, did not experience dynamic expansion in its imports of Russian primary and semi-finished products. 31 Graphic proof of the low and static volume of shipping from Kronstadt to the Netherlands is apparent in the number of ships departing to the Republic, which, in the 1770s, was less than a half of the number entering Kronstadt from Dutch ports. However, this did not mean that many of them left Russian waters in ballast: several Dutch ships seem to have loaded cargoes of forestry and other primary produce for Southern Europe instead of their home ports.
Overall, the growth of Kronstad's export shipping on southern long-trades followed a common eighteenth-century trend. During this period, Nordic countries, in particular, were increasing direct trading contacts with the Biscayan, Iberian and Mediterranean areas, selling timber, sawn wood and tar in exchange for salt and other southern produce.
VI
The growing volume of commerce with Southern Europe indicates that even St. Petersburg, situated in the backwaters of ocean trades, became connected with the entrepôt trade of big Atlantic seaports. At the same time, the case of Kronstadt also tells of competition between the traditional middlemen as well as of attempts to bypass them by creating direct trading contacts.
The traditional entrepôt commodities to North European countries consisted of colonial goods like sugar, coffee, tobacco, 32 cocoa, spices and wine. These were typically the products that St. Petersburg, a rapidly growing consumption centre with a wealthy upper class, demanded in large volumes. Sound Toll records reveal that, already in the 1720s, a few ships were destined to Kronstadt directly from Bordeaux with cargoes of wine, spirits and other French products. 33 Much more, however, seems to have arrived from the traditional leading entrepôt, Amsterdam, while also a few Hanseatic ports, above all Lübeck, seem to have started to export wine, sugar and other colonial goods to St. Petersburg. Although the almost total lack of cargo data in the Kronstadt ship-lists makes it impossible to present any comprehensive estimates, there is at least some circumstantial evidence. The prominent role of German and Prussian ports in St. Petersburg's imports in 1744–1752 was already seen before, and the most important of them, Lübeck, accounted almost a half of the inbound cargoes. While the ship-lists only rarely specify shipments of wine into Kronstadt, the customs records of Riga indicate that substantial imports of wine and colonial goods came from Lübeck. 34 On the other hand, the Sound toll records show that by the 1730s and 1740s, the city regularly imported large amounts of wine and sugar, in particular from Bordeaux, typically in 20–25 ships a year, of which 11 to 16 were domestic vessels. 35 Moreover, wine was also imported overland (or by rivers). The imports were so plentiful that, in addition to St. Petersburg and Riga, Lübeck also carried wine to Stettin, Danzig and Königsberg. 36
Atlantic salt, being a mass consumption good, was not a typical item in the entrepôt trade, but intermediate suppliers like the Dutch often carried it from producers to consumers. However, salt imports to St. Petersburg remained modest, mainly because of high customs dues, which were designed to protect domestic production of White Sea salt. Before 1750, only a couple of ships a year passed the Sound with salt cargo for Kronstadt, many of them loaded in Amsterdam. On the other hand, Lübeck (being able to exploit the vast reserves of Lüneburg salt) imported much less Atlantic salt than Danzig, which does not suggest plentiful re-exports to St. Petersburg. Danzig, again, maintained only modest trade with the Russian capital and may have acted as a salt-entrepôt for East Prussia and North Poland. 37
Another side of the wine and salt trade can be traced much more precisely. Long distance arrivals from French, Iberian and Mediterranean ports were, of course, recorded by the Kronstadt ship-lists as well as the Sound toll records. 38 As Table 6 demonstrates, this was a sector of shipping that grew more rapidly than any other from the 1740s – except the respective exports. Splitting the data by different areas of departure, a clear pattern of development can be seen. Until the 1760s, most of the cargo (85–80 per cent) came from the French Atlantic region, that is Bordeaux, Le Havre and the Biscayan salt ports. In the early 1730s, these ports only sent a maximum of three ships a year to Kronstadt, but subsequently the trade grew no less than four-fold from mid-1740s to early 1770s. This strong upward trajectory reflects France's supremacy in the commerce of wine and colonial goods to Northern Europe. 39 A new pattern can be seen emerging in the 1770s with the distinct growth of Iberian and Italian imports and the stagnation of the French trade. However, in the mid-1780s, the traditional French Atlantic ports still retained their position as the leading source of imports with a share of 46.7%. It was only after the 1789 Revolution, and especially the outbreak of the French Revolutionary wars in 1792, that this flow of southern produce to the North collapsed.
Arrivals from French and South-European ports (incl. Austrian Netherlands), 1744–1786 (Annual averages).
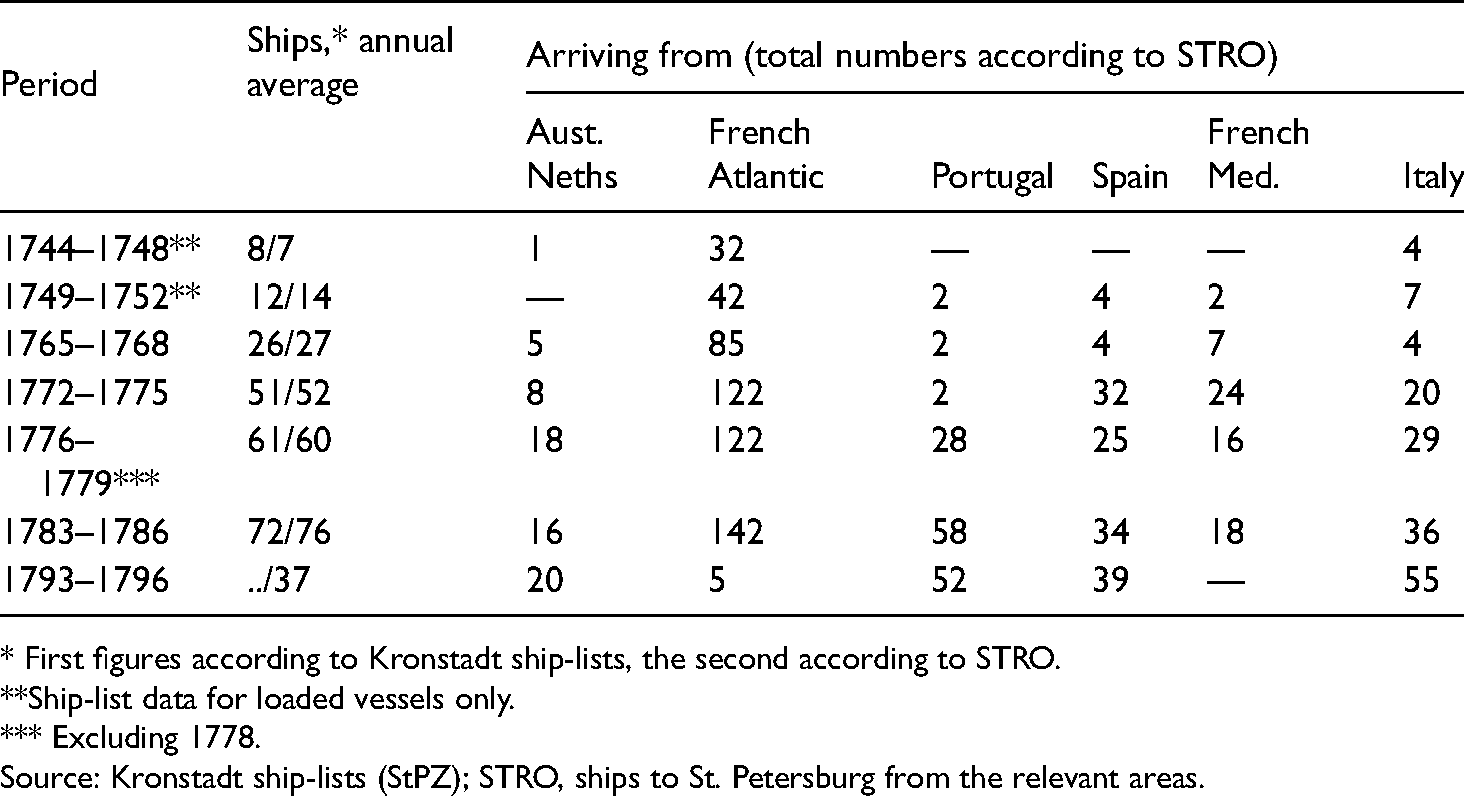
* First figures according to Kronstadt ship-lists, the second according to STRO.
**Ship-list data for loaded vessels only.
*** Excluding 1778.
Source: Kronstadt ship-lists (StPZ); STRO, ships to St. Petersburg from the relevant areas.
An idea of who engaged in this trade can be formed by looking at the Sound toll nationality data. While nominally referring to skippers, they state under which flag the ship was sailing, as this could affect the dues to be charged. In this respect, two different patterns can be discerned, one typical of the ‘classical’ French Atlantic trades and the other for the remaining trades (see Table 7). Dutch ships were initially pre-eminent in the former, their dominance continuing until the Anglo-Dutch naval war. Ships from St. Petersburg and Lübeck also participated quite regularly in the trade, 40 while the French seldom sailed to the Baltic – it was only in the early 1770s that their number suddenly (but temporarily) increased. The increase of the capital's own shipping was aided by Russian economic policy, which was designed to encourage investments in shipping by granting different advantages for the national merchant navy, especially in the reign of Catherine II. Yet, the ‘Russian’ identity of St. Petersburg ships was often formal rather than genuine: with few exceptions, the names of their skippers suggest Dutch, Low German or, occasionally, Scandinavian origins. This ‘maritime immigration’ was particularly strong in the early 1780s; indeed, it seems that quite a number of Dutch ships simply changed flag in order to avoid capture during the naval conflict. 41
Nationality of ships sailing from French, Iberian and Mediterranean ports to St. Petersburg (total numbers, selected relevant nationalities).
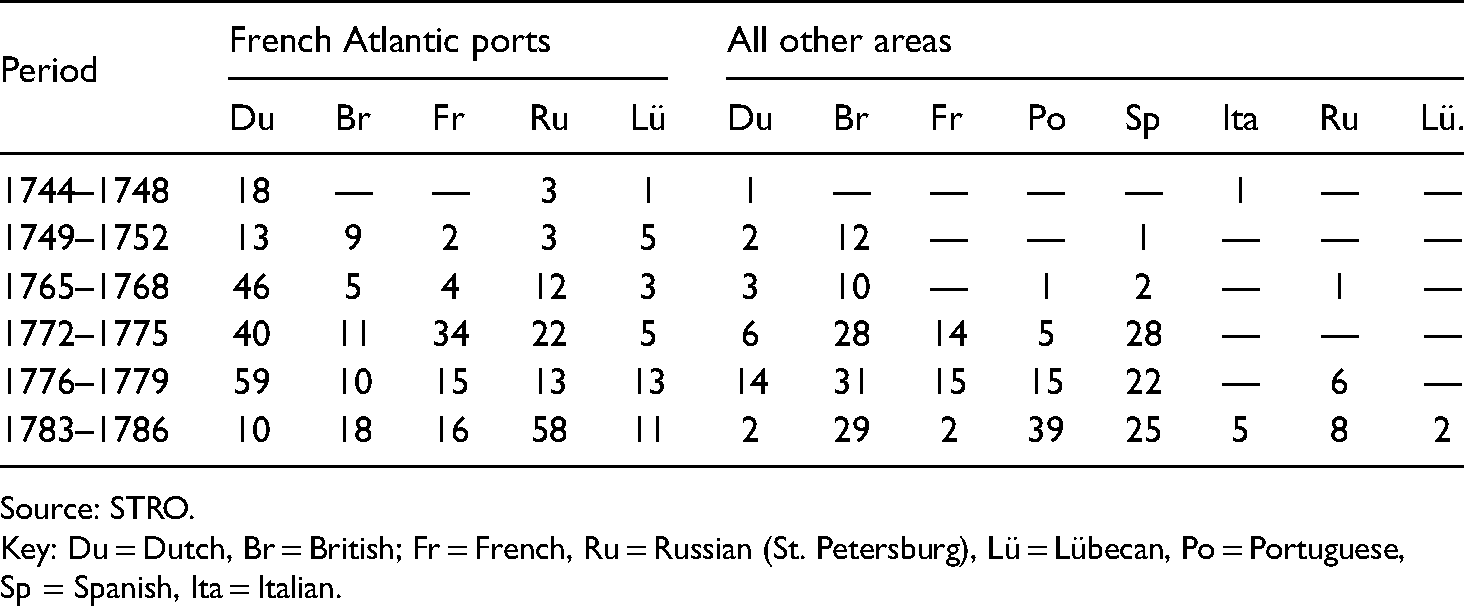
Source: STRO.
Key: Du = Dutch, Br = British; Fr = French, Ru = Russian (St. Petersburg), Lü = Lübecan, Po = Portuguese, Sp = Spanish, Ita = Italian.
In contrast, the role of the Dutch was modest in the Iberian and Mediterranean trades, in which British ships were prominent. However, the growth of traffic in the 1770s was mainly based on the increasing activity of local, above all Spanish and Portuguese, seafarers. In the 1770s and 1780s, some St. Petersburg vessels loaded import cargoes in Iberian and Mediterranean ports, but ships from Lübeck remained very rare.
An interesting question is whether the traditional entrepôt trade with Amsterdam suffered due to the growth in direct imports from more southern ports. Some indications, at least, can be found by looking at the Sound toll data of imports from Amsterdam to Kronstadt. Around 1750, some 12 to 15 ships a year carried imports of wine and/or spirits into the Russian capital, and subsequently the average fluctuated between 10 (1772–1775, 1783–1786) and 17 (1775–1779). The data suggest neither a substantial decline nor any systematic growth. It seems that Amsterdam still remained a natural outlet for Rein and Mosel wines as well as German spirits and Dutch tobacco, but its role as the principal intermediary of wine and colonial goods from French Atlantic ports to the Baltic area clearly diminished. 42 This loss, however, was fully compensated by the strong position of Dutch shipping in the expanding direct trade of French ports.
Quite similarly, Lübeck's modest entrepôt trade was affected by the growth of shipping between France and St. Petersburg, which also seems to have influenced Lübeck's traditional direct trade with the Russian capital. The fact that arrivals from Lübeck to Kronstadt declined in the 1770s, roughly at the same time as Lübecan participation in longer trades increased, suggests that the opportunities presented by the latter affected the former, at least in some degree. 43 On the other hand, Hamburg's participation in St. Petersburg trade became more active, which probably diminished its exports via Lübeck. Thus, it seems that Lübeck's role as an intermediate supplier of wine and colonial goods for the Russian capital diminished.
VII
The case of St. Petersburg is interesting in many respects, though it must be asked if its experience was typical of Baltic commerce as a whole. Answering such a question is difficult because comparative data for other major Baltic ports are hardly available. One rare exception is Riga, for which just a basic series of arrivals, covering most of the eighteenth century, can be found in von Storch's statistical work. Comparing these with corresponding westward passages through the Sound it can be seen that the proportion of intra-Baltic shipping fluctuated around a third (29–38 per cent), roughly at similar levels as in Kronstadt (26–37 per cent). On the other hand, the much sparser data for Reval (Tallinn) infers that Baltic trade was totally dominant there, extending to around 90 per cent of all shipping. 44
Among the major ports, St. Petersburg was atypical in more than one respect. First, as a newcomer, the scale of its shipping was rather modest for a long time, even on a Baltic scale, and it was only at the end of the century that the Russian capital achieved a position among the big ports. Of course, the lack of inter-Baltic traffic data makes such a comparison more or less arbitrary, but the Sound Toll records – which may cover something like two-thirds of the traffic in major Baltic ports – demonstrate that, at least in terms of exports to Western Europe, St. Petersburg stayed long in the shadow of the really big ports, like Danzig and Riga (see Table 8). Before the 1750s, its traffic was still less that that of Stockholm.
Westward traffic though the Sound from selected major Baltic ports, 1731–1790 (Departures, annual averages).
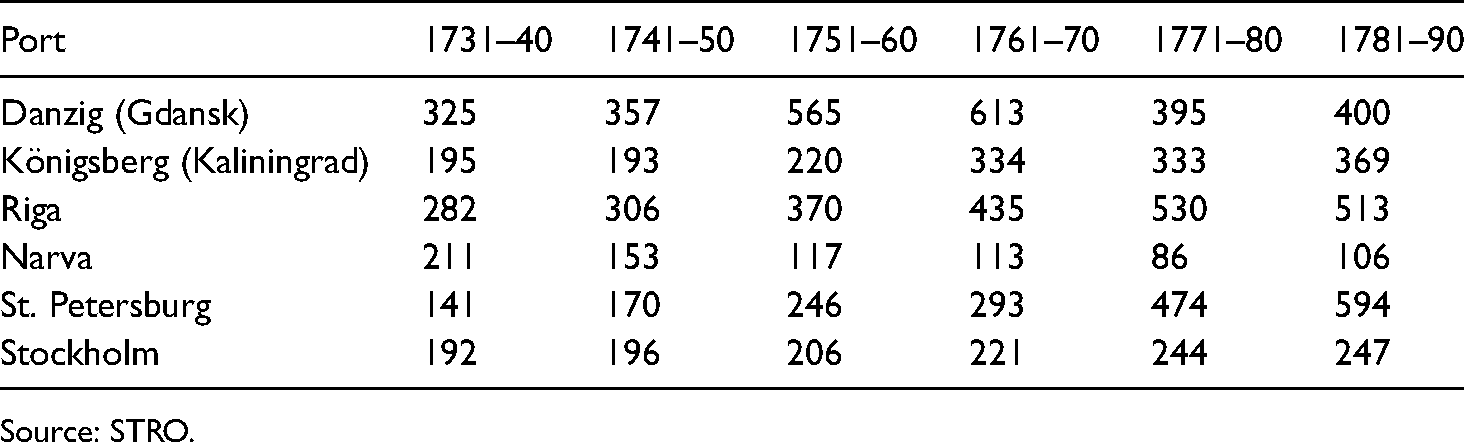
Source: STRO.
In another respect, St. Petersburg was even more unique. From the 1720s onwards, British ships were more numerous than Dutch in the port. In the following decade, they were twice as many, and by the 1770s eclipsed their Dutch rivals by a ratio of four to one. Only Stockholm exhibited similar (perhaps more extreme) British dominance. Overall, however, the scales were quite the reverse with Dutch having a clear majority in the Sound until around 1750; it was only as late as in 1775 that the British passed them for the first time. The ultimate collapse of the Dutch market share coincided with the Anglo-Dutch naval conflict.
The early Dutch dominance in the principal Baltic ports was built upon their merchant colonies and efficient networks, created in the sixteenth and seventeenth centuries. Still in the 1740s, Dutch shipping was prevalent in Danzig, Königsberg, Riga and Narva, where it maintained its leading role well into the 1770s. Even in St. Petersburg, the Dutch were the first to establish trading contacts with the new imperial city – even founding their own reformed congregation in 1717 – but quite soon they were overshadowed by the faster growing English and German colonies. Having already a strong base for Russian trade in Archangel, Dutch merchants obviously regarded that to be a safer alternative, while the English, who did not fare so well in the north, were happy to abandon Archangel for St. Petersburg. 45
St. Petersburg's experience does not challenge the well-established view that the Dutch and, subsequently, British expansion acted as the dynamic force in Baltic shipping. Indeed, in spite of certain special features, it was a prime example of this pattern of development. Implicitly, however, the Sound data suggest that this West European dominance mainly affected major ports, and that there was another, more traditional pattern. Most of the smaller ports around the Gulf of Bothnia, on the Estonian north coast and islands, and even on the Baltic southern seaboard still remained in their traditional, almost rural mode; on the other hand, their modest shipping hardly made an impact on the big picture. 46
However, the case of Reval suggests that even a medium-size provincial port was only slightly affected by export trades to West Europe. This also concerns a few bigger ports on the German north coast, such as Rostock and Lübeck. Ships loaded in these ports did not abound in the westbound traffic through the Sound: in the period 1751–1780, typical annual figures for Lübeck ranged from 30 to 50 ships, 47 and for Rostock from 20 to 40. However, only a few of them sailed to British or Dutch ports, and only a few Dutch and British ships entered these Hanse towns: typical annual figures were only around 13–20 in Lübeck and five to six in Rostock. Stettin presented an example of somewhat deeper integration with West European shipping: in 1751–1780 it typically despatched 100–150 shiploads a year westward through the Sound, and also received 50–90 Dutch and 10–20 British ships. Even these were modest figures compared with those of Danzig: 600–400 shiploads a year westward through the Sound, and 280–140 Dutch and 70 British ships visiting the port. 48
At least as far as Lübeck and Rostock are concerned, the Sound toll data are only able to touch the fringes of their navigation. Fortunately, we have an additional, and better, peephole provided by the ship-lists of Lübeckische Anzeigen, a weekly paper that started in 1751. Just a small sample of this data is sufficient to demonstrate that the mode of Lübeck shipping was very different from that of St. Petersburg. 49 Paradoxically, both were roughly in the same size class: in the mid-1750s, departures from Lübeck (excluding coastal traffic 50 ) and Kronstadt exceeded 300 ships a year, and, in the early 1780s, both accounted over 600. However, as far as departures to west of Sound are concerned, there was a huge difference: typical proportions for Kronstadt were, as was seen before, 65–70 per cent, but for Lübeck they only amounted at most to 10 per cent. 51 Accordingly, while Baltic shipping was for St. Petersburg just one (though substantial) element, it was all-important for the old Hanse city, the mainstay of its maritime trades. Instead of Britain or the Dutch Republic, its shipping was heavily directed towards the western, northern and eastern rims of the Baltic Sea, to the Russian Baltic ports (St. Petersburg, Narva, Reval (Tallinn), and Riga) as well as to Sweden and Finland. 52 Thus, the data for Lübeck demonstrates that, among major Baltic ports, there was at least one significant exception to the general eighteenth-century pattern – and makes it probable that there were a few other, more or less similar cases.
Footnotes
Declaration of conflicting interests
The author declared no potential conflicts of interest with respect to the research, authorship, and/or publication of this article.
Funding
The author received no financial support for the research, authorship and/or publication of this article.