
Abstract
The founding of St. Petersburg demonstrates the redistribution of power brought about by the Great Northern War. This new order also had an economic dimension: the city and port aimed to displace the old outlets of Russia's foreign trade. The change, however, was much slower than the traditional historical narrative suggests. Riga's shipping volumes exceeded those of St. Petersburg until the 1780s. In theory, St. Petersburg had huge hinterlands covering the old economic realms of Novgorod and Pskov, as well as Muscovy lands stretching to the Urals and beyond. However, St. Petersburg's transport connections beyond the Valdai Hills were arduous: they relied on a riverine route that could only be navigated with shallow-draft barges. Moreover, most of the route's transport potential was needed to carry grain for the population of St. Petersburg. This left rather small margins for the transit of export goods to the port.
I
The founding of St. Petersburg has been characterized as an epochal event, a symbol as well as the cornerstone of the redistribution of political and military power in the Baltic Sea area. It has also been regarded as an important event in the economic sense – as something that, by breaking the old Swedish barrier that kept Russia off the Baltic Sea, radically changed the old trade relations and seaborne connections. A central element in this economic policy was the new port, which was to become the prime outlet for Russian foreign trade with the West. 1
In traditional Russian historiography, the creation of St. Petersburg has been presented as a great success story. Sometimes, the story seems to have grown larger than life. For example, in a study published in the 1950s, it was claimed that, at the time of Peter the Great's death, St. Petersburg had already become the most important Russian port – an interpretation that contemporary sources do not substantiate. 2 In fact, the early history of St. Petersburg was not quite as splendid – Tsar Peter's great plan did not come to fruition in his lifetime. Moreover, after the death of his wife and successor, Catherine I, the future of his brainchild was endangered by the imperial court's return to Moscow. It was only saved by Peter's niece, the new empress Anna Ivanovna, who moved back to St. Petersburg in 1730.
In order to promote the development of St. Petersburg, Peter gave orders to curb the trade from the northern outlet, Archangel. In the seventeenth century, it had prospered as an alternative to the single Russian western outpost, Ivangorod, but now it was regarded as a potential competitor. Also, the trade of Narva was restricted by allowing it to export only products from the Pskov region. However, the newly conquered regions included a port that had much greater potential. Since the Middle Ages, Riga had been a prime outlet for Baltic, Lithuanian and West Russian products. Even Riga's economic influence was compromised by decreeing that its hinterlands should not stretch beyond West Russia and Ukraine. 3 On the other hand, Tsar Peter allowed Riga to keep its old privileges, 4 and did not restrict its trade with the West in any way. Thus, Riga retained its old position and prospered, even in the new political context. A clear indication of this prosperity was the growth of its shipping: for decades after Peter's death, it was rated as the busiest Russian port. It was only during the reign of Catherine II that St. Petersburg started to match Riga in this respect (see Figures 1 and 2).
Comparing the development paths of these quite different ports offers interesting viewpoints into eighteenth-century transport history concerning not just the ports themselves but also the connections between the ports and their hinterlands. In a comparison, old, well-established Riga contrasts sharply with brand-new St. Petersburg, which had to build from scratch both its mercantile networks and transport routes towards the interior. Riga, again, enjoyed all the advantages of an old, well-established, wealthy commercial centre. It had commanded the vast hinterlands within the Dvina (Daugava) river basin and even beyond. By fairly easy portages, its upper reaches and tributaries had been connected with the basins of the Dnieper, Volga and Volkhov. Although several rapids hampered traffic on the Dvina, purposeful vessels and methods of river navigation had been developed and necessary transport infrastructures had been created across the centuries. Correspondingly, widespread merchant networks (with appropriate financial systems) had connected the city economically with its hinterlands. 5
In one respect, however, St. Petersburg and Riga were quite similar: both were ports that exported traditional East European raw materials and semi-finished goods, such as hemp, flax, tallow, hides and forest products. In the eighteenth century, even certain industrial goods, like iron, increased in importance. Most of these were bulky commodities that required a lot of seaborne cargo space. On the other hand, the country's imports were typically manufactured products – so-called ‘colonial goods’ and various luxuries that required much less tonnage than the exports. Accordingly, the volume of shipping frequenting these ports depended mainly on the development of exports.
Reasonable empirical data on Russia's exports, as well as all foreign trade, can (with a few earlier exceptions) only be found from the early 1770s onwards. 6 While this lack of sources can be problematic in the study of foreign trade (in particular, concerning the value of trade), the situation is not quite as bad in terms of port and transport history, for which volumes are more meaningful variables than values. Indeed, there is extensive data on shipping, which makes it possible to follow the traffic in St. Petersburg, as well as in other Russian ports, for earlier times. The most important of these sources are the well-known Sound Toll records, which cover all the traffic through the Danish Sound (Öresund) from the end of the fifteenth century to 1857. 7
Figure 1, which is based on the Sound Toll data, paints an interesting picture of the long-term development of shipping between Baltic and West European ports: the records of westbound ships tell us where they loaded their cargoes of eastern products. 8 This picture challenges the traditional narrative of Russian development in two important respects. First, it suggests that Russian foreign trade was experiencing a period of strong growth already in the 1680s and 1690s, thus long before Peter I's rise to actual power (1797). This agrees fully with similar conclusions drawn by Jarmo T. Kotilaine in his extensive dissertation; according to Kotilaine, Riga exported hemp, flax, wax and other traditional products not only from the Baltic, Lithuania and the Pskov or Novgorod regions, but also from as far afield as the heartlands of Muscovy. 9 This flourishing transit trade made Riga the most prosperous city in the whole Swedish realm, even surpassing Stockholm in terms of trade volumes. 10 On the other hand, the Swedish ports of Reval (Tallinn) and Nyen (Nyenskans) did not attract many Russian products; only Narva managed to increase its trade in the 1680s and 1690s. 11 As it seems that a lot of the exports from the Pskov or Novgorod regions were carried down the River Dvina to Riga, they were not facing any effective Swedish barrier – not at least during the last decades of the seventeenth century.
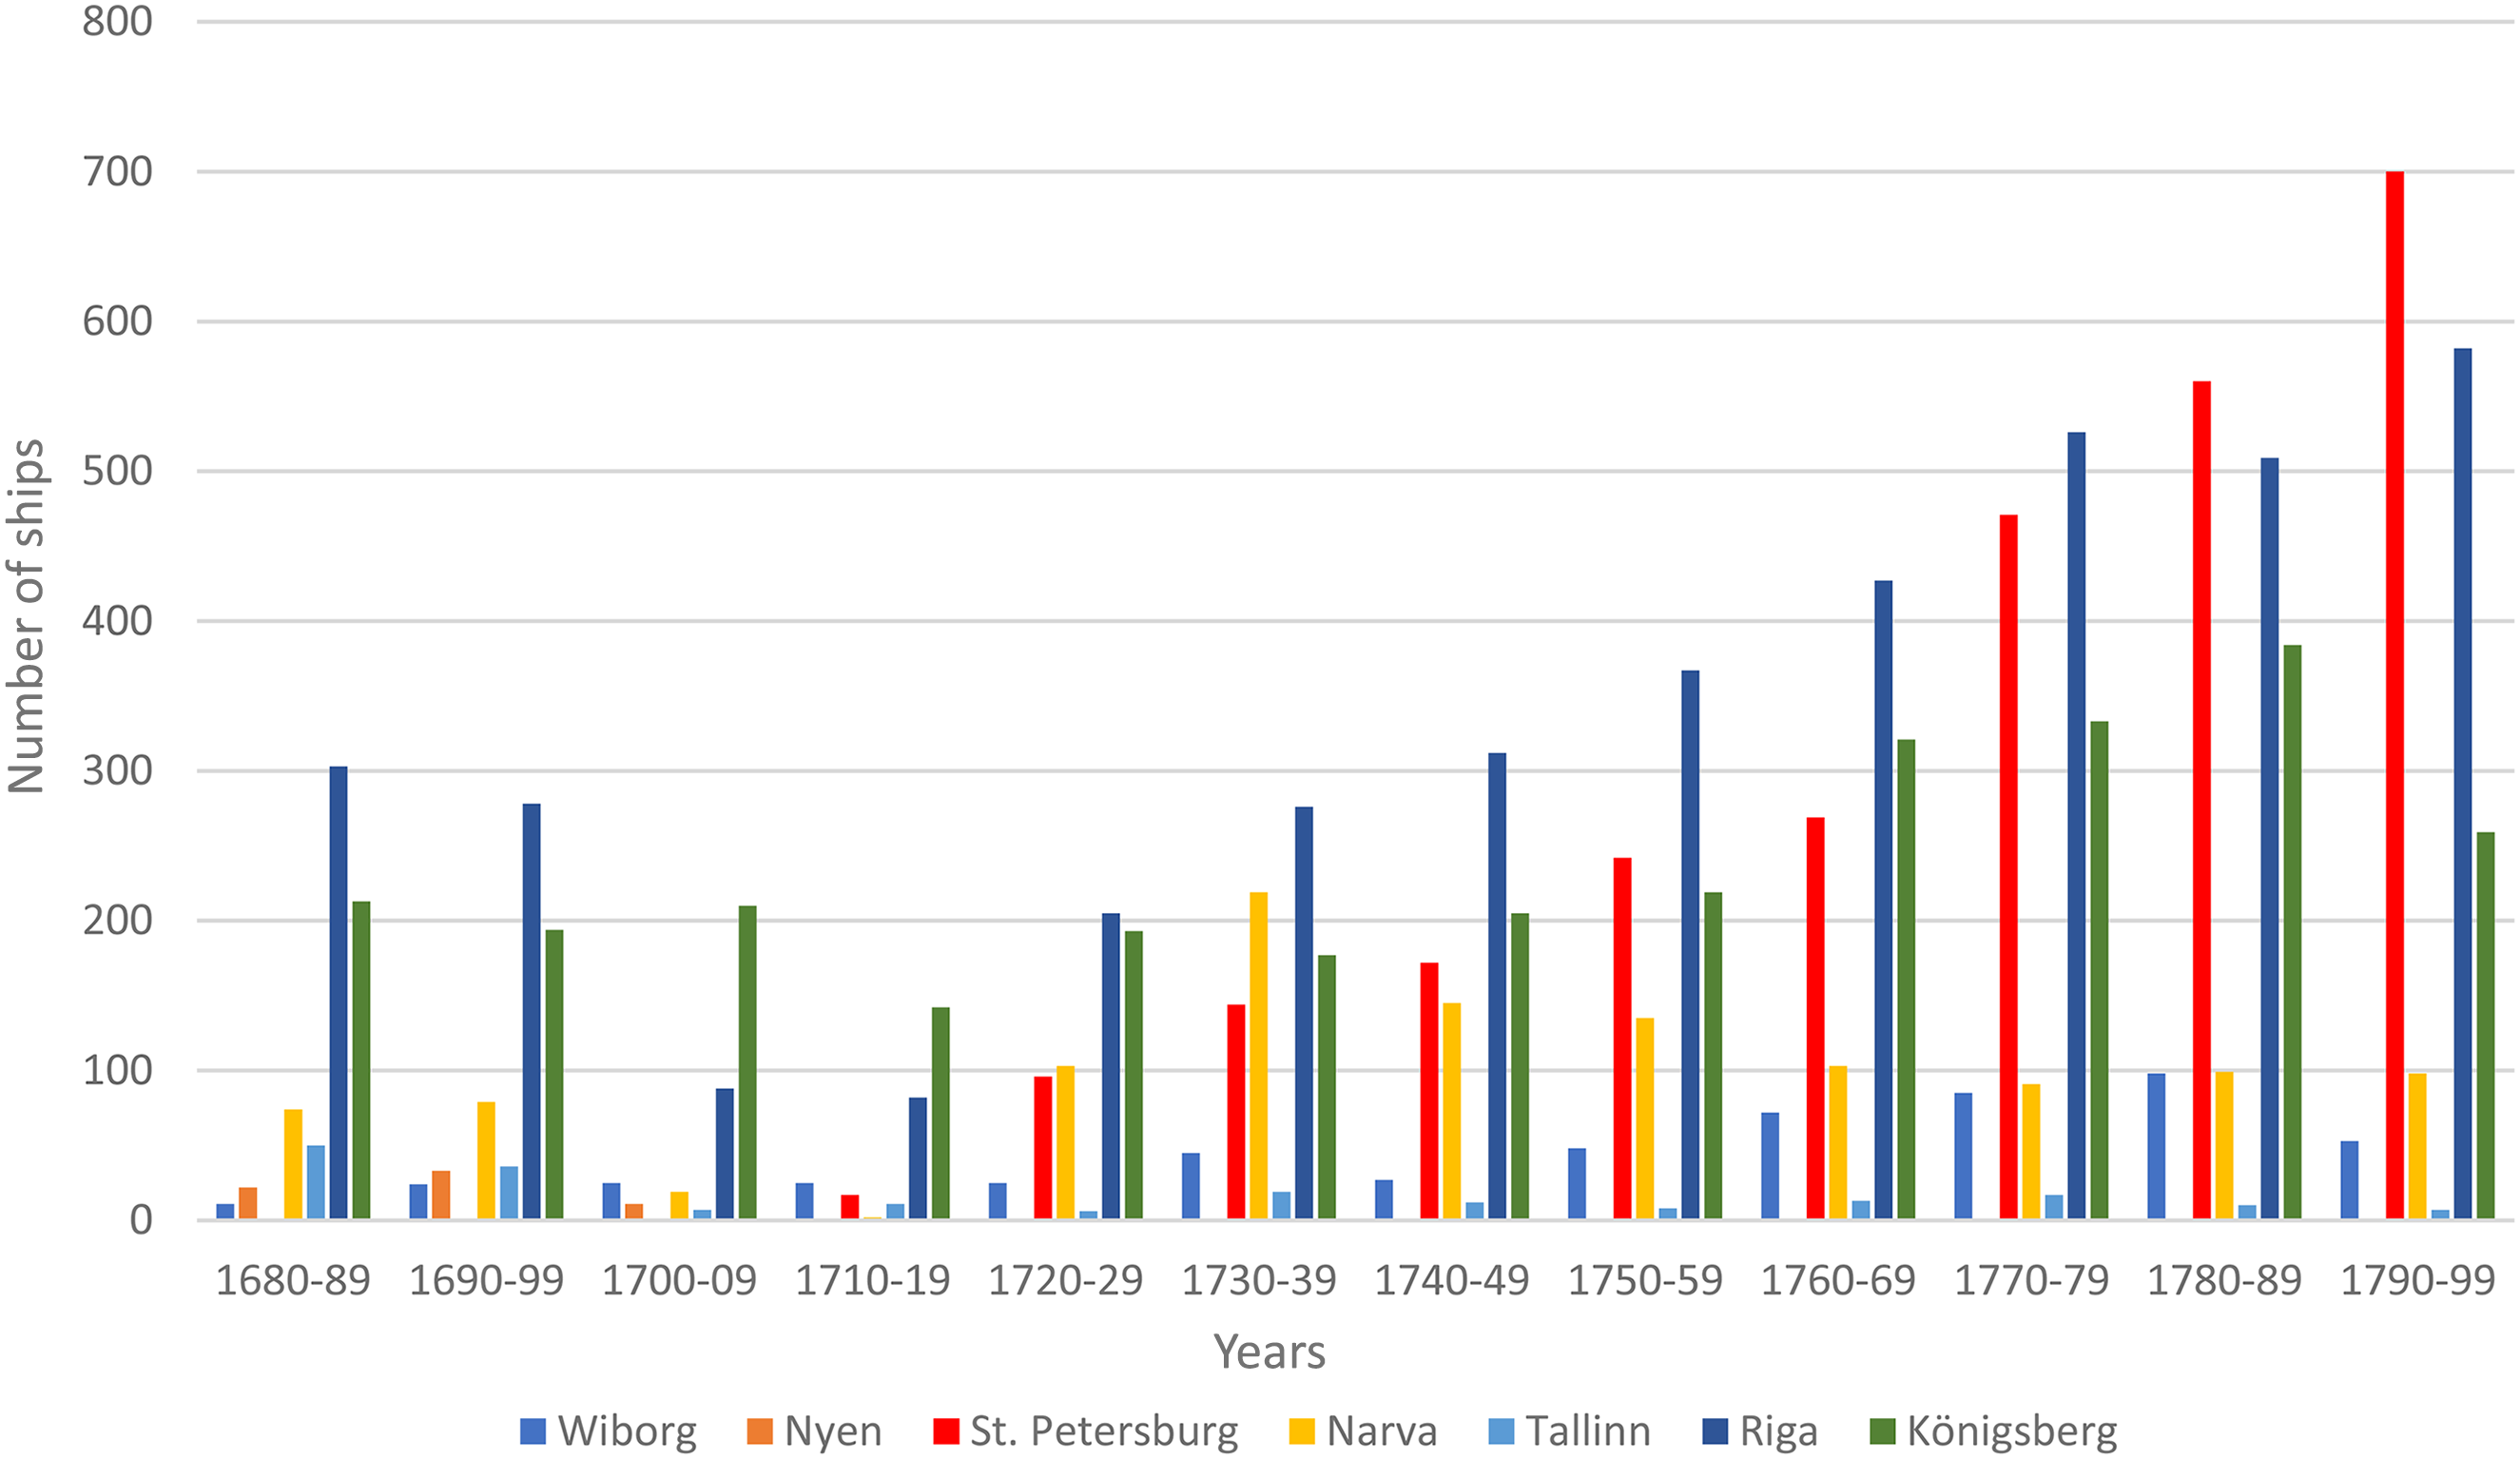
Number of ships sailing westward through the Sound, selected Russian and East Prussian ports, 1680–1800.
The second important message from the Sound Toll data is that the founding of St. Petersburg affected the structures of Baltic trade quite modestly at first. Riga's trade naturally suffered heavily from the Great Northern War while Königsberg may have profited from its misfortunes. However, Riga was already starting to recover before the Peace of Nystad (1721) and managed to resume its earlier position. Still, it was only in the 1740s that its shipping regained the levels of the 1680s and 1690s. In spite of a fairly good start in the 1720s, St. Petersburg was lagging behind even Narva until the late 1730s, attaining only about half of Riga's shipping volumes. Riga's shipping continued to grow briskly until the 1770s, with St. Petersburg staying clearly at a lower level. In the 1760s, however, the number of ships visiting the capital started to increase rapidly, and Riga's lead narrowed until St. Petersburg overtook it in the 1780s.
The Sound Toll records, however, have one substantial limitation: they lack data on Baltic shipping that did not sail through the Sound. Fortunately, the data of at least some sectors of such intra-Baltic shipping can be found in eighteenth-century newspapers (such as the St. Petersburgische Zeitung or Lübeckische Anzeigen) and contemporary statistical publications. 12 These sources allow us to complement the picture with data including intra-Baltic shipping (Figure 2), which usually amounted to a third of the grand total. 13 As Riga had more Baltic trade than St. Petersburg, this set of figures suggests that Riga still retained a narrow edge over the capital in the mid 1780s.
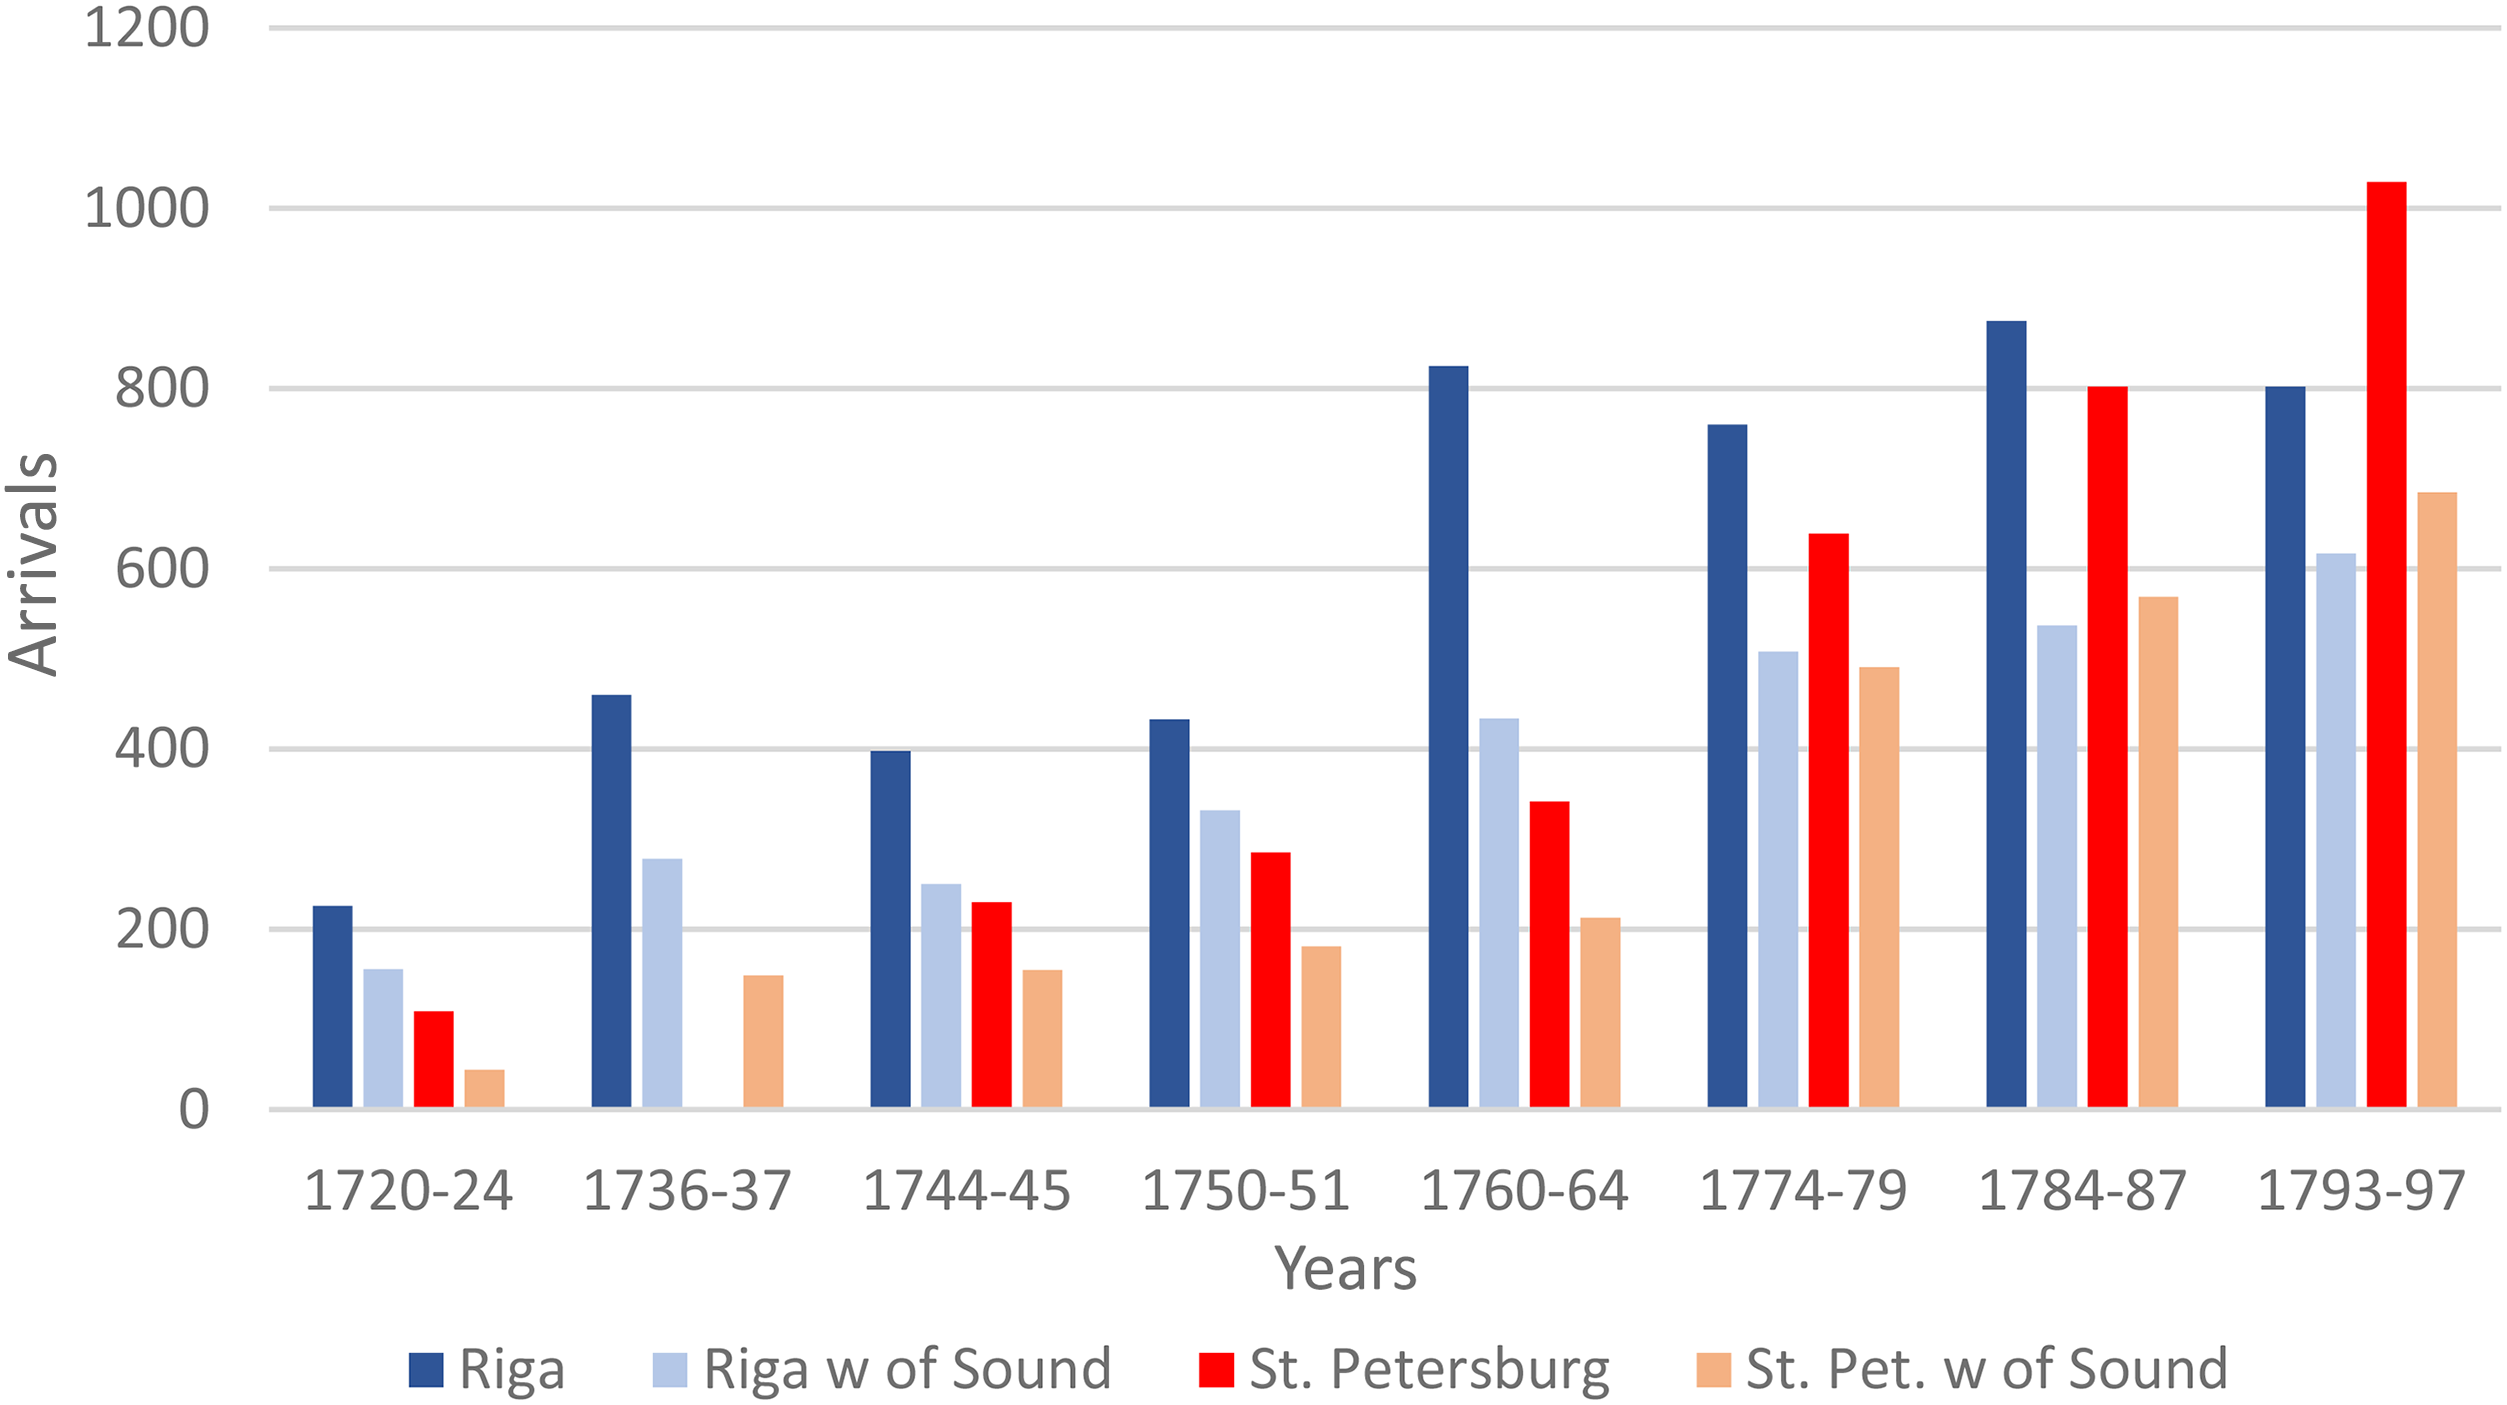
All arrivals and departures to the west of the Sound, Riga and St. Petersburg, annual averages, 1720–1797, selected periods.
The conclusions presented here must be treated with some reservations. The numbers of ships are not a perfect parameter of commodity flows or shipping volumes: as tonnages are not recorded, an important variable is missing, and there may be potential errors in cases where average ship sizes varied across time or between various ports. So far, there have only been a few studies on the development of ship sizes in eighteenth-century Baltic shipping. The most representative is Jake V. T. Knoppers’ study in the 1970s. His material consisted of several thousand arrivals in Amsterdam from the Baltic region. According to Knoppers, on-board cargoes grew moderately: thus, for example, in 1754, the average was close to 180 tons; in 1769, 196 tons; and in 1789, 202 tons. Another estimation has been presented by the Danish Sound Toll 1784–95 project, concerning ships sailing from different Baltic ports westward through the Danish Sound in 1787. According to this project, the average size of ships coming from Riga was 215 (British) tons, while the corresponding figure for those from St. Petersburg was only marginally higher at 222 tons. 14
Both studies thus suggest that there were no dramatic fluctuations in average ship sizes in the eighteenth century; instead, a fairly continuous but modest growth appears to have occurred. However, it still seems meaningful to estimate, however roughly, how much cargo space the exports from Riga and St. Petersburg actually required. Such calculations are, of course, only possible for the years for which the published statistics of Russian exports are available – that is, the late 1760s, 1770s and 1780s plus (in the case of St. Petersburg) a few separate earlier years. Fortunately, this data spans the critical years when St. Petersburg was catching up with Riga in terms of export shipping.
Such calculations are presented in Tables 1, 2 and 3 for a number of the most important export commodities (that is, according to the cargo space they required). All of the actual measures have been converted into one common denominator: the Swedish last (läst, equivalent to 2,448 tons). Being a unit of weight, other measures of this kind (ship-pounds, poods, and so on) can be easily converted into Swedish lasts. Moreover, there were also a number of well-established stowage ratios for light (volume) goods, showing, for example, how many barrels of grain or tar, or pieces respective dozens of timber products, could normally be stowed per one last. 15
Export volumes of major commodities, St. Petersburg, 1749–1783.
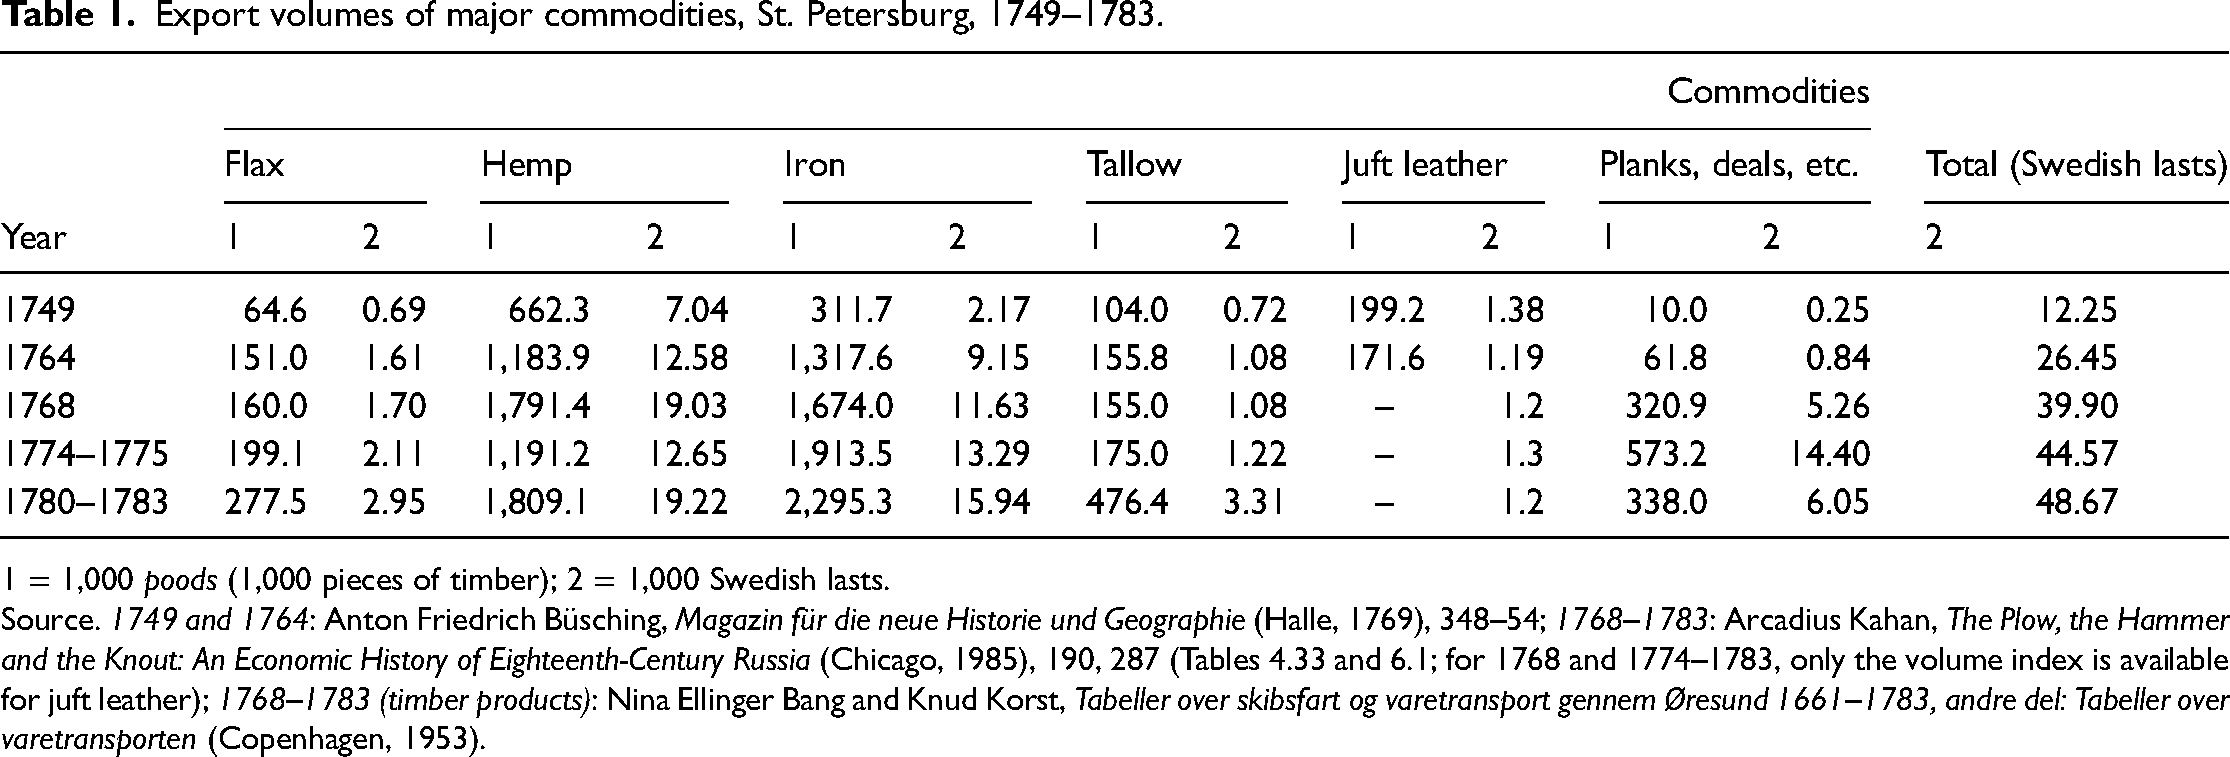
1 = 1,000 poods (1,000 pieces of timber); 2 = 1,000 Swedish lasts.
Source. 1749 and 1764: Anton Friedrich Büsching, Magazin für die neue Historie und Geographie (Halle, 1769), 348–54; 1768–1783: Arcadius Kahan, The Plow, the Hammer and the Knout: An Economic History of Eighteenth-Century Russia (Chicago, 1985), 190, 287 (Tables 4.33 and 6.1; for 1768 and 1774–1783, only the volume index is available for juft leather); 1768–1783 (timber products): Nina Ellinger Bang and Knud Korst, Tabeller over skibsfart og varetransport gennem Øresund 1661–1783, andre del: Tabeller over varetransporten (Copenhagen, 1953).
Export volumes of major commodities, Riga, 1766–1784.
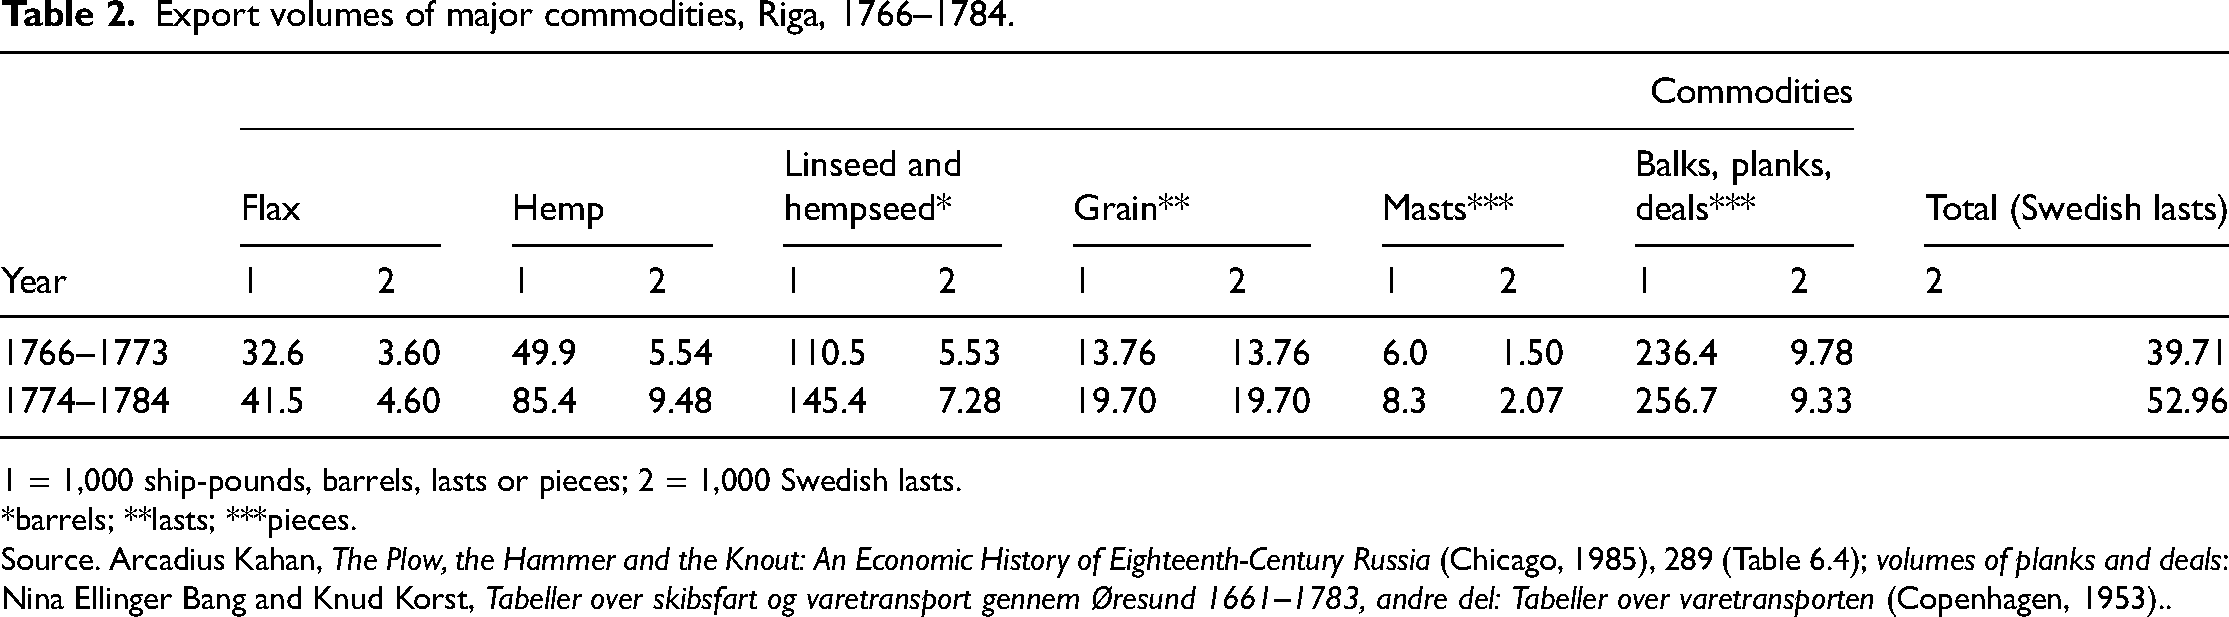
1 = 1,000 ship-pounds, barrels, lasts or pieces; 2 = 1,000 Swedish lasts.
*barrels; **lasts; ***pieces.
Source. Arcadius Kahan, The Plow, the Hammer and the Knout: An Economic History of Eighteenth-Century Russia (Chicago, 1985), 289 (Table 6.4); volumes of planks and deals: Nina Ellinger Bang and Knud Korst, Tabeller over skibsfart og varetransport gennem Øresund 1661–1783, andre del: Tabeller over varetransporten (Copenhagen, 1953)..
Average cargoes of major export commodities per ship, St. Petersburg and Riga, 1749–1784.
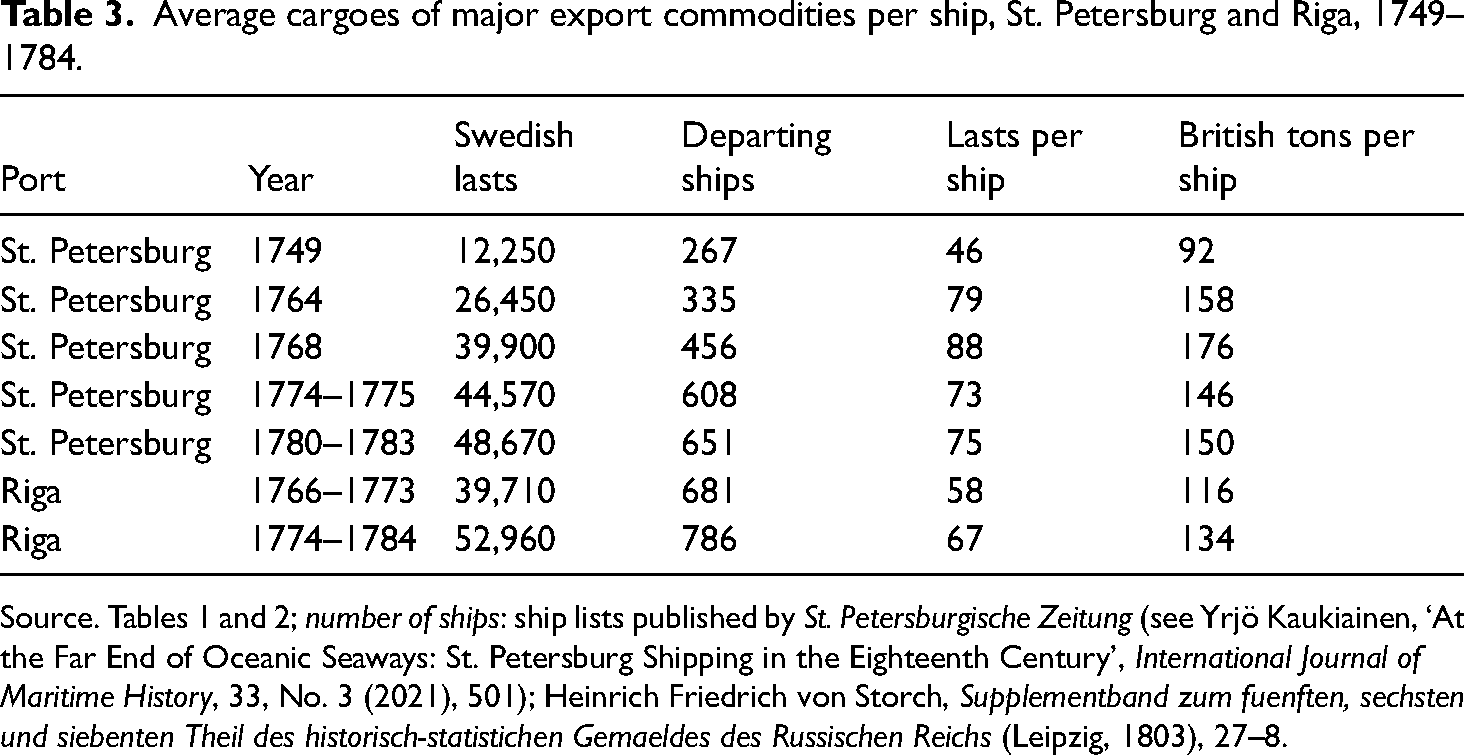
Source. Tables 1 and 2; number of ships: ship lists published by St. Petersburgische Zeitung (see Yrjö Kaukiainen, ‘At the Far End of Oceanic Seaways: St. Petersburg Shipping in the Eighteenth Century’, International Journal of Maritime History, 33, No. 3 (2021), 501); Heinrich Friedrich von Storch, Supplementband zum fuenften, sechsten und siebenten Theil des historisch-statistichen Gemaeldes des Russischen Reichs (Leipzig, 1803), 27–8.
The commodities presented in Tables 1 and 2 account for over 75 per cent of the total value of exports and probably an equal proportion of the respective demand for cargo space; thus, they can be regarded as a fairly representative sample. As annual fluctuations were substantial, the earlier single-year volumes for St. Petersburg – while of course suggesting quite impressive growth – may not be taken as precise indicators of the general trend. The more representative figures for the 1770s and early 1780s are roughly in line with the numbers of visiting ships in both Riga and St. Petersburg; they suggest that more goods were still being loaded in Riga than in St. Petersburg in the early 1780s.
The correlation between the numbers of ships and volumes of cargo is not perfect. As Table 3 demonstrates, average cargoes (or, actually, their minimum levels) were – contrary to the Danish estimate for 1787 presented above – 12–50 per cent lower in Riga than in St. Petersburg. The most obvious explanation for this difference is the fact that the Sound Toll figures only concerned ships sailing to the North Sea, or farther. Baltic shipping was particularly important in Riga and, since such trades usually employed smaller vessels than longer trades, this explains why the average size of ships was lower there than in St. Petersburg. 16 Still, the smaller average cargoes seem to have amounted to higher total lastages.
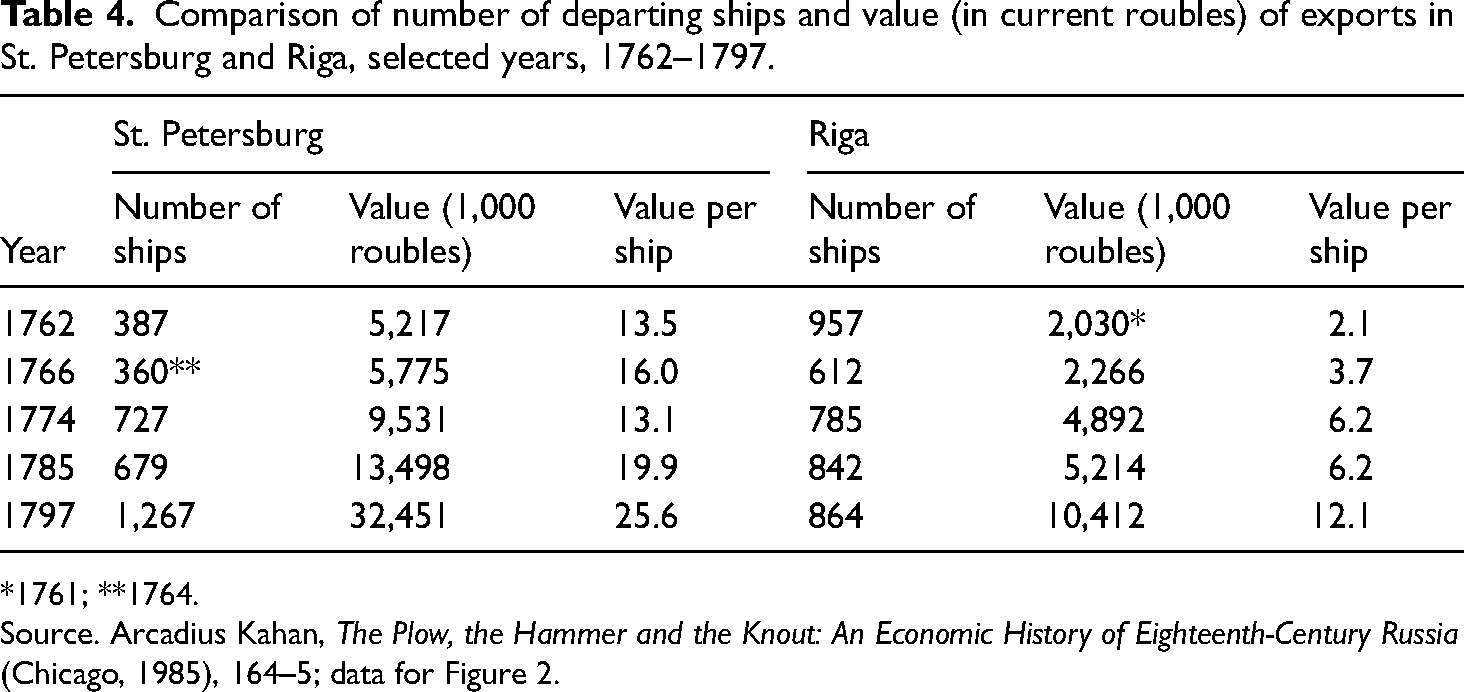
However, a totally different picture emerges if we, instead of shipping volumes, direct our attention to the value of trade. As mentioned earlier, the value data for both St. Petersburg and Riga can only be found from the 1760s onwards. According to this data, already at this earliest date, the capital accounted for a two-and-a-half times higher overall value of exports, and the same large imbalance prevailed – with various fluctuations – until the end of the century. According to figures published by Benedict Franz Herman in 1790, the values of St. Petersburg exports were, at the beginning of the 1740s, already slightly higher than those of Riga 20 years later, in 1761. 17 The vast discrepancy between the value and volume data is demonstrated with some examples in Table 4.
Comparison of number of departing ships and value (in current roubles) of exports in St. Petersburg and Riga, selected years, 1762–1797.
*1761; **1764.
Source. Arcadius Kahan, The Plow, the Hammer and the Knout: An Economic History of Eighteenth-Century Russia (Chicago, 1985), 164–5; data for Figure 2.
It can be seen that, in 1761–1762 and 1764–1766, the average values of a shipload in Riga only amounted to one-sixth and one-quarter, respectively, of those in St. Petersburg while, in 1785, the corresponding ratio was a third, and it rose to almost a half in 1774 and 1797. Such big variations (as well as their chronology) seem illogical. It is also difficult to believe that the values of basically similar cargoes of raw materials and semi-finished goods would have fetched such different prices in two Russian ports just 500 kilometres apart (as the crow flies). It is true that there were certain differences in their product range. Thus, St. Petersburg was actually the only Russian port exporting iron, and iron typically represented, value-wise, almost 20 per cent of its exports. The list of the capital's exclusive export items also included luxuries like furs, caviar and silk, but their combined value seems to have been small compared with iron and other bulk goods. St. Petersburg also exported more hemp, hides and tallow than Riga, while the latter had a clear edge in forest products (balks, planks and masts). Moreover, Riga was an important exporter of grain, whereas grain exports from the capital were practically forbidden until the 1780s. Accordingly, the material differences of the exports can only explain a small proportion of the huge value gaps. 18
The data on shipping movements is based on primary sources that are generally regarded as reliable. Moreover, the units of this data – ships – are unambiguous physical objects that are fairly simple to account for – much simpler than values of exports, which require not only the reliable tallying of quantities but also a valid process of pricing. As long as we do not know how the Russian value statistics were compiled – or the illogical features pointed out above can be explained – they cannot be regarded significant enough to overrule the evidence presented by the Sound Toll records and port data of eighteenth-century statistical publications. Moreover, it must still be remembered that, when studying shipping (and even other transport), volumes are more fundamental variables than values.
Summing up, it seems remarkable that the new capital, which was, of course, favoured by the rulers and commanded, at least in theory, huge hinterlands, was not able to attract shipping at a faster rate. As can be seen, Tsar Peter's pipe dream was only coming true more than 60 years after his death. Therefore, there seems to be a good reason to ask whether there were any checks or constraints that handicapped the development of St. Petersburg as a major centre for foreign trade.
II
St. Petersburg's start with no existing mercantile infrastructure was not its only initial handicap. 19 The paradox of the city was that, while it was perfectly situated as a new bridgehead for the expanding Russian Empire, it was far from ideal as a port for long-trading vessels. The waters of the Neva delta were shallow and marred by moving sandbars; thus, the actual port (Kronstadt) had to be built far out, about 40 kilometres west of the city, on the island of Kotlin (Retusaari), and most cargoes had to be ferried between the city and the outport in small vessels, which substantially increased handling costs. 20 Moreover, while the Neva and Volkhov rivers offered good connections to the central regions of Novgorod, and even tolerable access to the lands of Pskov, the city's communications with the Muscovite heartlands, farther east, were difficult – moving great volumes of bulky goods between the Upper Volga and St. Petersburg presented something approximating a logistical nightmare. Yet the imperial government had to face this challenge every single year of the early decades of St. Petersburg. This was the direct consequence of an important military and administrative centre being built at the far end of a peripheric province that, at best, could just be self-sufficient in terms of food production. The agrarian population of Ingria in the early eighteenth century amounted to about 100,000. 21 As the population of the new capital was approaching 40,000 already by the end of the 1720s, 22 the local resources were totally inadequate for feeding such an influx of an urban population. In consequence, grain for the new city had to be imported from the other end of the Empire, from the black-earth areas around the Volga, the Oka and the Kama. 23 With a primitive transport infrastructure and long distances, this became a difficult and never-ending task. Indirectly, this logistical trap seems even to have hampered St. Petersburg's development as an export outlet.
Tsar Peter had been well aware of these provisioning problems. Before the actual founding of St. Petersburg, a new, over 1,400-kilometre-long riverine ‘grain route’ (following an age-old Viking itinerary) had been devised between the Upper Volga (Rybinsk) and St. Petersburg. 24 At the watershed by Vyshny Volochyok, a two-kilometre portage was cut by a canal (first opened in 1709, extensively altered after 1719 and reopened in 1722). Subsequently, the route was made safer by digging the Ladoga Canal (opened in 1731), thus bypassing Lake Ladoga's shallow southern waters, which could be risky for the flimsy grain barges. 25
This waterway also connected the Muscovite heartlands with the new capital. Being similar non-black-earth regions to the provinces of Pskov and Novgorod, they could also have benefited from the growing western demand for hemp and flax (which was already being exported via Archangel) but, in practice, the impact was small at first. This was simply because the Vyshny Volochyok Waterway was shallow and difficult to navigate. Large Volga grain barges could not go beyond Rybinsk and their cargo had to be reloaded into smaller, coarsely built, flat-bottomed vessels. The locks of Vyshny Volochyok set tight limits on their maximum size (some 35 metres long and 8 metres wide) and because of the shallow waters, they could only be loaded to a depth (draft) of 0.7 metres, implying an average cargo of 60–70 tons. In dry summers, the canal could not be passed at all, and goods had to be carried on land over the watershed. Even in normal summers, travelling was slow, in particular upstream, where vessels had to be drawn by teams of horses – seven to ten weeks from Rybinsk to Vyshny Volochyok was not uncommon. Downstream past the watershed, the going was much faster, but several steep rapids on the Msta River made it very dangerous. On the other hand, these were vessels on a one-way journey: as it was practically impossible to ascend the rapids of the Msta with such craft, most of them were sold for firewood at the end of the voyage. 26
The transport potential of this waterway was initially quite modest and its general importance was limited by the fact that a large proportion of the throughput was needed to secure an adequate supply of grain to the capital. The imperial government regarded this as such a high priority that the export of rye from St. Petersburg remained practically forbidden until the 1780s. 27 Carrying other goods on the waterway was not formally limited but preference was given to the most vital cargo.
Clear proof of export goods actually being carried from beyond the Valdai Hills to St. Petersburg can be found in Anton Friedrich Büsching's statistics for 1749 and 1764. Thus, substantial quantities of iron, all of which must have come from the Moscow area or Urals, 28 were shipped from Kronstadt in both years. ‘Siberian furs’ also present an example of goods arriving from even further afield and, although hemp may still have come mainly from the Novgorod province, it is possible that some was also carried from regions around the Upper Volga, or Tver, via Vyshny Volochyok. 29 Unfortunately, no transport statistics are available for the waterway before the mid 1760s.
Around the 1760s and 1770s, some 2,300–2,400 larger vessels (barka) paid tolls at Vyshny Volochyok, and 10 years later (1776–1786), the annual average had increased to over 2,800. In addition, there was a fair number of smaller boats. 30 Data for the cargo that these vessels carried can only be found for a few separate years, but it paints a graphic picture of the accumulation of freight on the waterway. Most of it originated, in fact, in ports along the Volga. A rather unique report for 1780 indicates that, between April and November of that year, a total of 1,328 vessels arrived at Rybinsk, carrying (the equivalent of) 70,000 metric tons of rye flour, 35,000 tons of iron, 30,000 tons of salt, 10,000 tons of wheat and oats, 850 tons of tallow and 950,000 litres (over 500 tons) of spirits – a total of about 146,000 tons. 31 Most of these goods were in transit to St. Petersburg and, accordingly, were reloaded into smaller craft. 32 In the very same year, 2,189 barges and boats left Rybinsk bound westwards. As they carried a total cargo of 163,800 tons (thus exceeding the unloaded volumes by 18,000 tons), it seems obvious that they had loaded some local produce, such as hemp. 33 A few years later, in 1786, another report specifies the origins of vessels arriving in Vyshny Volochyok. According to this report, 77 per cent came from Rybinsk, 17 per cent from Tver or ports below it, and 6 per cent from places upstream of Tver. 34 The grand total of vessels was, then, clearly higher than in 1780 (3,520 barges plus 470 smaller boats), but it can still be supposed that the growth of the caravan at different stages did not radically differ from the rhythm of 1786. Using these percentages, it can be estimated that the number of vessels leaving Rybinsk in 1780 (2,189) might have increased to almost 2,700 until Tver and exceeded 2,800 at the watershed. As the newcomers, on average, may have consisted of smaller craft than the typical grain barges, it seems realistic to suppose that the total freight did not exceed 200,000 tons at Vyshny Volochyok. Some additional cargo may have been loaded at the downstream ports of the Msta (which even sent floats of timber), thus further increasing the total freight arriving at Lake Ilmen.
None of the statistics from Vyshny Volochyok specify the different commodities carried by the vessels. Such data can only be found for the Ladoga Canal, but this, of course, also includes freight coming from Novgorod and the regions around Lake Ilmen and the rivers flowing into it. Thus, the total number of vessels substantially exceeded those at Vyshny Volochyok: for example, in around 1780, it was approaching 6,000 a year. However, the Ladoga Canal data presents certain interesting changes, which seem to reflect contemporary developments on the Vyshny Volochyok Waterway. Table 5 demonstrates these changes by presenting a selection of the most important commodities that were travelling towards the capital. They have been grouped into two categories: rye and wheat flours, oats and salt represent the provisions for feeding the people of St. Petersburg (and their horses), while flax, hemp, tallow and iron were destined to be exported abroad. The figures in this small sample tell a clear story: the volume of provisions grew only moderately, by about 10 per cent between 1763 and 1780–1781, while the volume of exports almost trebled in the same period. However, the percentage for provisions must be taken with some reservations: as grain transports fluctuated greatly (often in two-year cycles), the data for 1763 may represent a boom year and, in that case, the corresponding two-year average would be much lower – say about 85,000 tons. 35 Accordingly, the volume of provisions could have grown more than the face value that the 1763 figures suggest − however, by hardly more than a third. Even this is far below the 190 per cent (or a growth factor of 2.9) for exports.
Selected major commodities (1,000 metric tons) en route to St. Petersburg at the Ladoga Canal, 1763–1781.
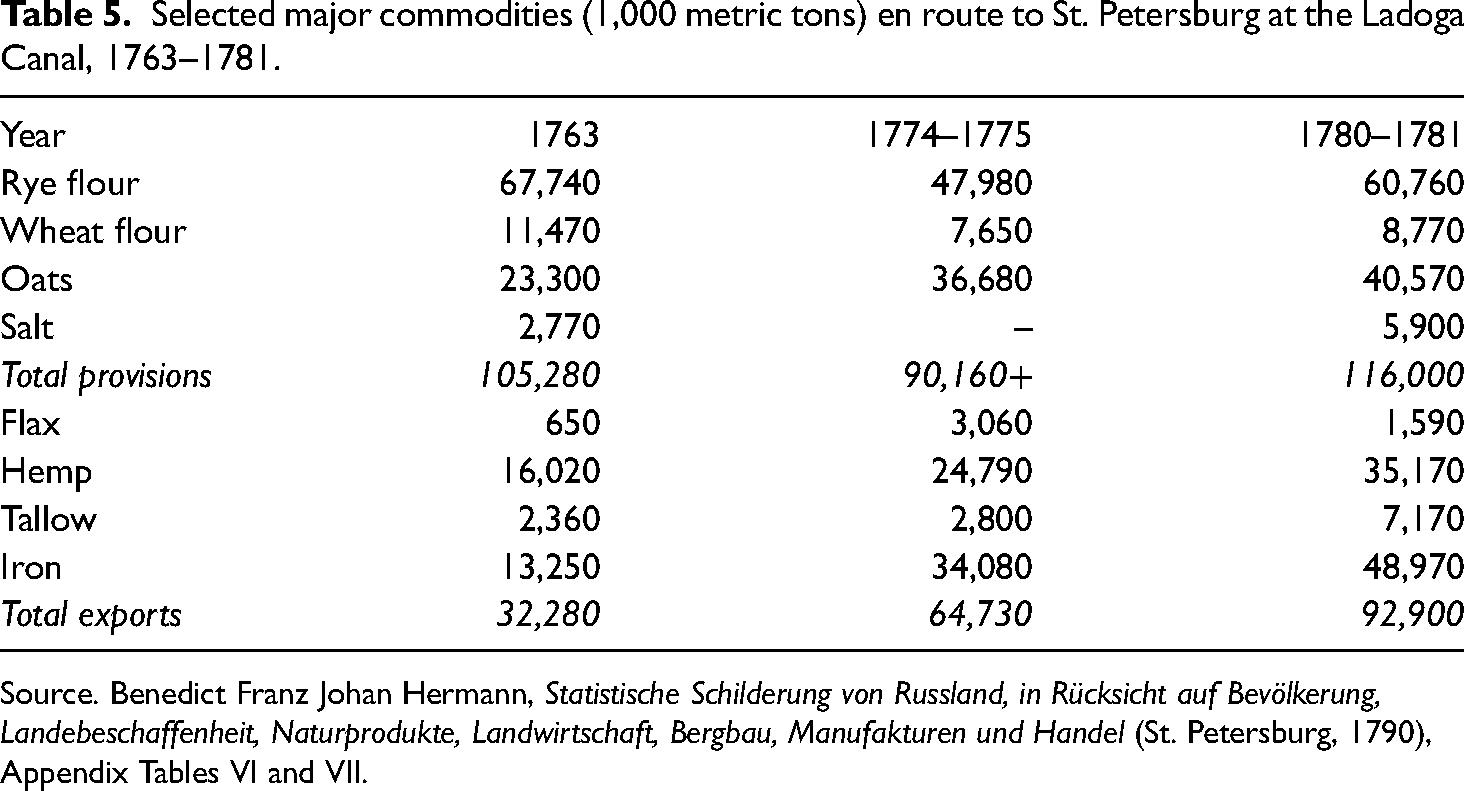
Source. Benedict Franz Johan Hermann, Statistische Schilderung von Russland, in Rücksicht auf Bevölkerung, Landebeschaffenheit, Naturprodukte, Landwirtschaft, Bergbau, Manufakturen und Handel (St. Petersburg, 1790), Appendix Tables VI and VII.
This small sample may not accurately represent the overall proportions of provisions versus exports but it is clear that there was quite a radical change across time. Around 1763, provisions represented 77 per cent of the total tonnage in the sample and, even according to the revised estimation (with a reduced quantity of cereals), they did not fall below 70 per cent. In the mid-1770s sample, the corresponding ratio has already decreased to 58 per cent and, five years later, further to 55.5%. While these ratios should not be taken too literally, they tell of a substantial structural change, which seems to have been particularly rapid in the late 1760s and/or early 1770s.
The most dramatic increase was seen in iron transports: between 1763 and 1780–1781, their volumes grew almost fourfold. Another big leap – trebling – was accounted for by tallow, while the volumes of flax and hemp ‘only’ presented growth factors of 2.4 and 2.2, respectively. In the case of iron, all the imports came via Rybinsk and the Vyshny Volochyok Waterway, while the province of Novgorod (and even Pskov) certainly contributed massively to the others. There are no sources that can reliably tell us how the respective commodity flows from these two directions developed but a reasonable hypothesis is that an increasing share was transported through the waterway from the other side of the Valdai Hills.
The fact that the Vyshny Volochyok Waterway was substantially improved in the late 1760s and 1770s supports this hypothesis. A fairly extensive programme to this effect, concerning both the old canal and the adjacent river routes, was presented to Catharine II in 1764, and work actually started during the following years. At the first stage, the passages of the rivers Tvertsa and Msta were made faster and safer to travel by leading more water to them and clearing the rapids of dangerous boulders; this was even done on the biggest rapids of the Volkhov River, which in many earlier years had been impassable in the late summer and early autumn. After 1773, the canal itself was also improved, albeit that the total reconstruction of the floodgates was postponed until the late 1780s. 36 The rapid jump in iron transports between 1763 and 1780 correlates remarkably well with the progress of the improvements. Even the increasing quantities of other exportable goods to the Ladoga Canal suggest that most of the gains from more efficient transportation were passed onto the export sector.
As no reasonable transport data exists for the earlier decades of the Vyshny Volochyok Waterway, only a few very general conclusions are possible. In the 1720s, and probably still in the following decade, the waterway from the Upper Volga did not function properly; according to Heinrich Friedrich von Storch, ‘long after the death of [Peter]’, the water in the canal was frequently so low in the summer that freight had to be unloaded downriver and carried overland to the Msta River. 37 In these years, the capital suffered from scant grain supplies to such a degree that cereals were occasionally brought in from abroad. From the 1730s onwards, however, the government seems to have been tolerably successful in meeting this logistical challenge, in spite of the demand growing with the population. That the demand for grain more than doubled from 1725 to 1750, and doubled again between 1750 and 1780, suggests that the transport throughput of the Vyshny Volochyok Waterway grew at a similar pace. 38
In addition to such geophysical factors, the development of the new waterway was initially handicapped by the lack of an earlier infrastructure. The successful transit of huge commodity flows required, in addition to basic economic networks, vast inputs of organized labour – boatbuilders, boatmen, pilots and different casual workers, plus provisions for them (in taverns or otherwise), as well as lots of horses and relay stations. Starting from scratch, it was several years before the system was working smoothly. In this respect, Riga enjoyed a head start with its well-established river transports and merchant networks.
Even when transports functioned well, the waterway was not a free-of-cost fairway. Of course, it was much more efficient and cheaper than road transport but, compared with water transport from the Lake Ilmen area, it was burdened by additional surcharges. The state normally covered the costs of grain transport but merchants trading with export goods had to pay not only canal tolls but also the substantial direct transport costs or freights that accumulated during a voyage of several months. Thus, it seems reasonable to conclude that as long as foreign demand in the port of St. Petersburg did not exceed the supply of, say, hemp, flax or tallow that the areas to the north and east of the Valdai Hills were able to produce, it was not feasible to carry them from farther afield. This, of course, did not apply to products such as iron, furs or caviar, which the shorter-range hinterland was not able to supply. However, until the 1750s, the export of iron remained fairly modest, and the port of the capital seems to have transshipped mainly products from the Novgorod lands. Even trade from the Pskov region seems to have been redirected to St. Petersburg. 39
Normally, the efficiency of transport routes can be gauged by looking at the direction of bigger commodity flows. The case of St. Petersburg, however, presents a special feature. Transport problems even affected imports, in spite of their much smaller physical volumes. As the Vyshny Volochyok Waterway was a one-way route, it was of no use in the distribution of imports. This means that such popular urban mass luxuries as wine and sugar, which were easy to procure in St. Petersburg (and normally delivered in large barrels), had to be carried to Moscow (and beyond) overland, thus making them scarce and much more expensive than in the port of discharge (that is, St. Petersburg). 40
III
Ports (as well as other terminals) are not final stations but intermediate posts for commodity flows. Accordingly, a port's success depends intrinsically on not only its foreign but also its domestic connections – connections with the hinterlands. The early development of the port of St. Petersburg presents an excellent example of this maxim, in particular emphasizing the latter element. In the eighteenth century, this is particularly evident since all practical traffic routes between coastal and interior regions, as far as heavy and bulky cargo was concerned, consisted of waterways, which only in exceptional circumstances were man-made or had been improved. Typically, they tended to have many natural hindrances and their winding courses were the antitheses of straight seaborne cargo routes.
It seems self-evident that transport geography and institutions could materially affect commodity flows. However, it should be remembered that they did not determine everything. Transport was not the prime mover: demand for transport only existed if there was a demand for the goods to be transported. Therefore, an important question must be posed: Did St. Petersburg or Riga benefit more from foreign demand than the other one? In the eighteenth century, West European, above all Dutch and British, shipping overshadowed local fleets in the Baltic Sea area. In the middle of the seventeenth century, half of the ships sailing through the Danish Sound were Dutch and, even after the Great Northern War in the 1730s, 1740s and 1750s, their share exceeded 40 per cent. British shipping was slowly increasing but, in the 1760s, still only accounted for some 20 per cent of all passages. It was only in the late 1770s that the number of British ships narrowly exceeded that of the Dutch. The Anglo-Dutch naval conflict of 1780–1784 was a real turning point: in the 1780s, the share of Dutch ships plummeted from 34 to 12 per cent while that of the British increased to about 30 per cent. Finally, Dutch-flagged ships practically vanished from the Sound after French troops occupied the Dutch Republic in 1795. 41
The relative decline of Dutch shipping was a logical consequence of the country's slow economic growth in the eighteenth century, and was reflected clearly in the demand for Russian products. 42 In contrast, British trade was boosted by accelerating economic growth and an increasing demand for raw materials and semi-finished products. However, the eclipse of Dutch shipping varied from port to port. In Riga, the Dutch managed to retain their dominant position for several decades after the Great Northern War and maintained a narrowing edge over the British until 1795. On the other hand, Riga also received a substantial amount of shipping (typically over 35 per cent) from various Baltic ports.
St. Petersburg was quite a different case. The first ship ever to arrive at the port (actually by mistake, as it was aiming for the Swedish port of Nyenskans) was the Dutch d’Juffrouw Anna. However, this episode did not predict the future – on the contrary, the British soon emerged in the lead position in the new capital. Obviously, Dutch merchants first regarded Archangel (which they dominated) as a safer alternative, while the British, who did not fare so well in the north, were happy to abandon Archangel for St. Petersburg. 43 This move proved advantageous, in particular after the conclusion of an Anglo-Russian commercial treaty in 1734, which granted British merchants a number of special benefits. 44 In the late 1740s, British ships accounted for over 40 per cent of all departures from Kronstadt; subsequently, the share increased to around 45 and 50 per cent and, finally, in the 1790s, to almost 60 per cent. Dutch shipping recorded much lower market shares: in the 1740s, it was still almost 20 per cent but, later, less than 10 per cent. Even the proportion of Baltic shipping declined from over 30 per cent to 20–25 per cent (Table 6). 45
Annual average of the number of ships departing from Riga and St. Petersburg to Great Britain and the Dutch Republic.
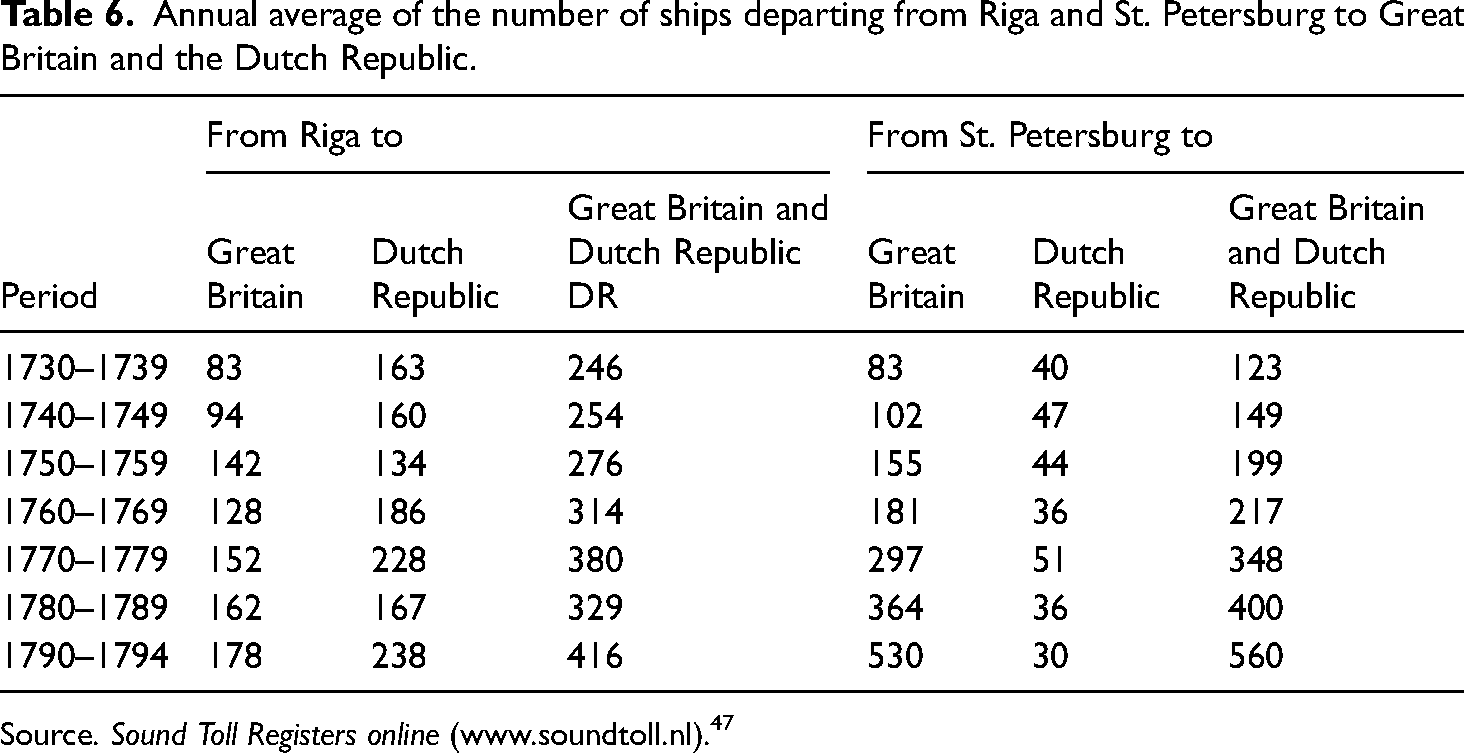
Source. Sound Toll Registers online (www.soundtoll.nl).47
In Table 6, a more detailed picture of the effective demand from the two biggest players is also presented by accounting for how many ships (irrespective of the nationality of their skippers) were carrying cargoes to Great Britain and the Dutch Republic, respectively. It can be seen that, even in Riga, western demand increased almost continuously – the only exception being the 1780s, a decade with two wars (the Anglo-Dutch naval conflict and the Russo-Swedish War) – but the growth rate was modest: 70 per cent overall or 0.9% per annum. In St. Petersburg, growth was much more impressive: 355 per cent overall or 2.6% per annum. Moreover, an overwhelming part of this growth was generated by the British trade alone, while, in Riga, it resulted more evenly from contributions by both competitors.
The widely different growth patterns in Riga and St. Petersburg raise an interesting question: If the British were able to increase their trade so rapidly in the latter, why did they not manage to do so in the former? One obvious explanation is that they did not enjoy similar advantages in Riga as they did in St. Petersburg. Two other explanations also seem feasible: either the Dutch domination in Riga was so entrenched that the newcomers could not find a margin for expansion or the hinterlands of Riga were not able to supply exportable goods at a better rate. In fact, the two latter explanations are not mutually exclusive: slow growth of production or resources often incurs tightening competition. Since no serious competition with the Dutch developed in St. Petersburg, it was reasonable to move there instead of fighting for a foothold in Riga.
It seems obvious that western demand catalysed the growth of exports more powerfully in St. Petersburg than in Riga. However, it is doubtful whether this effect was great enough to counteract the substantial supply-side problem – the inferior means of transportation from the hinterlands to the port. A closer look at departures from St. Petersburg reveals an interesting coincidence with waterways development. The fastest growth of export cargo to Britain was recorded from the 1760s to the 1770s – no less than 64 per cent or 5 per cent a year, on average. This was, in fact, the period when the new construction works on the Vyshny Volochyok Waterway were started and considerable improvements were already being achieved. It was also the period when the share, as well as volume, of export goods increased substantially in the Ladoga Canal. Thus, it seems that it was not just growing demand but also the factors of supply (interior transports) that made a major – maybe critical – contribution to the development of St. Petersburg's foreign shipping and trade.
Unavoidably, these conclusions are based on more or less circumstantial evidence. Nevertheless, the strong growth of exports from St. Petersburg to Britain continued (in spite of some slowing down during the wars of the 1780s), parallel with further improvements to the Vyshny Volochyok Waterway. However, in the 1790s, it became increasingly obvious that the old waterway was reaching the limits of its transport potential (some 4,000 vessels a year). In the 1770s, plans for new and deeper waterways had already been presented, but it was only in the last years of the eighteenth century that such ambitious works started. In 1809, the first new riverine route, the Mariinskii Canal and waterway, leading from Rybinsk to Lake Onega and down the Svir to Ladoga, was opened. Just two years later, another route, the Tikhvin Waterway, which offered a direct route to Lake Ladoga, was also completed. Both new routes were shorter than the old Vyshny Volochyok Waterway and, above all, deeper, allowing Volga vessels to travel all the way to the mouth of the Neva without unloading their cargo to smaller barges. 46 Following this, the port of St. Petersburg finally possessed satisfactory transport communications with its vast hinterlands (see Figure 3).
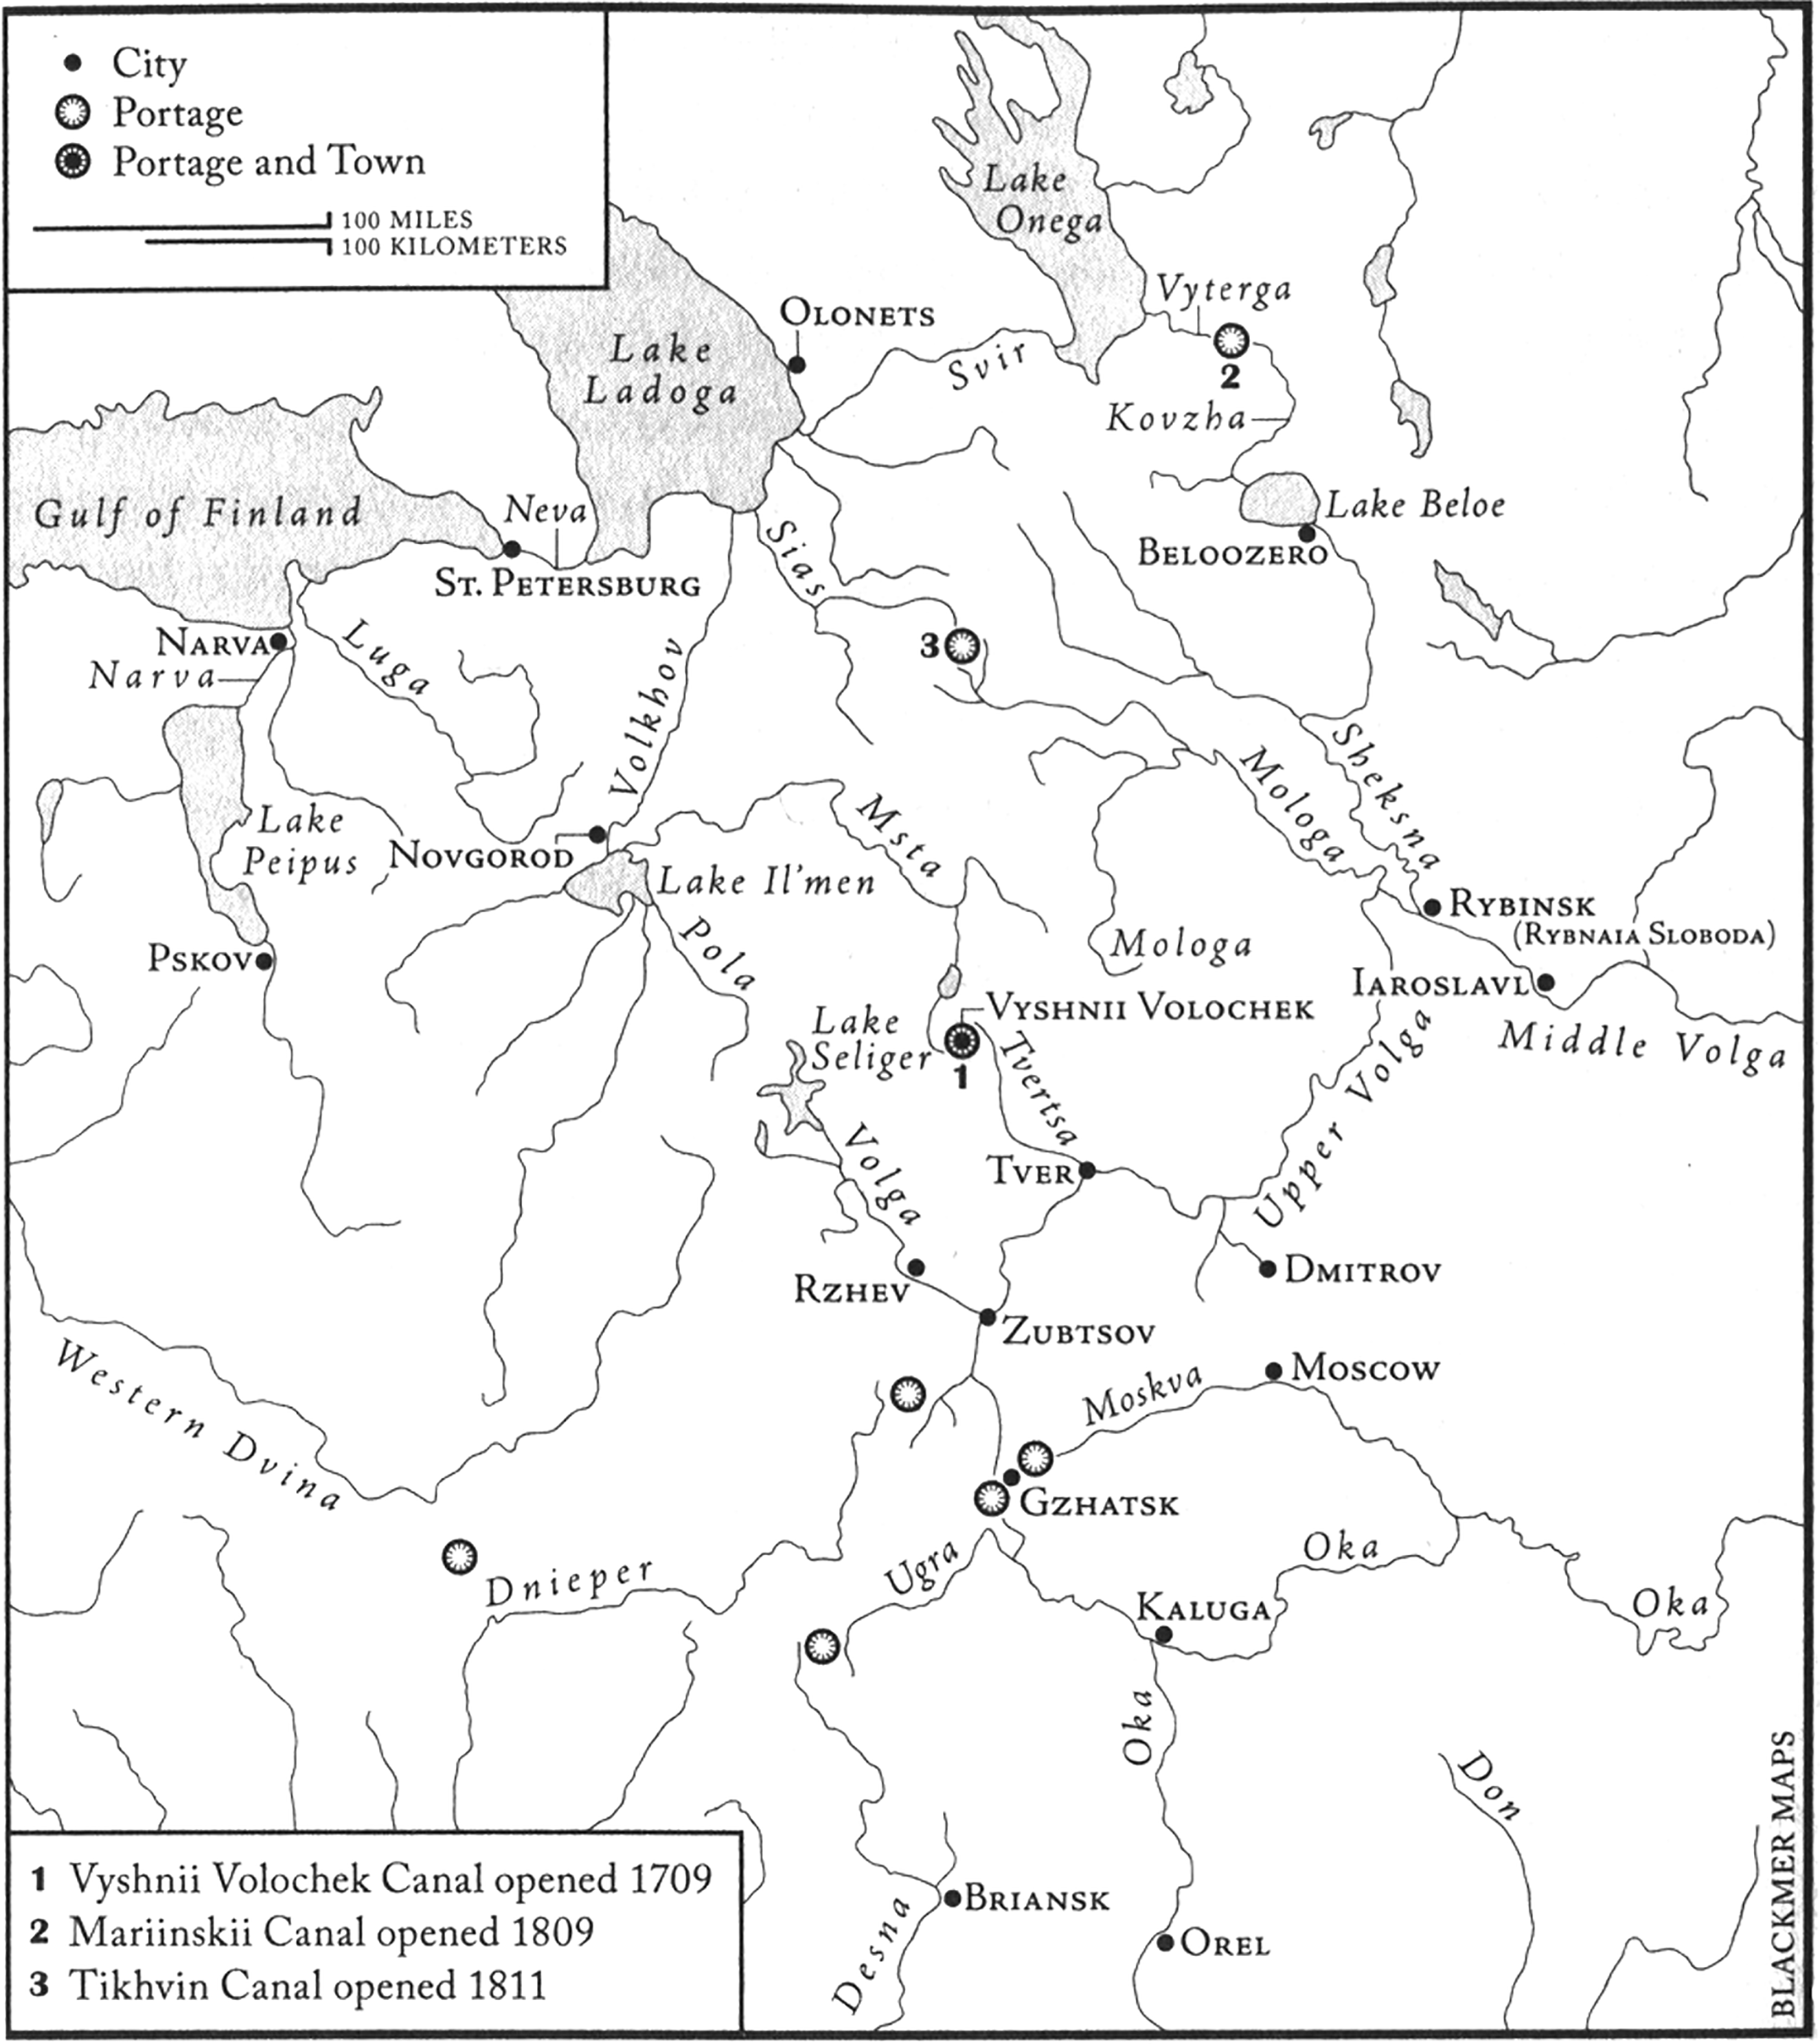
Waterways of north-western Russia.
Footnotes
Declaration of conflicting interests
The author(s) declared no potential conflicts of interest with respect to the research, authorship and/or publication of this article.
Funding
The author(s) received no financial support for the research, authorship and/or publication of this article.
Author biography
Yrjö Kaukiainen is Emeritus Professor of European History (previously of Economic history) at the University of Helsinki and a former President of the International Maritime Economic History Association. His research has focussed, in particular, on the history of shipping in the eighteenth, nineteenth and twentieth centuries, as well as the history of information transmission in the nineteenth century.