
Abstract
Postmenopausal shift workers face increased cardiometabolic risk due to estrogen decline and shift work–induced circadian misalignment. Yet, their combined effects remain poorly understood, especially in hypertensive individuals. This study investigated whether circadian misalignment worsens cardiometabolic parameters in a hypertensive ovariectomized rat model. Female spontaneously hypertensive rats (SHR) were ovariectomized or sham-operated (7-week-old), and then exposed to a chronic phase shift (CPS) protocol or a control light schedule for 10 weeks (n = 9 per group). Measurements included body mass, food and water intake, blood pressure (BP), fasting glucose, glucose tolerance, organ masses, and low-density lipoprotein (LDL) concentration. Ovariectomized rats were heavier and had greater food intake and organ masses than sham-operated rats. However, food intake and organ masses were reduced relative to body mass. CPS rats had greater water intake and reduced liver mass than control light rats. In addition, ovariectomized rats showed lower glucose concentration than sham-operated rats, whereas CPS rats showed higher glucose concentration than control light rats during the oral glucose tolerance test. Moreover, the CPS rats had higher systolic BP. The LDL and fasting glucose concentrations were similar. No interaction between ovariectomy and CPS was observed. These findings suggest that estrogen deficiency increases body mass, but does not worsen cardiometabolic parameters in female SHR. CPS-induced circadian misalignment altered water intake, liver mass, systolic BP and glucose tolerance in the CPS condition in female SHR. This study was unable to monitor physiological or behavioral indicators to confirm circadian misalignment by the CPS protocol. However, the findings provide novel insights into how CPSs independently impair cardiometabolic outcomes in female SHR, with implications for understanding risk in postmenopausal shift workers.
Keywords
Endogenous circadian rhythms, generated by the master circadian pacemaker in the suprachiasmatic nucleus (SCN) of the hypothalamus, ensure optimal alignment of behavioral cycles (i.e., sleep/wake, feeding/fasting, rest/activity, etc.) with internal physiological processes (digestion, glucose metabolism, blood pressure [BP] control, etc.) (Green et al., 2008; Silver and Rainbow, 2013; Meléndez-Fernández et al., 2023). Light exposure influences SCN activity, with varying effects depending on the timing of exposure, as represented by phase response curves (PRCs) (Rusak and Groos, 1982; Benloucif and Dubocovich, 1996; Vitaterna et al., 2001; Khalsa et al., 2003; Kripke et al., 2007; Youngstedt et al., 2019). Irregular light exposure such as that experienced by shift workers disrupts circadian rhythms, leading to misalignment of behavioral and physiological processes (Touitou et al., 2017; Chellappa et al., 2020; Price et al., 2022; Meléndez-Fernández et al., 2023).
Circadian misalignment is associated with negative cardiometabolic outcomes in both humans (Scheer et al., 2009; Morris et al., 2015; Dicom et al., 2023) and rodent models (Penev et al., 1998; Martino et al., 2007; Casiraghi et al., 2016; Zitting et al., 2022; Trebucq et al., 2023). Given that postmenopausal women and ovariectomized rodent models already exhibit heightened cardiometabolic susceptibility, it is plausible that circadian misalignment may further compound this risk (Rüger and Scheer, 2009). Recent evidence from murine models suggests sex-specific metabolic adaptations in response to circadian misalignment (In Het Panhuis et al., 2023; Ma et al., 2024). Moreover, estrogen deficiency and circadian misalignment may synergistically worsen cardiometabolic outcomes (Zhu et al., 2015; Anderson et al., 2023). Thus, sex hormones may differentially influence cardiometabolic responses under circadian misalignment.
Postmenopausal women are at an increased risk of developing cardiometabolic disorders (Zuo et al., 2009; Figueiredo Neto et al., 2010; de Marchi et al., 2017). In contrast, premenopausal women exhibit a protective advantage against cardiometabolic risk compared with age-matched men (Chikwati et al., 2023; Meloni et al., 2023). However, this advantage diminishes following menopause, leading to a risk profile equivalent to that of men (Zhernakova et al., 2022; Chikwati et al., 2023; Meloni et al., 2023). This shift coincides with the significant decline in estrogen levels during the menopausal transition (Cignarella et al., 2010; Roa-Díaz et al., 2021).
Estrogen deficiency due to ovariectomy (surgical menopause) has been linked with negative cardiometabolic outcomes in both human studies (Colditz et al., 1987; Dørum et al., 2008; Dam et al., 2019) and rodent models, including normotensive (Van Lenten et al., 1983; McElroy and Wade, 1987; Fahmy et al., 2018) and hypertensive rats (Hinojosa-Laborde et al., 2000; Santos et al., 2004; da Silva et al., 2009). Estrogen loss has also been implicated in the onset of hypertension, further exacerbating cardiometabolic risk (Staessen et al., 1989; Zanchetti et al., 2005; Lima et al., 2012). Thus, the association between estrogen loss and heightened cardiometabolic risk underscores postmenopausal women’s susceptibility to developing cardiometabolic disorders.
The impact of this interaction between sex hormones, circadian misalignment, and cardiometabolic processes, especially in the context of hypertension, remains unclear. This highlights the necessity to understand the potential interactions between circadian misalignment and estrogen loss. This study aimed to address this gap by investigating whether circadian misalignment worsens estrogen deficiency–induced cardiometabolic outcomes. We used ovariectomized female spontaneously hypertensive rats (SHR), a rodent model of human essential hypertension (Kren et al., 1997; Pravenec et al., 2014; Jama et al., 2022), in combination with a chronic phase shift (CPS) protocol similar to that used by Tran et al. (2021).
Materials and Methods
Experimental Design
All experimental procedures were approved by the Animal Research Ethics Committee of the University of the Witwatersrand (Approval reference: 2017/11/76/C) and were conducted according to the National Institutes of Health Guide for the care and use of laboratory animals. We also used the ARRIVE checklist when writing our report (Percie du Sert et al., 2020). Five-week-old female SHR (n = 36) were obtained from the Wits Research Animal Facility in batches at 6 separate occasions and acclimated to the laboratory environment for 2 weeks. To minimize batch effects, each cohort included animals from all intervention groups (i.e., surgery and lighting schedule changes) conducted under consistent environmental and procedural conditions. The rats were housed individually in clear plastic cages under controlled conditions of constant temperature (26 ± 2 °C) and relative humidity (28 ± 7%), with a 12:12 light-dark cycle. Sawdust and shredded filter paper were used as bedding, and colored play balls were provided as environmental enrichment.
Environmental conditions were monitored and recorded using a data logger (HOBO MX1104 Analog/Temp/RH/Light; Onset Computer Corporation, Bourne, MA, USA). The rats’ general health was monitored twice weekly using the rat grimace scale. The assessment included indicators such as fur condition, body posture, orbital tightening, nose/cheek flattening, ear changes, and whisker changes. All pre-euthanasia procedures, such as body mass, BP and glucose measurements, were conducted in the animal facility where the rats were housed. The rats were briefly removed from their cages as needed. Post-euthanasia procedures were conducted in a dedicated laboratory.
At 7 weeks old, rats were randomly assigned to undergo either bilateral ovariectomy (ovx, n = 18) or a sham operation (sham-operated, n = 18), as previously described (Maluleke et al., 2022). Briefly, the rats were anesthetized by intraperitoneal injections of 100 mg/kg ketamine and 5 mg/kg xylazine cocktail, in addition to 100 mg/kg meloxicam, followed by inhaled isoflurane maintenance (2%-4%) (0900-1200 h). The ovaries, arteries, and fallopian tubes were ligated, and then ovaries were excised. The sham operation involved the same procedure without removing the ovaries. Postoperative care included meloxicam and atipamezole (100 mg/kg each), as well as daily health monitoring, with particular attention to the wound site.
Following recovery, rats were acclimated to weekly procedures and the 12:12 light-dark (0700-1900 h light and 1900-0700 h dark) control light schedule for 3 weeks, as previously described (Martino et al., 2007). The light intensity was maintained at approximately 200 lux during the light phase (day-time) and 0 lux during the dark phase (night-time). At 12 weeks old, rats were randomly assigned to remain on the control light schedule (ovx, n = 9 and sham-operated, n = 9) or exposed to the CPS protocol (ovx, n = 9 and sham-operated, n = 9). The random allocation was done in a non-systematic manner to ensure unbiased distribution across groups. The sample size has been justified in most ovariectomized SHR studies, utilizing 4 to 10 rats per group (da Silva et al., 2017; Pereira et al., 2022; Pizzato et al., 2023; Wang and Yu, 2023; Neves et al., 2024).
The CPS protocol involved a weekly reversal of the 12:12 light-dark cycle, as previously described (Tran et al., 2021)—the CPS protocol: 0700-1900 h light and 1900-0700 h dark schedule during the odd-numbered weeks and the opposite 0700-1900 h dark and 1900-0700 h light schedule during even-numbered weeks. The light-dark cycle shifts in CPS protocol occurred on the first day of every week (Mondays); thus, there were 24 h of light or darkness on the day of the light-dark cycle reversal. During the dark phase, measurements were conducted under dim, indirect lighting to allow visibility while minimizing unintended circadian disruption.
The investigators were aware of the group allocations throughout the study period prior to euthanasia. However, from the point of anesthetizing the rats through to the post-euthanasia assays, the investigators were blinded to group allocations. This blinding was maintained throughout the outcome assessment and data analysis to reduce potential bias. Figure 1 illustrates the light intensity data obtained weekly in both the control light and CPS protocol schedules. All the rats were euthanized after 10 weeks of the 12:12 light-dark cycle intervention.
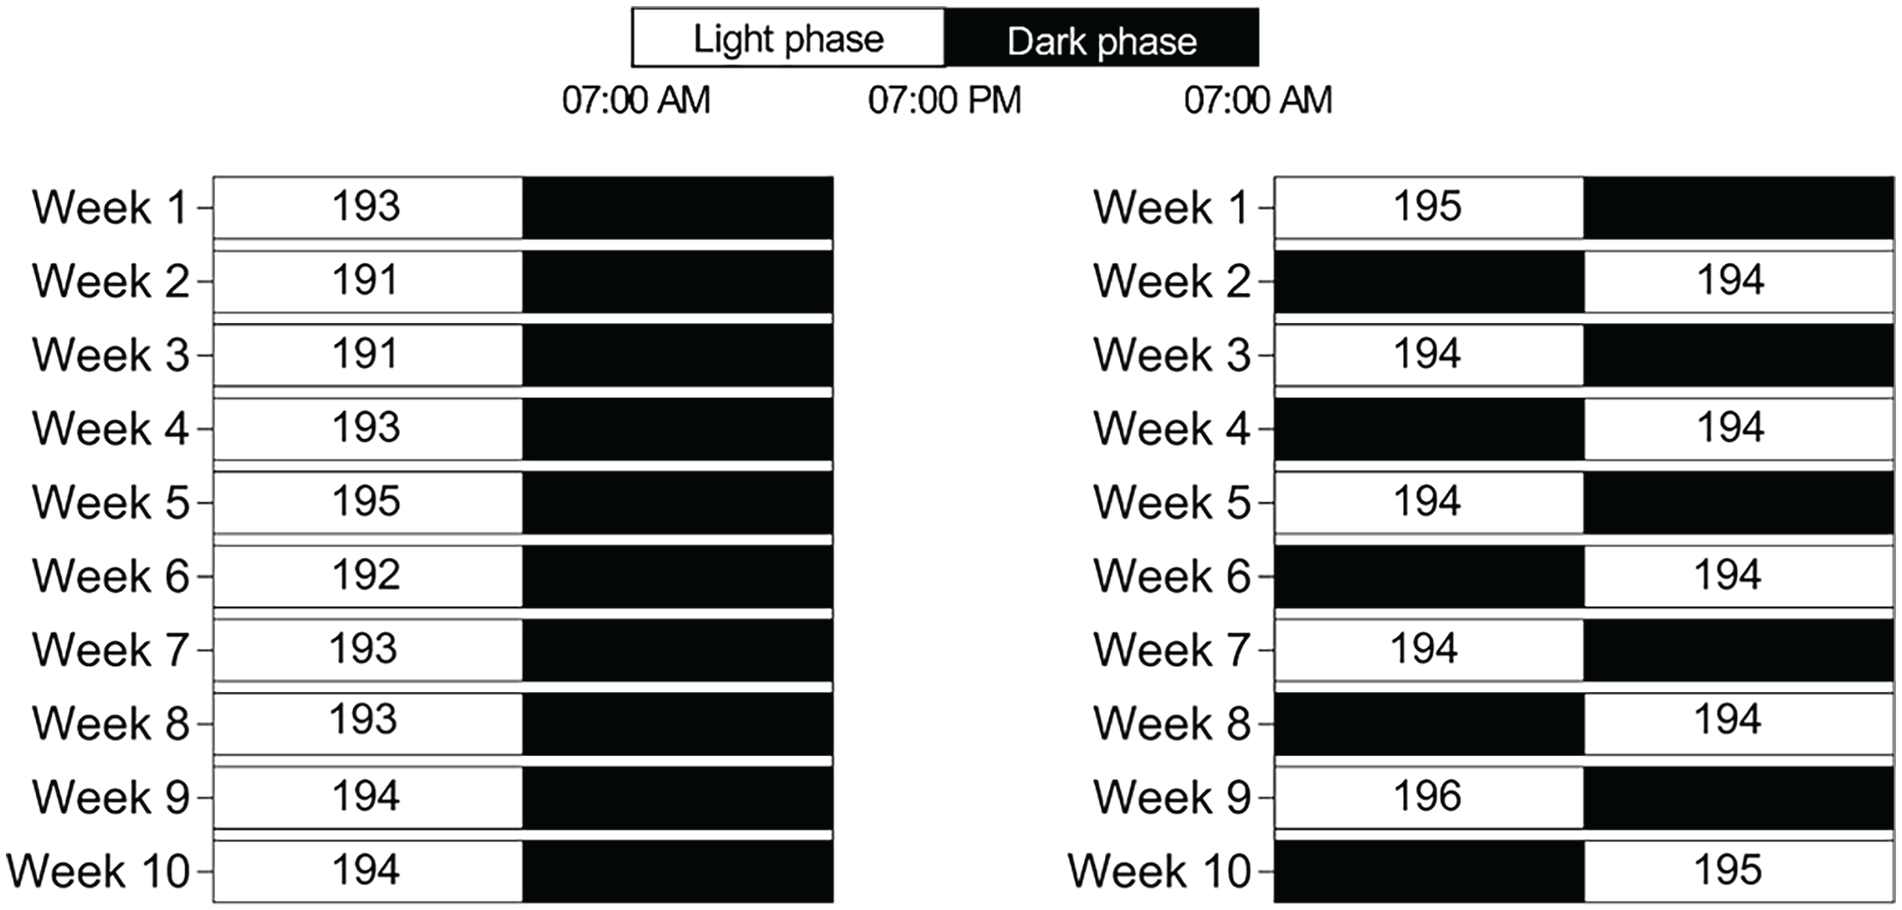
The 10-week light-dark intervention study design. The rats were assigned to either the control light (left) or the CPS (right) schedules. The control light-exposed rats were maintained on a 12:12 light-dark cycle with lights-on at 0700 h and lights-off at 1900 h every day. In contrast, the CPS-exposed rats were maintained on a 12:12 light-dark cycle reversed every Mondays weekly (lights-on at 0700 h and lights-off at 1900 h during odd-numbered weeks; lights-on at 1900 h and lights-off at 0700 h during the even-numbered weeks). The white and black bars indicate the duration of periods of light (light phase) and darkness (dark phase), respectively. Light exposure data recorded by the HOBO are represented as a heat map and expressed as mean light intensity (in lux) in the white bars, with the light phase ~200 lux and dark phase = 0 lux in the black bars. CPS = chronic phase shift.
Body Mass, Food, and Water Intake
Body mass, food, and water intake were measured weekly (1000-1200 h Monday, a week after the shift in the light-dark cycle) using a digital scale (LBK6 weighing scale, Adam Equipment S.A. (Pty), Johannesburg, South Africa). The rats had ad libitum access to standard rat chow and plain drinking water throughout the study duration regardless of the appointed light schedule. Specifically, every Monday, food and water supplies were restocked in excess for the following week. This prevented circadian food entrainment caused by daily feeding. To calculate food and water intake weekly the following formula was used: Intake (per week) = initial amount–remaining amount. Food and water spillage within the cage were not measured; thus, intake values may slightly overestimate actual consumption. To account for differences in body mass, the following formula was used: Relative to body mass value = (measured value (g)/body mass (g)) × 100.
Noninvasive BP Measurements
BP was measured once weekly for each rat on a specific day between Tuesday and Thursday (1000-1200 h) using a noninvasive tail-cuff technique that utilizes the NIBP250 BP monitor system (Biopac Systems Inc., Goleta, CA, USA), as previously described (Mogane et al., 2019; Maluleke et al., 2022; Mkhize et al., 2025). Briefly, a conscious rat was restrained and placed on an electric heating pad (Almohadilla Super Plus 13133, San-UP S.A, San Martín, Argentina) to maintain a temperature of ~32 °C. When the rat was relaxed and inactive, systolic and diastolic BP readings were recorded with a 200 mm Hg cuff pressure.
Fasting Blood Glucose Concentration and Oral Glucose Tolerance Test
Weekly Fasting Blood Glucose Measurements
Rats were fasted overnight with free access to plain drinking water. Blood glucose concentration was measured weekly (1000-1200 h Friday) using a calibrated glucose meter (Contour plus, Bayer (Pty) Ltd, Isando-Johannesburg, South Africa) after a tail prick with a 25G × 15 mm needle (Axiology Labs (Pty) Ltd, Meyerton, Vereeniging, South Africa).
Oral Glucose Tolerance Test
Three days before euthanasia, rats were fasted again overnight with free access to plain drinking water. After measuring baseline (0 min) fasting glucose concentration, rats were gavaged with glucose solution (D-(+)-Glucose, Merck Chemicals (Pty) Ltd, Johannesburg, South Africa) at a dose of 2 g/kg body mass. Then, blood glucose concentration was measured at 15, 30, 60, 120, and 180 min post-gavage as described above for the weekly glucose measurements.
Organ and Blood Sampling
At euthanasia, blood samples were collected via cardiac puncture under anesthesia (1000-1300 h), which euthanized the rats by cardiac puncture–induced exsanguination (blood loss). The organs were harvested (heart, left ventricle [LV], left kidney, and liver). Blood was centrifuged (3000 rpm for 10 min), and then sera were collected and stored in a –80 °C freezer.
LDL Concentration Measurement
Rat sera were centrifuged (1000×g at 2-8 °C for 15 min) after reaching room temperature (18-25 °C). LDL concentration was measured using a Rat LDL Enzyme-Linked Immunosorbent Assay (ELISA) kit (Elabscience Biotechnology Inc., Houston, TX, USA) following the manufacturer’s instructions. The kit had a sensitivity of 0.10 μg/mL, a detection range of 0.16-10 μg/mL, and <10% repeatability coefficient of variation.
Statistical Analysis
Statistical analyses were performed using GraphPad Prism version 10.2 for Windows (GraphPad Software Inc., San Diego, CA, USA) and SAS software version 9.4 (SAS Institute Inc., Cary, NC, USA). All continuous variables were assessed for normality using QQ plots in GraphPad Prism, and all met the criteria for normal distribution. Data are presented as mean ± SD.
For variables collected over time (weekly body mass, food, water intake, systolic BP, diastolic BP, fasting blood glucose, and the oral glucose tolerance test [OGTT] at the end of the light intervention), we performed a mixed-model analysis (REML) with a random intercept, assuming a linear effect of time for the weekly variables and a categorical effect of time for OGTT, with fixed effects being estrogen status (ovariectomized vs sham-operated; sham-operated being set as the reference group) and light schedule status (CPS vs Ctr light, Ctr light being set as the reference group). For single time-point variables (organ masses and LDL concentration), a 2-way analysis of variance (ANOVA) was performed, with the main effects of estrogen status and light schedule status. Statistical significance was set at p < 0.05.
Results
The Characteristics of Ovariectomized (Ovx) and Sham-operated SHR Under CPS or Control Light Schedules
Figure 2 illustrates changes in weekly body mass. All groups exhibited increased body mass over time (β = 6.012, p < 0.0001). Ovx rats had higher body mass than sham-operated rats (β = 41.99, p < 0.0001). No interaction between time and intervention group, or estrogen status and light schedule status was observed.
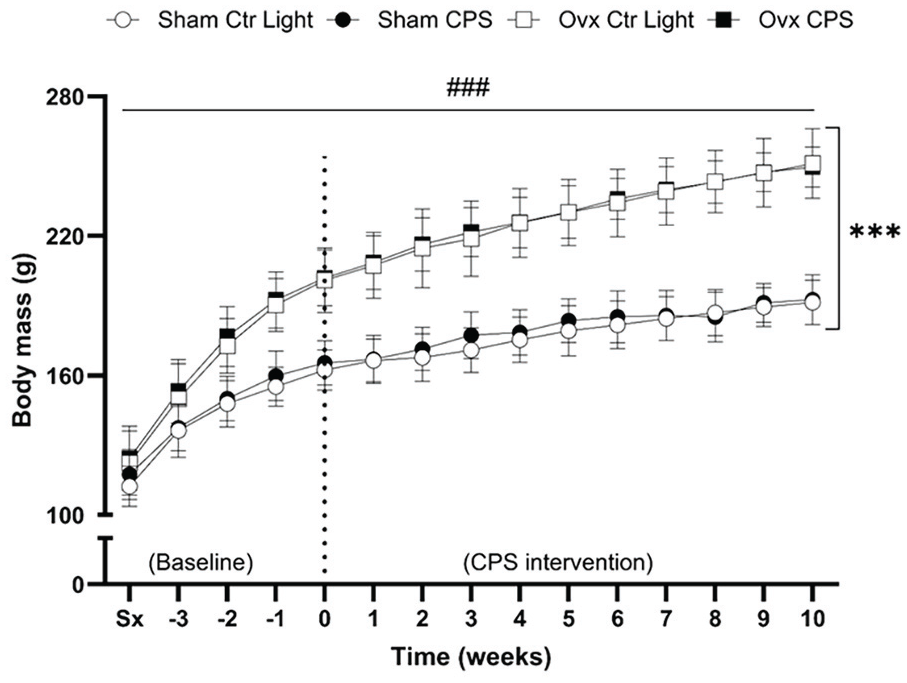
Changes in weekly body mass in female SHR. Body mass measurements were taken weekly, starting from the week of surgery (Sx) and continuing through the 10-week light-dark intervention period (week 0-10). The dotted line at week 0 separates the pre-intervention period (baseline) from the 10-week light-dark intervention period. A significant increase in body mass was observed in all groups over time (β = 6.012, p < 0.0001). There was a significant effect of estrogen status on body mass, but not of light schedule status. Ovx rats had higher body mass than sham-operated rats (β = 41.99, p < 0.0001), and no interaction between time and intervention group, or estrogen status and light schedule status was observed. Data expressed as mean ± SD, n = 9 per group. SHR = spontaneously hypertensive rat; Ctr Light = control light; CPS = chronic phase shift; Ovx = ovariectomy; Sx = pre-surgery body mass.
Figure 3a illustrates changes in weekly food intake. All groups exhibited a decrease in food consumption over time (β = –0.240, p < 0.0001). Ovx rats consumed more food than sham-operated rats (β = 1.150, p < 0.0001). Relative to body mass shown in Figure 3b, all groups exhibited a decrease in food consumption over time (β = –0.397, p < 0.0001). Ovx rats consumed less food than sham-operated rats (β = –0.769, p < 0.0001). No significant interaction between time and intervention group, or estrogen status and light schedule status was observed for absolute food intake or food intake relative to body mass.
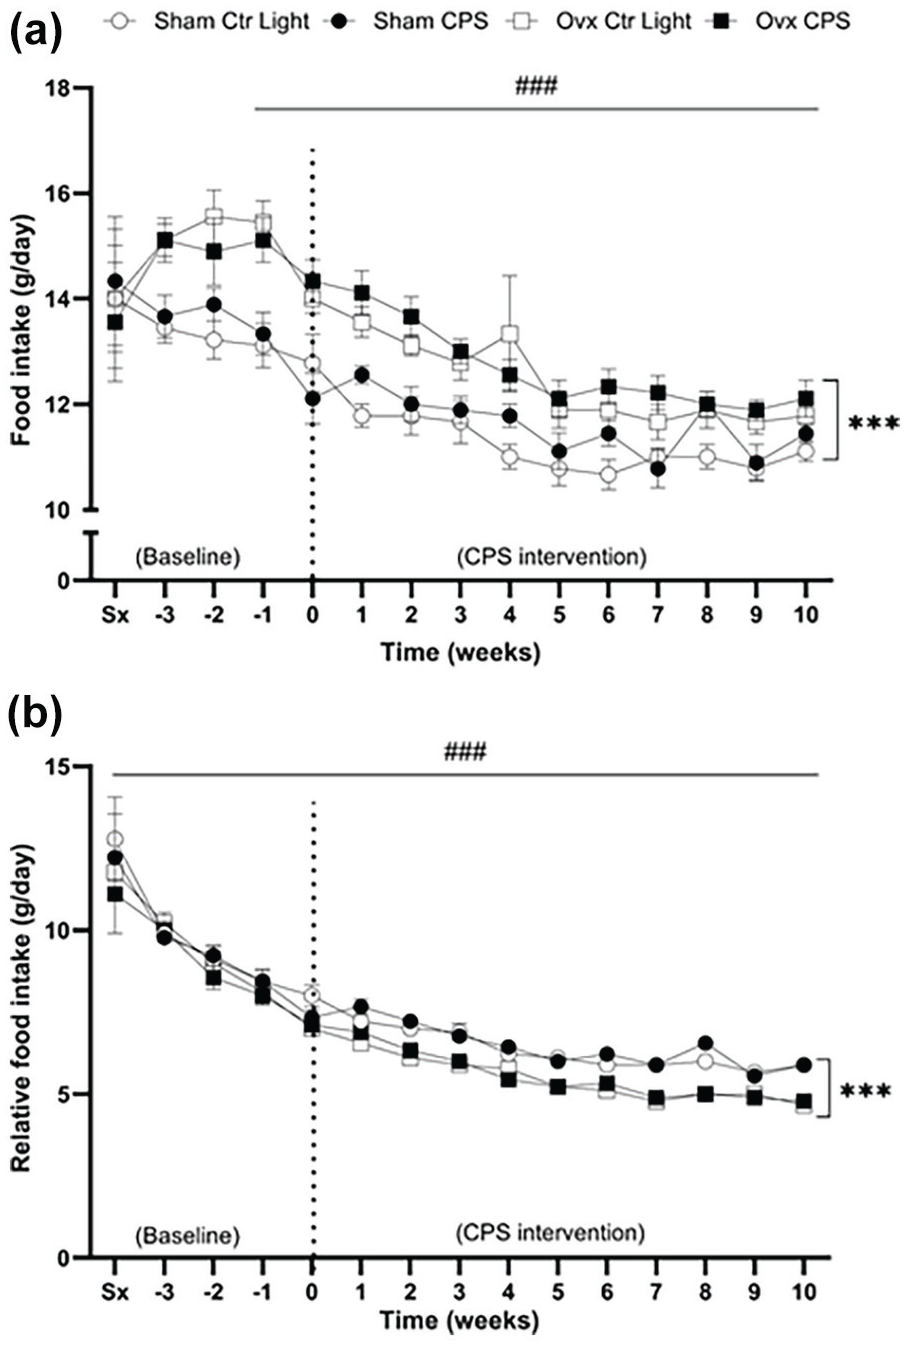
Changes in weekly (a) food intake and (b) relative (to body mass) food intake in female SHR. Food intake was measured weekly from the week of surgery (Sx) and continuing through the 10-week light-dark intervention period (week 0-10). The dotted line at week 0 separates the pre-intervention period (baseline) from the 10-week light-dark intervention period. Both food intake (β = –0.240, p < 0.0001) and relative food intake (β = –0.397, p < 0.0001) significantly decreased in all groups over time. Ovariectomized rats had an increased food intake compared with sham-operated rats (β = 1.150, p < 0.0001). However, relative to body mass, ovariectomized rats had decreased food intake compared with sham-operated rats (β = –0.769, p < 0.0001). No significant interaction between time and intervention group, or estrogen status and light schedule status was observed for absolute food intake or food intake relative to body mass. Data expressed as mean ± SD, n = 9 per group. SHR = spontaneously hypertensive rat; Ctr Light = control light; CPS = chronic phase shift; Ovx = ovariectomy; Sx = pre-surgery food intake.
Figure 4a illustrates changes in weekly water intake. No significant effect of time or light schedule status was observed. However, ovx rats exhibited an increased water intake than sham-operated rats (β = 3.41, p = 0.027). While no significant interaction between time and estrogen status, or estrogen status and light schedule status was found, a significant interaction between time (as a linear effect) and light schedule status was observed (β = 0.34, p = 0.017). This indicates that there is a progressive increase in water intake over time in CPS rats than in control light rats.
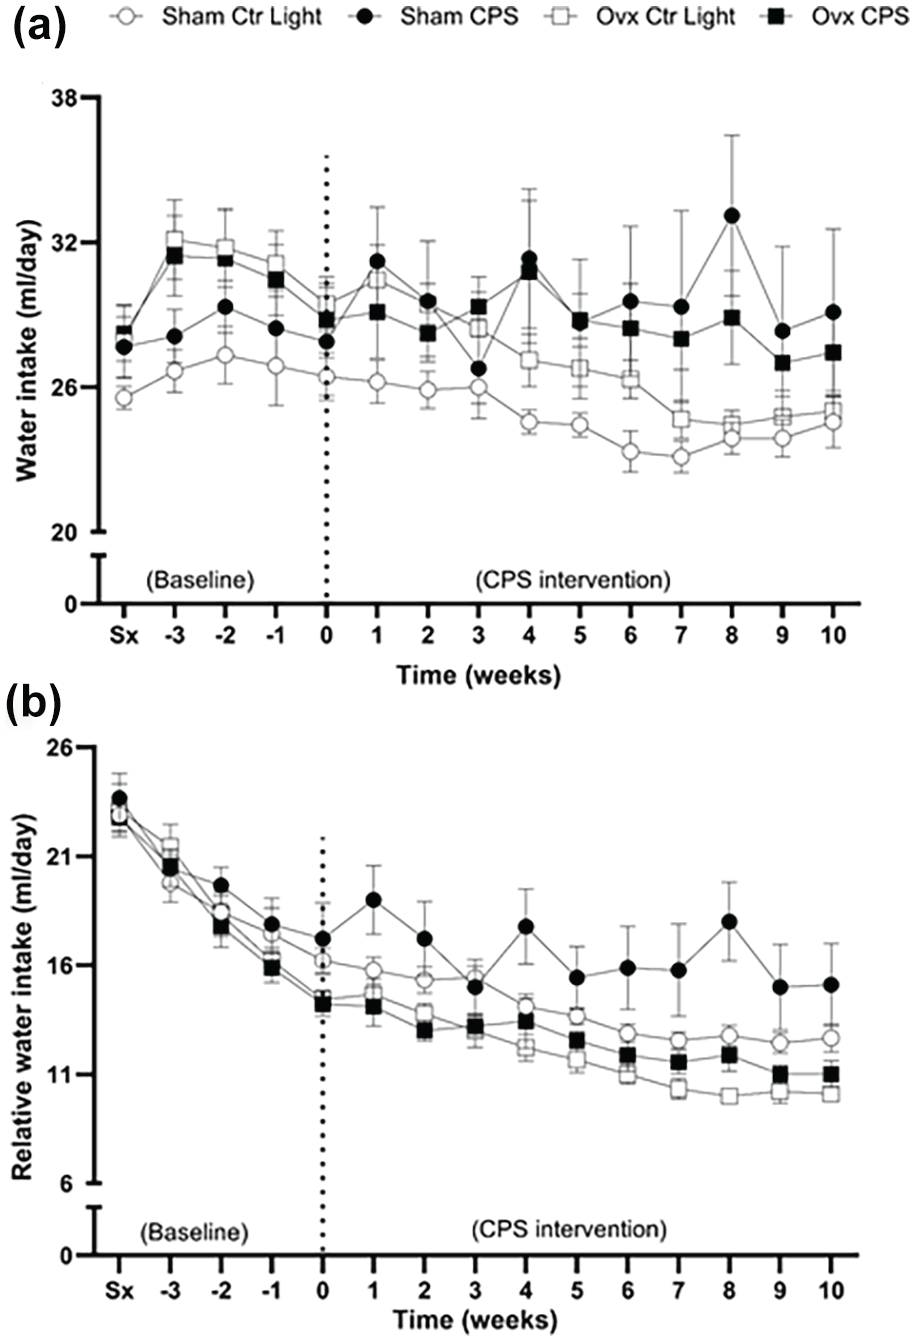
Changes in weekly (a) water intake and (b) relative (to body mass) water intake in female SHR. Water intake was measured weekly from the week of surgery (Sx) and continued through the 10-week light-dark intervention period (week 0-10). The dotted line at week 0 separates the pre-intervention period (baseline) from the 10-week CPS intervention period. No significant effect of time or light schedule observed. All groups show a decrease in water intake over time (β = –0.619, p < 0.0001). However, there is a Time × Light schedule status interaction, for both absolute (β = 0.34, p = 0.017) and relative water intake (β = 0.180, p = 0.011), indicating a progressive rise in water intake over time in CPS rats than control light rats. The ovx rats exhibited an increased water intake than sham-operated rats (β = 3.41, p = 0.027). However, there is a Time × Estrogen status interaction, indicating that the ovx rats exhibit a steeper decline in water intake over time than sham-operated rats (β = –0.242, p = 0.001. Data expressed as mean ± SD, n = 9 per group. SHR = spontaneously hypertensive rat; Ctr Light = control light; CPS = chronic phase shift; Ovx = ovariectomy, Sx = pre-surgery water intake.
All groups exhibited a decrease in water intake relative to body mass over time (β = –0.619, p < 0.0001), as shown in Figure 4b. A significant interaction between time and estrogen status was observed, with ovx rats exhibiting a steeper decline in water intake over time than sham-operated rats (β = –0.242, p = 0.001). Furthermore, there was a significant interaction between time and light schedule status (β = 0.180, p = 0.011), indicating a progressive increase in water intake over time in the CPS rats than in control light rats.
All groups exhibited an increase in weekly systolic BP over time (β = 0.433, p < 0.0001), as shown in Figure 5a. The CPS rats had higher systolic BP than the control light rats (β = 0.688, p = 0.012), irrespective of time and estrogen status. No significant effect of estrogen status was observed. Weekly diastolic BP measurements (Figure 5b) and fasting blood glucose concentration (Figure 6a) were similar across all groups. There was no significant interaction between time and intervention group, or estrogen status and light schedule status for systolic BP or diastolic BP.
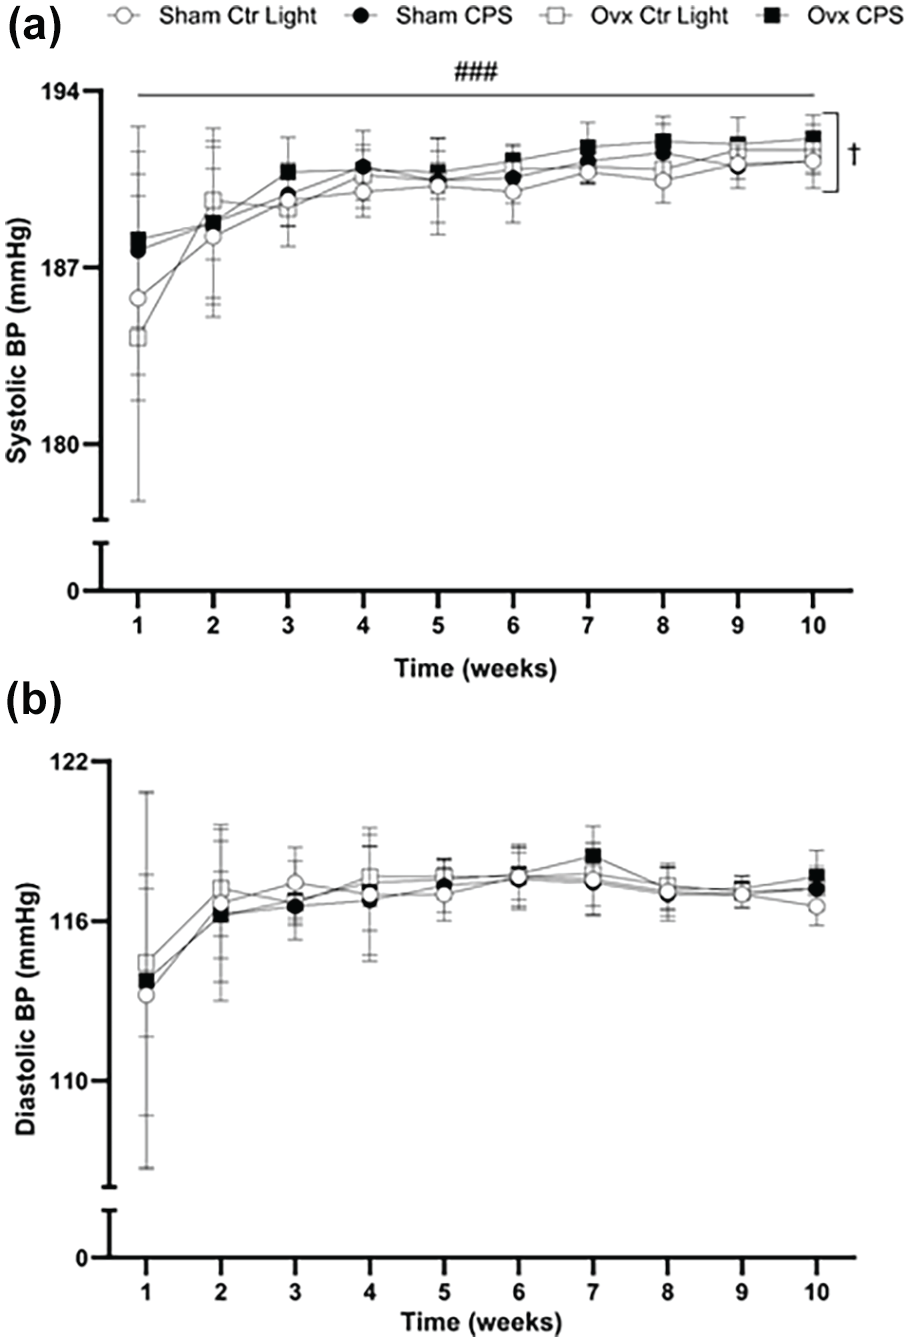
Changes in weekly (a) systolic and (b) diastolic BP in female SHR during the 10-week light-dark intervention. The BP was measured noninvasively using an NIBP250 monitor system. All groups show an increase in weekly systolic BP over time (β = 0.433, p < 0.0001), with CPS rats showing higher systolic BP than the control light rats (β = 0.688, p = 0.012). The diastolic BP remained similar across all groups, with no significant interaction of time and intervention group, or estrogen status and light schedule status. Data expressed as mean ± SD, n = 9 per group. BP = blood pressure; SHR = spontaneously hypertensive rat; CPS = chronic phase shift; Ctr Light = control light; Ovx = ovariectomy.
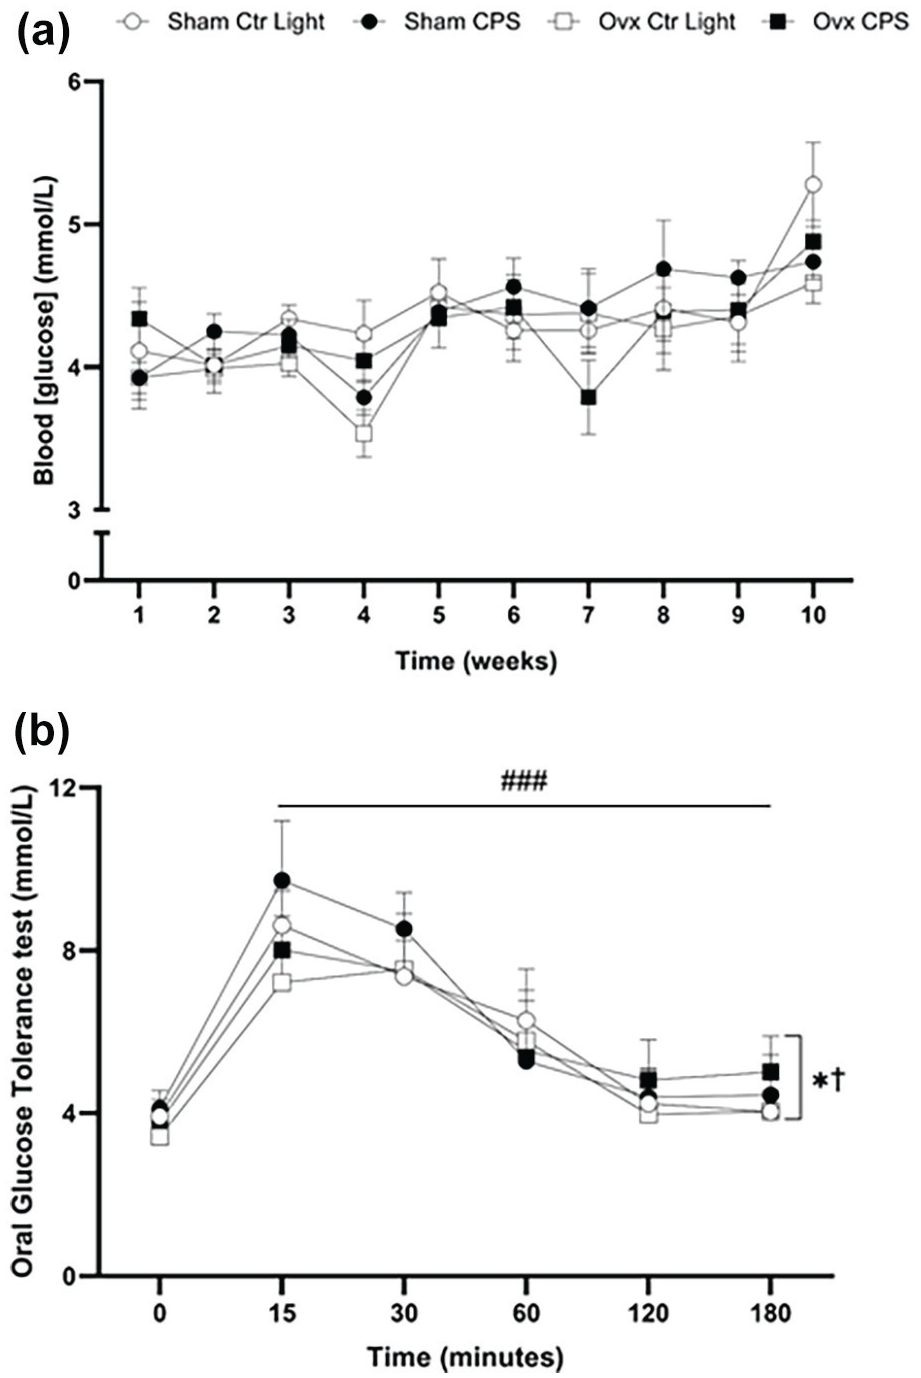
Changes in (a) weekly fasting blood glucose concentrations and (b) 3-h oral OGTT results in female SHR. The fasting blood glucose concentration was measured weekly during the 10-week light-dark intervention. The 3-h OGTT was performed 3 days before the end of the 10-week light-dark intervention. No significant differences were observed in fasting blood glucose between all the groups. OGTT: A significant effect of time (entered as a categorical variable) was observed (p < 0.0001). Glucose peaked at 15-30 min post-administration and gradually returned to baseline levels by 120-180 min. Ovx rats had lower glucose concentration than sham-operated rats irrespective of time or light schedule status (β = –0.360, p = 0.049). CPS rats had higher glucose concentration than control light rats irrespective of time or estrogen status (β = 0.394, p = 0.032). There was no significant interaction between time and intervention group, or estrogen status and light schedule status. Data expressed as mean ± SD, n = 9 per group. OGTT = oral glucose tolerance test; SHR = spontaneously hypertensive rat; CPS = chronic phase shift; Ctr Light = control lighting; Ovx = ovariectomy.
During the OGTT (Figure 6b), a significant effect of time (entered as a categorical variable) was observed (p < 0.0001). Glucose levels peaked at 15-30 min post-administration (all post hoc tests with Tukey adjustment comparing 15- and 30-min glucose with the other time points (0, 60, 120, and 180) showing higher glucose at 15 and 30 min; with all adjusted p values < 0.0001) and gradually returned to baseline by 120-180 min. Ovx rats exhibited lower glucose concentration than sham-operated rats (fixed effect of estrogen status; β = –0.360, p = 0.049), when controlling for time and light schedule status. CPS rats had higher glucose concentration than control light rats (fixed effect of light schedule status; β = 0.394, p = 0.032), when controlling for time and light schedule status. There was no significant interaction between time and intervention group, or between estrogen status and light schedule status.
Table 1 also presents post-euthanasia characteristics. Ovx rats had larger absolute heart (p = 0.0006), LV (p < 0.0001), kidney (p = 0.016), and liver (p < 0.0001) masses than sham-operated rats. Ovx rats had smaller heart (p < 0.0001), LV (p < 0.0001), kidney (p = 0.001), and liver (p < 0.0001) masses than sham-operated rats relative to body mass. In addition, CPS rats exhibited smaller liver mass than control light rats, both in absolute (p = 0.031) and relative mass (p = 0.012). LDL concentrations were similar across all groups, and no significant interaction was observed between estrogen status and light schedule status for any of these parameters.
Characteristics of ovx and sham-operated female SHR after 10-week light-dark intervention.
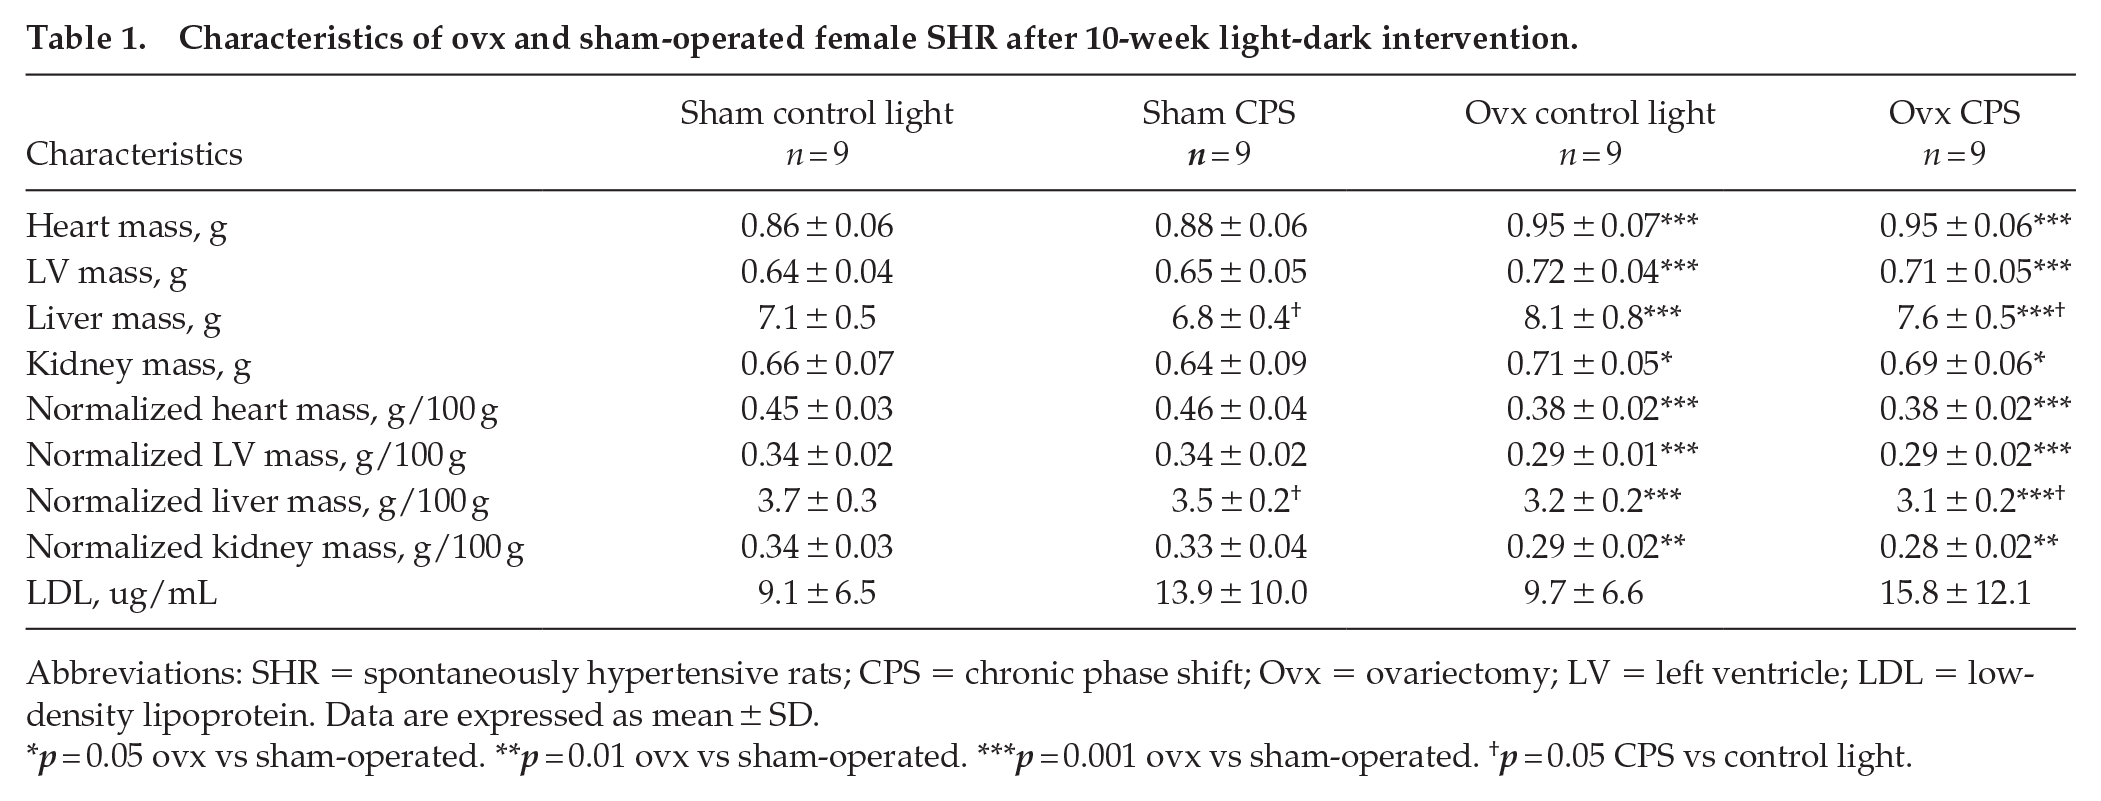
Abbreviations: SHR = spontaneously hypertensive rats; CPS = chronic phase shift; Ovx = ovariectomy; LV = left ventricle; LDL = low-density lipoprotein. Data are expressed as mean ± SD.
p = 0.05 ovx vs sham-operated. **p = 0.01 ovx vs sham-operated. ***p = 0.001 ovx vs sham-operated. †p = 0.05 CPS vs control light.
Discussion
The key findings of this study indicate that a CPS protocol designed to induce circadian misalignment was associated with increased systolic BP and water intake, reduced liver mass, and impaired glucose tolerance in female SHR, regardless of ovariectomy or sham operation status. These findings suggest that CPS-induced circadian misalignment exacerbates cardiometabolic disturbances in female SHR. In addition, estrogen deficiency independently increased body mass, food intake, and absolute organ masses. However, food intake and organ masses were decreased relative to body mass, suggesting a primary alteration in body composition. Notably, the absence of interaction between CPS-induced circadian misalignment and estrogen deficiency indicates that these conditions independently affect cardiometabolic parameters in female SHR. SHR exhibit a genetic predisposition to circadian disruptions, including spontaneous phase advance, a shorter period and lower amplitude of circadian rhythms, and higher desynchrony with peripheral clocks compared with normotensive controls (Cui et al., 2011; Sládek et al., 2012; Polidarová et al., 2013; Olejníková et al., 2015). While these inherent circadian disruptions could potentially lessen the effects of additional misalignment, this study highlights a sex- and strain-specific response of CPS on cardiometabolic parameters (specifically, higher systolic BP and lower glucose tolerance) in female SHR.
Previous findings report that circadian misalignment in male rodents—SHR, Wistar, F344 rats, and C57BL/6 mice—often results in cardiometabolic disruptions, including increased body mass, glucose intolerance, and elevated BP (Tsai et al., 2005; Salgado-Delgado et al., 2008, Casiraghi et al., 2016; Rumanova et al., 2019; Wang et al., 2022). However, fewer studies have examined circadian misalignment effects in female rodents, particularly hypertensive models. Chronic circadian misalignment had no effect on body mass or BP in adult female Wistar rats (Zeman et al., 2016) but induced less pronounced BP increases in female Bmal1-KO rats than in males (Rhoads et al., 2021). In addition, recent studies report glucose intolerance in males but not in female rodents—C57BL/6 mice and fat sand rats in response to circadian misalignment/circadian disruption–inducing protocols (chronic jet lag and short photoperiod) (Ma et al., 2024; Tan et al., 2024). However, findings from other studies demonstrate impaired glucose metabolism in female C57BL/6 mice under chronic circadian disruption (Zhu et al., 2015; Zhong et al., 2019). The severity of impairment varied depending on the duration and extent of misalignment. These findings collectively suggest that the effects of circadian misalignment on females are more variable and less consistent than in males.
In this study, CPS had no effect on body mass or food intake in female SHR, consistent with Zeman et al. (2016). Studies show that circadian misalignment may not consistently affect body mass or food intake (Dauchy et al., 2010; Wang et al., 2022), and its effects on BP remain inconsistent. Increased BP is frequently observed in male rodents (Zhang et al., 2000; Rhoads et al., 2021; Wang et al., 2021, 2022) while females exhibit subtle or no changes (Zeman et al., 2016; Wang et al., 2021). In our study, the CPS protocol led to subtle yet significant increases in systolic BP in the female SHR, independent of ovariectomy or sham operation status. Male sex hormones are known to exacerbate hypertension (Reckelhoff et al., 1998; Huisman et al., 2006), which may explain the more pronounced effects in males in other studies.
The CPS protocol also led to increased water intake, consistent with findings observed in male F344 rats (Tsai et al., 2005), although some studies reported decreased water intake (Spiteri, 1982; Rosenwasser et al., 2010; Guerrero- et al., 2017). Variations in the circadian protocols used may account for these discrepancies. Nevertheless, increased water intake may reflect disruptions in fluid regulation (George et al., 1975; Duffy et al., 2016; Scheuermaier et al., 2024), leading to compensatory thirst (Mutter et al., 2021; Perrier et al., 2021). While Tsai et al. (2005) reported no liver mass changes—with 12-h light-dark cycle shifts twice weekly and a 10-day recovery period, this study observed reduced liver mass in the rats exposed to CPS. Since the liver plays a crucial role in glucose metabolism (Zhang et al., 2010; Lamia et al., 2008), its dysfunction can impair glucose regulation (Salgado-Delgado et al., 2013). The impaired glucose tolerance observed in this study is consistent with previous findings in rat models with circadian misalignment induced by either manipulation of the light-dark cycle or restricted feeding (Salgado-Delgado et al., 2010; Varcoe et al., 2011; Zhong et al., 2019; Tan et al., 2024). The reduced liver mass observed in this study may have contributed to impaired glucose clearance and reduced insulin sensitivity (Qian et al., 2018; Zhong et al., 2019; Her et al., 2024), exacerbating glucose intolerance in female SHR.
Beyond the CPS effects described above, estrogen deficiency significantly increased body mass gain in female SHR, consistent with previous studies (Santos et al., 2004; Lin et al., 2016; da Silva et al., 2017). Despite this increase, food intake was reduced relative to body mass, likely reflecting decreased physical activity and altered metabolic processes (Lovejoy et al., 2008; Rogers et al., 2009). Although absolute organ masses increased, the proportional gain was smaller than the overall body mass. This indicates a shift toward greater fat accumulation, consistent with estrogen decline–related increased adiposity and metabolic dysregulation (Chen and Heiman, 2001; Sowers et al., 2007; Abildgaard et al., 2021). Although metabolic abnormalities such as elevated fasting glucose, glucose intolerance, and insulin resistance are often reported in estrogen-deficient SHR (Sanches et al., 2012; Conti et al., 2015; Brito-Monzani et al., 2018), findings remain inconsistent.
Variability in the age of ovariectomy and environmental factors may account for these inconsistencies. Indeed, fasting blood glucose increased following fructose-induced insulin resistance and ovariectomy at 3 months old (Sanches et al., 2012; Conti et al., 2015; Brito-Monzani et al., 2018), whereas no changes were observed in female SHR ovariectomized at a younger age (3-12 weeks old) (Iwase et al., 1996; Swislocki et al., 2002; das Graças Abeles et al., 2012). In this study, estrogen deficiency did not significantly affect fasting blood glucose but was associated with lower glucose concentration during the OGTT. Lower OGTT blood glucose levels have been observed in female rats (non-ovariectomized) showing higher insulin sensitivity and enhanced muscle glucose uptake (Yki-Järvinen, 1984; Bilu et al., 2022). While ovariectomy is associated with glucose intolerance (Ben-Shmuel et al., 2015; Lei et al., 2021), the decrease in glucose during OGTT in ovariectomized female SHR could reflect a reduction in overall glucose availability due to lower food intake relative to body mass as observed in this study.
Environmental factors, such as temperature, may contribute to inconsistent findings regarding LDL concentration in estrogen-deficient SHR. Increased LDL was observed at cooler room temperatures (22 °C) (Packer et al., 2002; Kim et al., 2011), but not at higher temperatures (24 °C) (Delgado et al., 2017), consistent with this study. Prolonged exposure to cooler temperatures has been associated with elevated cholesterol levels (Umishio et al., 2022), with LDL concentration rising as temperature decreases (Hong et al., 2012; Shiue, 2016; Sartini et al., 2017). Thus, housing conditions, alongside diet and age, may influence metabolic outcomes more than estrogen deficiency alone. Furthermore, the effect of estrogen deficiency on BP in female SHR remains inconclusive. Some studies report increased BP (Dantas et al., 1999; Peng et al., 2003; Lin et al., 2016; Shimojo et al., 2018), while others report no effect (Giménez et al., 2006; Jazbutyte et al., 2008; Martin et al., 2008; Tatchum-Talom et al., 2011; Costa et al., 2018; Lin et al., 2020; Chen et al., 2021). Consistent with the latter findings, this study found no differences in BP. The discrepancies may be attributed to variations in experimental methodologies, such as telemetry versus noninvasive tail-cuff measurements. Notably, male SHR consistently exhibit higher BP, likely due to androgen-driven hypertensive effects (Reckelhoff et al., 1999). Thus, possible protective effects of female hormones that persist despite ovariectomy may explain the absence of BP changes in this study.
Finally, no interaction between CPS-induced circadian misalignment and estrogen deficiency was observed in this study. Although both these conditions induce cardiometabolic disturbances, such as insulin resistance, hypertension, elevated cholesterol, and glucose intolerance (Penev et al., 1998; Morris et al., 2016; Chikwati et al., 2023), the lack of interaction suggests they may operate independently. Unlike menopause that involves age-related metabolic changes and hormonal shifts, the early onset of estrogen deficiency may result in fewer compounded effects. In addition, the genetic profile of SHR may also mitigate the impact of CPS on other cardiometabolic parameters. Therefore, the strain-specific characteristics of SHR combined with early estrogen deficiency may explain the lack of additive effects in this study. A recent study by Ma et al. (2024) demonstrated a sex-dependent effect on metabolic disturbances under circadian misalignment, whereby males developed glucose intolerance during chronic jet lag induced by 6-h daily phase shifts, but females did not. Notably, testosterone played a key role as castration reduced circadian misalignment–induced metabolic disturbances (no evidence of glucose intolerance in castrated mice compared with non-castrated mice during the chronic jet lag protocol), while testosterone replacement restored them. When taken together, Ma et al.’s (2024) findings (castrated mice do not develop glucose intolerance during chronic jet lag) and our study’s findings (ovariectomy is associated with lower glucose levels during OGTT, when controlling for light schedule) suggest that the absence of ovarian hormones alone does not exacerbate circadian misalignment–induced metabolic disturbances, but rather testosterone may be a primary driver of these effects. Taken together, these findings reinforce the notion that circadian misalignment and estrogen deficiency independently influence cardiometabolic outcomes. Their interaction may be limited, and potentially due to sex-and species-specific responses or genetic factors.
Limitations
This study was unable to monitor physiological or behavioral indicators (e.g., core body temperature, locomotor activity, fasting/feeding activity, or hormonal rhythms) commonly used to confirm circadian rhythms and re-entrainment in rodents (Reid, 2019). Therefore, we cannot establish with certainty whether circadian rhythms were misaligned by the CPS protocol, nor can we ascertain whether the changes observed during the CPS protocol (i.e., increased water intake, lower glucose tolerance during OGTT, and higher systolic BP) were driven by changes in the timing of rest/activity, fasting/feeding and/or hormonal/molecular rhythms, or a combination thereof, during the CPS protocol.
While data collection was consistent within each group across weekly cycles, parameters were collected on different days relative to each CPS phase shift. This may introduce variability due to ongoing re-entrainment in the CPS group. Thus, future work should consider standardizing the timing of all measurements relative to the phase shift cycles (i.e., measure at consistent intervals each phase shift) to ensure that all rats are in comparable physiological states during assessment. In addition, BP was measured using the noninvasive tail-cuff technique, which may have underestimated the effect size of the systolic BP increase compared with direct methods like telemetry (Wilde et al., 2017; Harrison et al., 2024). It is possible that the timing of our experimental intervention interacted with the maturation of hypertension, potentially influencing the BP outcomes observed.
Conclusion
This study demonstrates that CPS-induced chronic circadian misalignment and estrogen deficiency independently contribute to cardiometabolic disturbances in female SHR. The 10 weeks of CPS of the photoperiod increased systolic BP, water intake, and impaired glucose tolerance. However, the CPS did not worsen the overall cardiometabolic profile in estrogen-deficient SHR. SHR may show limited effects of CPS-induced circadian misalignment during a shift work paradigm study due to inherent circadian disruptions, yet we were able to observe the expected effects of CPS-induced circadian misalignment on glucose tolerance and BP. This abnormal circadian regulation could be valuable in unraveling molecular pathways contributing to cardiometabolic risk under chronic circadian misalignment, such as in shift work. In addition, sex differences play a role in the response to circadian misalignment, as male rodents typically exhibit more pronounced cardiometabolic disturbances than females. On the contrary, estrogen deficiency led to increased body mass but did not worsen other cardiometabolic parameters in female SHR. While early estrogen deprivation may not disrupt the metabolic function in young female SHR, these findings warrant further investigation into possible compensatory mechanisms mitigating broader metabolic dysfunction. Furthermore, the lack of combined effects between circadian misalignment and estrogen deficiency may reflect species differences. These findings underscore the complexity of circadian and hormonal influences on cardiometabolic health, particularly in female hypertensive models.
Footnotes
Acknowledgements
We would like to thank the Wits Research Animal Facility’s staff for their assistance with the care and welfare of the animals. We also thank Dr. Monica Gomes for her technical assistance. This work was supported by grants from the Faculty Research Committee (FRC) of the Wits Faculty of Health Sciences (Grant number: 001.401.8521101. 0000000.000000 PHSMFR0). The funders had no role in study design, data collection and analysis, decision to publish, or preparation of the manuscript.
Author Contributions
Conflict of Interest Statement
The authors have no potential conflicts of interest with respect to the research, authorship, and/or publication of this article.
Data Availability
The data presented in this manuscript are available upon reasonable request to the corresponding author.
Ethical Approval
All experimental procedures were approved by the Animal Research Ethics Committee (AREC) of the University of the Witwatersrand (Approval reference: 2017/11/76/C), in compliance with the National Institutes of Health guidelines for the care and use of laboratory animals.
Protocol Registration
A study protocol was prepared prior to the study and approved by the Faculty of Health Sciences at the University of the Witwatersrand. This research was conducted as part of a postgraduate project, and a letter of protocol approval is available upon request to the corresponding author.