
Abstract
Photoperiod disruption, which occurs during shift work, is associated with changes in metabolism or physiology (e.g. hypertension and hyperglycaemia) that have the potential to adversely affect stroke outcome. We sought to investigate if photoperiod disruption affects vulnerability to stroke by determining the impact of photoperiod disruption on infarct size following permanent middle cerebral artery occlusion. Adult male Wistar rats (210–290 g) were housed singly under two different light/dark cycle conditions (n = 12 each). Controls were maintained on a standard 12:12 light/dark cycle for nine weeks. For rats exposed to photoperiod disruption, every three days for nine weeks, the lights were switched on 6 h earlier than in the previous photoperiod. T2-weighted magnetic resonance imaging was performed at 48 h after middle cerebral artery occlusion. Disruption of photoperiod in young healthy rats for nine weeks did not alter key physiological variables that can impact on ischaemic damage, e.g. blood pressure and blood glucose immediately prior to middle cerebral artery occlusion. There was no effect of photoperiod disruption on infarct size after middle cerebral artery occlusion. We conclude that any potentially adverse effect of photoperiod disruption on stroke outcome may require additional factors such as high fat/high sugar diet or pre-existing co-morbidities.
Introduction
Epidemiological studies have identified obesity, hypertension, diabetes, atherosclerosis and inflammation as significant risk factors for stroke onset and poor outcome.1,2 The incidence and overall disease burden of stroke is predicted to rise, as these risk factors extend across the developing world.3,4 In 2007, more than half the global population lived in a city and this is predicted to reach 70% by 2050. Risk factors for stroke are strongly associated with urbanisation mediated through a complex interaction of lifestyle factors including high-energy diets, pollution, sedentary lifestyles and disrupted circadian rhythmicity. 5
Circadian rhythms are recurring cycles in behavioural and physiological parameters that are endogenously driven over a period of approximately 24 h and are generated by feedback loops in the expression of clock genes that are present in virtually all mammalian cells and by non-transcription-dependent mechanisms.6,7 Circadian rhythms persist in the absence of external stimuli, but under normal living conditions, they are entrained to external cues such as light, food and physical activity. 8 In mammals, overall synchronisation of the circadian system is governed by a master clock, the suprachiasmatic nuclei (SCN), located within the hypothalamus. 9 Light is thought to be the principal time-giving cue (zeitgeber) transduced by a monosynaptic tract that directly links light sensitive retinal ganglion cells to the SCN. Neuronal activities in the SCN modulate entrainment through multiple neuro-hormonal pathways to other brain structures and peripheral oscillators in the other organs including heart and liver. 10 Through these mechanisms, entrainment optimises health by ensuring that the internal rhythms of metabolism and cardiovascular physiology are synchronised to daily variations in the light/dark cycle and other recurrent environmental challenges. 11 Erratic cycles in the light/dark cycle, food availability or social interaction can affect the alignment between endogenous clocks and the environment, a condition associated with detrimental effects on metabolic and mental health. Around 20% of workers in the developed world are required to undertake shift work which involves chronic disruption of circadian rhythms and shift work is strongly associated with metabolic dysfunction and increased risk of cardio and cerebrovascular diseases. 12
Animal studies suggest potential links between disrupted rhythmicity and ischaemic stroke. The spontaneously hypertensive rat showed a disrupted circadian phenotype with impaired capacity to maintain robust rhythms 13 while a progressive desynchronisation of rhythms in behaviour and drinking was reported to be a prodromal sign of impending stroke in these animals. 14 In healthy individuals, blood pressure (BP) and vascular contractility show strong daily rhythmicity which indicates underlying clock control, and disruption of these rhythms is an early sign of cardiovascular diseases in humans 15 and animals. 16 Disruption of clock function by exposure of animals to disrupted photoperiods is used as a model of circadian disruption, and negatively affects vascular rhythmicity, function and vulnerability to ischaemia in organs other than the brain. For example, photoperiod disruption (PD) decreased survival in a hamster model of cardiomyopathy 17 and a mouse model of myocardial infarction 18 and compromised vascular adaptive responses to aortic constriction in mice. 19 Furthermore, mice with genetic clock lesions had impaired pathological remodelling in response to ligation of the carotid artery, enhanced vascular injury and impaired endothelial function 20 and importantly, increased cell death in the hippocampus following transient forebrain ischaemia. 21 Together with the increased vulnerability of clock disrupted animals to cardiovascular ischaemic injury, this suggests that PD might have an adverse impact on cerebral ischaemic damage.
Some of the reported metabolic or physiological changes associated with PD such as hypertension and diabetes have the potential to adversely impact on stroke. The adverse effect of hyperglycaemia on outcome after stroke or infarct size after middle cerebral artery occlusion (MCAO) in rodents is well documented22,23 while co-morbidities such as genetically determined hypertension, diabetes or insulin resistance hasten the demise of the penumbra and increase infarct volume.24,25 We therefore hypothesise that PD will alter key physiological variables, such as BP and blood glucose, and increase vulnerability to focal cerebral ischaemia. The primary objective of the present study was to determine if rats subjected to recurrent phase advance of the light/dark cycle for nine weeks had larger infarcts compared to animals maintained on a normal light/dark cycle following permanent MCAO.
Materials and methods
Animals and study design
Experiments were carried out under license from the UK Home Office and were subject to the Animals (Scientific Procedures) Act, 1986. The report was carried out in accordance with the ARRIVE guidelines (http://www.nc3rs.org.uk/arrive). Animals were not randomised to groups but were allocated to control and PD groups in equal numbers when batches of four rats were entered into the nine-week protocol described below. A total of 24 male, adult Wistar rats (8–10 weeks) weighing 210–290 g were entered into the study. Rats were singly housed under a standard 12:12 light/dark cycle (lights on at 07:00, lights off at 19:00) for two weeks prior to allocation into one of two experimental groups: control (n = 12) and PD (n = 12). Group sizes were based on a previous study using the same method of inducing permanent MCAO that detected an increase in infarct volume. 26
PD protocol
Control rats were housed singly in a room with a standard 12:12 light/dark cycle for nine weeks. Light intensity was measured by a lux meter at the beginning of the study for the room housing the control rats (∼150 lux). PD rats were housed singly in a well-ventilated light-tight box that accommodated two cages per shelf and was connected to a controlled timer. Lights in the box were switched on 6 h earlier than in the previous photoperiod every three days for nine weeks as described previously in a study simulating shift work which demonstrated perturbation of circadian biomarkers and changes in blood glucose and insulin in diabetic-prone rats. 27 Light intensity in the box was maintained at ∼150 lux similar to that experienced by the control animals. All rats had ad libitum access to water and standard rat chow.
Activity monitoring
Activity monitoring was conducted only in the PD rats. Baseline locomotor activity was recorded two weeks prior to the commencement of nine weeks phase advance protocol, in which the rats were maintained under standard 12:12 light/dark cycle and for the subsequent nine-week period of PD. Activity was measured in each individual cage using a passive infra-red sensor connected to a relay and then to a PC via a 56-channel interface (ClockLab CL200) that counted events on the relays in 1 min bins. The sensors were positioned above the cage at a distance that was optimised for detection of movement in all quadrants and for insensitivity to movements outside the cage. Data were acquired using ClockLab software (Actimetrics) and were expressed in units of beam breaks per min. Disruption of circadian rhythmicity in locomotor activity was quantified using parameters described for assessment of fragmentation of human rhythmicity. 28
Body weight and food intake
In all rats, body weight (BW) and food intake (FI) were measured at baseline (week 0) and thereafter on a weekly basis for nine weeks. Food intake was calculated by weighing the amount of food given each week and calculating the difference from the previous week.
Tail cuff plethysmography
In all rats, systolic BP was recorded by tail cuff plethysmography at baseline and at the end of nine-week protocol. All animals had been previously conditioned to the indirect BP set up prior to the study. BP was measured by the same experimenter at approximately the same time of the day at every occasion. To facilitate vasodilatation, animals were placed in an insulated heat box at 35℃–36℃ for 10 min. Five successive BP readings at each session were recorded and the average calculated. The change in BP between baseline and the day of MCAO was calculated for each rat.
Middle cerebral artery occlusion
At the end of nine weeks, all rats in control and PD groups were subjected to permanent MCAO by the same experimenter who was blinded to the animal identity. Anaesthesia was induced (5% isoflurane) and maintained by artificial ventilation with 2% to 3% isoflurane in nitrous oxide–oxygen (70:30). A digital blood glucose meter (Accu-Check Aviva, Roche, Germany) was used to measure blood glucose sampled from the tail vein immediately following induction of anaesthesia. Body temperature was monitored by a rectal probe and maintained at 37℃ ± 0.5℃ using a heat lamp throughout surgery. Permanent focal cerebral ischemia was induced by distal occlusion of the middle cerebral artery (MCA) using the diathermy method adapted from Tamura et al. 29 The MCA was exposed via a craniectomy and the point at which the MCA crosses the inferior cerebral vein (ICV) was identified. The entire portion of MCA (∼2 mm) above and below the ICV was electrocoagulated with diathermy forceps. Complete MCAO was confirmed by cutting the electrocoagulated vessel with microscissors. After recovery from anaesthesia, animals were returned to their home cage and kept in the recovery area where their general well-being and body weight were closely monitored three times daily. Animals received soft diet and fluid, in order to aid recovery.
Magnetic resonance imaging
At 48 h after MCAO, rats were re-anaesthetized and placed in Bruker Pharmascan 7 T magnetic resonance imaging (MRI) scanner. Rats were maintained under anaesthesia with 2% to 3% isoflurane in nitrous oxide–oxygen (70:30) using a face mask throughout the scanning process. Rats were placed into a rat cradle, the head secured and a phased array surface coil was positioned above the head. Body temperature was maintained at 37℃ ± 0.5℃ during scanning using a temperature-controlled water jacket.
A RARE T2-weighted sequence was acquired (TE = 72 ms, TR = 5086 ms, matrix = 256 × 256, 16 coronal section slices; 0.75 mm thick) to image the infarct.
Infarct volume measurement
Infarct volume analysis was performed using Image J software (NIH, Bethesda, MD), and the assessor was blinded to the experimental group. Infarct area was calculated by manually delineating the hyper-intense regions on T2-weighted images. Infarct volume was calculated by summing the infarct area on each slice and multiplying by slice thickness (0.75 mm). Correction for oedema was performed to account for brain swelling at 48 h after stroke using previously described method. 30
Plasma fructosamine
The bonding of glucose to plasma proteins produces fructosamine and plasma fructosamine levels are proportional to the average glucose concentration over the previous two to three weeks prior to the measurement. Blood for measurement of plasma fructosamine was collected at 48 h after MCAO. Whole blood was withdrawn from the heart (via cardiac puncture) and collected into EDTA-treated tubes (1.5 ml). Samples were processed immediately by centrifugation for 10 min at 1000 × g using a refrigerated centrifuge. Samples were stored at −80℃ and analysed at the end of the study. The fructosamine assay uses the rate of formation of formazan from nitrotetrazolium blue in an alkaline environment at 546 nm. 31 Reagents were provided by Horiba ABX and the analysis was performed on the Olympus AU 640 chemistry analyser.
Statistical analysis
Data are expressed as scatterplots or mean ± standard deviation (SD). All statistical analyses were performed using GraphPad Prism software v6 (GraphPad, La Jolla, CA). Changes in BP over time and between groups were assessed by a two-way analysis of variance. An unpaired Student’s t test was used to compare final infarct volume, % increase in body weight, blood glucose and fructosamine level between the groups. A probability value of 0.05 or less was considered statistically significant.
Results
All animals entered into the study completed the entire experimental protocol; there was no mortality following MCAO in either PD or control groups.
Activity monitoring
Rats showed a strong circadian rhythm in locomotor activity in the baseline 12:12 light/dark period that was disrupted on commencement of the phase advance protocol (Figure 1(a)). Loss of circadian rhythmicity during the PD period compared to the baseline period was confirmed by changes in the rhythmicity parameters, inter-daily stability (IS) and intra-daily variability (IV) between these periods.
Actogram from a single animal showing disrupted rhythmicity in locomotor activity during chronic photoperiodic phase advance (a). Rolling seven-day average (mean ± SD) of the circadian rhythmicity parameters, inter-daily stability (IS) and intra-daily variability for all animals (IV) (b). The IS decreased from baseline after the PD intervention, indicating disrupted stability of rhythmicity between days. The IV increase from baseline following the PD, which indicates increased fragmentation of the daily circadian rhythm in locomotor activity. Mean rhythmicity indices (IS and IV) calculated over the duration of the baseline and PD periods for all animals, indicated significant changes in both parameters (c) (p < 0.0001, Student unpaired t test).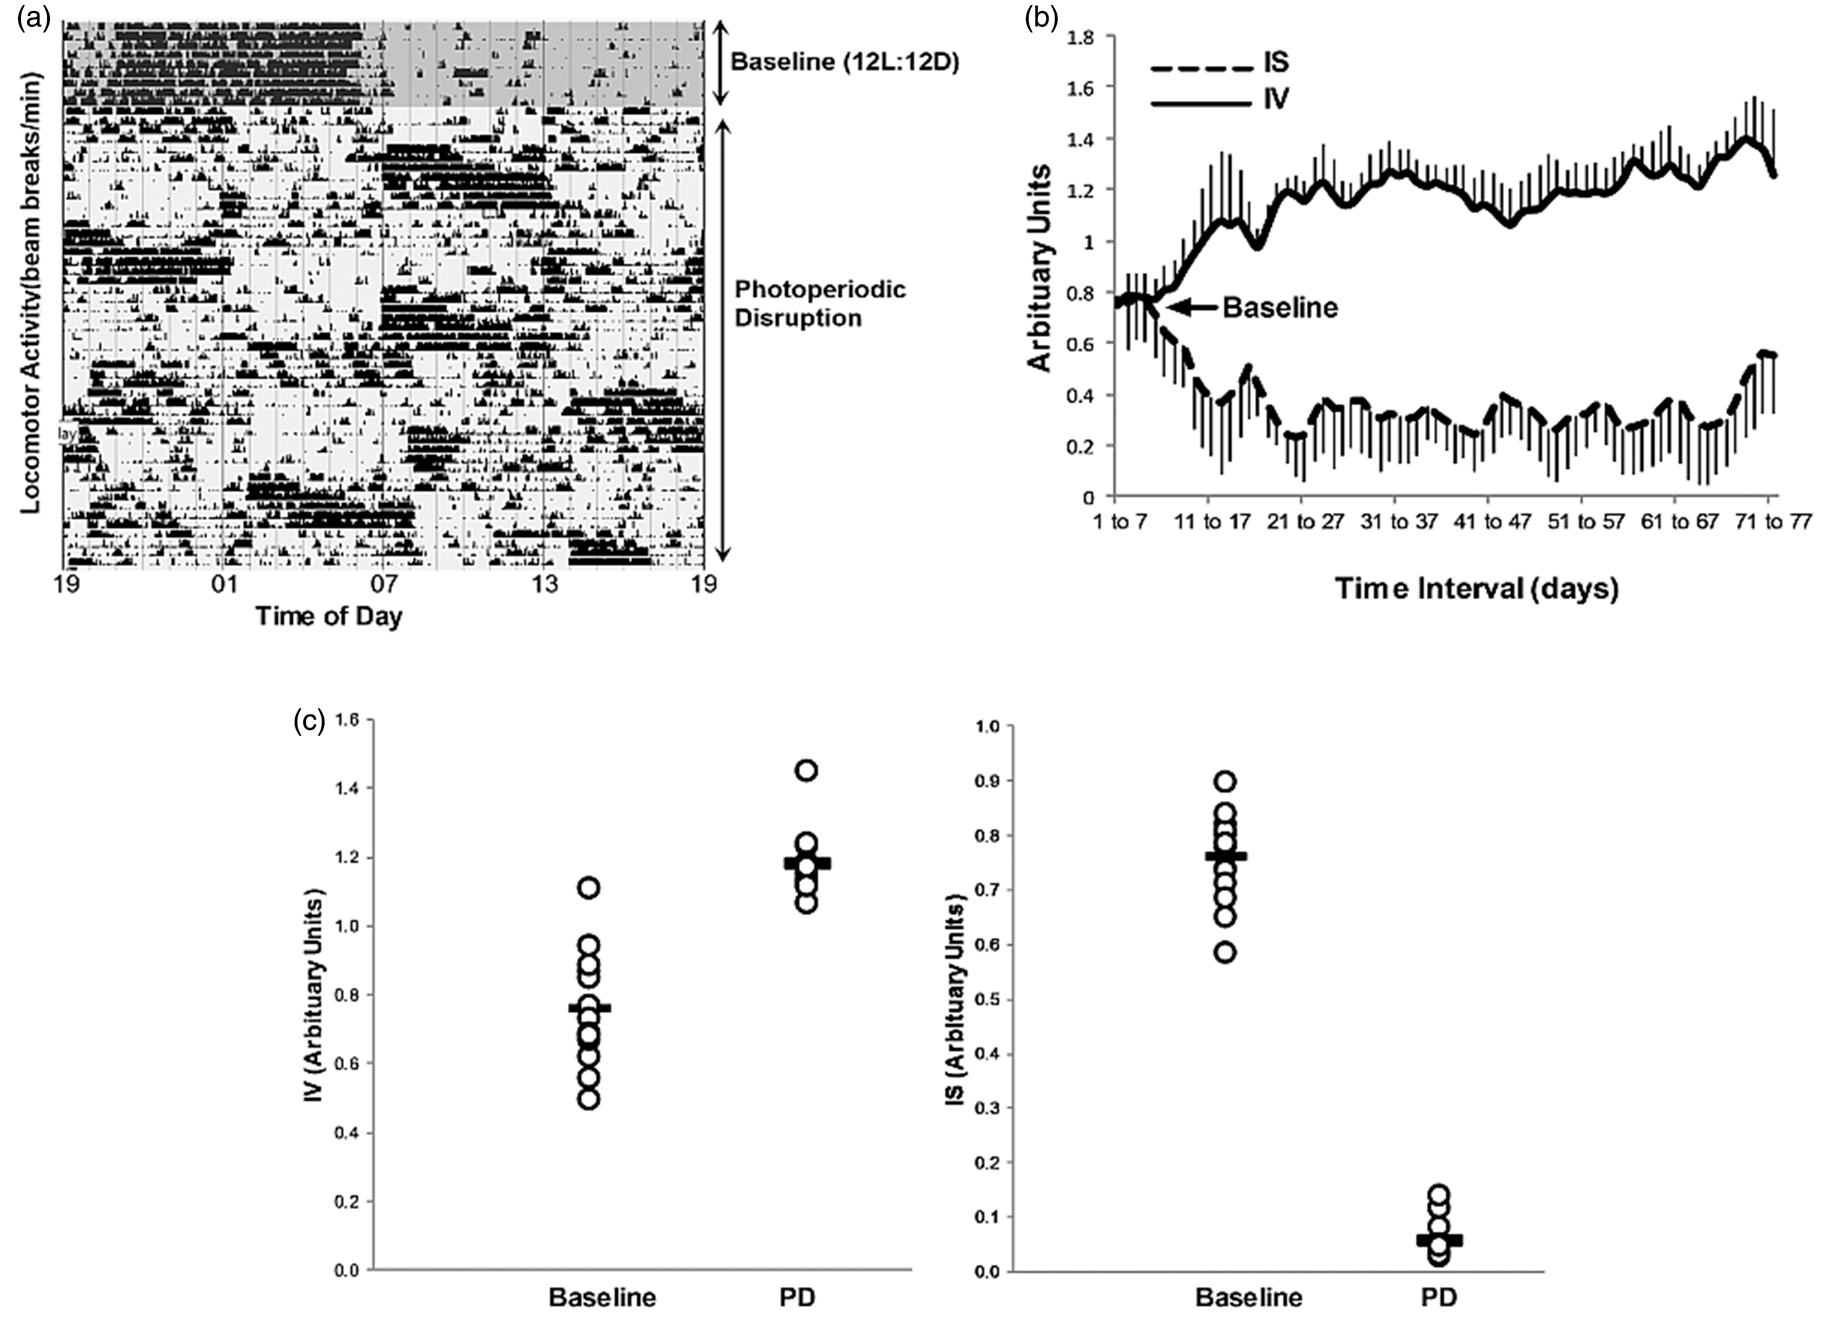
The inter-daily stability was calculated as the ratio between the variance of the average 24 h pattern around the mean and the overall variance and reflects the predictability of the diurnal pattern over sequential days. The IS was significantly decreased in the PD period compared to baseline; 0.76 ± 0.08 and 0.06 ± 0.04 (arbitrary units), mean ± SD for baseline and PD periods, respectively.
The intra-daily variability index was measured as an indicator of the fragmentation of the rhythm, with high values indicative of multiple transitions between periods of rest and activity. Variability within days was increased by PD as indicated by significant increases in the IV compared to the baseline period (0.75 ± 0.16 and 1.18 ± 0.09 (arbitrary units), mean ± SD for baseline and PD periods, respectively (Figure 1(c)). The mean effect of PD on the rhythmicity of all animals is illustrated in Figure 1(b) which shows that both IS and IV deviated from baseline values when PD commenced, and that baseline values were not recovered. Therefore, locomotor activity rhythmicity remained profoundly disrupted for the duration of the PD intervention.
Food intake and body weight
Control and PD groups consumed 21 ± 0.26 and 19.5 ±0.93 g/day, respectively (daily food intake was calculated by averaging the weekly intake). As a summative measure for food intake from baseline to week 9, an area under the curve was calculated for each rat. This was 1331 ± 96.43 and 1227 ± 100.48 g for control and PD, respectively (Figure 2(a)). The two groups were matched for body weight at baseline and in both groups, it increased steadily over time. The mean % increase in body weight at nine weeks compared to baseline was similar in control and PD groups. Therefore, PD did not significantly alter food intake or body weight (Figure 2(b)).
Weekly food intake (a) and % increase in body weight from baseline (b) in rats kept under 12:12 LD cycle (Control) and 6 h phase advance (PD). Data are presented as mean ± SD (p > 0.05, Student unpaired t test). PD: photoperiod disruption.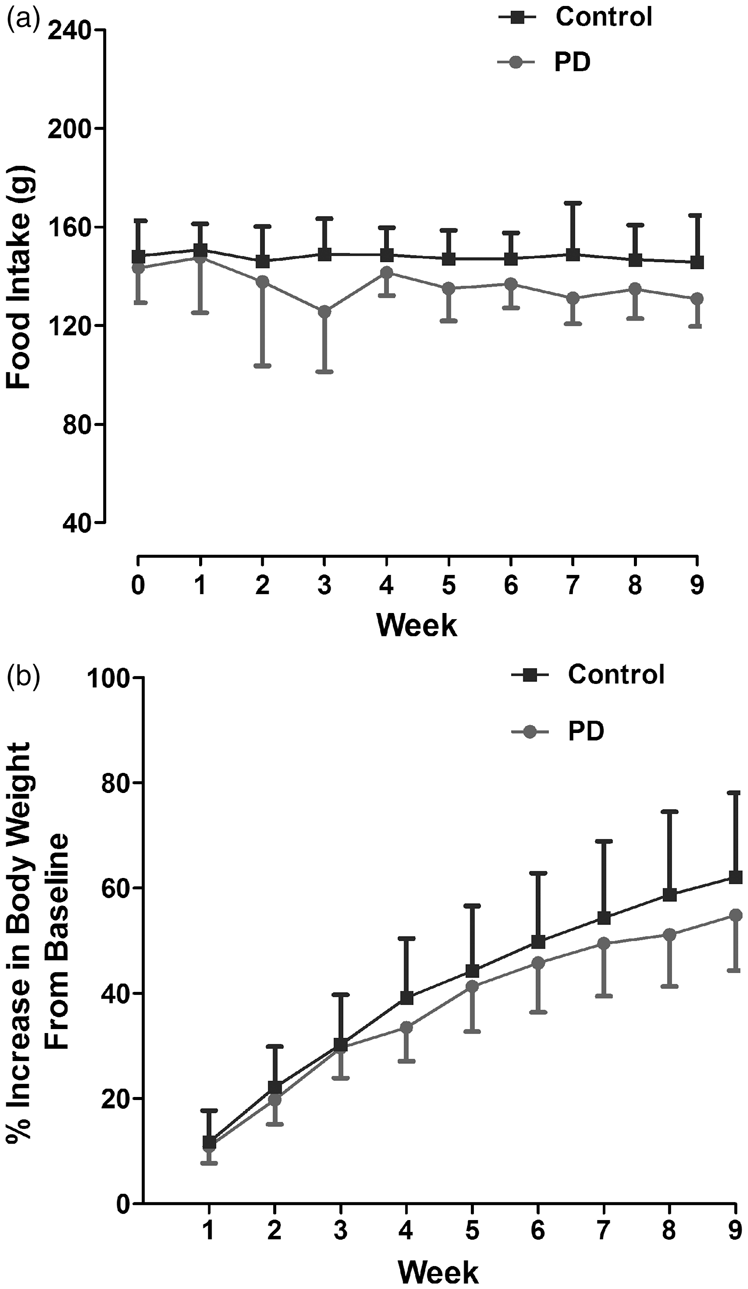
Blood pressure
The baseline systolic BP for control and PD groups was 98.8 ± 9.5 and 106.4 ± 13.2 mmHg, respectively. At nine weeks, no significant difference in BP was observed when compared to baseline measurements in either group (control: 98.7 ± 13.5 mmHg and PD: 104.125 ±11.2 mmHg). There was no difference between control and PD groups in the degree of change in BP over nine-week period (Figure 3). Therefore, PD did not significantly alter BP.
BP was comparable for both control and PD group at baseline. However, PD was not associated with significant % change in BP for both groups at nine weeks. Data points indicate individual rats and the horizontal bar represents the mean (p > 0.05, two-way ANOVA). PD: photoperiod disruption.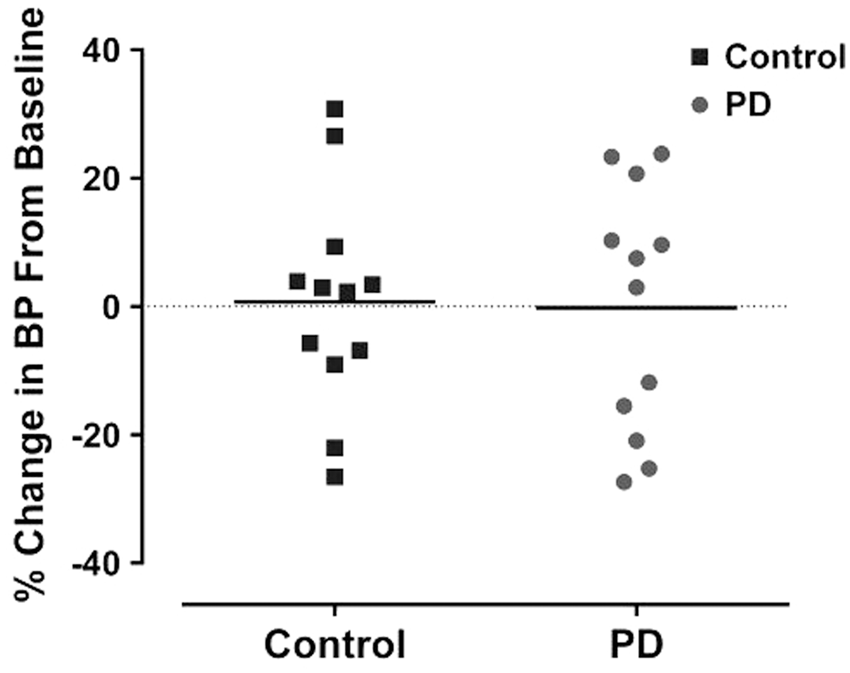
Blood glucose and plasma fructosamine
Blood glucose was sampled immediately following induction of isoflurane anaesthesia prior to MCAO. Despite a slightly higher mean blood glucose level in the PD group in comparison to the control group, the difference was not statistically significant, p = 0.056 (Figure 4(a)). Plasma fructosamine (a measure of glycated protein level) at 48 h after MCAO was not significantly different between control and PD rats (188.9 ± 13.6 and 184.5 ± 15.9 µmol/L, respectively, p = 0.47 (Figure 4(b)).
Blood glucose levels immediately prior to MCAO (a). Data points indicate individual rat and the horizontal bar represents the mean. Plasma fructosamine level at 48 h after MCAO (b) reflects average glycaemic levels two to three weeks prior to MCAO (p > 0.05, Student unpaired t test). PD: photoperiod disruption.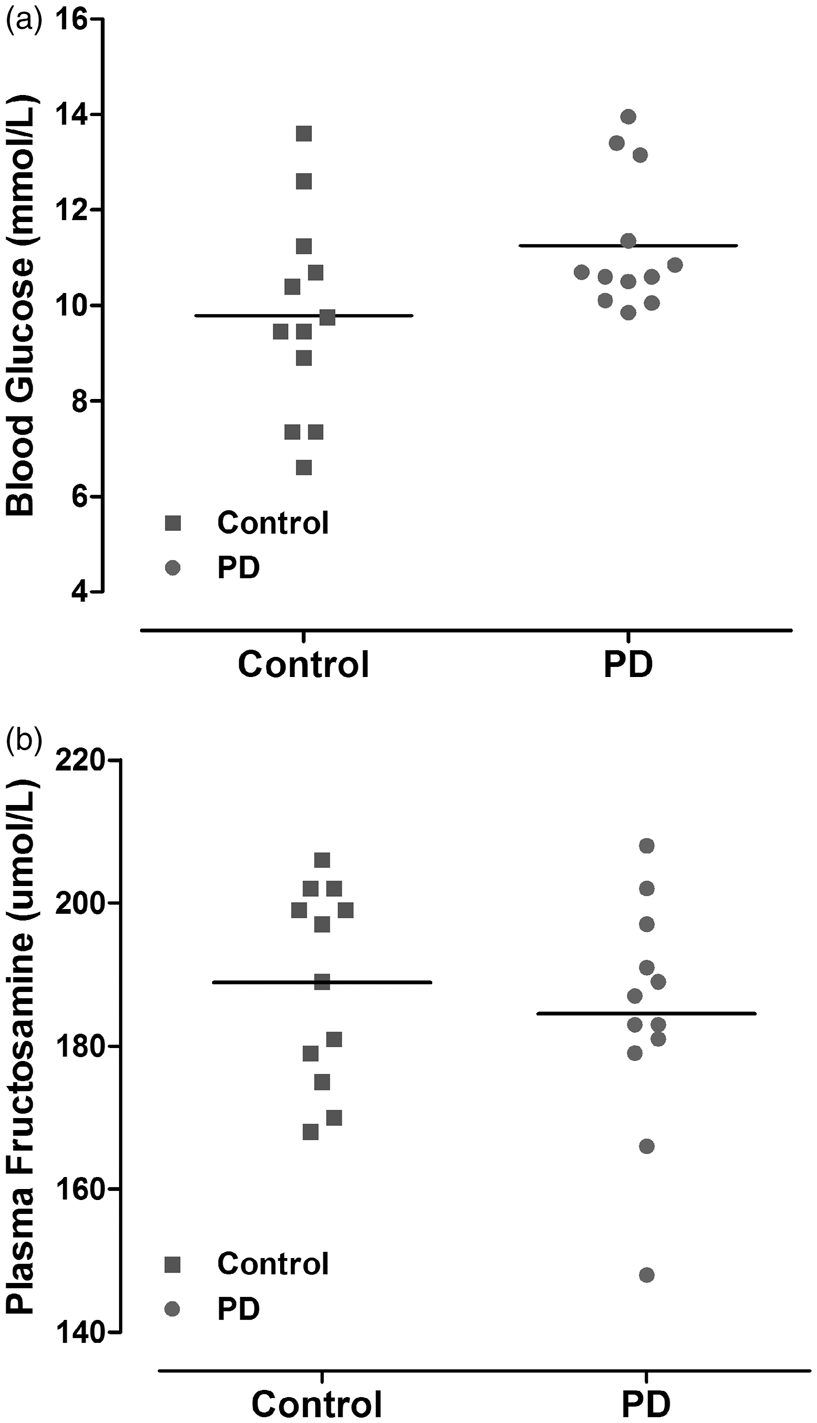
Infarct volume
Infarct volume was assessed by T2-weighted MRI 48 h following MCAO. Infarct volume was not significantly different between control and PD rats (Figure 5(a) and (b)).
T2-weighted MRI images taken at 48 h post MCAO showing hyper-intense (highlighted) region as infarcted area. Representative slices from median animal demonstrate comparable ischemic damage in both groups (a). Photoperiod disruption did not increase infarct volume in PD rats (b). Data points indicate individual rats and the horizontal bar represents the mean (p > 0.05, Student unpaired t test). PD: photoperiod disruption.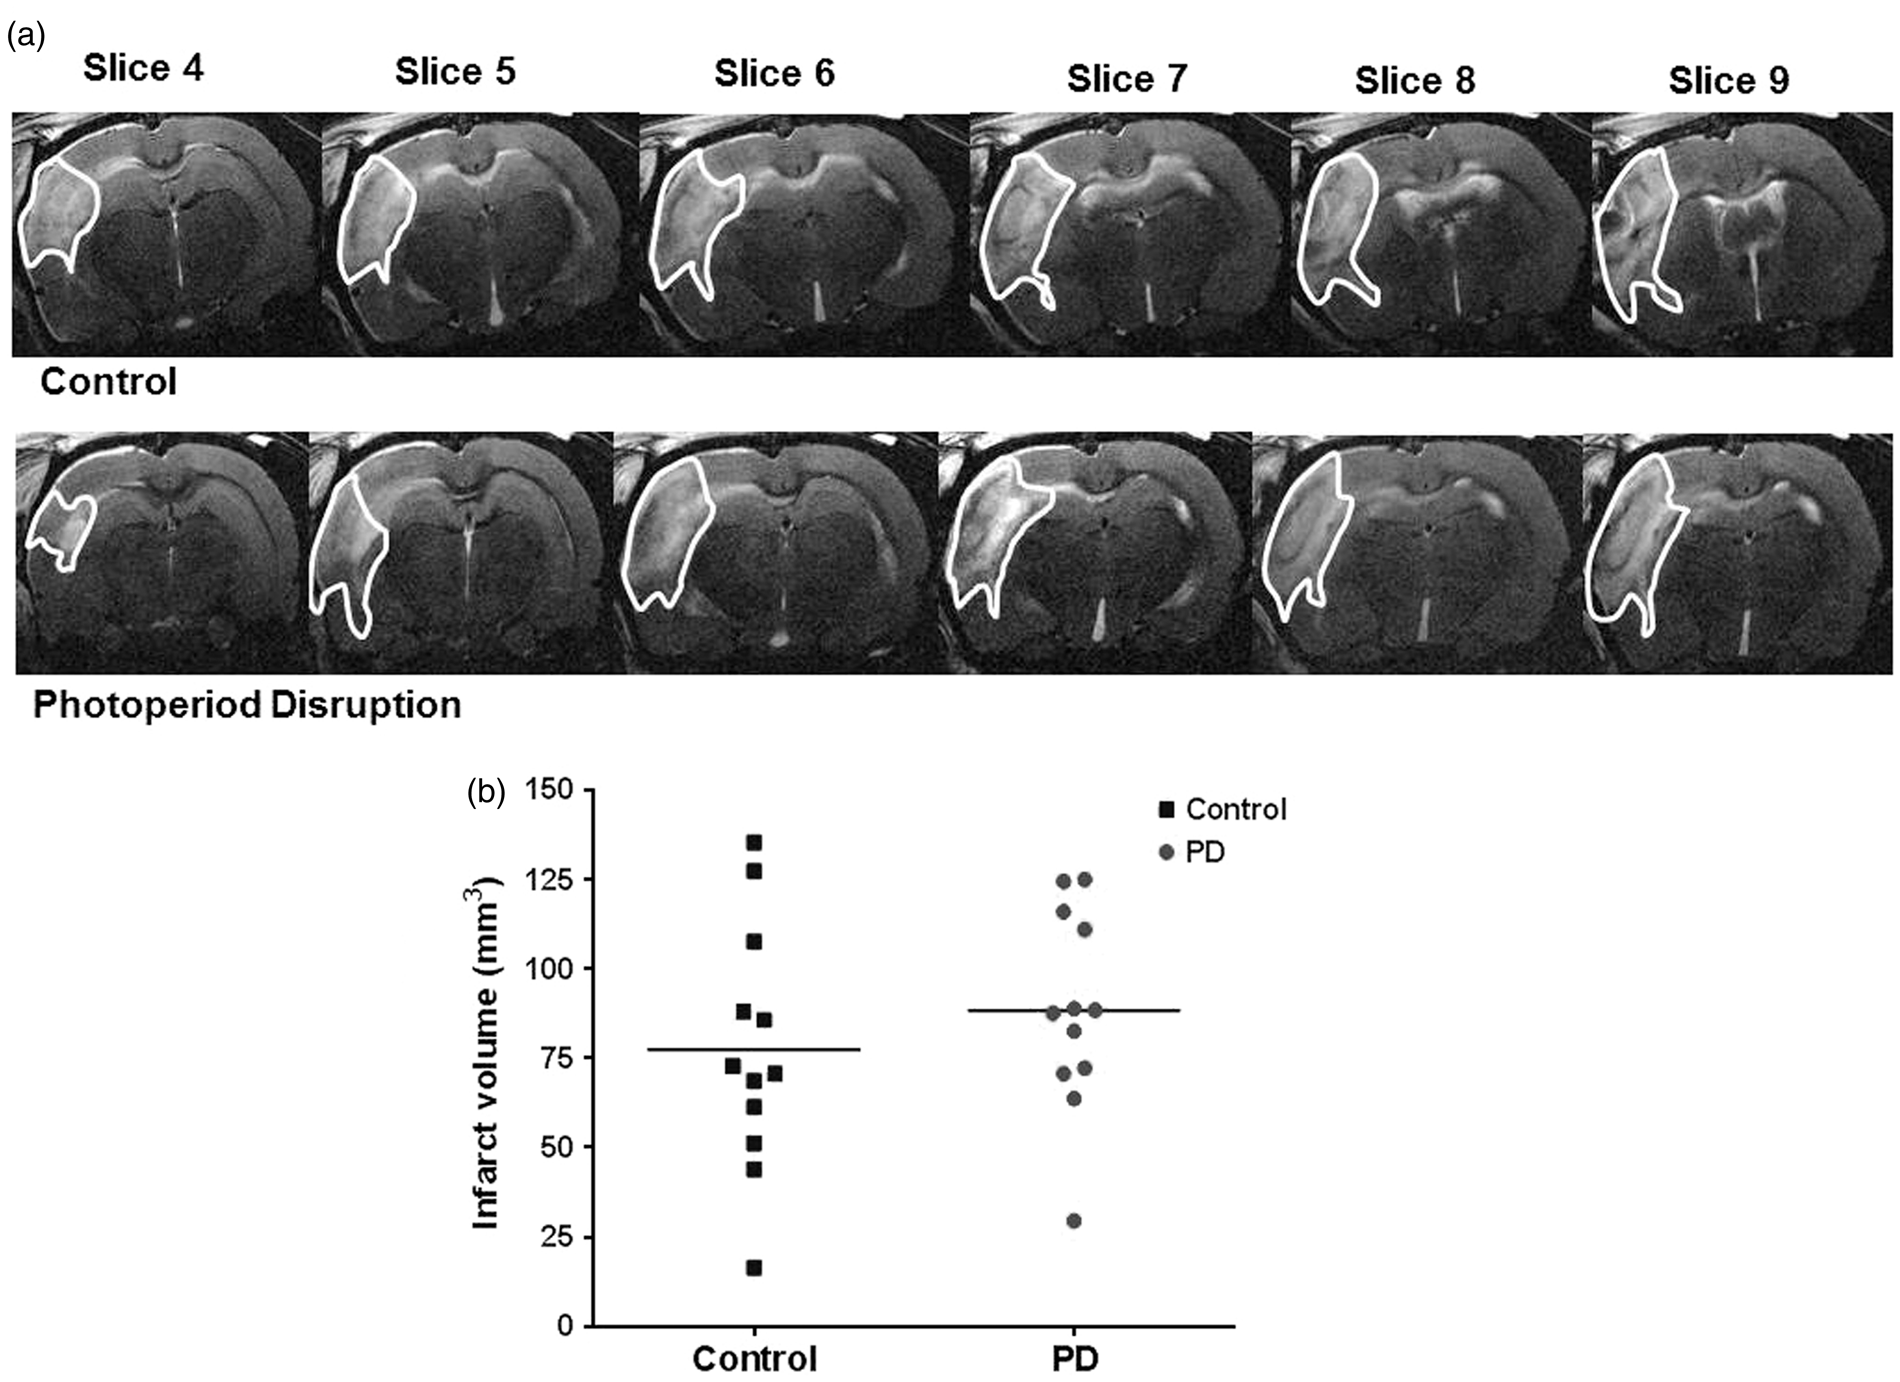
Discussion
Based on associations made between shift work and metabolic dysfunction in humans, 12 we hypothesised that a chronic period of PD would have an adverse effect on infarct size after permanent MCAO in rats. However, our data clearly demonstrate that while rats exhibited chronic disruption of locomotor activity rhythms over the nine-week period of PD, infarct size was not different compared to animals maintained on a normal 12:12 light/dark cycle. Consistent with the lack of effect of PD on infarct size were the lack of changes on parameters which influence stroke outcome: body weight, BP and blood glucose. The metabolic effects of PD in experimental studies in animals are notably inconsistent; this study and others27,32 did not observe changes in metabolic function reported previously. 33 Differences in the protocols used to induce PD could partly account for the heterogeneity of the study results; it is likely that phase advance/delay, constant light and photoperiod less than 24 h affect both circadian rhythms and metabolism in different ways and it is not clear which intervention most closely represents disrupted rhythmicity in humans. Furthermore, the impact of PD on cardio-metabolic function might further depend on the wavelength and intensity of light exposure 34 that are not easily compared between studies. Environmental entrainment is a complex parameter and differences in the degree of secondary disruption of food and social rhythmicity might further contribute to these discrepancies between studies. Indeed, PD is just one component of the multiple conflicting social-, stress- and food-related disruptions to the lifestyle of the shift worker.
In addition to light-entrainment through the SCN, emerging evidence supports a strong impact of food intake on the control of peripheral rhythms.35,36 In nocturnal animals, restricting the time for food intake to the rest phase changed clock gene expression in liver and pancreas but not in the SCN 37 and caused increased body weight. 35 In this case, weight gain is due to uncoupling between peripheral clocks and light signal from the central pacemaker. 38 In the present study, the animals had free access to food at all times of day and it is possible that they maintained synchronisation of food intake to the disrupted light/dark cycles and that enabled them to accommodate the challenge of PD without comprised metabolic function. Animals subjected to PD in the laboratory may maintain overall synchronisation if food rhythms remain intact, and further studies that measure temporal aspects of food mediated cues are required to resolve this issue. The rhythmicity of the shift worker is different to that of their family and friends, while in rats, all of the animals share the same (disrupted) photoperiod. This important difference between circadian disruption in the laboratory, and in real life might account for the inconsistent reports of the impact of PD on metabolic health. The findings that animals in some laboratories were able to maintain metabolic health despite PD indicate that unidentified factors may protect animals from the detrimental effects of light disruption. Future studies should focus on identifying if entrainment to social or food-related zeitgebers can help animals to accommodate PD, and if similar interventions can attenuate the risks of shift work for metabolic and vascular health in humans.
Young, normotensive Wistar rats were used in the present study and chronic PD had no impact on BP which is concordant with similar findings in normotensive Wistar rats subjected to 12 weeks of PD. 39 Gale et al. 27 suggest that the interaction of genetic predisposition with an environmental trigger (such as PD) further accelerates early development of hyperglycaemia in diabetic prone rats compared to wild type. Other studies demonstrate that 12 h phase shift in the light/dark cycle on a weekly basis causes a significant reduction in survival time in cardiomyopathic hamsters 17 and a higher mortality rate in aged mice. 40 Thus, the adverse effects of PD on health may be manifested in the context of existing factors such as advanced age, hypertension, insulin resistance or genetic variation. Our results demonstrate that PD alone was not sufficient to increase vulnerability to stroke in young rats without stroke co-morbidities. One potential caveat of the present study is that it was not sufficiently powered to detect an effect of PD on infarct volume. When designing the study, the original sample size was calculated based on previous data from our laboratory using the same model of MCAO and strain of rat which detected a 50% increase in infarct volume associated with hyperglycaemia. 26 Using the data obtained from the control group in the current study, a group size of 14 is predicted necessary to detect a 50% increase in infarct volume and so it does not appear likely that an effect of PD was missed due to a Type II error. The present study was sufficiently powered to be able to detect at least a 50% change in infarct volume. We conclude that young healthy individuals may be resilient to any impact that PD, as a consequence of shift work or other environmental influences, may have on sensitivity to stroke. However, the potential adverse impact of PD on stroke outcome in the context of concomitant disruption of food or social zeitgebers or additional pathological challenges from a sedentary lifestyle, a high fat/high sugar diet, ageing or pre-existing co-morbidities warrant future investigation.
Footnotes
Funding
The author(s) disclosed receipt of the following financial support for the research, authorship, and/or publication of this article: Ku Mastura Ku Mohd Noor was supported by the Ministry of Higher Education, Malaysia.
Acknowledgements
We would like to thank Mr Nosrat Mirzai from the Bio-Electronics Unit, College of Medical, Veterinary & Life Sciences (MVLS) for building the light box and sensors, and Mr Jim Mullin and Mrs Lindsay Gallagher for technical assistance with MRI scanning and staff of Wellcome Surgical Institute for their technical assistance.
Declaration of conflicting interests
The author(s) declared no potential conflicts of interest with respect to the research, authorship, and/or publication of this article.
Authors’ contributions
Ku Mastura Ku Mohd Noor was involved in the experimental design, data collection, analysis and interpretation of data and drafting of manuscript. Christopher McCabe was involved in the experimental design, data collection, interpretation of results and critical revision of the manuscript. Lisa Roy involved in MCAO surgery and critical revision of the manuscript. Cathy Wyse was involved in experimental design, analysis and interpretation of activity monitoring data, and critical revision of the manuscript. Stephany Biello contributed in the experimental design and critical revision of the manuscript. Deborah Dewar was involved in the experimental design, interpretation and analysis of results, drafting and critical revision of manuscript. All authors read and approved the final manuscript.