
Abstract
This study examines population-level daily patterns of time-stamped emergency medical service (EMS) dispatches to establish their situational predictability. Using visualization, sinusoidal regression, and statistical tests to compare empirical cumulative distributions, we analyzed 311,848,450 emergency medical call records from the US National Emergency Medical Services Information System (NEMSIS) for years 2010 through 2022. The analysis revealed a robust daily pattern in the hourly distribution of distress calls across 33 major categories of medical emergency dispatch types. Sinusoidal regression coefficients for all types were statistically significant, mostly at the p < 0.0001 level. The coefficient of determination
Much research in social sciences, medicine, public health, epidemiology, and biology is devoted to understanding circumstances affecting human health. This study examines time-stamped emergency medical service (EMS) distress calls. For several decades, daily patterns have been suggested for specific medical events. Most notably, acute myocardial infarction (heart attack), cerebrovascular accident (stroke), and sudden cardiac arrest/death have long been perceived as prevalent in the morning (Cohen et al., 1997; Elliott, 1998; Muller et al., 1985, 1987; Muller, 1999; Rocco et al., 1987; Thakur et al., 1996; Willich et al., 1987). Several reviews and studies have supported or confirmed before-noon occurrence peaks (Akkaya-Kalayci et al., 2017; Buurma et al., 2019; Klerman, 2005), while others failed to replicate a morning tendency (Faramand et al., 2019; Ni et al., 2019; Tripathi et al., 2020; Vencloviene et al., 2017); see Tables 1 and 2.
A summary and analysis of recent articles that reported on time-of-day tendencies on medical events or illness onset.
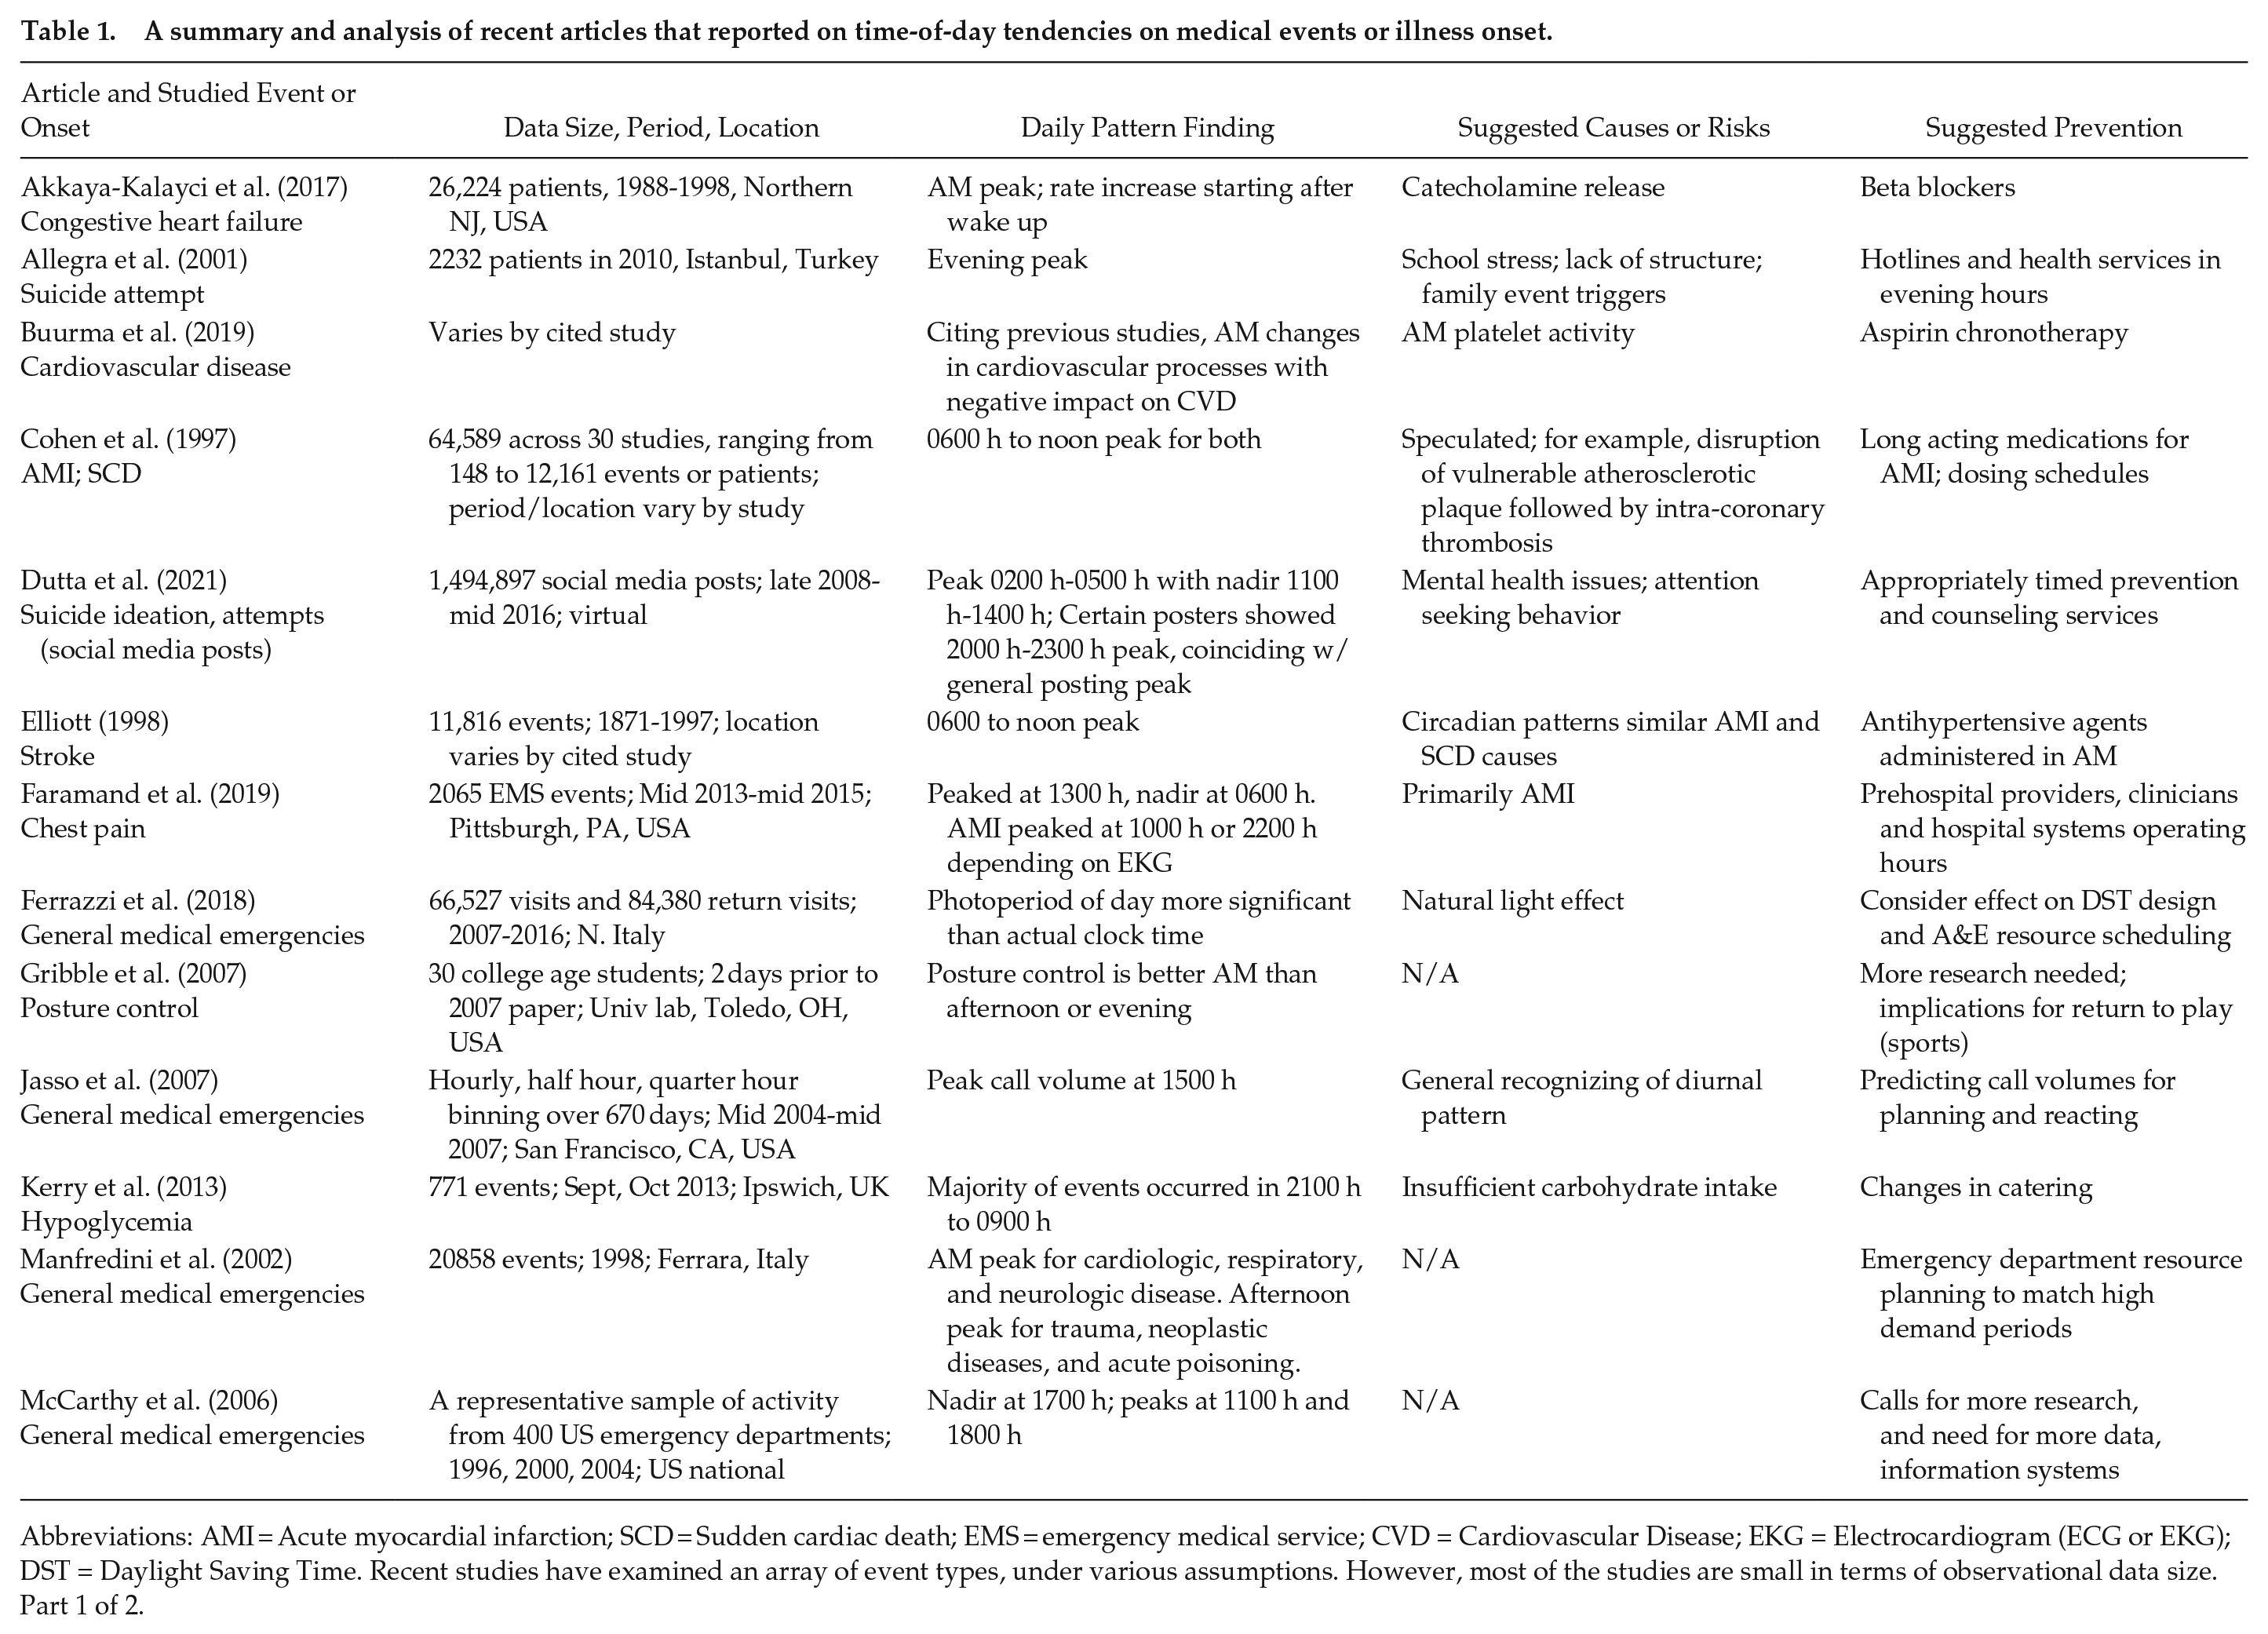
Abbreviations: AMI = Acute myocardial infarction; SCD = Sudden cardiac death; EMS = emergency medical service; CVD = Cardiovascular Disease; EKG = Electrocardiogram (ECG or EKG); DST = Daylight Saving Time. Recent studies have examined an array of event types, under various assumptions. However, most of the studies are small in terms of observational data size. Part 1 of 2.
A summary and analysis of recent articles that reported on time-of-day tendencies on medical events or illness onset.
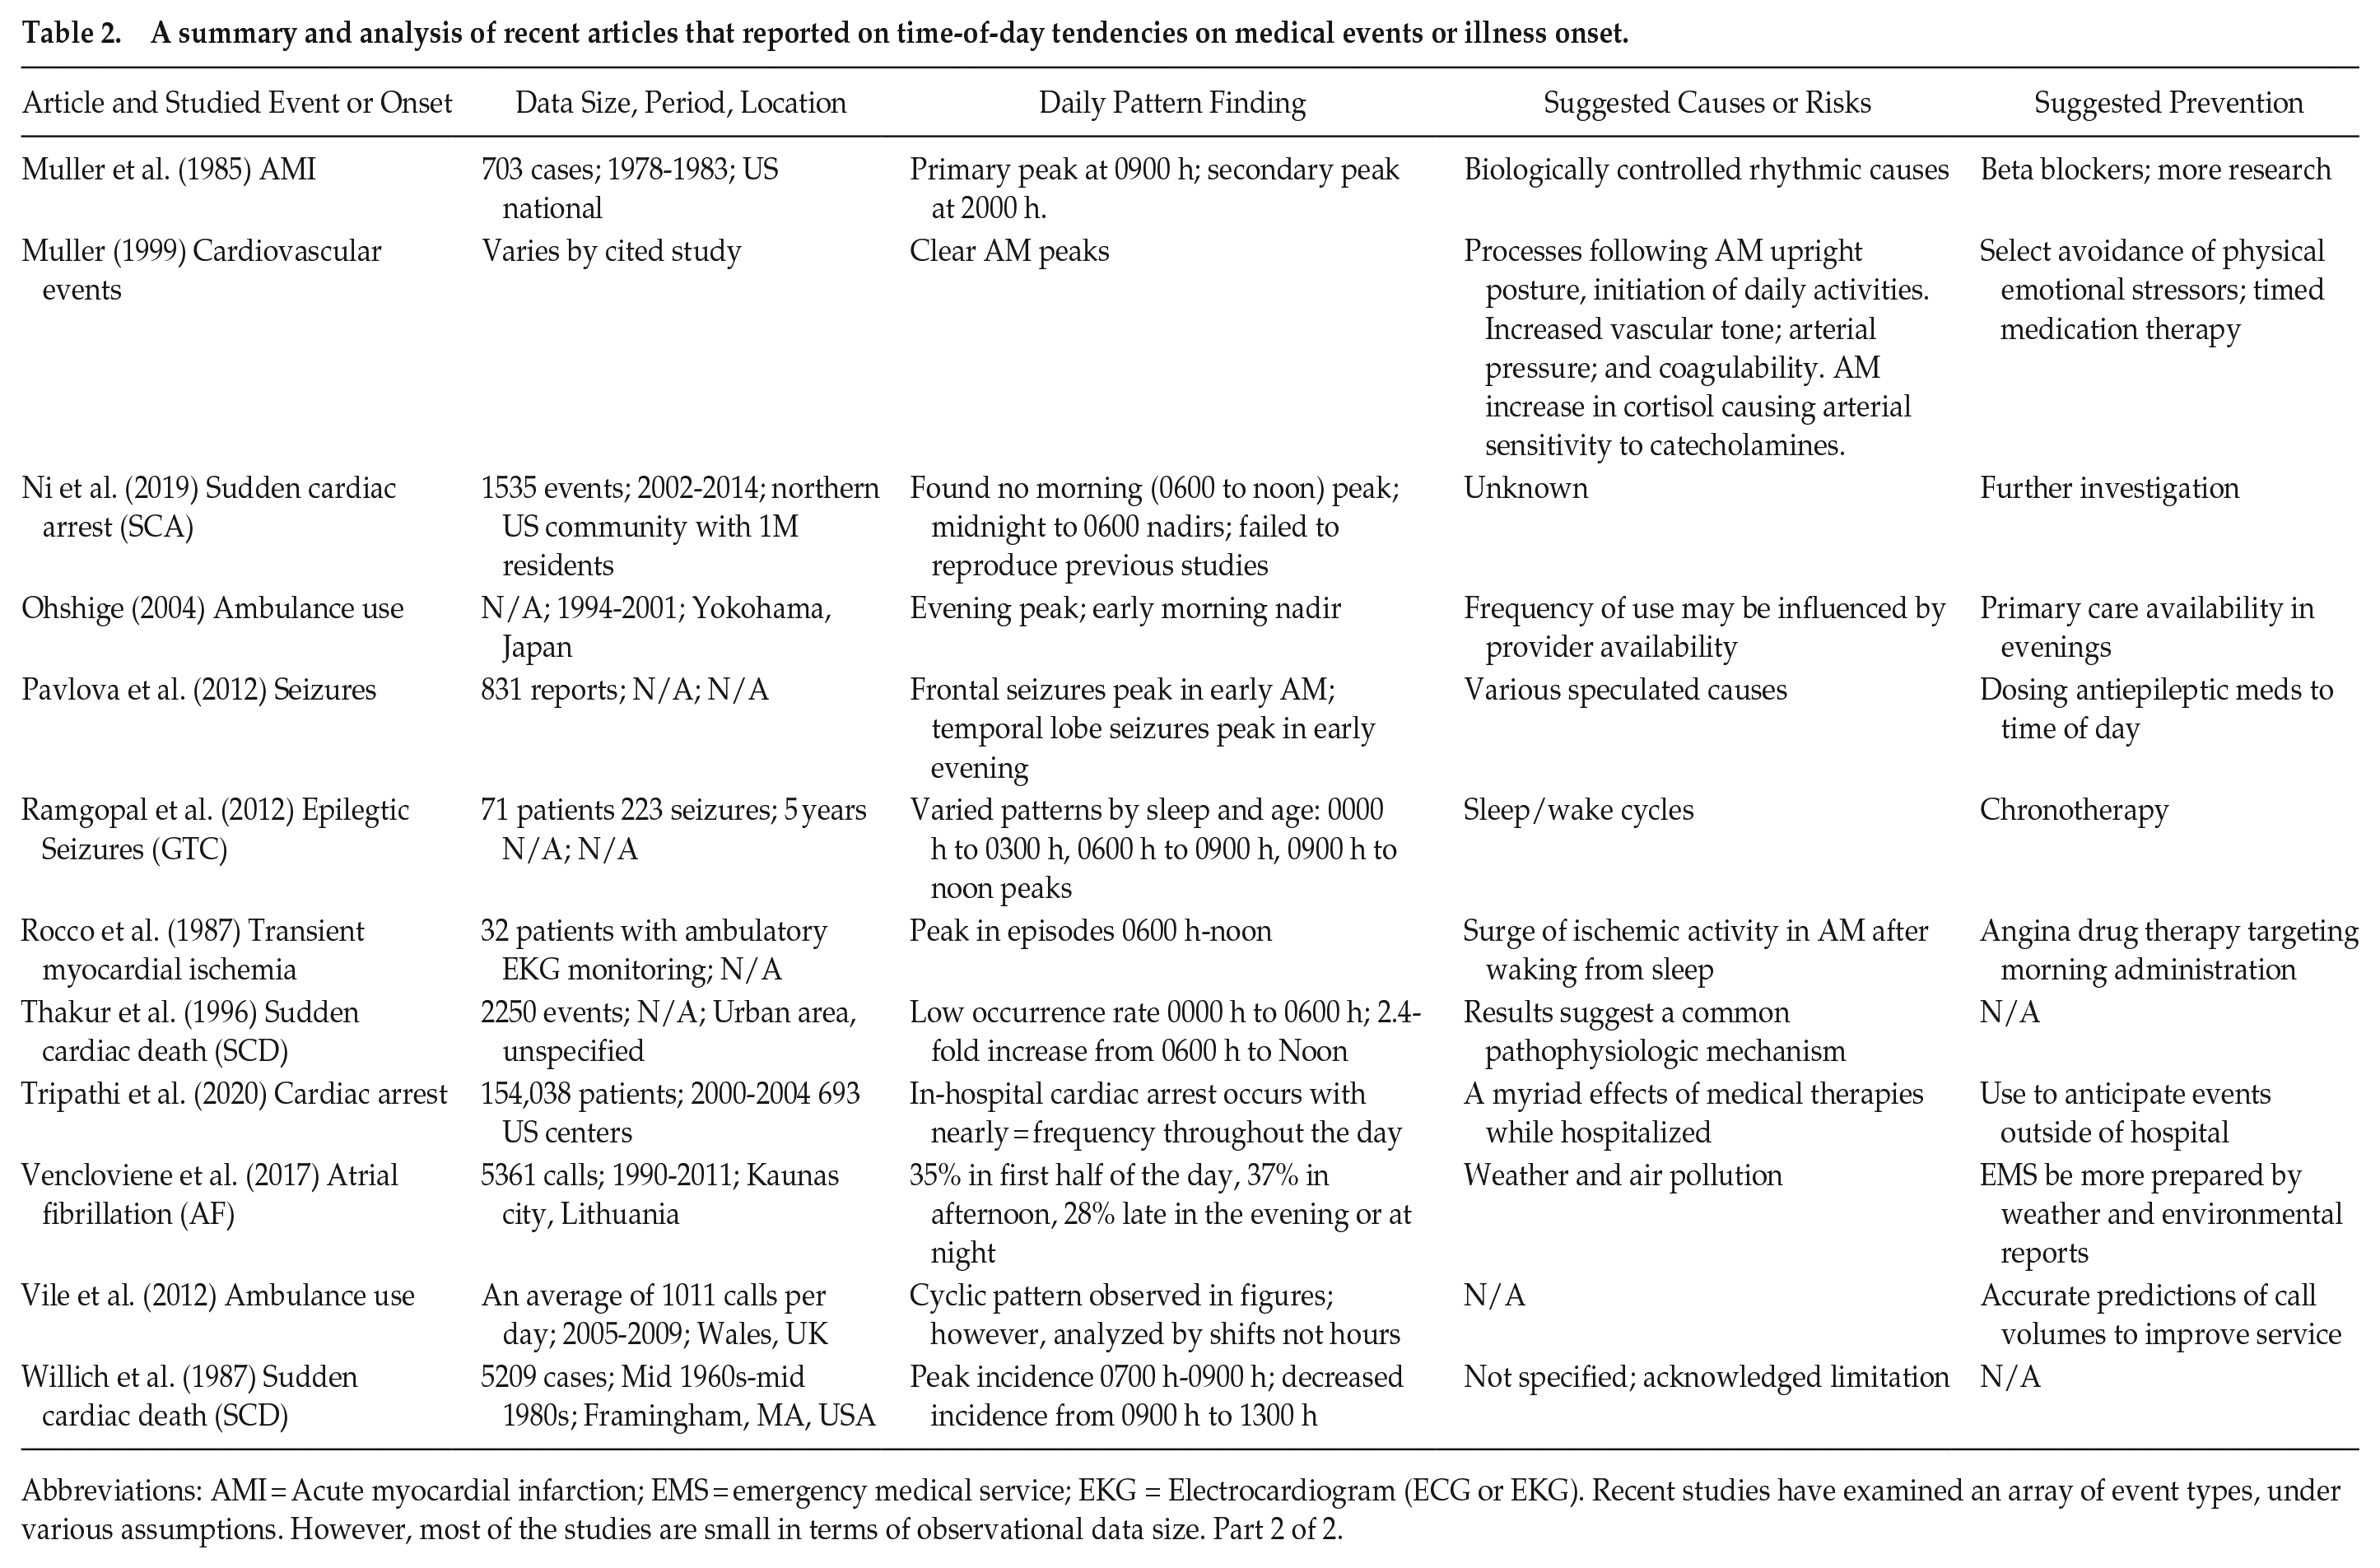
Abbreviations: AMI = Acute myocardial infarction; EMS = emergency medical service; EKG = Electrocardiogram (ECG or EKG). Recent studies have examined an array of event types, under various assumptions. However, most of the studies are small in terms of observational data size. Part 2 of 2.
The analysis in this paper is not the first attempt to describe or predict general rhythms for medical emergencies. Prior research modeled ambulance dispatch volumes (Ohshige, 2004; Vile et al., 2012), analyzed EMS events (Jasso et al., 2007; Setzler et al., 2009), and studied hospital emergency department visit patterns (Ferrazzi et al., 2018; Manfredini et al., 2002; McCarthy et al., 2006). Our analysis expands this body of literature by deriving hourly distributional models from a voluminous amount of time-stamped data. Our analysis is like that of previous approaches that organize medical emergency patterns by specific type (Ferrazzi et al., 2018). In our analysis, daily patterns are derived from the hourly occurrence distribution based on the specific time-stamped dispatch events, which are organized by chief complaints and priority symptoms.
Several recent time-of-day studies point to the potential for better outcomes in terms of human health and well-being. A number of authors suggest pharmacological intervention, usually aligning dosing with specific times of day and/or possible physiological causes or risks (Akkaya-Kalayci et al., 2017; Buurma et al., 2019; Cohen et al., 1997; Elliott, 1998; Muller et al., 1985; Muller, 1999; Pavlova et al., 2012; Rocco et al., 1987). Others posit systemic or individual behavioral interventions, such as aligning youth suicide counseling sessions to coincide with evening patterns of social media rumination and suicide attempts (Allegra et al., 2001; Dutta et al., 2021), recommending a review of carbohydrate sufficiency in hospital meals to counter timing variations of in-patient hypoglycemic events (Kerry et al., 2013), or recommending time-of-day posture control findings to optimize return-to-play after sports injuries (Gribble et al., 2007). (See Tables 1 and 2 for summaries of authors’ suggested methods of prevention.) Based on found EMS daily patterns and contrasting with previous studies, our results suggest that much further research is needed regarding causes, risks, and protections for each medical emergency category, including the investigation of reasons for consistency in the daily pattern among dissimilar event types.
To date, no researchers have recognized the broad existence of a common daily pattern for medical emergencies, nor confirmed patterns for specific cases using a national data set as extensive as National Emergency Medical Services Information System (NEMSIS). The aims of this study are to test the suitability of a general sinusoidal function, derived using ordinary least squares and linear regression on the solitary independent variable hour of day; and visualize these daily patterns to identify peak occurrences across major categories of health and across major distinguishable time periods. The methods are straightforward and provide replicable and accessible tools for researchers and practitioners.
Materials and Methods
Data Source and Heritage
We analyzed the public research data set for 13 consecutive years, 2010-2022, obtained from the NEMSIS (2022d) project. The project is a collaboration between the US National Highway Traffic Safety Administration’s Office of EMS and the University of Utah’s Technical Assistance Center. The center maintains and publishes a data standard modeled on and extending the patient care report, which is broadly used by agencies to document EMS events (American Academy of Orthopaedic Surgeons, 2021).
On an ongoing basis—beginning in 2006 with data from three states and growing to a national effort over 16 years—NEMSIS has received, stored, and shared standardized EMS data from US states and territories that in turn receive and curate event data from their individual EMS agencies. The overarching goal is to host research data to support various analyses—including evaluation of clinical interventions, performance benchmarks, and efficiency—for the improvement of pre-hospital patient care.
As recently as 2014, the NEMSIS v2 data set represented input from 45 states and approximately 72% of all EMS calls in the United States (Wei et al., 2019). A dip in state data submissions was observed after an update to the latest data standard in 2017; this was followed by alignments and adoption of the latest data standard. As of 2020, 47 states and three territories used the latest NEMSIS (2022a) data standard to provide event data for nearly 43.5 million EMS activations. By 2021, research reported in almost 1000 scholarly articles used the data set (NEMSIS, 2022d). As of 2022, 54 US states and territories contribute their data to the project (NEMSIS, 2023).
Data Description and Provenance
The NEMSIS data set, although it is a substantial collection of nearly complete EMS event activity, is an acknowledged convenience sample. Captured event data includes information from emergency management system software, such as time stamps for the receipt of the EMS call and agency assignment. It also includes monitored patient vitals such as pulse rate, oxygen level, blood pressure, outputs from various electronic devices, for example, pulse oximeter, automated blood pressure cuff, 12-lead heart monitor, and manual entry of event information such as a statement of the patient’s chief complaint recorded by paramedics or emergency medical technicians. As pre-hospital healthcare providers, paramedics and emergency medical technicians are responsible for completing a patient care report at the conclusion of each patient encounter, which begins with the EMS agency’s response, triggered by an EMS call (American Academy of Orthopaedic Surgeons, 2021). The workflow involved in a patient encounter starts with a system-generated date and time stamp that records when the call was received and when the EMS agency was dispatched. At public-safety answering points, trained call-operators who are certified emergency medical dispatchers code the reason for the call; see Table 4 (Other reasons include automated crash notification, fire, medical alarm, healthcare professional/admission, pandemic/epidemic/outbreak, standby, well person check, air medical transport, intercept, altered mental status, and no other appropriate choice). Such reasons are part of the universal standard known as the Medical Priority Dispatch System (International Academics of Emergency Dispatch, 2022), and have a near one-to-one mapping to recorded dispatch types (NEMSIS, 2022b, 2022c).
Established in 1979, the Medical Priority Dispatch System provides 33 protocols that correspond to the chief complaints reported by callers, including emergency life events related to medical conditions such as stroke, chest pain, heart problem, diabetes, convulsions/seizures, fainting, sick person, and breathing problems, as well as injuries triggered by a physical incident such as an assault, stabbing, gunshot, motor vehicle accident, fall, drowning, or electrocution, or a lightning strike, drug overdose, poisoning/ingestion, imminent (baby) delivery, and more. Emergency medical dispatchers not only facilitate the initial data-gathering but also are responsible for determining the reason category which best matches the chief complaint described by the caller and for providing pre-arrival instructions such as cardiopulmonary resuscitation steps and the administration of epinephrine, naloxone, or aspirin.
Data from patient care reports, completed by local EMS agencies, is sent to the state where it is compiled and submitted to the national public research database. This database contains all patient events provided by states in a fully de-identified form that is absent the patient’s name and address, the provider agency, the transport destination facility, and all geographic information except the US census region/division and an urban/rural indicator, so that event data is compliant with the Health Insurance Portability and Accountability Act of 1996 as well as state data agreements. While some variations in state participation and submitted data do exist (NEMSIS, 2022a), date and time stamps for EMS calls are pristine, likely because they are predominantly captured by automated public-safety management systems. Figure 1 shows the time-stamped sub-events available within the timeline of a single patient care event.
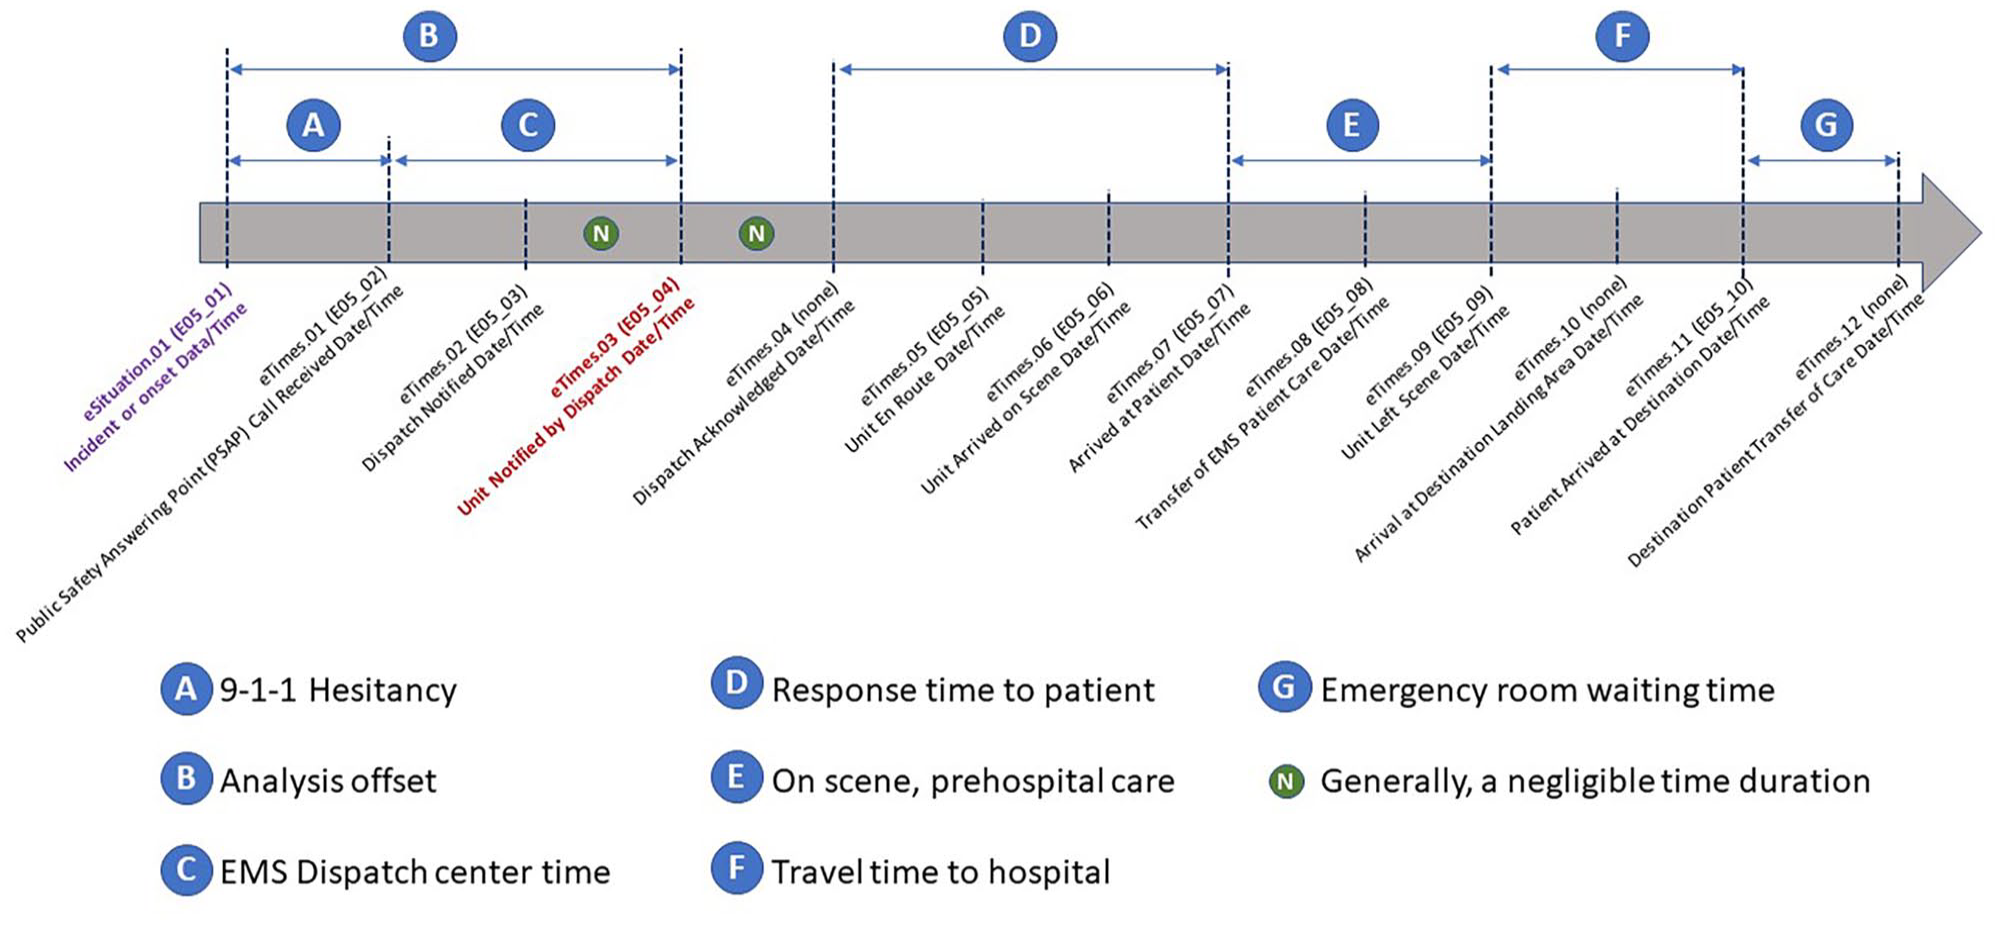
A timeline showing EMS events and activities during an activation in response to the emergency medical distress call for a single patient event. The data for time stamps and element names is from NEMSIS, described in user documentation version 3 (NEMSIS, 2022b) and, in parentheses, version 2 (NEMSIS, 2022c). eTimes.03 (E04_04) in red is the time stamped used as the event occurrence reference point for this analysis. The interval defined by B illustrates the potential time delay between symptom onset and EMS dispatch time, which is elusive due to the subjective nature of reported symptoms prior to the distress call. EMS = emergency medical services; NEMSIS = National Emergency Medical Services Information System.
Preparation of the Data for Modeling and Analysis
This subsection describes the process used in this study to organize the NEMSIS event data in preparation for various pattern exploration activities, including visualization, mathematical transformation, model fitting, and statistical analysis. Our study used data from thirteen consecutive annual releases of the public research data set, from years 2010 to 2022, totaling 311,848,450 EMS activations. A first step in the analysis involved harmonizing codes in the established protocol standards of dispatch (International Academics of Emergency Dispatch, 2022) with NEMSIS (2022b, 2022c) v2 and v3 standards. The aligned data is summarized under the 33 categories in Table 4, columns 1 and 2. For example, for the overdose/poisoning/ingestion category, 5,782,437 activations were submitted to NEMSIS over the thirteen year period.
The next step in the data preparation process was, for each category, to bin each activation based on the hour of day an EMS unit was assigned by dispatch. We used the data element for unit dispatch date/time, known by its element name as eTimes.03 in v3 (NEMSIS, 2022c) and as E05_04 in v2 (NEMSIS, 2022b). The time stamp corresponding to unit dispatch was used in this analysis because onset times are often rough estimates or are not available. It is noteworthy that public-safety call processing times are generally short. Still, call processing plus caller hesitancy (i.e., call-in delays following an incident or onset) could potentially bias the horizontal shift.
Since time stamps are recorded based on the public-safety call center location, time zone was automatically accounted for, although we note the possibility of bias within time zones. For example, Montgomery, Alabama lies approximately 1000 due east of Van Horn, Texas—both are in the US central time zone, have approximately the same hours of daylight each day, but have sunrise (and sunset) times that are more than 1 h different. That is, by the time the sun rise occurs in Van Horn, people in Montgomery will have already experienced over an hour of daylight, even though the clock time in both places is identical. Variation such as this, within time zones, can explain variance in peaks and nadirs in processes that are governed by exposure to daylight.
The binning process converted the 311,848,450 activations to 113,952 bins for each of the 33 categories—that is, 1 bin for each hour in the period from midnight on January 1, 2010, to midnight on December 31, 2022, or 4748 days times 24 h. The set of 113,952 binned observations, corresponding to hourly dispatches for a given category over the 13 years, is called a horizon data set for this analysis. A final step in the preparation process was to summarize each category by a set of 24-hourly occurrence frequency bins, which is called a 24-h compressed data set.
Modeling and Analysis Methodology
Once the data was prepared into hourly bins, the analysis proceeded by first using visualization to examine the daily pattern shapes for each medical emergency dispatch type via hourly histograms, also known as discrete empirical distributions. From the visualizations, we recognized a strong presence of a sinusoidal function, with a single peak and nadir during a 24-h period, across all categories. This pattern was formalized by using sinusoidal regression to fit a model for each category, which allowed us to statistically test parameter significance, to assess overall goodness-of-fit, and to observe the degree to which variance was described by each model. An Appendix of this paper describes detailed steps for transforming data that graphically exhibits a nonlinear sinusoidal form. The transformation allows for the direct use of standard linear regression techniques.
To compare models across categories, we graphed peak and nadir times along with 95% confidence and prediction limits. Determining the peak and nadir point estimates used a small amount of calculus: We set the first derivative of each fitted sinusoidal function to zero and solved to find the maximum and minimum points, respectively. Confidence and prediction limits for these points were computed next. Various methods for estimating calibration limits from a regression model are available (Lin and Liu, 2005; Ng and Pooi, 2008); we chose to use a method known as “Single-Use Calibration Intervals” for its simplicity (National Institute of Standards and Technology, 2012, Section 4.5.2.1).
To assess variation from a normative (or reference) pattern, that is, a nearly common shape across all medical emergency dispatch categories, we computed the empirical cumulative distribution function CDF for each type. The CDF for each category was visualized alongside a reference pattern constructed from observations outside the targeted category. Pairwise statistical comparisons were performed via two-sample Kolmogorov-Smirnov (Massey, 1951; Boo et al., 2018) and Cramér-von Mises (Anderson, 1962) tests, as well as Chi-Square (Moore, 1986; Ross, 2014) tests and the Wasserstein metric which is also known as the Earth Mover’s distance (Duda, 2018).
After analyzing the daily pattern by the 33 medical emergency dispatch types, we followed the same methodologies to examine daily patterns for the data set reorganized into monthly, seasonal, daylight-savings/civil time, and pre-/post-COVID-19 periods. Motivated by the fact that the 33 medical emergency types follow from chief complaint and priority symptoms observed by dispatch, and thus do not represent final diagnoses, we investigated the pattern of a medical emergency that is uniquely diagnosed in the field: acute myocardial infarction (heart attack). The next sections provide the results of analyses as well as discussion and conclusions.
Results
Our study analyzes hourly occurrence patterns from 311,848,450 events over a 13-year period, sourced from NEMSIS; see Table 3. Our analyses show that a sinusoidal equation fits all emergency dispatch categories, establishing the notion of a common, predictable daily pattern of rhythms at the population level. We found that daily EMS patterns for acute myocardial infarction (heart attack), chest pain, heart problems, stroke, convulsions and seizures, and sudden cardiac arrest/death exhibit peak occurrences in the early to mid afternoon, in contrast to previously found morning tendencies. Our analysis of the daily pattern for heart attack is based on field diagnoses by 12-lead cardiac monitor.
List of the number of EMS activations captured in the NEMSIS public research data set for years 2010-2022.
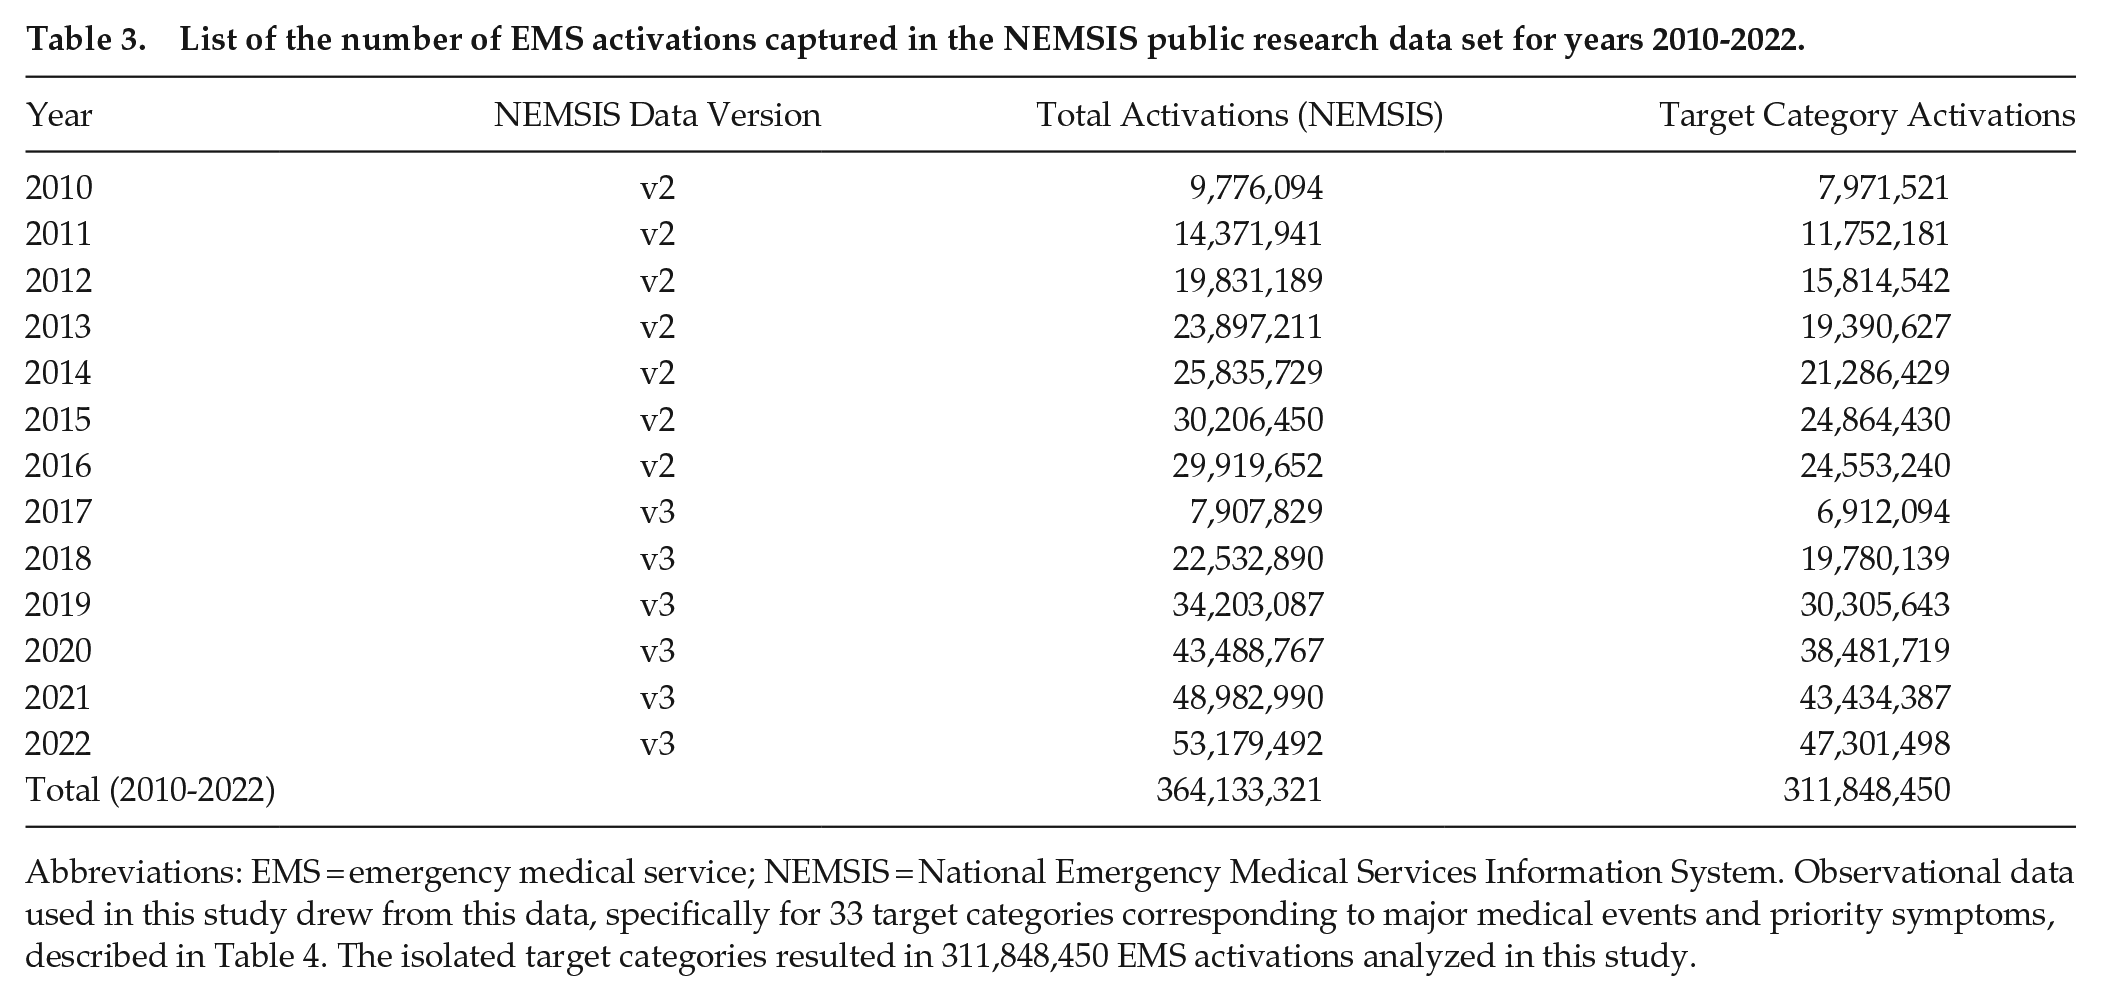
Abbreviations: EMS = emergency medical service; NEMSIS = National Emergency Medical Services Information System. Observational data used in this study drew from this data, specifically for 33 target categories corresponding to major medical events and priority symptoms, described in Table 4. The isolated target categories resulted in 311,848,450 EMS activations analyzed in this study.
The number of total activations used in model building ranged from just over 72,000 (electrocutions and lightning strikes) to more than 52 million (general sick person), per category, for the thirteen years covered by the NEMSIS data set. With the exception of 2 previous studies, one of comparable size which was really a meta-analysis of 30 studies (Cohen et al., 1997) and one which is roughly twice the size of our smallest (Tripathi et al., 2020), the patient event numbers used to model the daily patterns in our investigation dwarf sizes of studies cited in Tables 1 and 2. In the data, there were more than half a million activations for almost 85% of the medical event categories; three quarters had more than one million activations; and nearly 30% had more than 10 million activations; see Table 4.
A list of the 33 targeted medical event dispatches within scope of this study, along with a description of the elements used to isolate them within NEMSIS public research data set, 2010-2022.
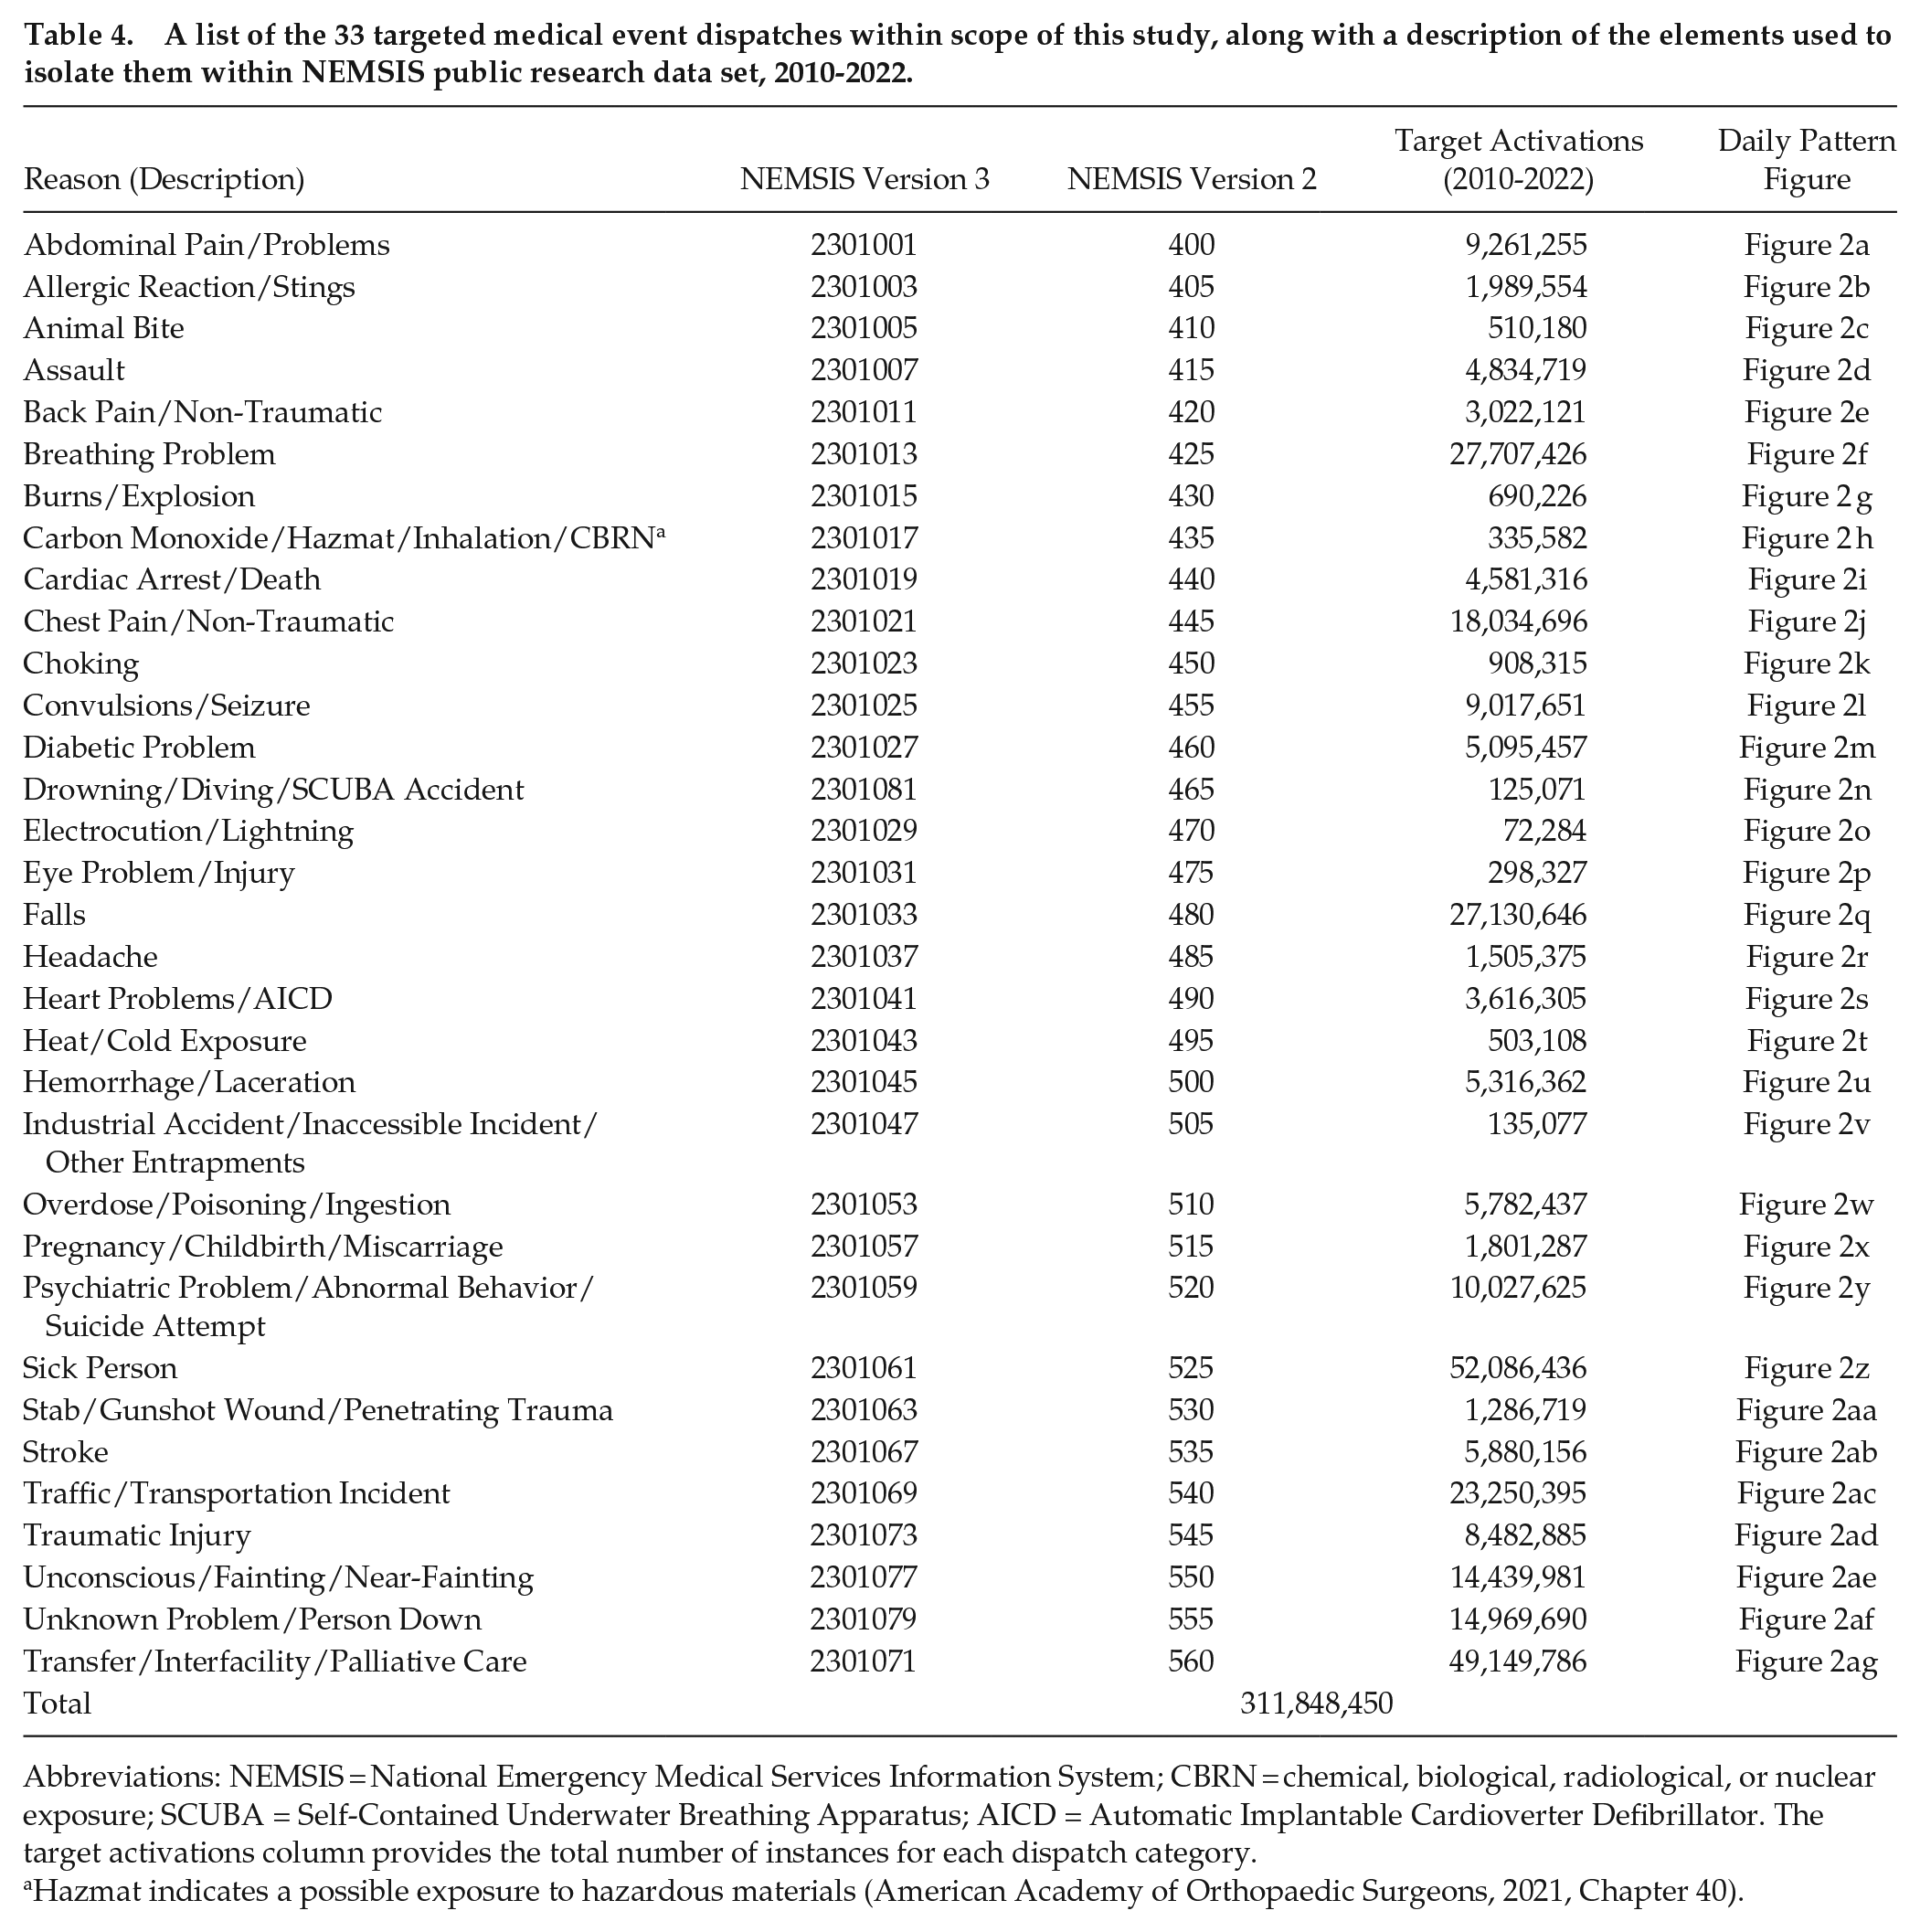
Abbreviations: NEMSIS = National Emergency Medical Services Information System; CBRN = chemical, biological, radiological, or nuclear exposure; SCUBA = Self-Contained Underwater Breathing Apparatus; AICD = Automatic Implantable Cardioverter Defibrillator. The target activations column provides the total number of instances for each dispatch category.
Hazmat indicates a possible exposure to hazardous materials (American Academy of Orthopaedic Surgeons, 2021, Chapter 40).
Figure 2a-2ag shows the visualizations of the daily patterns, based on hourly call frequencies, for each medical emergency category described in Table 4, together with the fitted parameters for the sinusoidal equation. Table 5 provides the results of the 33 sinusoidal regressions, one row per medical emergency category. Regression parameter estimation, together with the visualizations, confirmed the strong daily sinusoidal form, with 24-h cycles, peaks, and nadirs across all types. All 33 models have statistically significant coefficient estimates at the
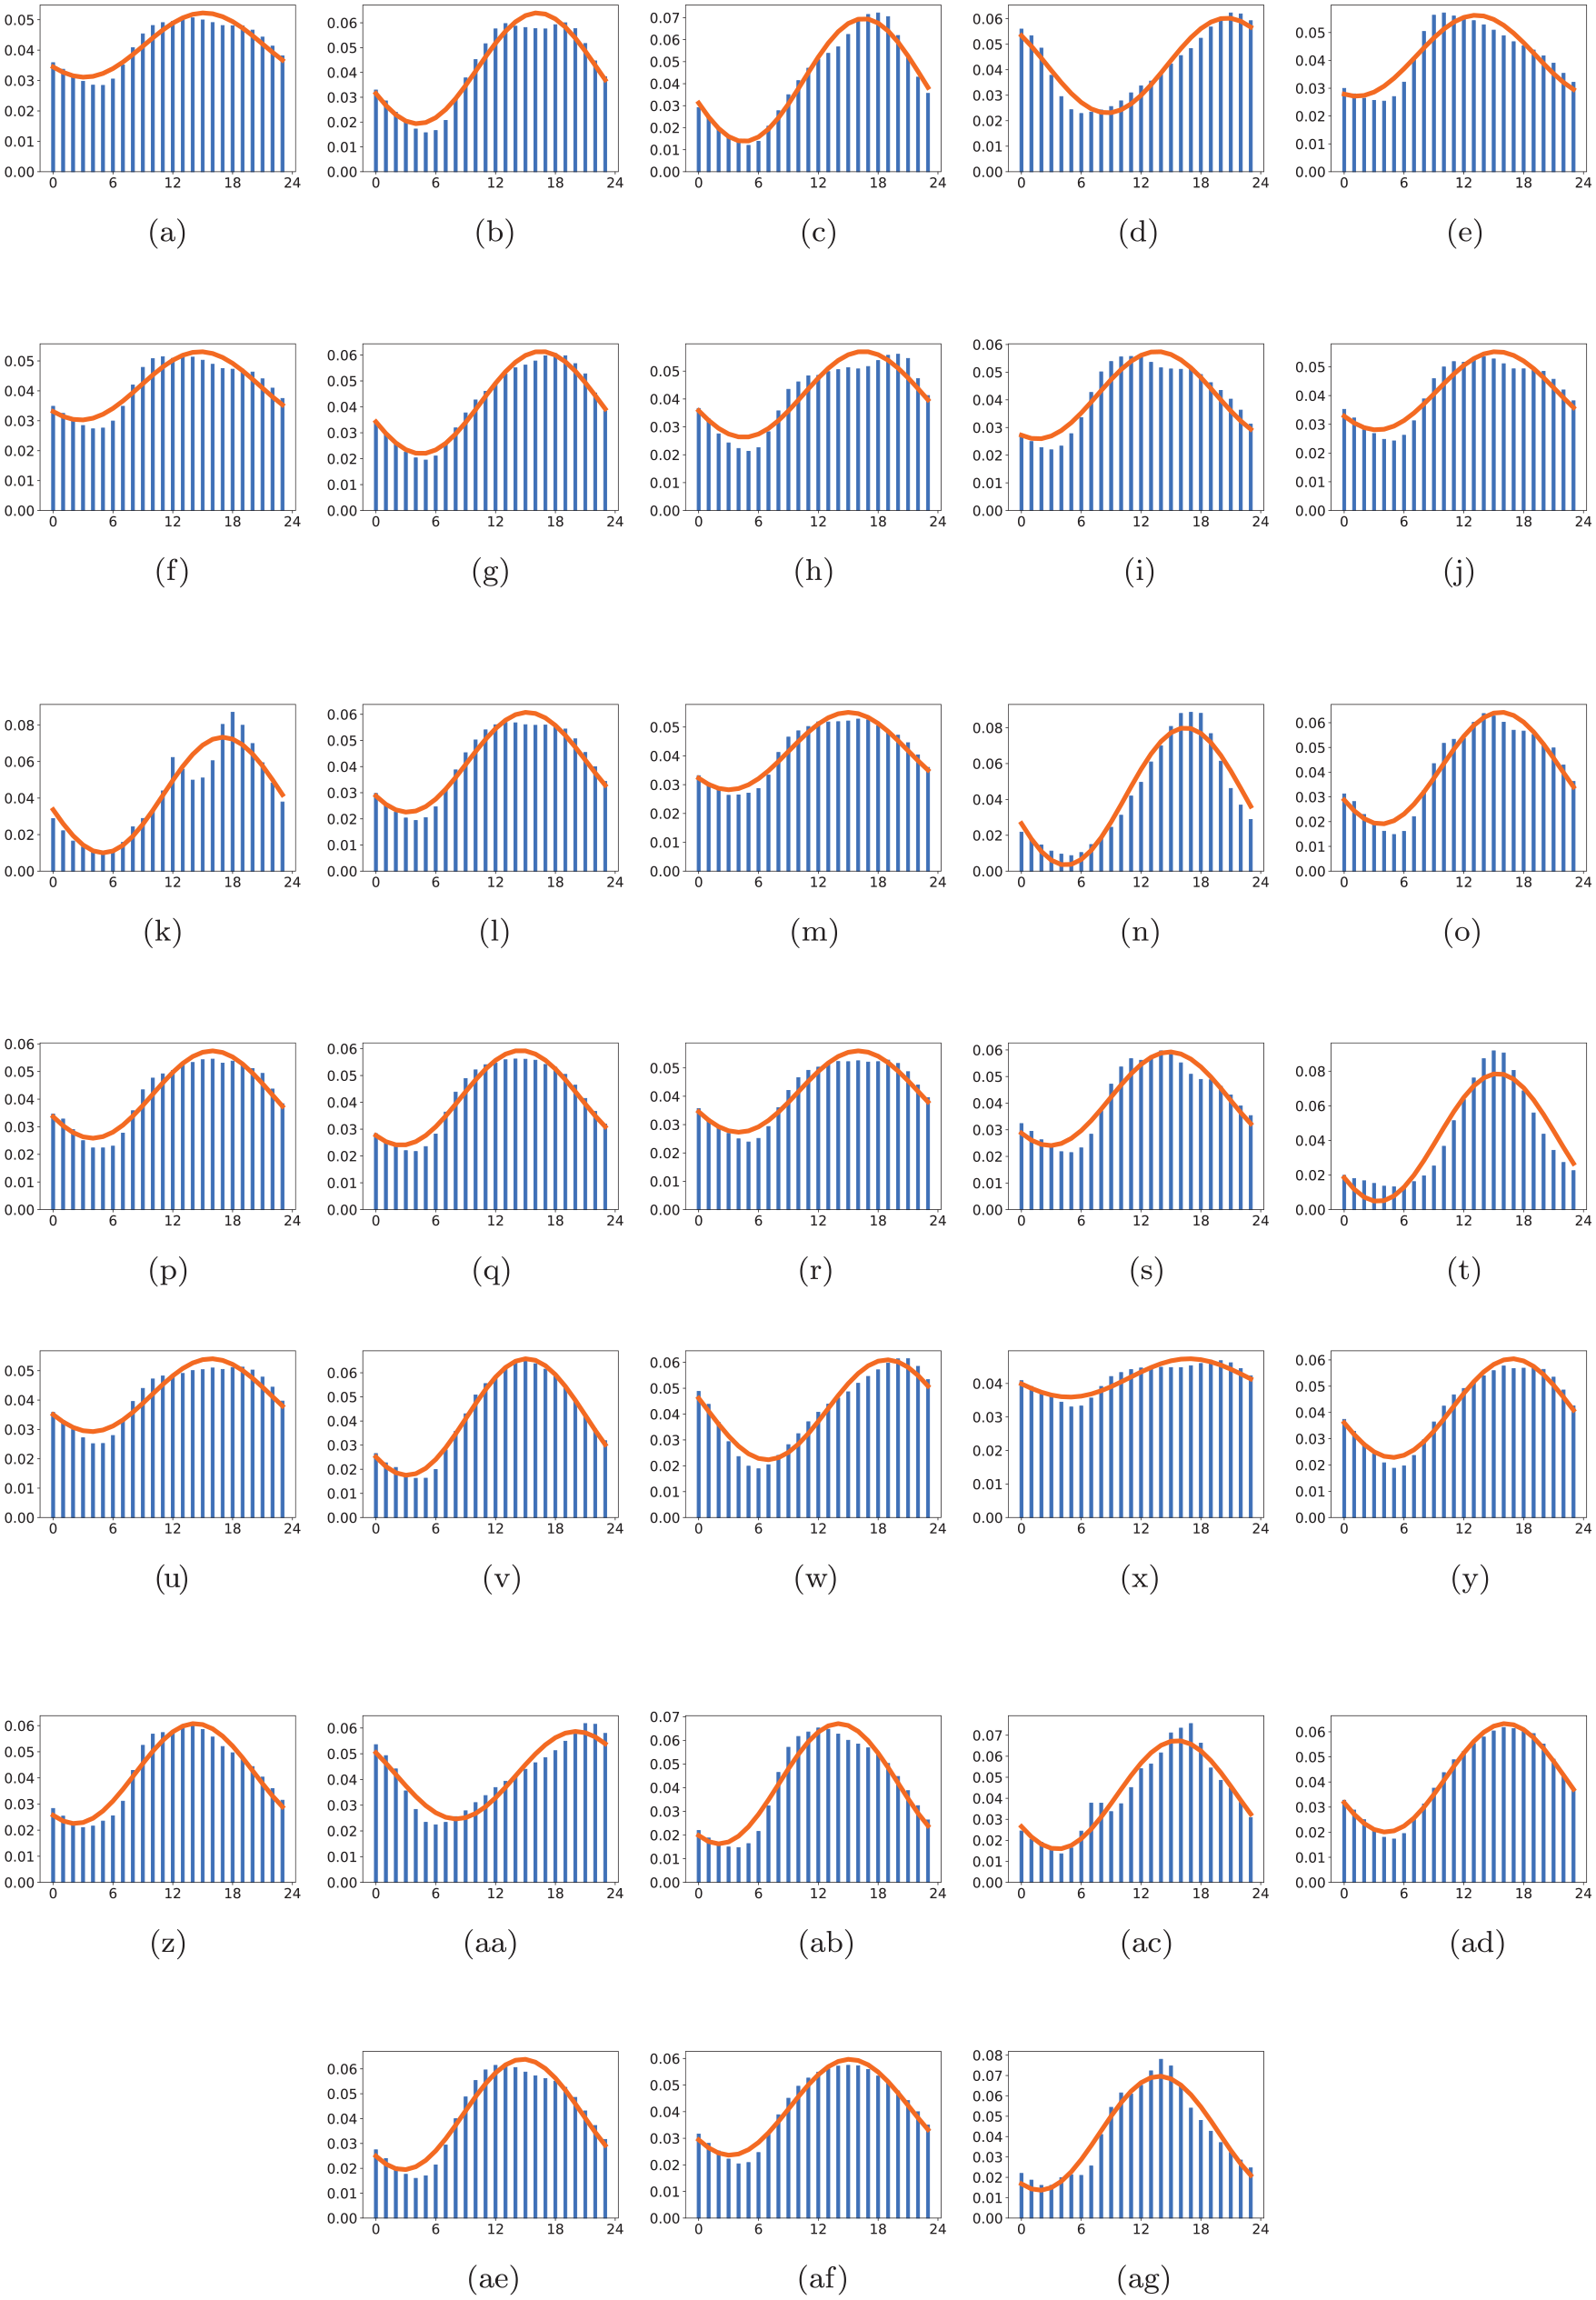
Daily patterns for all 33 NEMSIS dispatch types, derived from sinusoidal regression.
Summary of sinusoidal regression results for the 33 targeted NEMSIS dispatch types. All coefficients are statistically significant, most at the
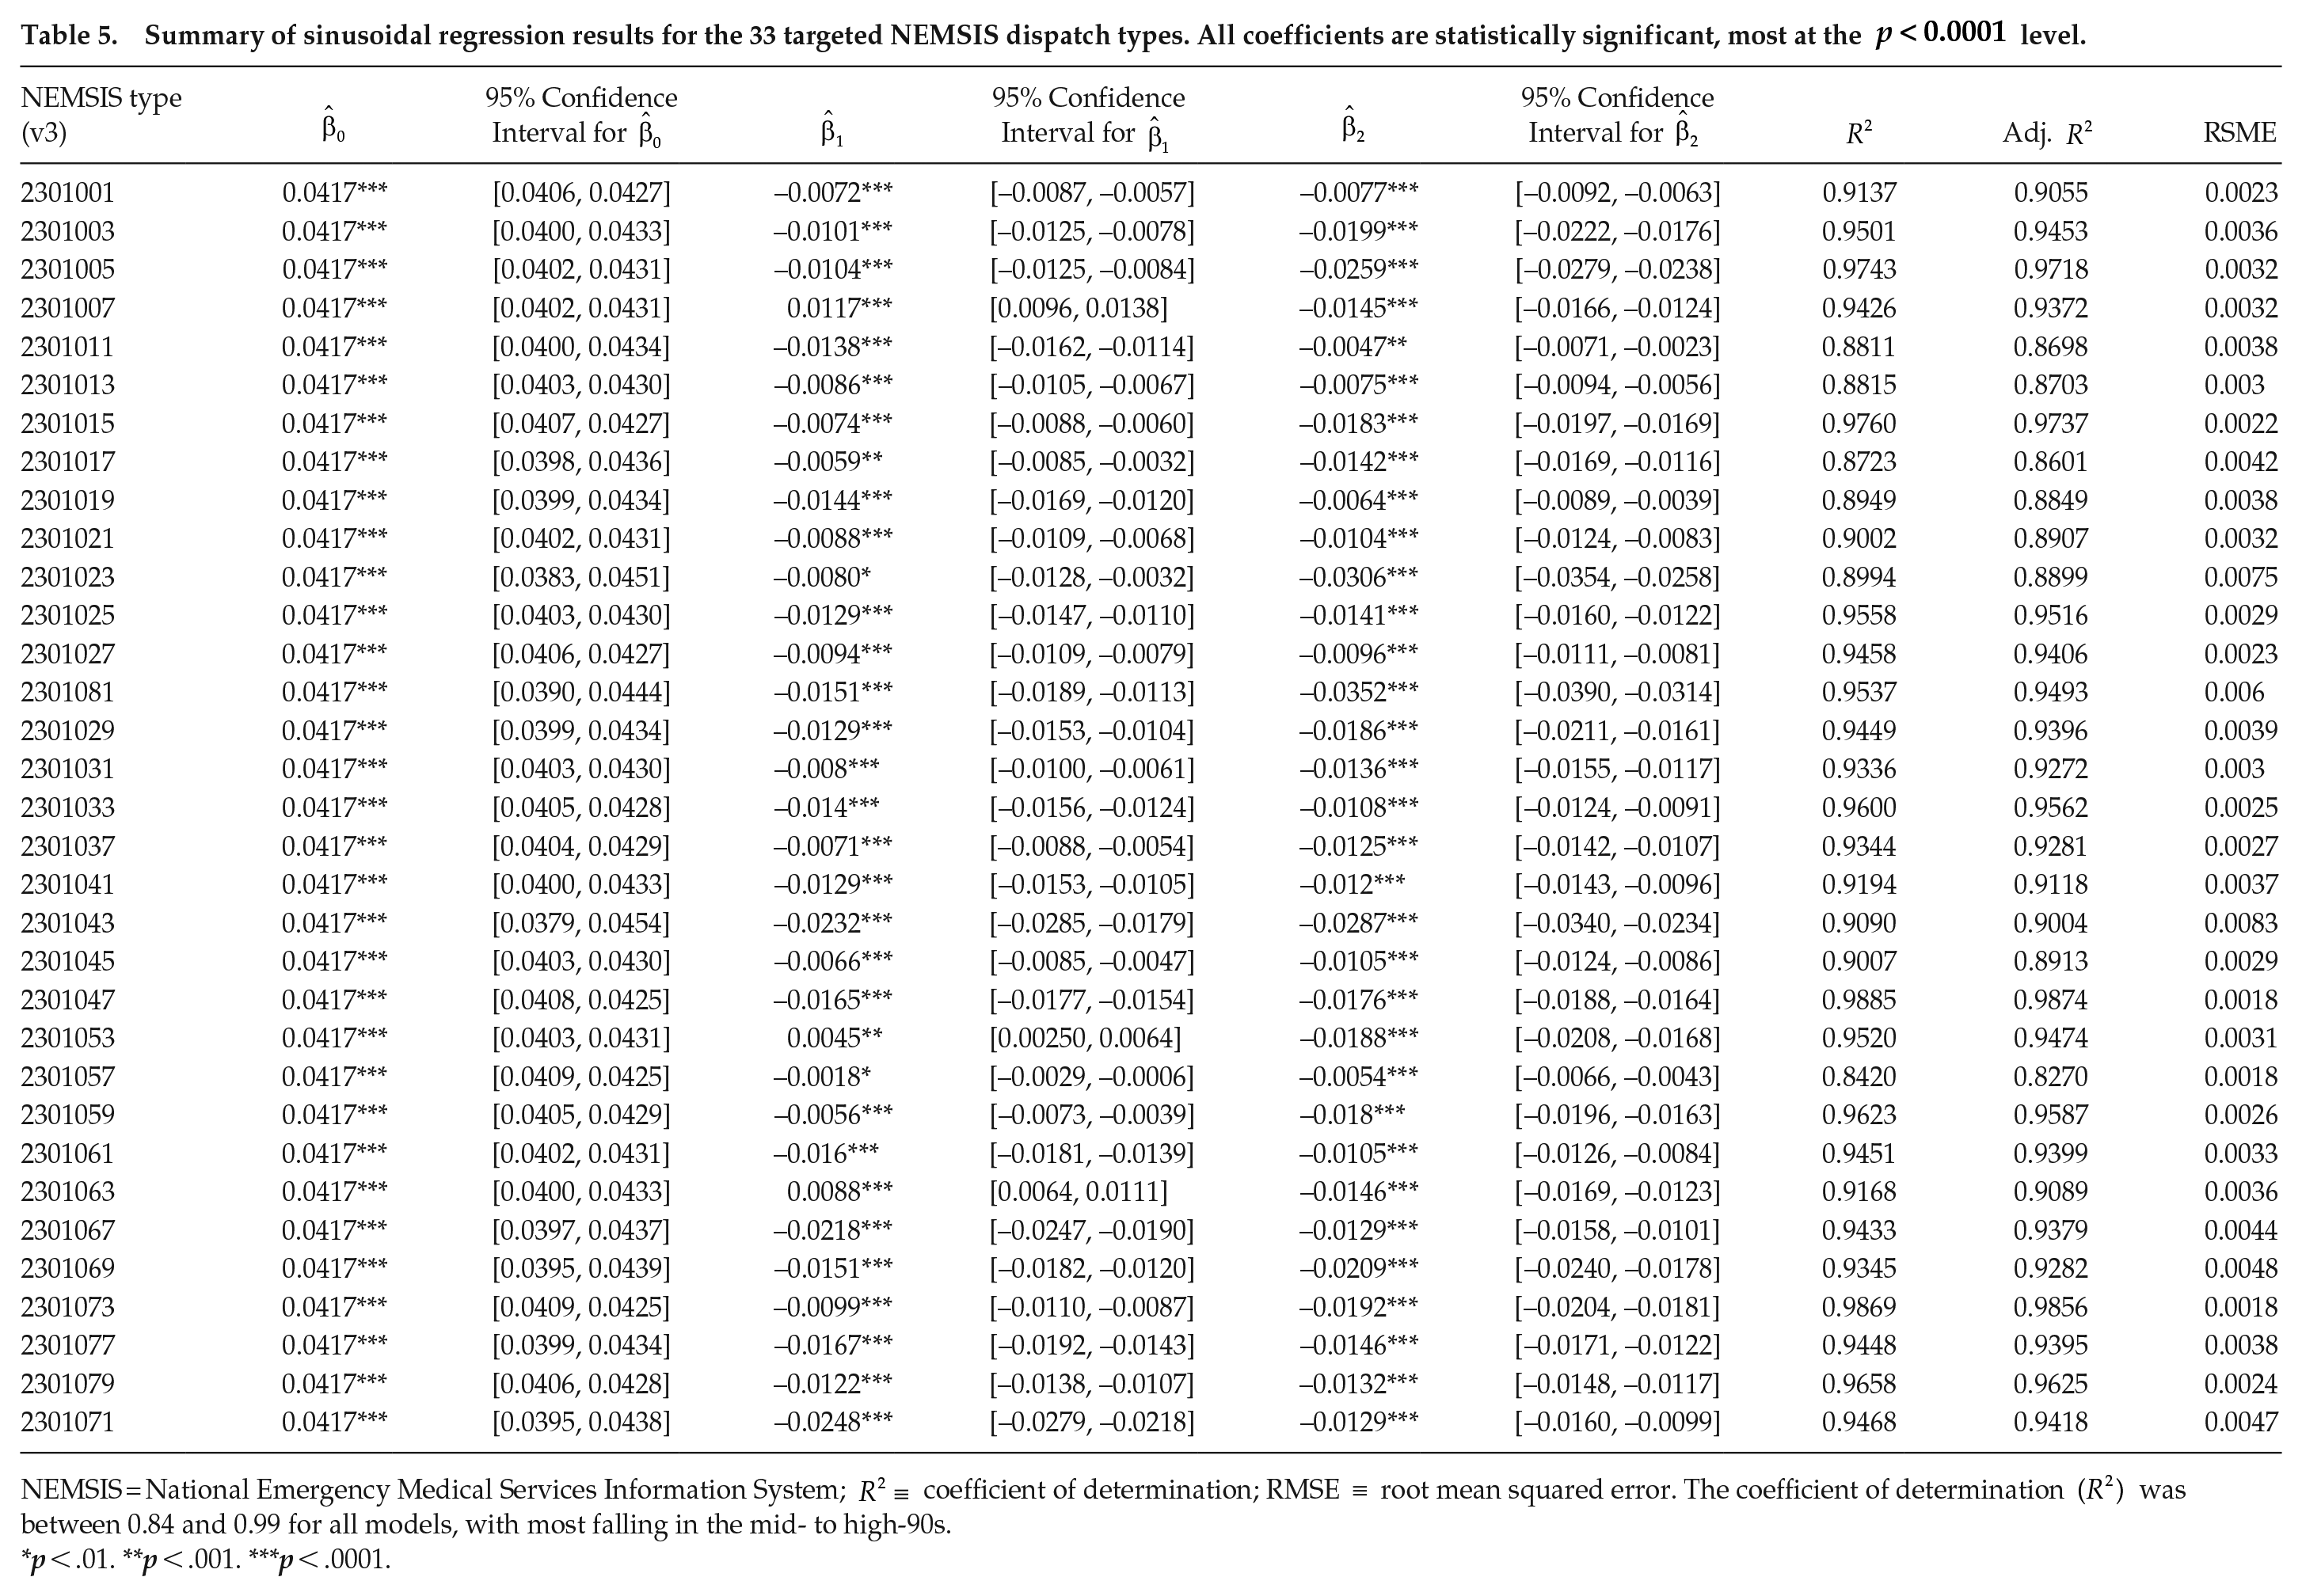
NEMSIS = National Emergency Medical Services Information System;
p < .01. **p < .001. ***p < .0001.
The coefficient of determination,
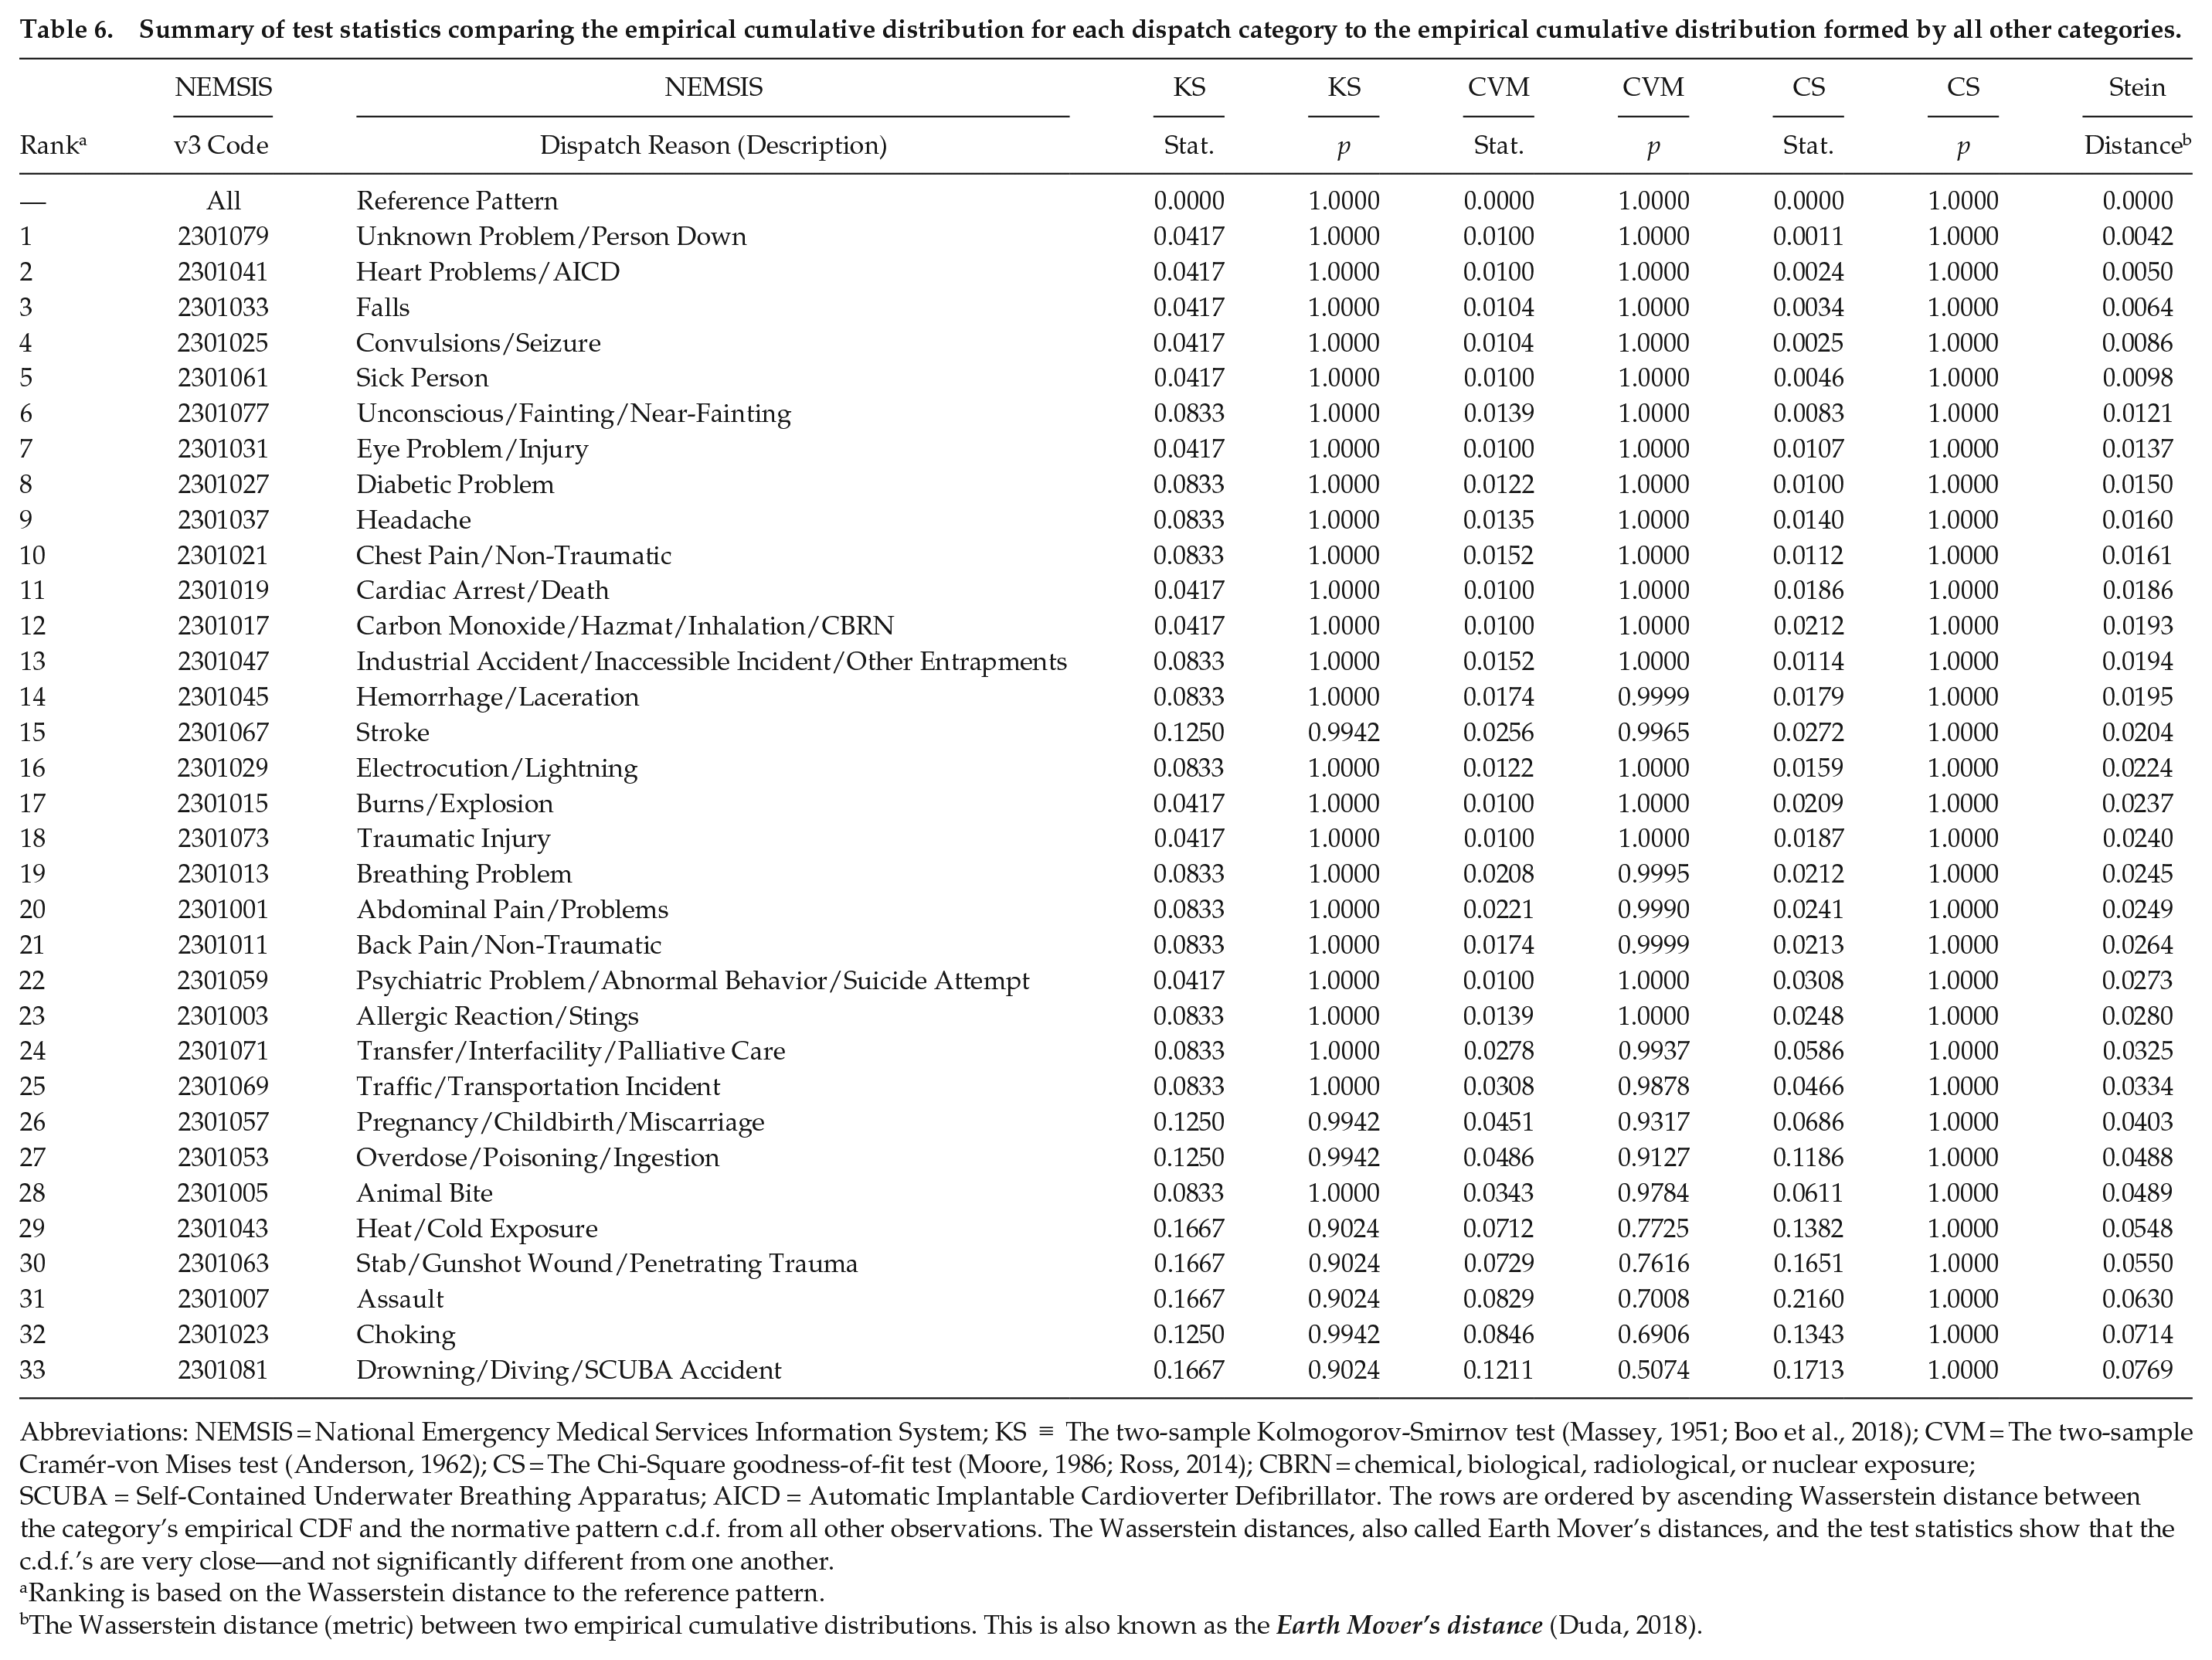
The timelines shown in Figure 3 illustrate the peak and nadir for each of the 33 daily medical emergency time-of-day patterns, along with corresponding confidence and prediction interval estimates. This figure underscores the consistency of the daily patterns of medical emergencies and shows that all but three have confidence and prediction intervals that span the afternoon. The visualization and sinusoidal regression results indicate a common, normative daily pattern across medical emergency dispatch categories. Visualizations comparing the empirical CDF for each medical event category to a normative distribution formed by all other event data are given in Figure 4, with statistical comparisons in Table 6. While there are subtle deviations in the pairwise visual comparisons of some CDFs, the statistical comparisons show no significant differences.
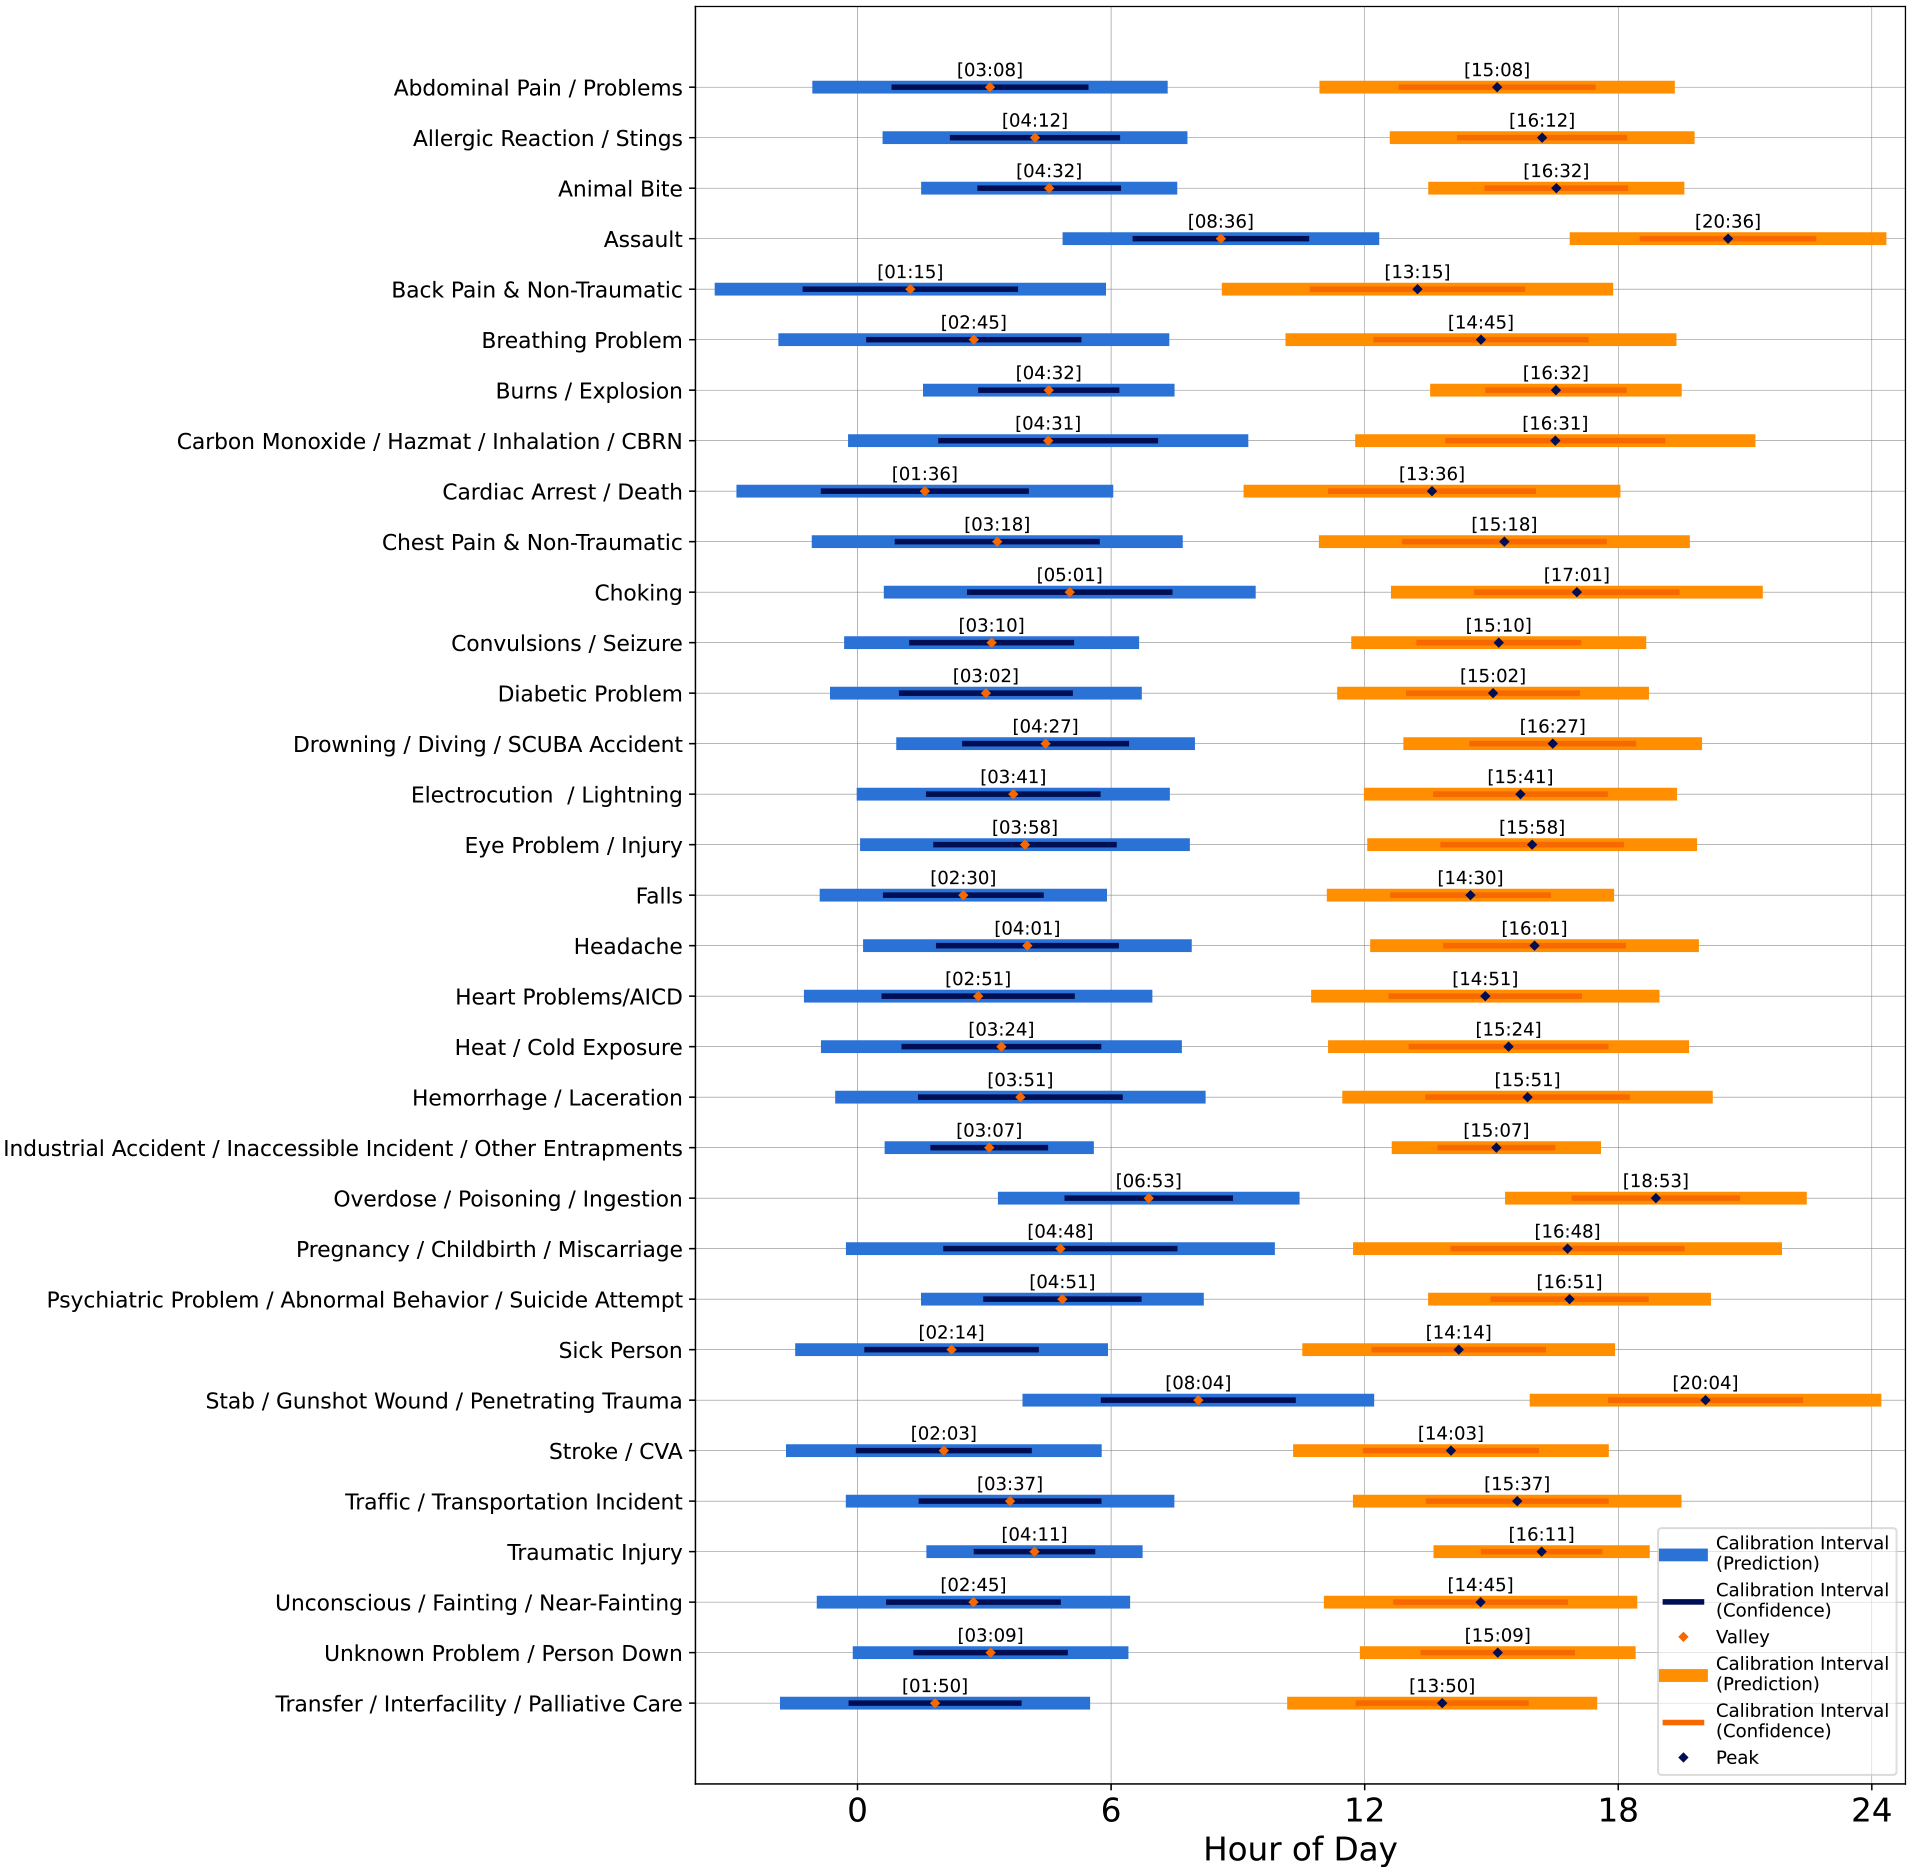
Peak and nadir times of day for each of the 33 targeted dispatch types, shown with calibrated intervals derived from the 95% prediction limits and 95% confidence intervals. The peak and nadir times are found via the first derivative of the fitted sinusoidal function for each type. Intervals are estimated using the standard error from the regression model. Abbreviations: CBRN = chemical, biological, radiological, or nuclear exposure; SCUBA = Self-Contained Underwater Breathing Apparatus; AICD = Automatic Implantable Cardioverter Defibrillator; CVA = Cerebral Vascular Accident (stroke).
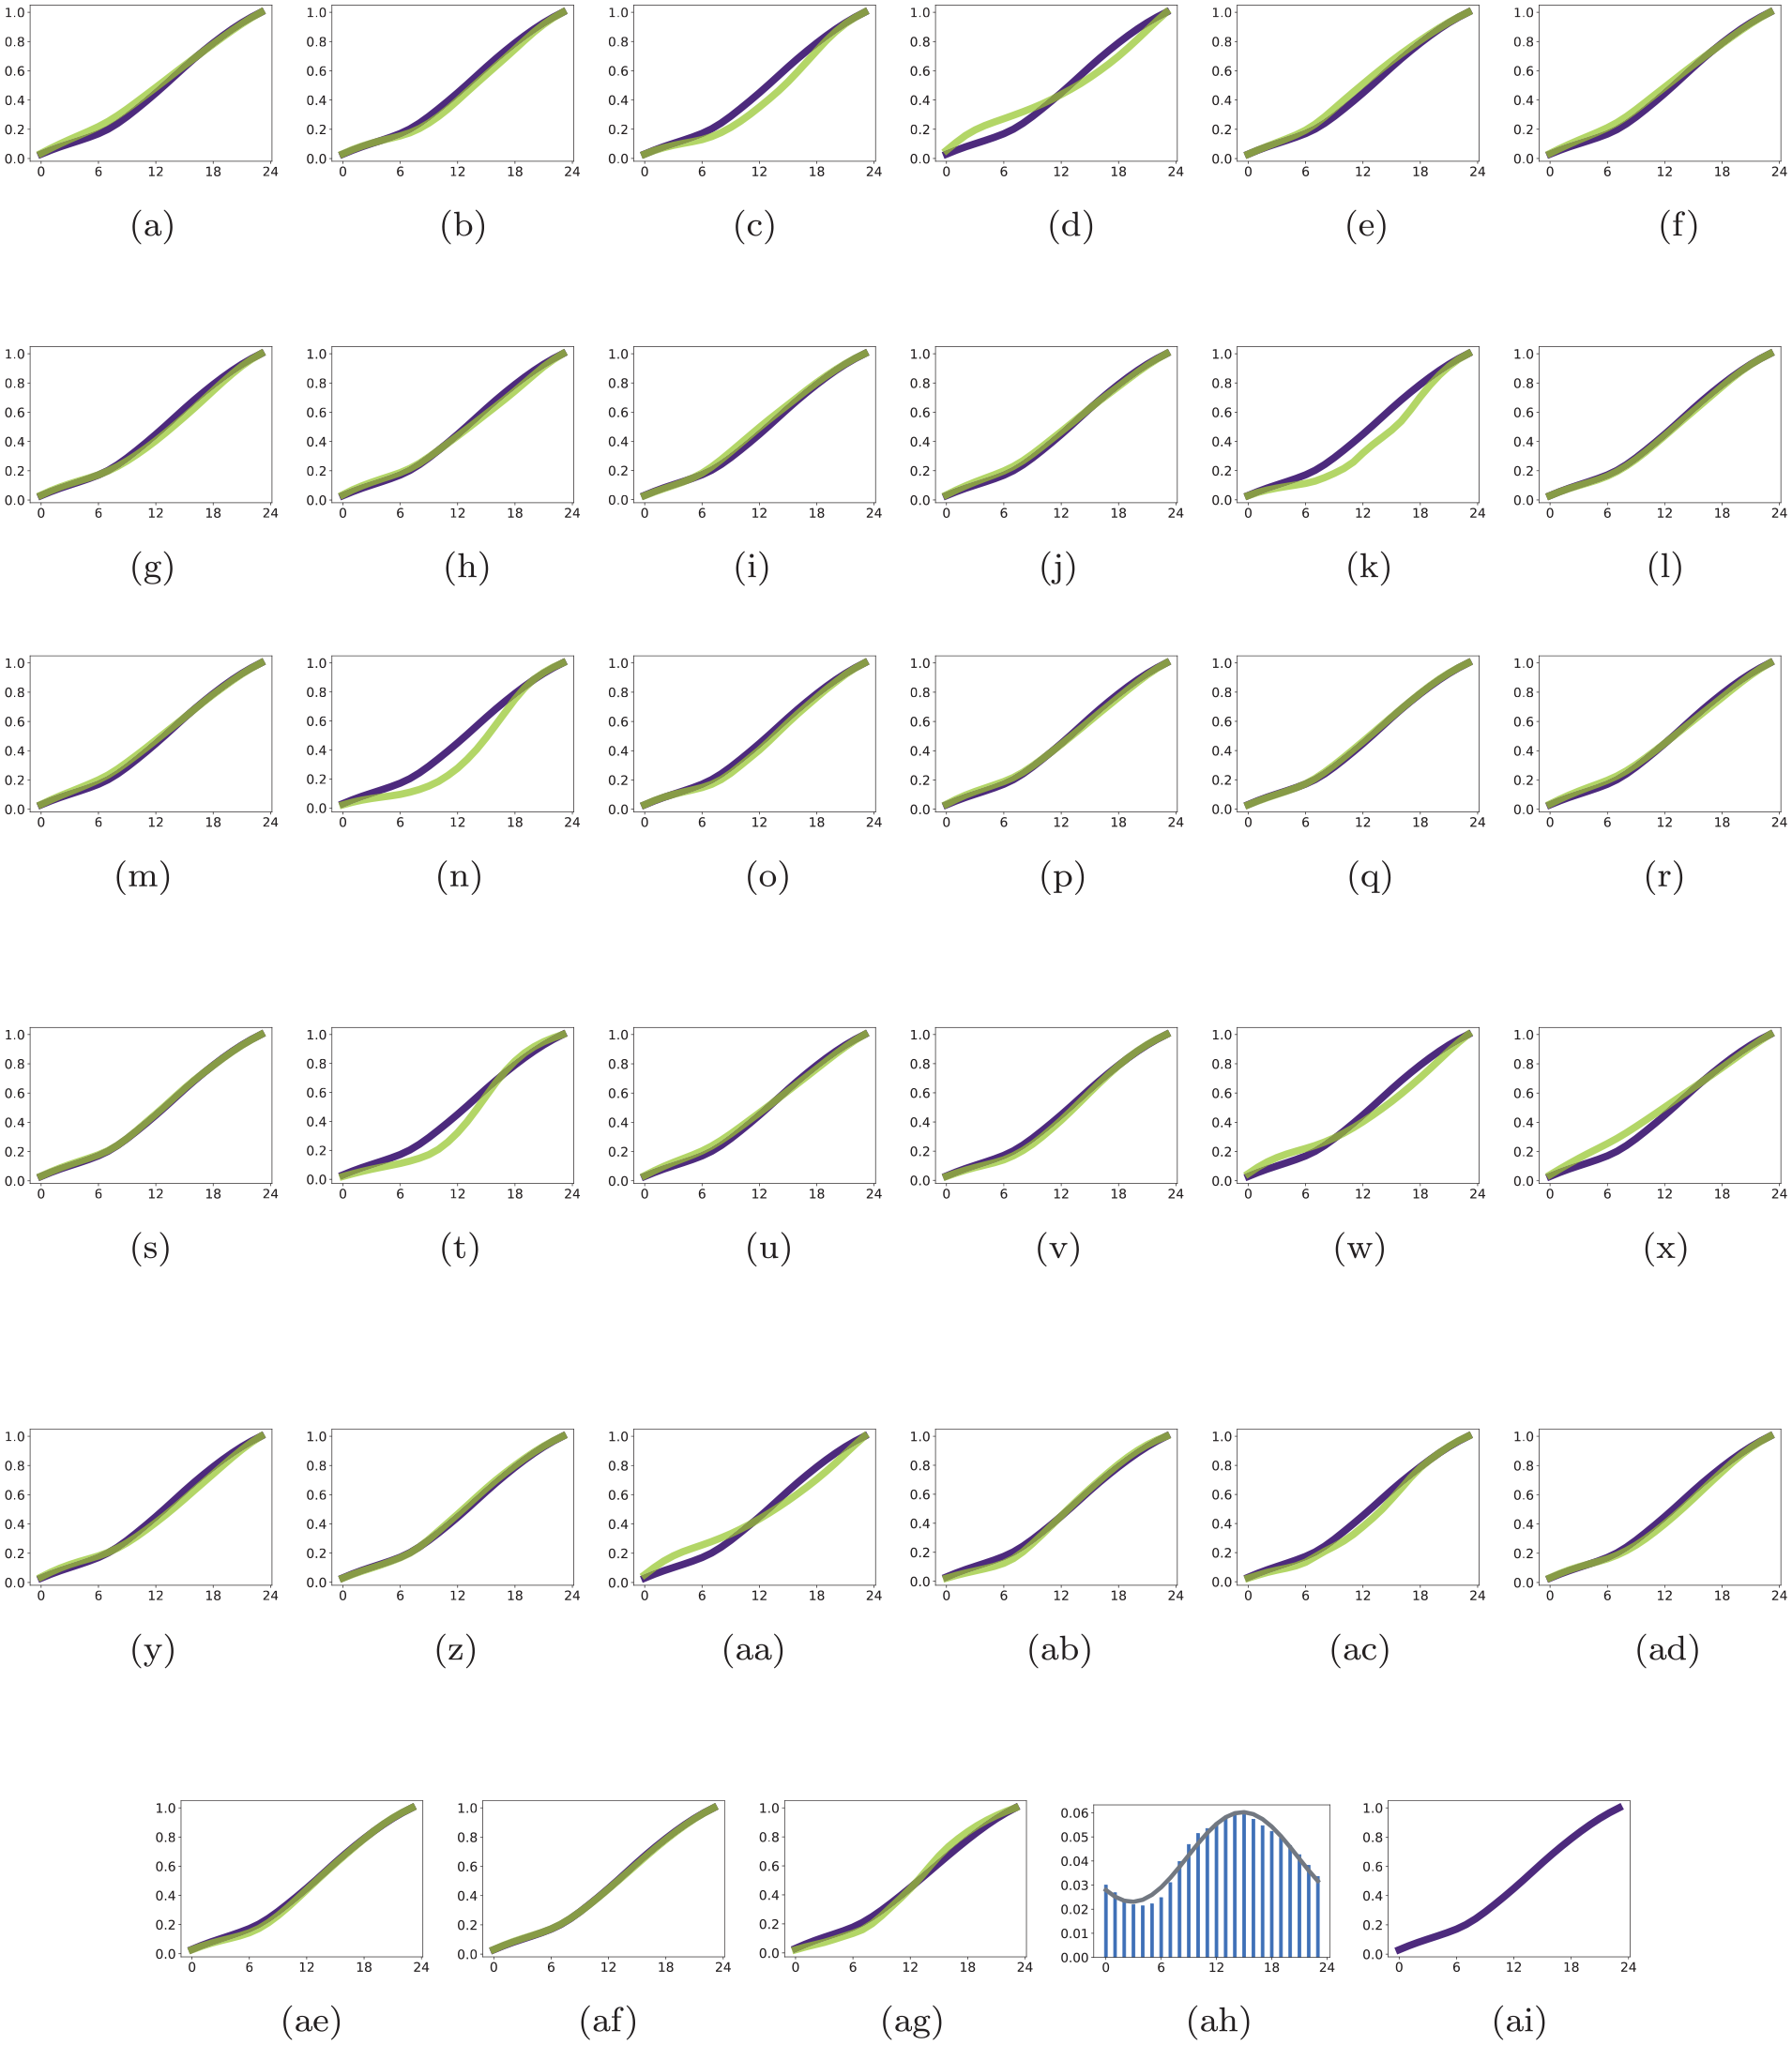
Visual comparison of each dispatch category’s hourly empirical cumulative distribution (in green) with the empirical distribution from all other categories (in purple). Figure 4ah and 4ai are the overall histogram and cumulative distribution, that is, the reference pattern. (a) Abdominal Pain/Problems. (b) Allergic Reaction/Stings. (c) Animal Bite. (d) Assault. (e) Back Pain/Non-Traumatic. (f) Breathing Problem. (g) Burns/Explosion. (h) Carbon Monoxide/Hazmat/Inhalation/CBRN. (i) Cardiac Arrest/Death. (j) Chest Pain/Non-Traumatic. (k) Choking. (l) Convulsions/Seizure. (m) Diabetic Problem. (n) Drowning/Diving/SCUBA Accident. (o) Electrocution/Lightning. (p) Eye Problem/Injury. (q) Falls. (r) Headache. (s) Heart Problems/AICD. (t) Heat/Cold Exposure. (u) Hemorrhage/Laceration. (v) Industrial Accident/Inaccessible Incident/Other Entrapments. (w) Overdose, Poisoning. (x) Pregnancy/Childbirth/Miscarriage. (y) Psychiatric/Abnormal Behavior/Suicide Attempt. (z) Sick Person. (aa) Stab/Gunshot Wound/Penetrating Trauma. (ab) Stroke. (ac) Traffic/Transportation Incident. (ad) Traumatic Injury. (ae) Unconscious/Fainting/Near-Fainting. (af) Unknown Problem/Person Down. (ag) Transfer/Interfacility/Palliative Care. (ah) Reference Pattern. (ai) Reference Pattern. Abbreviations: CBRN = chemical, biological, radiological, or nuclear exposure; SCUBA = Self-Contained Underwater Breathing Apparatus; AICD = Automatic Implantable Cardioverter Defibrillator.
Summary of test statistics comparing the empirical cumulative distribution for each dispatch category to the empirical cumulative distribution formed by all other categories.
Abbreviations: NEMSIS = National Emergency Medical Services Information System; KS
Ranking is based on the Wasserstein distance to the reference pattern.
The Wasserstein distance (metric) between two empirical cumulative distributions. This is also known as the Earth Mover’s distance (Duda, 2018).
After analyzing major medical dispatch categories, which showed a consistent afternoon peak across types, we extended the analysis to assess whether a daily normative pattern persists by considering monthly, seasonal, daylight-savings/civil time, and pre-/post-COVID-19 period effects. Results of analysis seeking evidence of these potential factors contributing to other hourly variance are summarized in the peak and nadir timelines of Figure 5. None of these factors showed an influence on the daily patterns. A daily pattern specific to heart attacks (diagnosed by EMS responders in the field) was also found to be consistent with the normative pattern, peaking in mid-afternoon. These results are discussed in more depth in the next section.
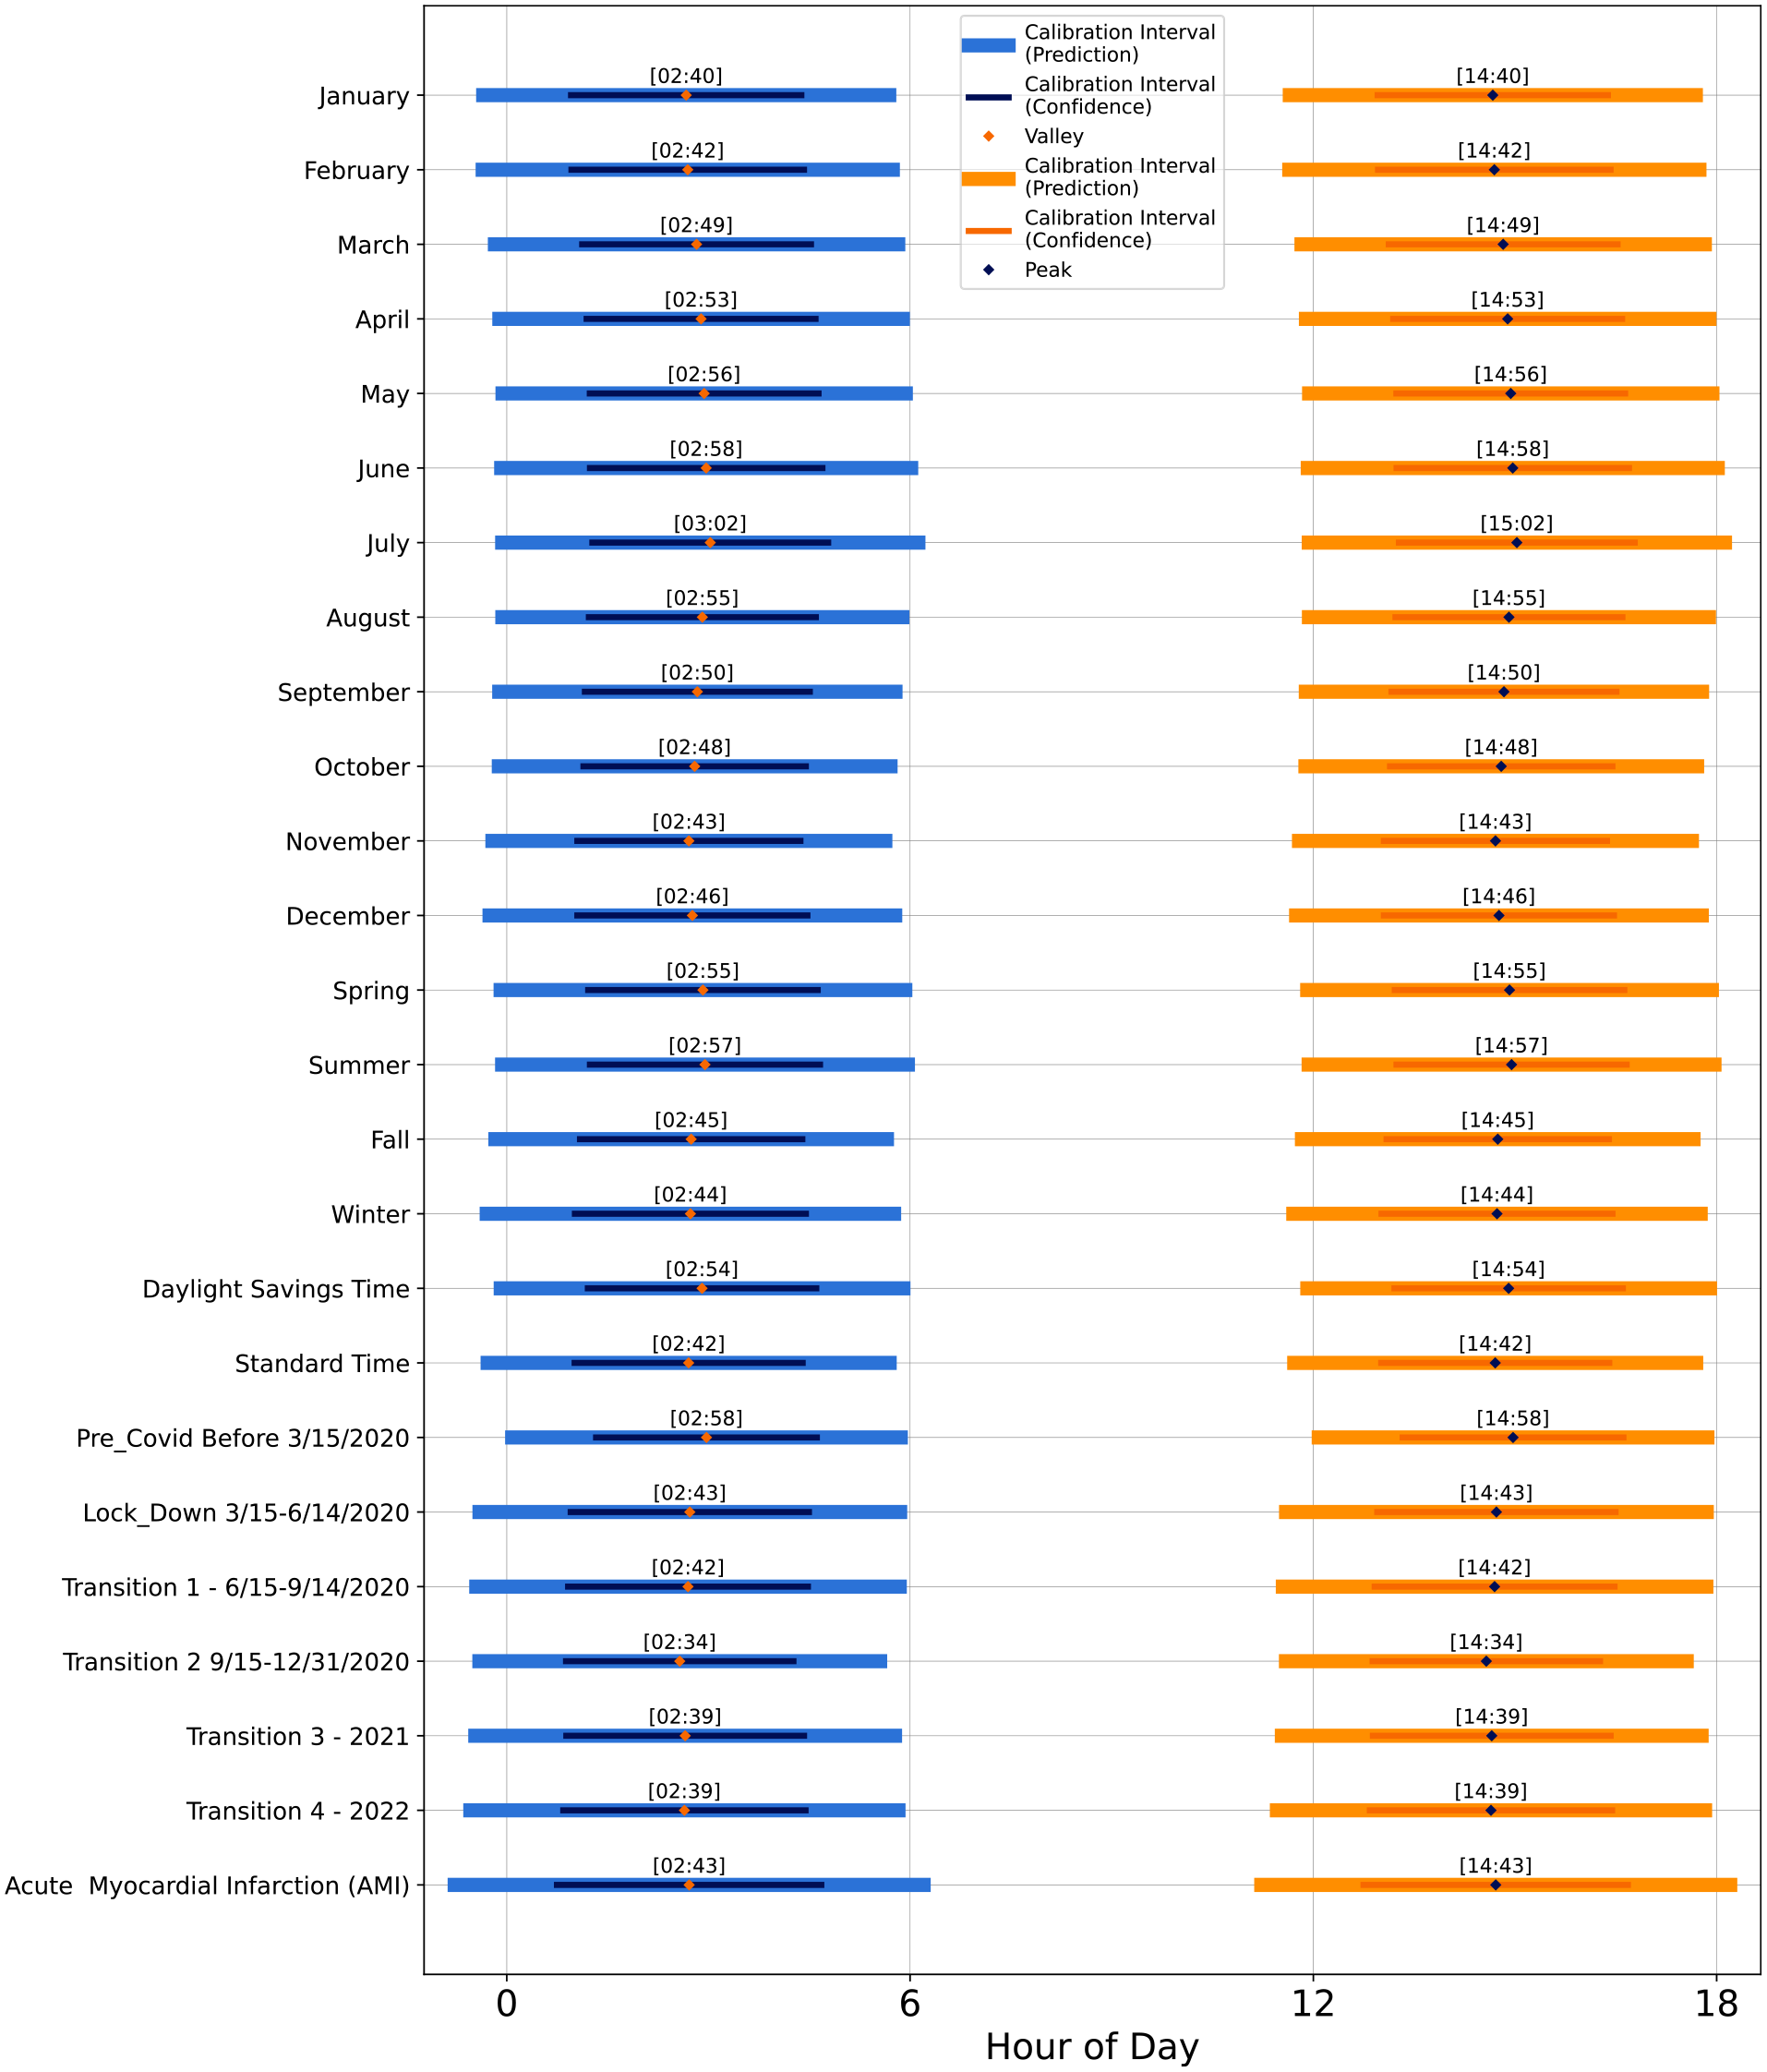
Peak and nadir times of day for the extended analyses, that is, time periods (month, season, daylight savings/civil time, COVID-19 periods) and the acute myocardial infarction-specific pattern. The times are shown with calibrated intervals derived from the 95% prediction limits and 95% confidence intervals. The peak and nadir times are found via the first derivative of the fitted sinusoidal function for each type. Intervals are estimated using the standard error from the regression model.
Discussion
In this study, we aimed to explore time-of-day patterns from the voluminous and rich NEMSIS data set. The statistical significance of all models and their visually prominent shapes corroborate the idea of a normative daily pattern for emergency medical events. The daily temporal patterns that emerged are distinct and remarkable, suggesting that they are normative. While the data and analysis represent an observational study, that the found daily patterns are formed from voluminous data set, drawn nationally and over a 13-year period, gives credence to the results of this paper. While all 33 event types follow this same pattern, there is variability with respect to time of day for peaks and nadirs by medical event type. The daily pattern analysis shows that, for 30 of the 33 emergency medical events, EMS calls peak during early to mid afternoon. The remaining 3 medical emergencies peak in the early evening hours.
Our study—based on 13 years of systematically curated US national data comprised of nearly one third billion events—reveals that a common pattern persists across the 33 standardized dispatch categories, various time periods, and field diagnosed heart attacks. However there are distinct differences in peak time of occurrence and within the distribution of several of these categories. Four daily patterns, while showing exceptional fit to the sinusoidal function (Table 5), show visual evidence of a bimodal distribution. These patterns correspond to the following four major categories; (a) carbon monoxide/hazmat/inhalation/CBRN (NEMSIS v3, dispatch type 2301017); (b) choking (NEMSIS v3, dispatch type 2301023), (c) pregnancy/childbirth/miscarriage (NEMSIS v3, dispatch type 2301057), and (d) traffic/transportation incident (NEMSIS v3, dispatch type 2301069). Their patterns correspond to Figure 2h, 2k, 2x, and 2ac, respectively, and each is, arguably, a combination of individual daily patterns. For example, choking (Figure 2k) appears to have lunch- and dinner-time sub-patterns, while morning and evening bursts of CBRN (predominantly carbon monoxide exposures) suggest there may be reason-driven sub-patterns (Figure 2l).
Pregnancy emergencies (Figure 2x) also appear to follow a subtle bi-modal shape. Recall that coefficient estimates
Three “exception” patterns peaking after 1800 h, as opposed to the more common mid-afternoon timing, are (a) assault (NEMSIS v3, dispatch type 2301007); (b) overdose/poisoning/ingestion (NEMSIS v3, dispatch type 2301053), which includes alcohol and other drugs as well as poisonings and ingestions; and (c) stabbing/gunshot wound/penetration traumas (NEMSIS v3, dispatch type 2301063). Their patterns correspond to Figure 2d, 2w, and 2aa respectively. These categories are distinguished from other medical emergencies because assaults, stabbings/gunshot wound and penetration trauma are forms of interpersonal violence. The overdose/poisoning/ingestion anomaly needs further analyses and is reflective of the opioid addiction and overdose epidemic that has plagued the United States for decades. Potential explanations for the later tendency for this group include non-biomedical factors that could influence the timing of events leading up to one of these injuries and overdoses, and subsequent call for medical help. The evening peak timing is after normal work and school hours. In these cases, the distress calls appear to follow human activity and behaviors post work and school hours.
The consistency of the daily pattern across medical emergencies, which run the gamut in terms of potential threats to life, seem to indicate that the human sleep/wake pattern is the predominant factor in time-of-day occurrence tendency. This indication is re-enforced from the comparative analysis on empirical CDFs, as well as the period- and heart attack-specific daily patterns. The common patterns shown in our results warrant further investigation via more targeted studies that examine the causes, risks, and protections by emergency medical event type as well as correlations across categories. Such investigations may help to uncover whether or not the time-of-day patterns found in this research, which are consistent across seemingly unlike medical emergencies, might be explained by the mere propensity for human events to occur squarely in the middle of a wake-state cycle. That the general pattern is shared, even between seemingly non-similar medical emergencies, suggests a need for studies to unravel what people are doing immediately beforehand.
We note that dispatch types such as chest pain, heart problem, convulsion/seizures, and psychiatric problem/abnormal behavior/suicide attempt are not one-to-one with the categories used in previous studies: heart attack, congestive heart failure, epileptic seizure, and suicide attempts or ideation; see Tables 1 and 2. For one, a category represents the patient’s chief complaint, noted at the time of call receipt, whereas most previous studies are based on medical diagnoses by physicians. Nevertheless, the categories intersect, even with error in the upstream process. For example, a medical emergency with the chief complaint “breathing problem” is a potential heart attack when accompanied by chest pain, nausea, sweating, irregular heartbeat, and weakness—symptoms that might not be mentioned in the call conversation. In fact, a dispatch for chest pain could end up being for a patient with a digestive system problem, such as severe heartburn.
In general, formal diagnoses are not made until a patient is seen by a physician in an emergency room, hospital, or clinical office. Even those diagnoses can be tentative until a patient follows up with specialists, has more diagnostic tests, or even (in case of expiring) is autopsied (Brush et al., 2017). One exception to this is that paramedics, in the field, can pronounce an acute myocardial infarction (heart attack) using a 12-lead electrocardiogram, also known as a heart or cardiac monitor. Since not all chest pain dispatches indicate a heart attack, we took advantage of the fact that the NEMSIS data set can include an acute myocardial infarction impression (International Classification of Diseases version 10 code I21, Centers for Medicare & Medicaid Services (2023)) and a corresponding data field interpreted from a field electrocardiogram reading. We used these data fields to isolate and observe the daily pattern for responses to acute myocardial infarction events to see if their pattern deviated from the chest pain pattern. Our analysis showed that in 694,505 distinguishable acute myocardial infarction events, the daily pattern was again close to the normative pattern, and similar to the pattern for chest pain dispatches, peaking in occurrence just before 1500 h. (See last line of Figure 5.) Our findings based on nearly 700,000 field-diagnosed heart attacks contrast significantly with studies that showed morning peaks for heart attack occurrences (Cohen et al., 1997; Muller et al., 1985). The mid-afternoon peak found in our study, and its similarity with patterns for other seemingly non-similar medical events, suggests that non-biomedical factors may be more consequential. Our study’s results suggest that re-investigation is worth-while, particularly since pharmacological prevention of acute myocardial infarction is based heavily on predominant occurrence time-of-day assumptions (Ruben et al., 2019).
An emergency medical call to dispatch for medical assistance, along with its time stamp, can be thought of as a distress signal that happens during a perceived medical emergency. That is, a medical emergency is arguably a continuous process that begins with symptom onset, and the call for help is merely a discrete point in time within process. Sometimes there is very little delay between the onset and the call, for example for a traumatic injury following a motor vehicle crash. In other times, there is hesitancy—for example, in the case of illegal drug overdose or other reasons for anxiety about being exposed to law enforcement (Wagner et al., 2019; Zoorob, 2020). For some medical conditions, a patient may not recognize their symptoms, or may be in denial, which has been documented for stroke (Fussman et al., 2010). In some cases, for example heart attack, certain symptoms may appear for hours in advance (Dracup et al., 1995; Finnegan et al., 2000). Currently, there seems to be only high level understanding of the circumstances leading up to decisions to call for EMS assistance. That is, it would be helpful in analyzing and interpreting daily patterns to know who, why, and when people decide to dial 9-1-1—for example, in Canada, the United States, Saudi Arabia, and others—or 1-1-2—in Sweden, Turkey, and Portugal, and 9-9-9 in the United Kingdom (World Population Review, 2023). The vast majority of calls are made by a second party, that is, a family member, friend, or bystander who is someone present with the patient and acting on their behalf (Clawson et al., 2015, Figure 3.5a and 3.5b). This is based on limited observation, but indicates that patients usually do not make a call for medical assistance themselves. How often and for how long might there be delays in calling between symptom onset and a distress call? This sort of behavior likely affects the variance and shift in daily patterns.
Daily pattern for EMS responses to convulsion/seizures (total 9,017,651; see Figure 2l) was also inconsistent with the patterns found by at least two previous studies. Activity for medical emergencies of this type peaked in the mid afternoon, at 1528 h, with a wide 95% confidence interval (just after noon to nearly 1900 h), see Figure 3. Two existing studies specific to epileptic seizures showed varying peaks under specific types of seizure, with a common tendency in the early morning hours (Pavlova et al., 2012; Ramgopal et al., 2012). The discord between the EMS pattern and these studies may be due to the fact that the convulsions/seizures dispatch type includes various causes, only one of which is epileptic seizure. The severity of the seizure, or the likelihood of its being witnessed, may also drive more calls during the day. This pattern needs much further investigation, including the etiology of convulsions and seizures and variations according to age group.
EMS responses to events in the category of falls (total, 27,130,646) is another example of a medical emergency that likely includes a large variation in reasons—from a workman falling off a roof to an older adult tripping on a rug. The daily pattern (Figure 2q) and peak in mid-afternoon (Figure 3 in this case is consistent with previous findings that showed that posture control is better in the morning (Gribble et al., 2007)). However, this category is likely composed of many causes, which could include biomedical factors as well. For example, drops in blood pressure or glucose can be fall causes.
Recognition of normative patterns across the spectrum of medical event types sets the stage for future research that could advance prevention sciences. There are clear patterns of peak occurrence for overdoses, work related injuries, recreational injuries, allergic reactions and general sickness, and cardiac events. As noted earlier, overdoses are more likely to occur in the early evening. These include opioid drug overdoses. Are overdoses more likely to peak in early evening hours because users work during normal business hours and therefore the opioids are taken after work? Or is there a relationship to a natural cycle or circadian rhythm of neurotransmitter release that affects vulnerabilities for overdose (Koob et al., 1998; Kosobud et al., 2007; Tomkins and Sellers, 2001)? Might the hourly occurrence patterns identified in this study enhance the design of addiction treatment (Webb, 2017)? Similarly, given that emergencies such as burns/explosions, electrocution, eye injuries, lacerations, drowning, and animal bites have predictable daily occurrence tendencies and that accidents are a leading cause of death in the United States (Centers for Disease Control and Prevention, 2023), would these patterns be useful for designing prevention strategies in work and recreational settings?
Of note in the daily patterns is the fact that seemingly dissimilar medical events all tend to occur right around 1500 h; for example, abdominal pain, headaches, allergic reactions, fainting, and general sick person. Are there any inferences we can draw from this common hour of day? Likewise, back pain and non-traumatic chest pain emergency medical events are most alike in their tendency to peak around the same time—just after 1330 h, for reasons not yet understood. Breathing and heart problems emergency event tendencies also peak at around 1500 h, with 95% confidence interval from 1300 to 1700 h and 95% prediction interval from just before noon to just after 1800 h. Could this be due to a similar or shared causes?
In summary, our analysis revealed a robust daily pattern in the hourly distribution of occurrences across 33 major categories of medical emergencies. The consistent pattern persisted in extended analyses organized around periods (month, season, daylight-savings/civil time, COVID-19), and heart attack-specific events. The common sinusoidal cycle demonstrates that all categories of medical emergencies appear to be influenced by an underlying daily rhythm. In several cases, the obtained daily patterns described in this paper are not consistent with long-established morning peaks: specifically for acute myocardial infarction, chest pain, heart problems, stroke, convulsions and seizures, and sudden cardiac arrest/death. In conclusion, recognition of the trend in daily patterns of medical emergencies raises many important questions about causes and prevention efforts. The daily predictable EMS patterns presented here may provide impetus for further research that links daily variation with causal factors, risks, and protections.
Limitations
We note that the 311,848,450 total activations, while a substantial observational data set, may be influenced by duplicate or canceled calls, and by recognized omissions. For example, the New York State Department of Health (2021) reported that as of January 1, 2020, all of its agencies were using the latest NEMSIS standard for electronic capture of patient care information, improving the quality and completeness of the data. However, electronic data capture included only approximately 90% of statewide activations, reflecting submissions from about half of all certified agencies in the state. The remaining data—roughly 10% of statewide activations—were documented manually via paper patient care reports, and are not included in NEMSIS contributions.
It is important to note that a category is based on the best-known information at the time of EMS activation. For example, an activation for a breathing problem, fall, unconscious person, or cardiac arrest might be due to an opioid overdose, falling under the overdose/poisoning/ingestion category. In other words, as with any recording of data based on human communications and judgment, both error and re-diagnosis are possible. Due to the voluminous size of the data set—nearly a third of a billion activations over a 13-year period—our analysis assumes that such mis- or re-classifications are not more significant than a random effect in data. A study to estimate the magnitude of this effect is suggested for future research.
Supplemental Material
sj-docx-1-jbr-10.1177_07487304231193876 – Supplemental material for The Daily Patterns of Emergency Medical Events
Supplemental material, sj-docx-1-jbr-10.1177_07487304231193876 for The Daily Patterns of Emergency Medical Events by Mary E. Helander, Margaret K. Formica and Dessa K. Bergen-Cico in Journal of Biological Rhythms
Footnotes
Appendix
This appendix describes the step-by-step process used to analyze patterns from the NEMSIS data set, binned by hour of day. The modeling involves a standard polynomial transformation from trigonometry, used similarly by previous researchers (Eubank and Speckman, 1990). This development is designed so that sinusoidal regression modeling is understandable to all, and can be reproduced on any sort of similarly binned data. The mathematical elaboration of this section also reveals the equivalency to the cosine form which is popular for modeling biological rhythms. This approach for handling binned event data, from EMS or other processes, can be readily implemented using common statistical packages such as SAS, SPSS, STATA, R, Python, or an MS EXCEL spreadsheet.
Acknowledgements
This research was performed while the first author was funded as a Graduate Research Fellow in the Lerner Center for Public Health Promotion and Center for Policy Research, Maxwell School of Citizenship and Public Affairs, Syracuse University. Special thanks to Marita Begley for copy-editing and proofreading.
Conflict of Interest Statement
The authors have no potential conflicts of interest with respect to the research, authorship, and/or publication of this article.
Human Subjects Review
This project was reviewed and approved by the Syracuse University Office of Research Integrity and Protection and determined to be exempt.
Notes
References
Supplementary Material
Please find the following supplemental material available below.
For Open Access articles published under a Creative Commons License, all supplemental material carries the same license as the article it is associated with.
For non-Open Access articles published, all supplemental material carries a non-exclusive license, and permission requests for re-use of supplemental material or any part of supplemental material shall be sent directly to the copyright owner as specified in the copyright notice associated with the article.