
Abstract
Epidemiological studies associate night shift work with increased breast cancer risk. However, the underlying mechanisms are not clearly understood. To better understand these mechanisms, animal models that mimic the human situation of different aspects of shift work are needed. In this study, we used “timed sleep restriction” (TSR) cages to simulate clockwise and counterclockwise rotating shift work schedules and investigated predicted sleep patterns and mammary tumor development in breast tumor–prone female p53R270H©/+WAPCre mice. We show that TSR cages are effective in disturbing normal activity and estimated sleep patterns. Although circadian rhythms were not shifted, we observed effects of the rotating schedules on sleep timing and sleep duration. Sleep loss during a simulated shift was partly compensated after the shift and also partly during the free days. No effects were observed on body weight gain and latency time of breast cancer development. In summary, our study shows that the TSR cages can be used to model shift work in mice and affect patterns of activity and sleep. The effect of disturbing sleep patterns on carcinogenesis needs to be further investigated.
To anticipate daily recurring changes in the environment (such as the day-night cycle, ambient temperature changes, or food availability), mammals evolved a circadian system that imposes a daily rhythmicity on behavior, physiology, and metabolism. This internal timekeeping system has a periodicity of approximately (circa) 1 day (diem) and is composed of a central clock located in the hypothalamus (i.e., the suprachiasmatic nuclei [SCN]) and peripheral clocks in virtually all cells of the organism (Reiter, 1993). To remain in phase with the day-night cycle, this central SCN clock is reset on a daily basis by so-called Zeitgebers (“time-givers”), of which daylight perceived by the eyes is the strongest clock-resetting cue. In turn, the SCN clock relays time information to peripheral clocks through humoral and neuronal signals, resulting in a time-coordinated regulation of cell, tissue, and organ function (Schibler et al., 2003; Albrecht, 2006; Buhr and Takahashi, 2013).
Inherent to our 24/7 society, many people need to work outside office hours and even during the night, which causes a misalignment of clock-controlled body functions and rest-activity rhythms (Arendt, 2010). Evidently, disturbance of our circadian rhythms has a direct impact on our health and wellbeing, and this is illustrated by acute effects, such as sleep disruption, fatigue, and concentration problems (Åkerstedt and Wright, 2009; Arendt, 2010). A recent meta-analysis indicates that shift work sleep disorder is highly prevalent among night shift workers with a prevalence of 26.5% (Pallesen et al., 2021). Importantly, epidemiological evidence and studies performed with experimental animals have shown that chronic disturbance of circadian rhythms is associated with a variety of other diseases, including obesity, diabetes, cardiovascular disease, and cancer (Costa, 1996; Scheer et al., 2009; Costa, 2010; Van Dycke et al., 2015b). The International Agency for Research on Cancer (IARC) classified shift work as “probably carcinogenic” (Ward et al., 2019). Epidemiological studies have pointed toward an association between shift work and breast cancer risk, although the strength of this association varied in different studies and some reported no association at all (Lee et al., 2018; Manouchehri et al., 2021). A meta-analysis of the epidemiological data showed a positive association between night shift work and breast cancer risk in workers who worked in night shifts for less than 10 years, but not in those who worked night shifts for more than 10 years in a row (Manouchehri et al., 2021). In animal studies, there was also supporting evidence for a relationship between chronic circadian rhythm disturbance and carcinogenesis (National Toxicology Program, 2021), although it should be noted that experimental designs in these studies hardly reflected the situation experienced by actual human shift workers. For example, methods used are genetic disruption of the molecular clock (Yu and Weaver, 2011), surgical induction of SCN lesions to disrupt central clock regulation (Filipski et al., 2003), and models based on changes in light schedules, such as a chronic jet lag (Filipski et al., 2004; Van Dycke et al., 2015b). It was found that chronic jet lag enhanced the outgrowth of tumor xenografts in mice (Filipski et al., 2004, 2006), while light at night promoted grafting of human breast cancer cells in immunodeficient rats (Blask et al., 2002). Another limitation of such animal studies is that they only look at outgrowth of tumors (following a grafting or chemical induction procedure) rather than tumor initiation and/or progression. Previously, a transgenic mouse model was developed with mammary gland–specific expression of the p53R270H©/+ mutation, resulting in spontaneous mammary gland tumorigenesis mimicking human breast cancer development (Wijnhoven et al., 2005). Expression of the mutation in mammary tissue was achieved by crossing p53R270H©/+ mutant mice with mammary-specific Cre transgenic mice having Cre recombinase under the control of the hormone-inducible Whey Acidic Protein (WAPCre mice; Wagner et al., 1997). This mouse model has been shown to develop human relevant mammary gland tumors, including hormonal receptor status, with a latency time of approximately 1 year (Wijnhoven et al., 2005). Previously, we investigated the impact of circadian disturbance on tumor initiation using the p53R270H©/+ WAPCre mouse model for breast cancer and chronic alternating light/dark cycles. We could show that a chronic jet lag–mimicking protocol actually reduced mammary tumor latency (Van Dycke et al., 2015b).
Animal studies that adequately investigate the impact of shift work on tumor initiation and progression have thus far been lacking, and this can be largely attributed to the difficulty of accurately modeling the situation of human shift workers, who in contrast to animals fairly easily can choose to live out of phase with their biological clock for a certain period of time. Only a limited number of studies have appeared in which the work component of shift work has been simulated (Salgado-Delgado et al., 2008; Grønli et al., 2017). This can be achieved by gently handling the animals and exposing them to new objects after showing behavioral signs of sleepiness during the “work” period, a condition referred to as timed sleep restriction (TSR) (Barclay et al., 2012). We have developed a new cage design based on the 8229 Sleep Deprivation Feedback System for Mice (Pinnacle Technologies), in which TSR is induced by gently and continuously forcing animals to be active at a desired time of the day.
In this study, we used these specially designed TSR cages as a novel approach to simulate rotating shift work. We validated the TSR cages by investigating activity, sleep probability, and core body temperatures patterns. Furthermore, we investigated the effect of shift work on tumor initiation in mice. Around 36% of human shift workers are subjected to a rotating shift work regime, which forces the body clock to continuously adjust to variable working schedules (Williams, 2008). Here, we subjected female p53R270H©/+ WAPCre mice to a forward or backward rotating shift work–mimicking protocol under constant light/dark conditions and studied the impact on mammary tumor development.
Materials and Methods
Experimental Setup
All studies were performed with p53R270H©/+WAPCre conditional mutant mice in an FVB genetic background. The generation of p53R270H©/+ and mammary gland–specific WAPCre mice has been described before (Wijnhoven et al., 2005). Note that as Cre recombinase expression in the currently used WAPCre mouse model does not require pregnancy (Derksen et al., 2011), mice were nulliparous. Female, 7- to 11-week-old, p53R270H©/+ WAPCre mice were randomly assigned to a control group (CTRL; n = 28), a clockwise shift work group (CW; n = 25), or a counterclockwise shift work group (CCW; n = 25) and housed in groups of 4-5 animals in specially designed, round, 30-cm diameter TSR cages, equipped with a timer-controlled rotation bar (spinning at 3 rpm) allowing us to keep animals awake and active at desired time windows (Figure 1a). Animals received RM1 chow diet from Special Diet Services (SDS, France). To record locomotor activity and core body temperature, each TSR cage contained one additional p53R270H©/+ WAPCre mouse carrying a telemetry transmitter (DSI PhysioTel TA-F10), which was implanted intraperitoneally 2 weeks prior to the start of the experiment. Surgery was performed on a heating pad and under inhalation of anesthesia (2.5%-3% isoflurane). Before the surgery, the animals were injected subcutaneously with buprenorphine (Temgesic, 0.1 mg/kg) and 3 more doses at 8-h intervals after surgery to control the pain. After surgery, the respiratory pattern of mice was monitored based on clinical observations and the animals were put under a heating lamp until they were actively awake. Animals were kept in a 12 h:12 h light/dark cycle with mid-dark defined as External Time 0 (ExT0), and food and water provided ad libitum.
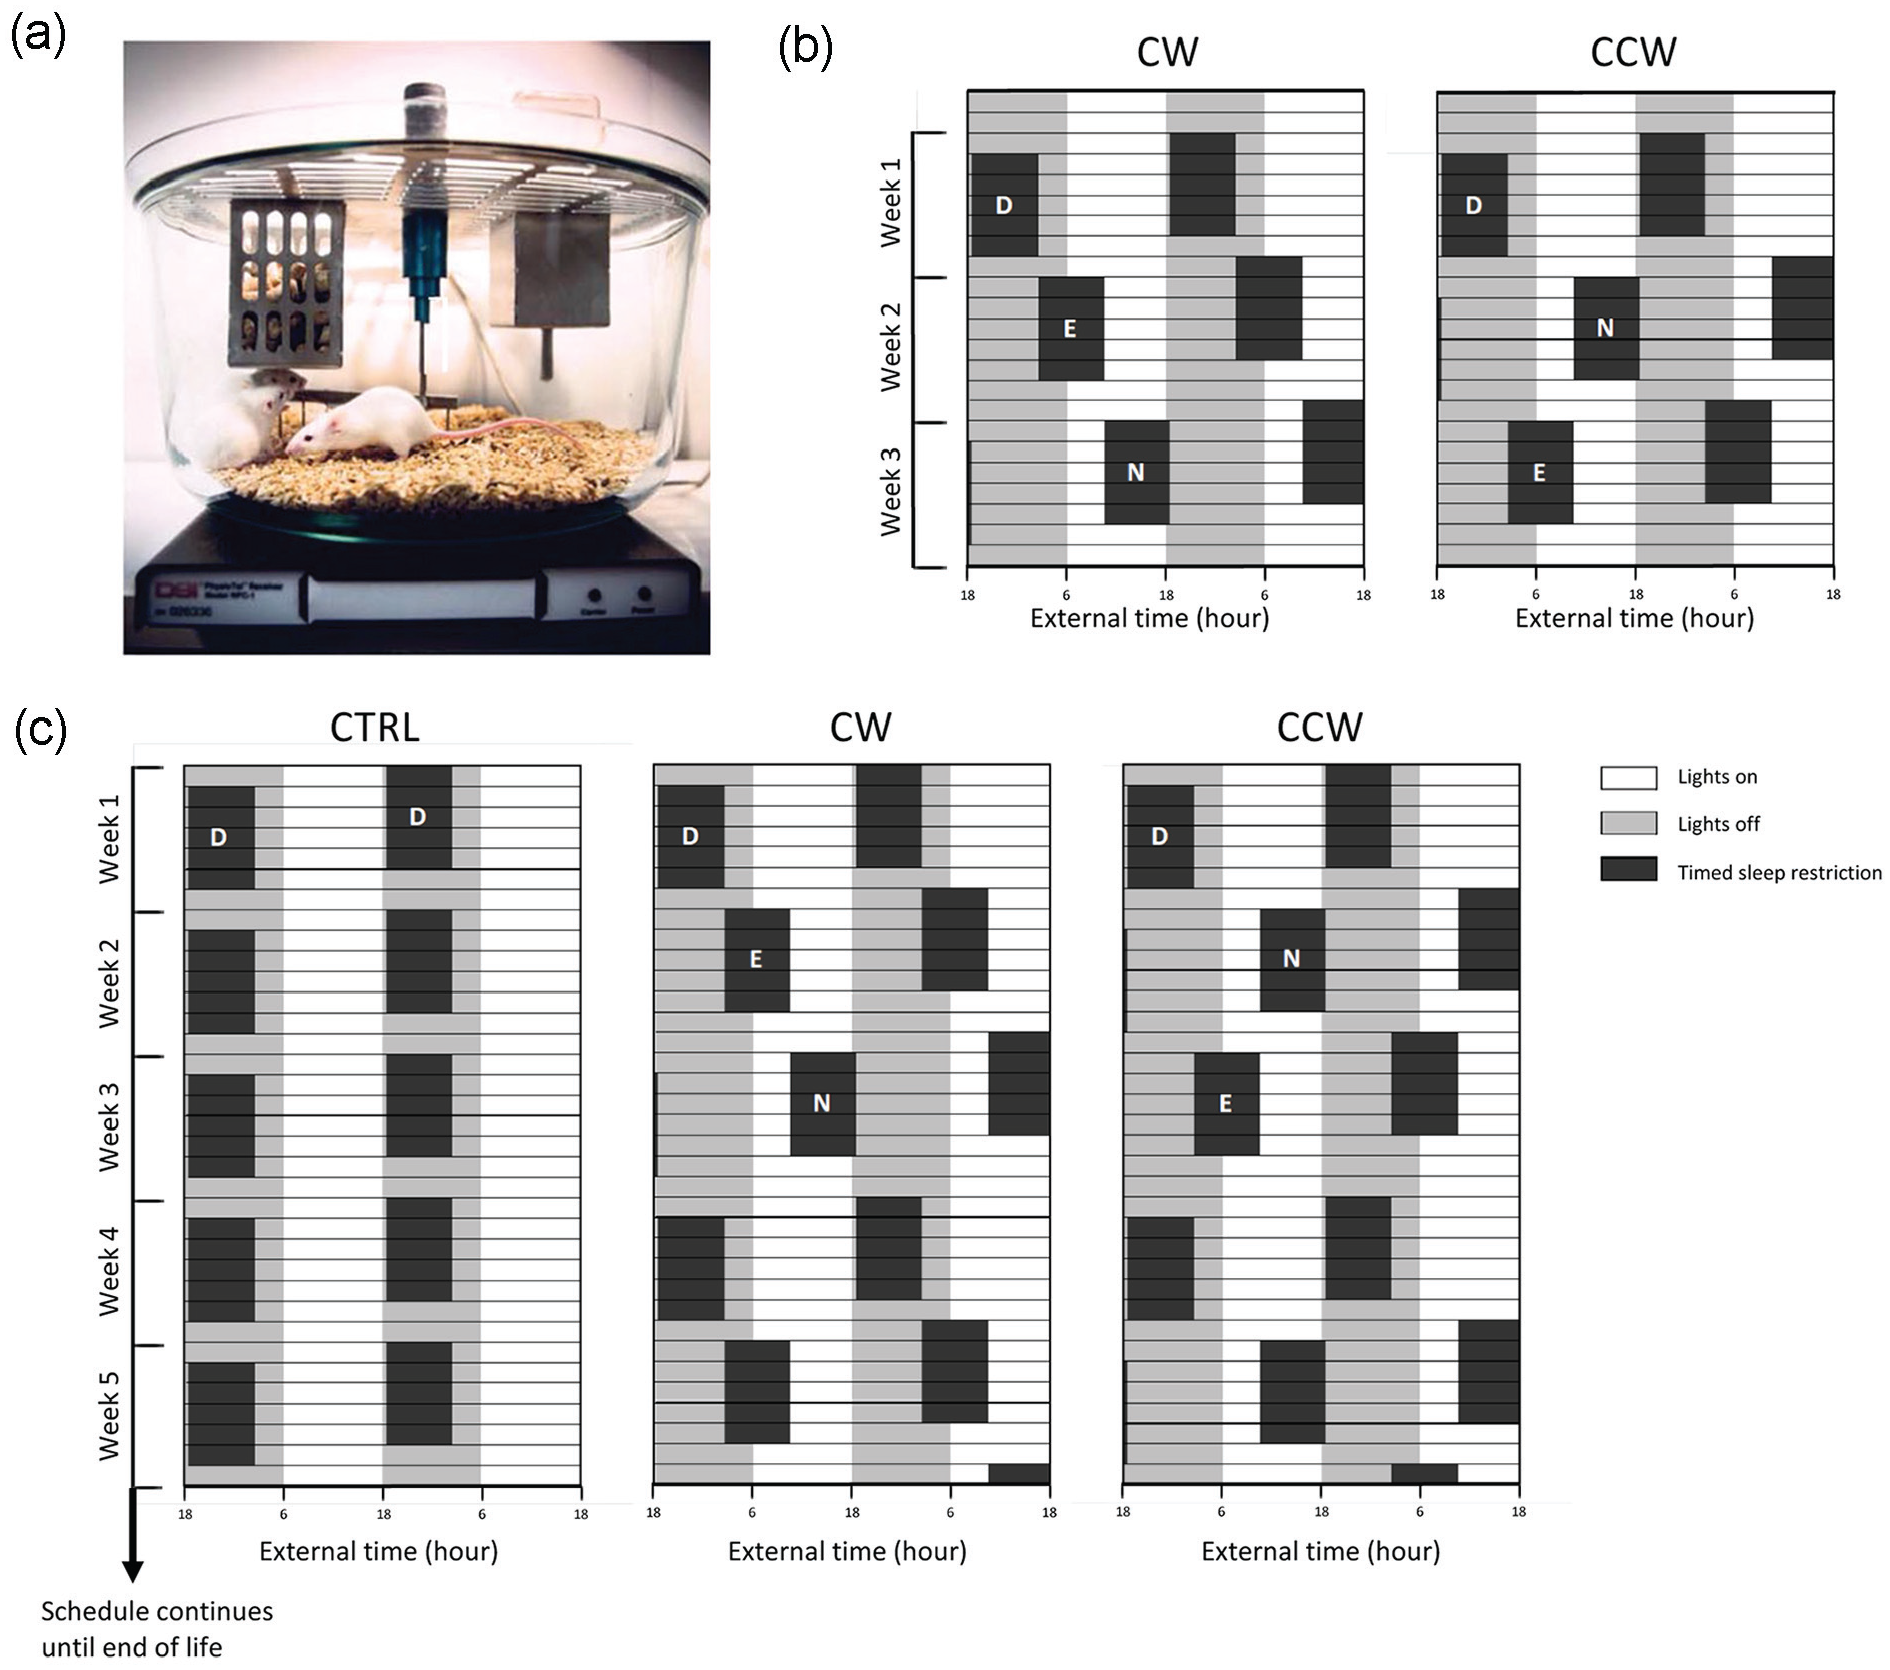
Experimental setup using timed sleep restriction (TSR) mouse cage. (a) Photo of a TSR mouse cage in which rotating shift work can be simulated. Animals are kept awake at preset times over the day by a timer-controlled bar rotating at 3 rpm. The cage is placed onto a DSI PhysioTel Receiver RPC-1 plate to record behavioral activity and core body temperature from implanted DSI PhysioTel TA-F10 telemetry transmitters. (b) Schematic representation of the forward (CW) and backward (CCW) rotating cycles of “day shift,” “evening shift,” and “night shift” work weeks used for the validation experiment (total n = 4, CW n = 2, CCW n = 2). Black boxes represent periods of forced activity (i.e., rotation bar “on”); the gray background indicates the 12-h dark phase and the white background is the 12-h light phase of the 24-h day-night cycle. Time of the day is expressed as External Time (ExT) in which ExT0 represents mid-dark and ExT12 mid-day. As mice are nocturnal animals, “day,” “evening,” and “night” refer to the main activity phase (day), late activity phase (evening), and sleep phase (night) of the mice, rather than actual astronomical day (as experienced by humans). (c) Graphic visualization of timed sleep restriction schedules, which mimic regular (“day shift” only) work weeks (CRTL) and forward (CW) or backward (CCW) rotating shift work weeks. Mice were continuously exposed to the schedules until end of life. The graphs are double plots to help with visualizing the direction of the rotation of the forced activity shifts during the simulated work week for each group. Black boxes indicate periods of forced activity (i.e., rotating bar “on”) and a gray background indicates the dark phase, whereas white background indicates the light phase. Time of the day is expressed as External Time (ExT) in which ExT0 represents mid-dark.
Prior to the main cohort study, a pilot experiment was performed using 4 p53R270H©/+WAPCre mice with implanted telemetry transmitters to validate the TSR cage for simulating rotating shift work in mice and the recording of data. Forward and backward rotating cycles of “day,” “evening,” and “night shifts” (5 work days, separated by 2 free days) were simulated by forced sleep restriction at ExT18.5 to 2.5, ExT2.5 to 10.5, or Ext10.5 to 18.5, respectively (see Figure 1b).
In the main cohort study, animals in the CTRL group were exposed to simulated weeks of 5 working days, in which only “day shifts” were scheduled, and 2 days off as a weekend before the next week started. Animals in the CW and CCW shift work groups were exposed to the same number of working days, in which forward rotating (“day”-“evening”-“night”) or backward rotating (“day”-“night”-“evening”) shifts were scheduled, followed by the same weekend off as the controls. These TSR protocols continued until end-of-life (see Figure 1c). Activity and core body temperature were recorded in weeks 2-4 and weeks 15-17 of the experiment, spanning an evening, night, and day shift (CW protocol) or a night, evening, and day shift (CCW protocol, separated by 2 free days.
All experiments involving animals were approved by the Animal Experiments Committee of the Erasmus University Medical Center and were performed in accordance with the national and international legislation, and experiments were approved by DEC Consult, a Dutch equivalent of the IACUC (protocol number EMC2721).
Analysis of Locomotor Activity and Core Body Temperature
Locomotor activity was recorded using PhysioTel TA-F10 telemetry transmitters in combination with a PhysioTel RPC-1 Receiver (DSI Physiotel, transmitter model TA10TA-F40, receiver board model TA10TA-F40; DataScience), and the data were collected in 10-min bins. Activity data of each animal were first normalized by expressing the activity in a 10-min bin as the percentage of the total activity during that particular day (spanning ExT0 to 24 for the validation and cohort studies) and smoothed the data by applying a symmetric 70-min moving average filter. Next, activity day curves were generated by averaging the time point data from 5 free days (randomly picked from 7 free days using a list randomizer (Random.org/lists) or 5 “day shift,” “evening shift,” or “night shift” work days. Note that “weekend days” with a starting night shift were not counted as a free day. Data were plotted as a line graph with 1 standard deviation, which indicated the variation between days. Group activity day curves were generated by averaging the individual day curves from 4-5 animals and plotting the mean activity as a curve with shaded area of 1 standard deviation, which indicated the variation between animals. The total activity over the morning, evening, and night or over the whole day was calculated as the sum of 10-min bin activity for each mouse over an 8- or 24-h period, respectively. Subsequently the group average of these sums was calculated.
The core body temperature was recorded by the telemetry device in 10-min bins. For each mouse, data were smoothed data by applying a symmetric 70-min moving average filter. Individual and group temperature day curves were generated in the same way as described for the locomotor activity curves. Differences in the core body temperature between free days and working days (Δ core body temperature) were calculated by subtracting the temperature value on working days from the value on free days for each 10-min bin of the group temperature day curves using Excel (Office 365 software version 2102), Microsoft, USA.
Analysis of Sleep Patterns
Predicted sleep patterns were generated from locomotor activity data using the ChronoSapiens software version 10.3 as described previously (Juda et al., 2013; Roenneberg et al., 2015). Instead of actual sleep, these predicted patterns represent sleep probability because they are based on deduced periods of inactivity from the locomotor activity data. In brief, a non-rhythmic trend was calculated using centered moving 24-h averages. Using a selected threshold representing 15% of the trend, the periods of sleep (=1) and wakefulness (=0) were dichotomized, in which values equal or below the threshold were considered sleep periods. Sleep onsets and offsets were predicted using a 2-step method in the statistical program ChronoSapiens as described previously (Roenneberg et al., 2015). Similar to the analysis of locomotor activity, sleep day curves of individual animals were generated from the dichotomized data set by applying a symmetric 70-min moving average filter and averaging the sleep probability time points over 5 days free, “day shift,” “evening shift,” or “night shift” days. Data were plotted as a line graph with 1 standard deviation representing the variation between days. Group activity day curves were generated by averaging the data from 4 to 5 animals and plotting the activity in a curve with 1 standard deviation representing the variation between animals. The heatmaps, which indicated the differences in sleep probability between free and working days (Δ sleep), were generated using Excel (Office 365 software version 2102, Microsoft, USA). Time spent asleep was calculated by multiplying the average sleep probability of a particular day with either 8 (for a morning, evening, or night) or 24 h (for a whole day).
To compare sleep and core body temperature differences on free and working days, the sleep probability difference (Δ sleep work days vs days off) was scatter plotted against the temperature difference (Δ CBT work days vs days off) for each available 10-min bin point. Orange and blue dots indicate time points (10-min bins) during which the rotating arm was on or off, respectively.
Monitoring of the Body Weight and Mammary Tumor Development
All mice from the cohort study were weighed weekly to determine body weight, which was expressed as the percentage of body weight gain relative to body weight at the start of the experiment and was statistically analyzed until 26 weeks of exposure, when the first signs of breast tumor growth became apparent as this might influence body weight. Weekly monitoring of body weight and exposure to the TSR protocol did continue till end-of-life. Mammary tumor development was monitored and latency time was noted for each animal at the moment a tumor was palpated while checking all animals once every week. Animals were sacrificed by CO2 inhalation when mammary tumors reached a volume of approximately 1 cm3 or when the animals exhibited a deteriorating clinical condition due to other causes.
Necropsy, Histology, and Pathological Examination of the Animals
Tissues with gross lesions were dissected from each sacrificed animal at necropsy and sampled into a vial with sufficient 10% neutral buffered formalin (Baker Formalin Solution 10%, VWR). Following a 24- to 48-h post-fixation period at room temperature, these tissue samples were transferred into 70% ethanol and stored at 4 °C until further processing. Finally, all tissue samples were routinely processed to paraffin blocks, and sections of 5 µm thickness were stained with hematoxylin and eosin according to standard procedures. All slides were examined microscopically by experienced veterinary pathologists, and mammary tumors were classified as described previously (Cardiff et al., 2000; Wijnhoven et al., 2005; Radaelli et al., 2009).
Statistics
All data are expressed as means ± standard deviation (SD). Statistical analyses for activity and sleep were performed in Excel (Office 365 software version 2102, Microsoft) using a 2-sample Student t test with unequal variances when comparing 2 experimental groups or a paired Student t test when comparing different conditions within an experimental group. Body weight data were statistically analyzed using a 2-way repeated-measures analysis of variance (RM-ANOVA). In the body weight analysis, one mouse was excluded as it died earlier than 26 weeks in experiment. One mouse missed 2 data points (weeks 16 and 17), which were replaced by the average of the values adjacent to it (week 15: 25.3 g; week 18: 25.0 g and resulted in week 16: 25.2 g and week 17: 25.1 g). Survival data were estimated by the Kaplan-Meier method; statistical comparisons were made using the log-rank (Mantel-Cox) method. The pathology data were analyzed using a chi-square test to identify statistical significance and the average number of mammary tumors using a 2-tailed Student t test. All analyses were performed in GraphPad Prism (version 9.3.1; San Diego, CA, USA; http://graphpad.com), and the threshold for significance was set at p < 0.05 in all cases.
Results
Validation of TSR Cages
To investigate whether the TSR cages (Figure 1a) can serve as a valid animal experimental paradigm for human shift work, we first tested whether 8 h of forced activity applied at a given time of the day resulted in an increased locomotor activity during that particular part of the day. To this end, four 7- to 11-week female p53R270H©/+WAPCre mice were exposed to forward and backward rotating cycles of 5 “day,” “evening,” and “night shifts,” separated by 2 days off (see Figure 1b and Suppl. Fig. S3). As mice are nocturnal animals, please note that throughout this article the use of “day” (ExT18.5-2.5), “evening” (ExT2.5-10.5), and “night” (ExT10.5-18.5) refers to the main activity phase (day), late activity phase (evening), and sleep phase (night) of the mice, rather than actual astronomical day. The variability between days for the activity day curves was low in each of these 4 animals (as indicated by the shaded areas, which in each graph delineate 1 standard deviation from the mean; Figure 2a and 2b), and each type of simulated shift work resulted in a specific signature (Suppl. Fig. S1A). The individual day curves were combined to produce the overall activity day curve, which also takes into account inter-animal variation (Suppl. Fig. S1B).
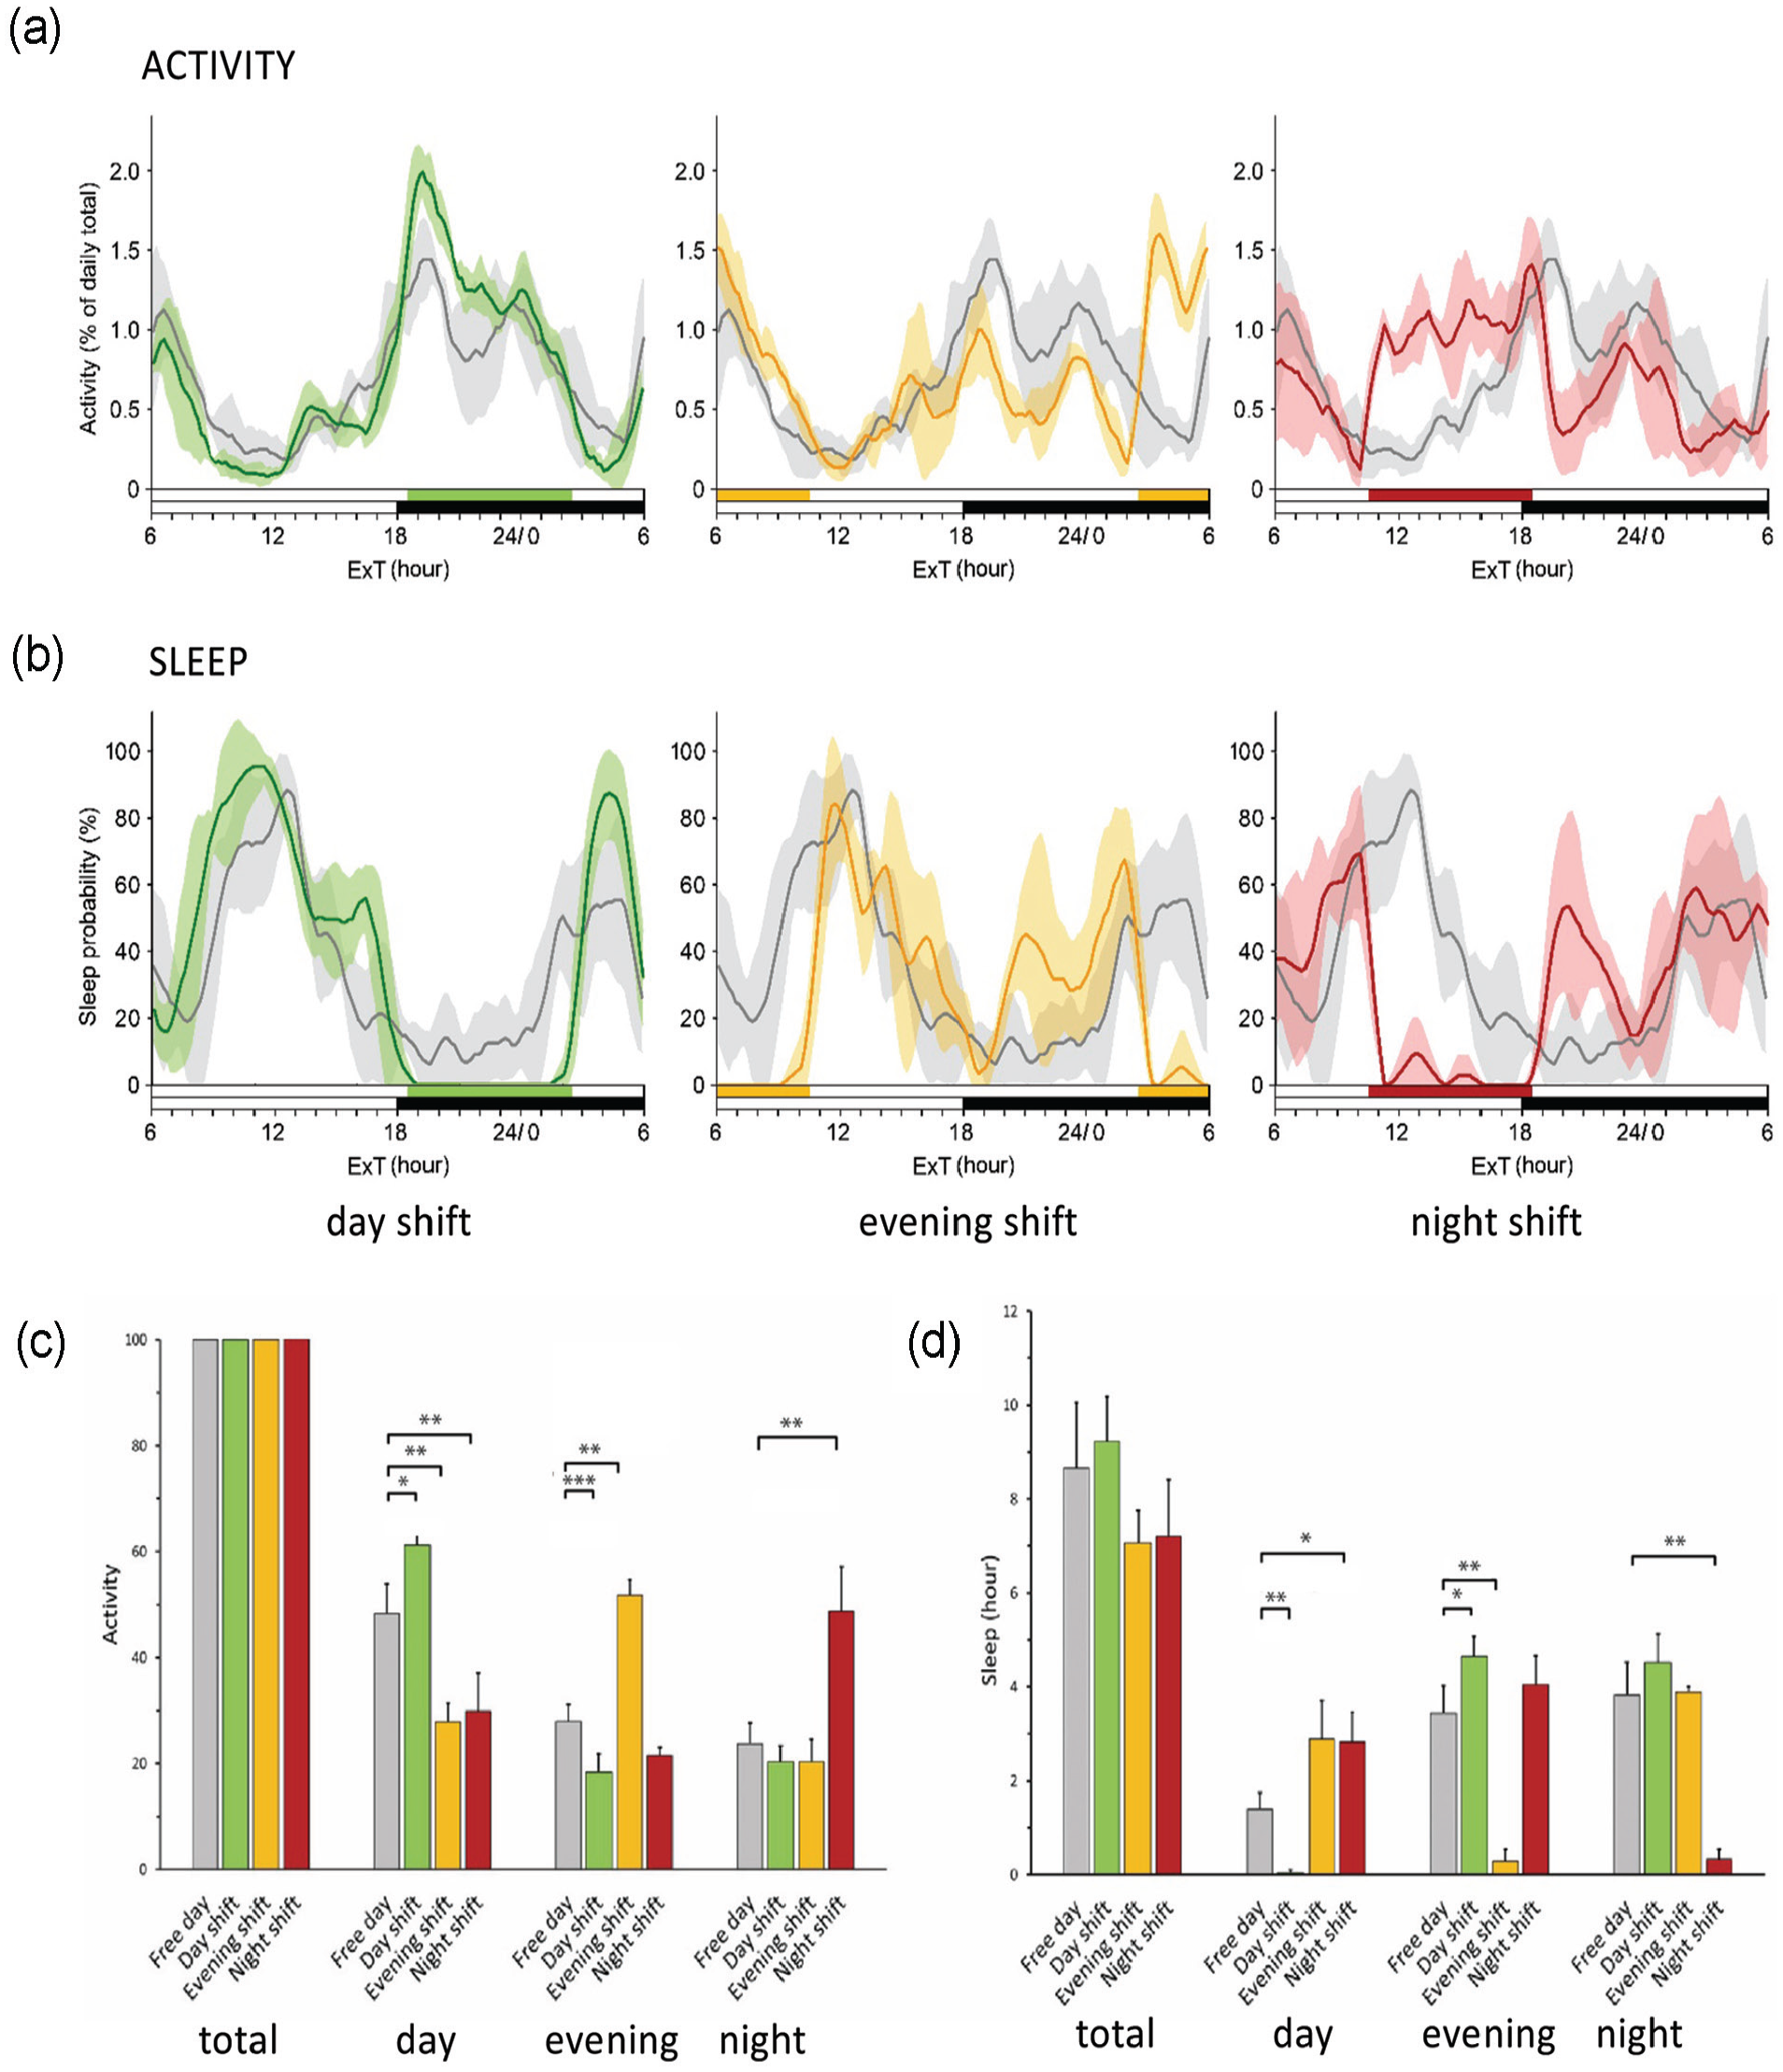
Validation of the timed sleep restriction (TSR) mouse cage. (a) Activity day curves, which show the distribution of locomotor activity over a 24-h day (n = 4 animals; n = 5 days recorded per animal) for free days (gray lines) and “day” (green lines), “evening” (yellow/orange lines), and “night” (red lines). Shaded area per graph line represents 1 standard deviation from the group mean. Light/dark phase and forced activity periods are indicated by the black-and-white and colored horizontal bars, respectively. (b) Sleep day curves, showing sleep probability over the day. Sleep probability is expressed as the chance (%) that animals are asleep at a given time point. Standard deviation, light/dark regime, and forced activity windows are plotted the same as in (a). (c) Quantitative analysis of the impact of timed sleep restriction on the activity distribution. Total activity per day (ExT0-24), as well as activity during the day (ExT18.5-2.5), evening (ExT2.5-10.5), and night (ExT10.5-18.5), is indicated on free days (gray bars) and “day” (green bars), “evening” (yellow/orange bars), and “night shift” days (red bars). Error bars indicate standard deviations. *p < 0.05. **p < 0.01. ***p < 0.001. (d) Quantitative analysis of the impact of timed sleep restriction on the sleep distribution. Graph is plotted the same way as in (c). Color version of the figure is available online.
When the activity day curves (Figure 2a) were viewed in the light of a quantitative analysis of the impact of TSR on activity distribution (Figure 1c and Suppl. Table S1), it was observed that a “day shift” causes a small but statistically significant increase in activity during the day (p < 0.05) and a small reduction during the evening (p < 0.001). In marked contrast, “evening” and “night shifts” resulted in an (almost) 2-fold increase in activity during the evening (p < 0.01) and night (p < 0.01), respectively, while in both conditions day activity was 2-fold reduced (p < 0.01). Thus, the rotating bar causes a time-of-day dependent shift in behavioral activity distribution, with approximately half of the total daily activity confined to the time window in which forced activity is applied.
Next, we used the ChronoSapiens software to predict sleep episodes from the locomotor activity recordings and calculated sleep probability (i.e., the chance that a mouse is asleep at a given moment) rather than actual sleep. Analogous to the locomotor activity day curves, the individual animals show highly similar sleep day curves with a shift-specific pattern (Suppl. Fig. S2A). Importantly, when comparing with the activity day curves at the group level (Suppl. Fig. S1B), it became clear that sleep probability was always close to zero during periods of forced activity, and that animals (independent of a given schedule) immediately show a high sleep probability after every period of forced activity (Suppl. Fig. S2B).
Subsequent analysis of the combined sleep day curves (Figure 2b) and statistical analysis of the observed differences (Figure 1d and Suppl. Table S1) show that the sleep probability during an 8-h forced activity interval is significantly reduced (>90%, p < 0.01) and that, independent of the type of shift, sleep is limited to less than 20 min (or 0005-0033 h, Suppl. Table S1). Compared to days off, the 1 h 21 min day sleep loss on “day shift” working days is significantly (p < 0.05) paid off by 1 h 12 min extra sleep during the evening. On the other hand, the 3 h 9 min evening sleep loss during an “evening shift” and the 3 h 30 min night sleep loss during a “night shift” are only partly compensated for by about 90 min of extra sleep during the day and, in the case of a “night shift,” 36 min of extra sleep during the evening (albeit not statistically significant). This would suggest that these mice sleep shorter on days with an “evening” or “night shift.” Indeed, in comparison with free days and “day shift” days, 24-h sleep levels appear somewhat (albeit not statistically significant) less on days with “evening” or “night shifts” (Figure 1d).
Taken together, these data demonstrate that forced activity schedules, as facilitated by the TSR cage, serve as a valid tool to simulate the voluntary deviation from standard working hours and induce disturbed sleep-wake patterns in animals, in a way that is very similar to what actual human shift workers experience.
Impact of Simulated Rotation Shift Work on Sleep
To study the impact of shift work on breast cancer initiation, we set up a cohort of 7- to 11-week female p53R270H©/+WAPCre mice and allocated them randomly to groups exposed to a clockwise (CW) or counterclockwise (CCW) rotating shift work schedule (n = 25 animals per group) and took animals exposed to only “day shifts” along as controls (CTRL, n = 28 animals; see Figure 1c). Animals were exposed to this protocol until end-of-life (Figure 1c). Two weeks after the start of the experiment, we analyzed sleep probability, using the transmitter containing mice, added to (but not part of) the cohort (n = 4-5 animals/group). Similar to the validation study (Figure 2), we found overall that sleep is reduced during periods of forced activity (independent of the type of simulated shift work), while at other moments of the day, sleep is increased compared with the controls (Figure 3a-3c). Next, we investigated to what extent the different shift work schedules impacted sleep distribution and overall day sleep (during the active phase).
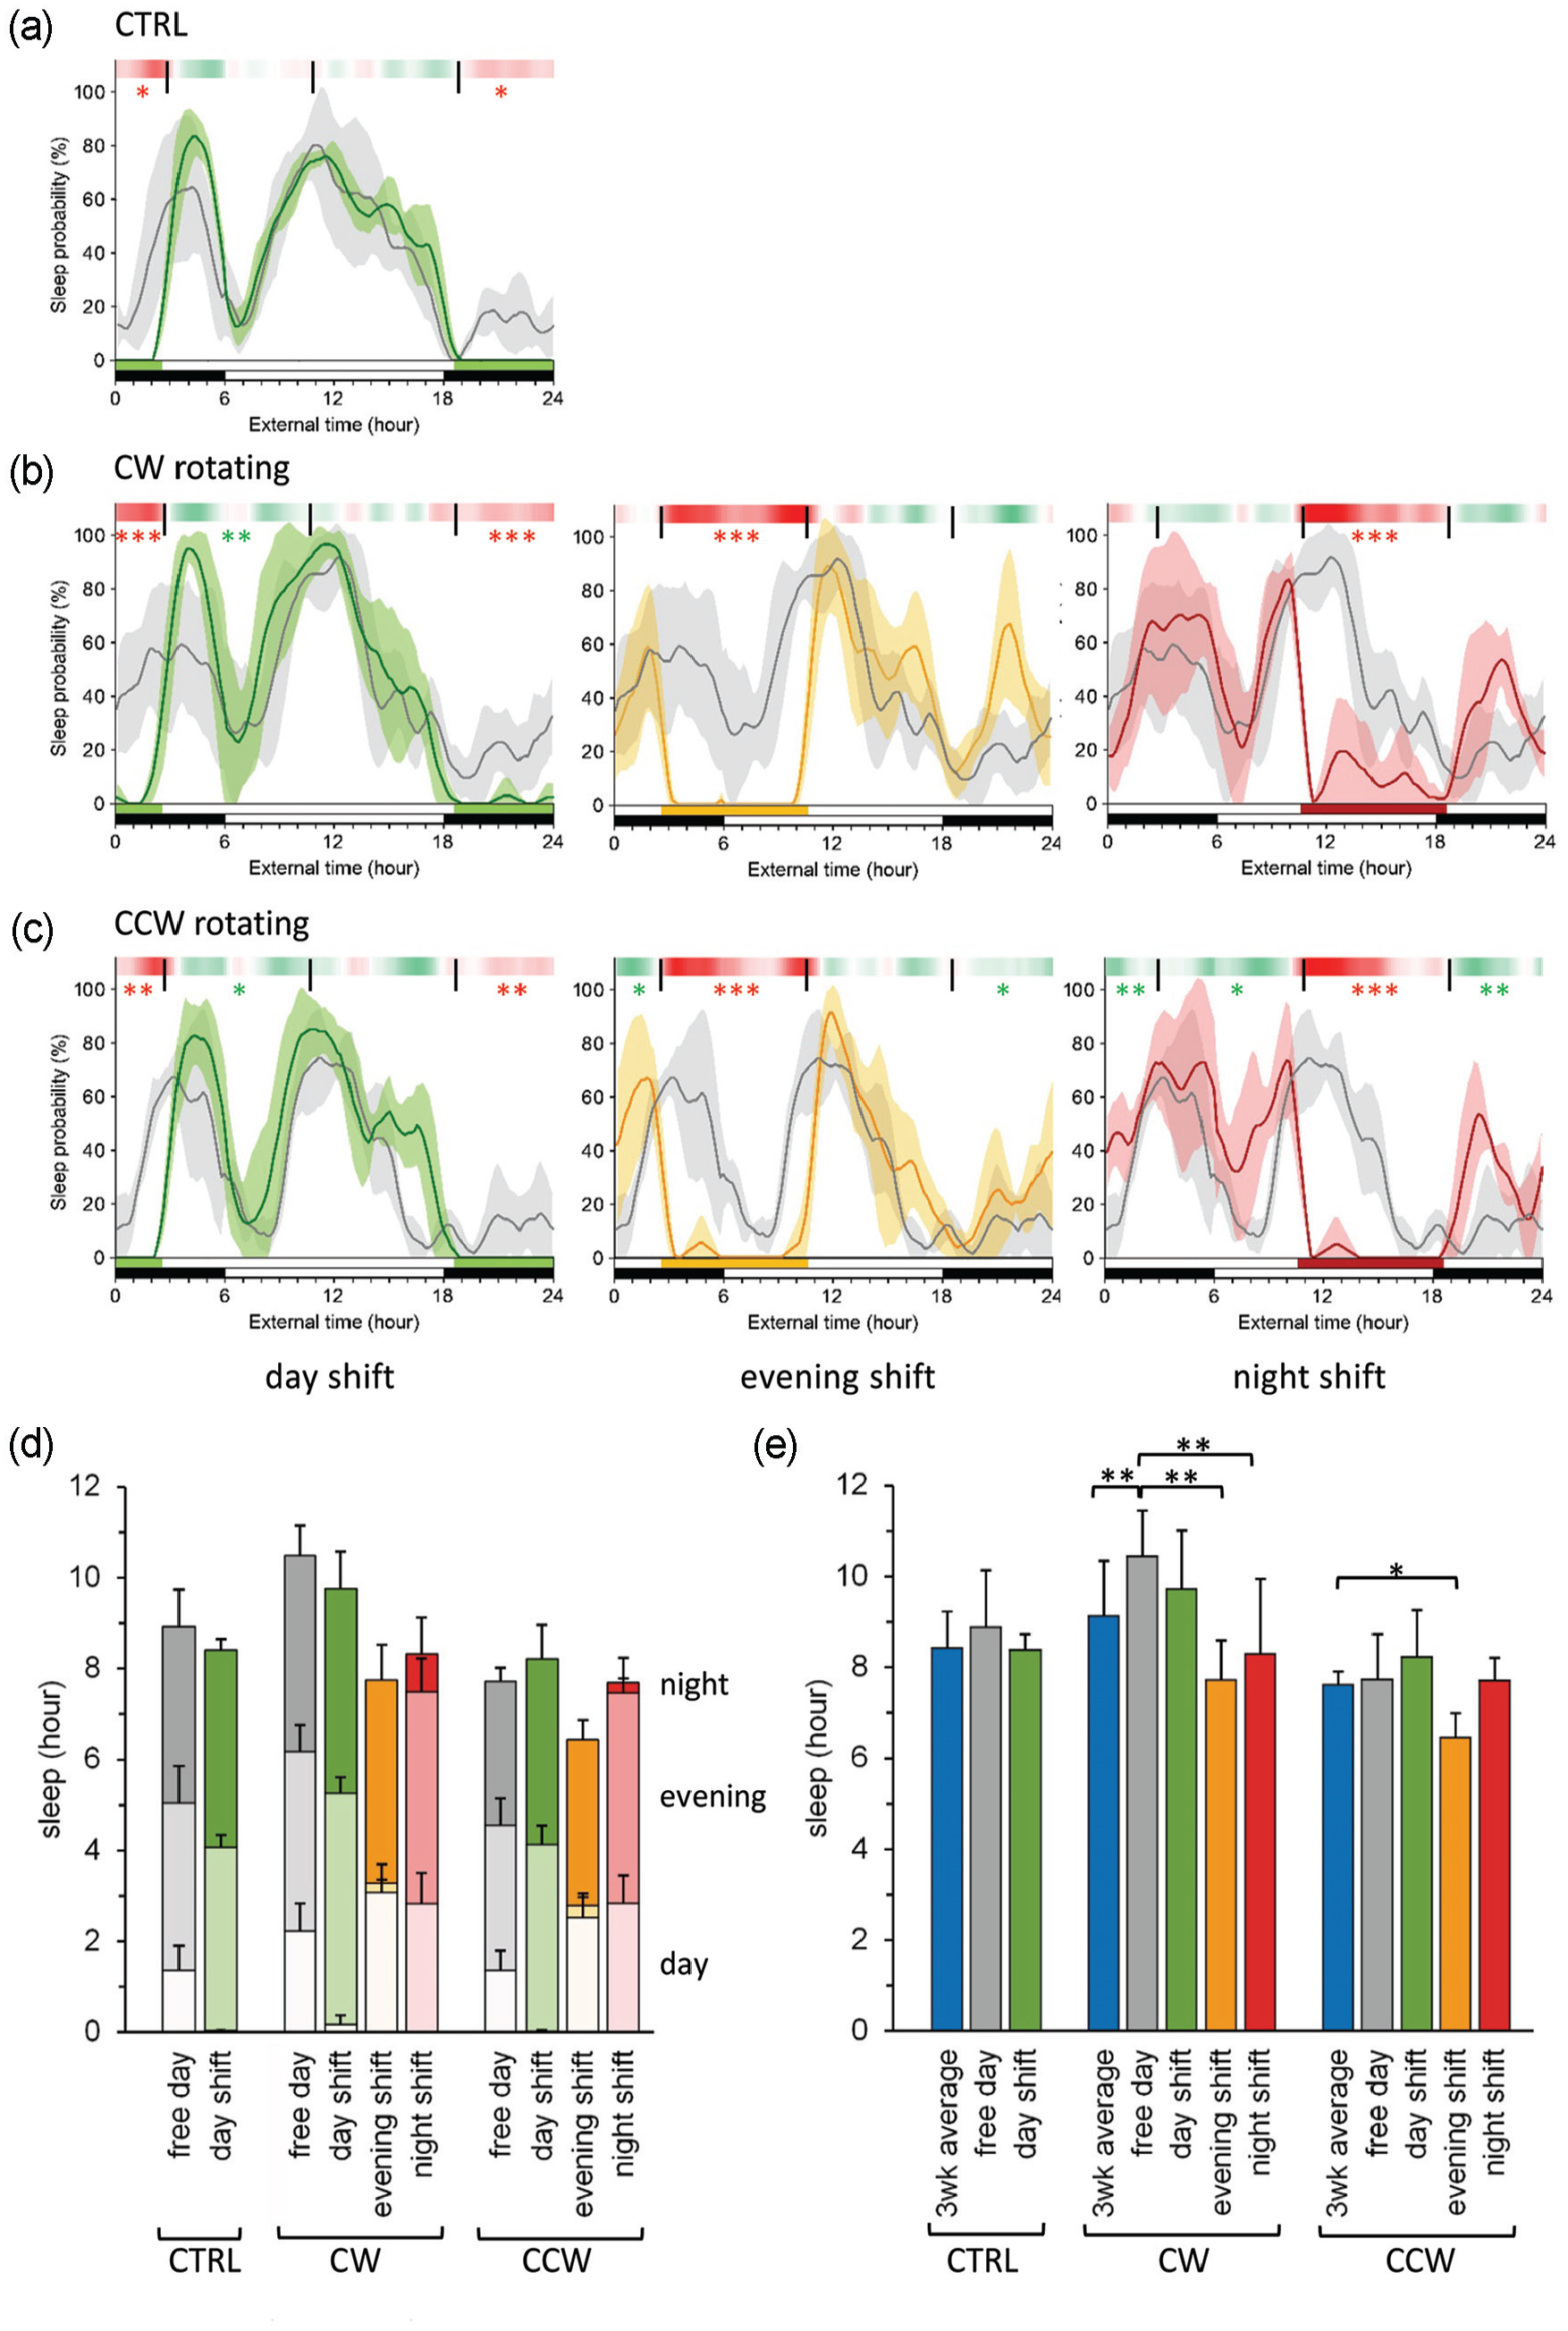
Sleep behavior under normal or simulated shift work conditions. (a-c) Sleep day curves for animals (n = 4-5 per group) exposed to regular work weeks (CRTL; panel a), forward rotating shift work weeks (CW; panel b), and backward rotating shift work weeks (CCW; panel c). Sleep is expressed as the percentage of mice estimated to be asleep at a given time. Shown is sleep on free days (gray lines), regular/morning shift days (green lines), “evening shift” days (yellow/orange lines), and “night shift” days (red lines). Shaded areas represent 1 standard deviation from the mean. Light/dark phases and forced activity periods are indicated by the black-and-white or colored horizontal bars, respectively. Differences in sleep probability (Δ sleep, as calculated per 10 min bin) between working and free days are indicated by a heatmap, in which red represents sleep loss on working days and green indicates extra sleep. Asterisks represent statistical significance of sleep loss or extra sleep during the day (ExT18.5-2.5), evening (ExT2.5-10.5), or night (ExT10.5-18.5), as indicated in Suppl. Table S3. *p < 0.05. **p < 0.01. ***p < 0.001. (d) Quantitative analysis of sleep distribution. Indicated is sleep during the day (light colors), evening (intermediate colors), or night (dark colors) on free days (gray bars) and “day shift” (green bars), “evening shift” (yellow/orange bars), or “night shift” days (red bars). Error bars represent standard deviations. Statistical significance of sleep loss or extra sleep during a specific time window is not included here, but can be deduced from the heat maps in panels (b) and (c) or Suppl. Table S2. (e) Total daily sleep on free days (gray bars) and on regular/“day shift” (green bars), “evening shift” (yellow/orange bars), or “night shift” (red bars) working days. Blue bars indicate the average sleep per day over 3 weeks. Error bars represent standard deviations. *p < 0.05. **p < 0.01. ***p < 0.001. Color version of the figure is available online.
Regular Day Work
In the CTRL group (Figure 3a), the significant day sleep loss during “day shifts” (1 h 20 min; p < 0.05) appears to be compensated for by some (yet not significant) additional sleep during the evening (21 min) and night (29 min), leaving the animals with an overall sleep loss of 30 min during “day shift” working days (Figure 3d and Suppl. Table S2). However, this reduction in total sleep on working days does not significantly differ from overall sleep on free days or from the average overall sleep calculated over a full cycle of 3 working weeks, that is, containing a “day,” “evening,” and “night shift” week (Figure 3e and Suppl. Table S2).
Forward Rotating Shift Work
In the CW rotating shift work group (Figure 3b), day sleep loss during “day shifts” (2 h 2 min; p < 0.001) is markedly paid off by extra evening sleep (1 h 9 min; p < 0.05), with some additional sleep during the night (11 min; ns), resulting in an overall sleep loss of 44 min per day (ns, Figure 3d and Suppl. Table S2). In case of “evening shifts”, however, mice hardly compensate for the substantial evening sleep loss (3 h 45 min; p < 0.001), as the extra sleep during the day (50 min; ns) and night (9 min; ns) still renders animals with a 2 h 44 min overall sleep loss on “evening shift” days (p < 0.01). Similarly, the marked night sleep loss during “night shifts” (3 h 29 min; p < 0.001) is not prominently counterbalanced by extra sleep during the day (36 min; ns) and evening (43 min; p < 0.05), as evident from the 2 h 9 min overall sleep loss on “night shift” days (p < 0.01). Indeed, when comparing the total sleep between shift work days with free days (Figure 3d and Suppl. Table S2), the sleep loss is more than 2 h and statistically significant for both evening (p < 0.01) and “night shift” days (p < 0.01). Yet, when overall sleep on free and shift working days was compared with the 3-week average sleep (in which a full cycle of shifts is completed), we did not observe any significant differences in the total amount of daily sleep (Figure 3e and Suppl. Table S2). It should be noted that animals on a CW shift work schedule seem to be sleeping more than the 3-week average (1 h 19 min; p < 0.01) on free days, suggesting that days off are used for rebound sleep.
Backward Rotating Shift Work
In the CCW rotating shift work group (Figure 3c), and in contrast to the CTRL and CW rotating shift work group, “day shift”–related loss in day sleep (1 h 20 min; p < 0.01) appears to be overcompensated by 30 min of extra sleep (compared with free days), which results from a trend toward extra sleep in the evening (54 min; ns) and night (55 min; ns) (Figure 3d and Suppl. Table S2). Similar to CW shift working animals, evening sleep loss in mice exposed to a CCW rotating schedule (2 h 57 min; p < 0.001) is counteracted by a trend toward extra sleep during the day (1 h 10 min; ns) and night (29 min; ns), limiting the overall sleep loss on “evening shift” days to 1 h 17 min (p < 0.05) . Interestingly, during “night shifts,” the loss of night sleep (2 h 57 min; p < 0.001) is completely compensated for by additional sleep during the day (1 h 29 m; p < 0.01) and evening (1 h 26 min; ns) (Figure 3d and Suppl. Table S2). A comparison of total daily sleep on free days and working days reveals that the CCW schedule does not result in significant sleep loss during work days, as was the case for animals subjected to “evening” or “night shifts” in the CW schedule (Figure 3e and Suppl. Table S2). This observation can be well explained by the higher levels of rebound sleep during non-working hours, although, in comparison with the average daily sleep over 3 weeks, animals still sleep significantly less on CCW “evening shift” days (Figure 3e and Suppl. Table S2).
To determine whether the mice adapted to the forced activity protocol, or oppositely developed severe sleeping problems, we repeated the sleep probability measurements 15 weeks after the start of the forced activity protocol. Again, we did not observe any major differences in the overall sleep, nor any changes in the sleep distribution over the day when comparing sleep behavior from the first period (weeks 2-4) with the second (weeks 15-17; Suppl. Table S4). Animals are still awake when subjected to forced activity during the “day,” “evening,” or “night shifts,” and any sleep loss is compensated by extra sleep during the other parts of the day.
In conclusion, we did not observe significant differences between “day shift” working mice (CTRL group) or forward and backward rotating shift working mice (CW and CCW group, respectively) when total sleep in these groups was compared with average sleep over a completed 3-week cycle of shift work. This indicated that the overall sleep duration was not affected by the shift work (Suppl. Table S2). Individual shifts, however, can give rise to sleep loss. This particularly holds true for “evening” and “night shifts” in a forward rotating schedule (which goes along with rebound sleep on free days), and to a lesser extent for “evening shifts” in a backward rotating schedule.
Impact of Rotating Shift Work Schedules on Core Body Temperature Rhythms
Previously, we have shown that reversing the light/dark cycle causes the circadian clock of p53R270H©/+ WAPCre mice to shift 12 h within 4 days using core body temperature rhythms as a read-out (Van Dycke et al., 2015a). To investigate whether simulated shift work through forced activity also causes the circadian system in these mice to shift, we analyzed core body temperature rhythms next (weeks 2-4). In the absence of forced activity, female p53R270H©/+ WAPCre mice show a stable and highly reproducible temperature rhythm with a main peak at the light/dark transition and a second smaller peak around the dark-light transition (Figure 4a, gray curves). Exposure of the animals to any of the shift work types does not significantly change the overall shape of the temperature day curves (Figure 4a-4c, colored curves), although forced activity appears to result in a slightly higher body temperature during working hours, and is accompanied by a drop in temperature on the other moments of the day. Although these differences only occasionally reach statistical significance (Suppl. Table S3), they are in line with the notion that physical activity leads to additional heat production due to muscle contractions. Indeed, when the delta core body temperature (difference between work and free days) is plotted versus the delta sleep (difference between work and free days) for all 10 min bins, there is a positive correlation between increased temperature and sleep loss (Figure 4d). And yet, despite these forced activity–related core body temperature changes, we did not observe any shifts in the position of the 2 temperature peaks, suggesting that the temperature rhythm, and by proxy the circadian system, was not phase-shifted by any of the applied shift work schedules.
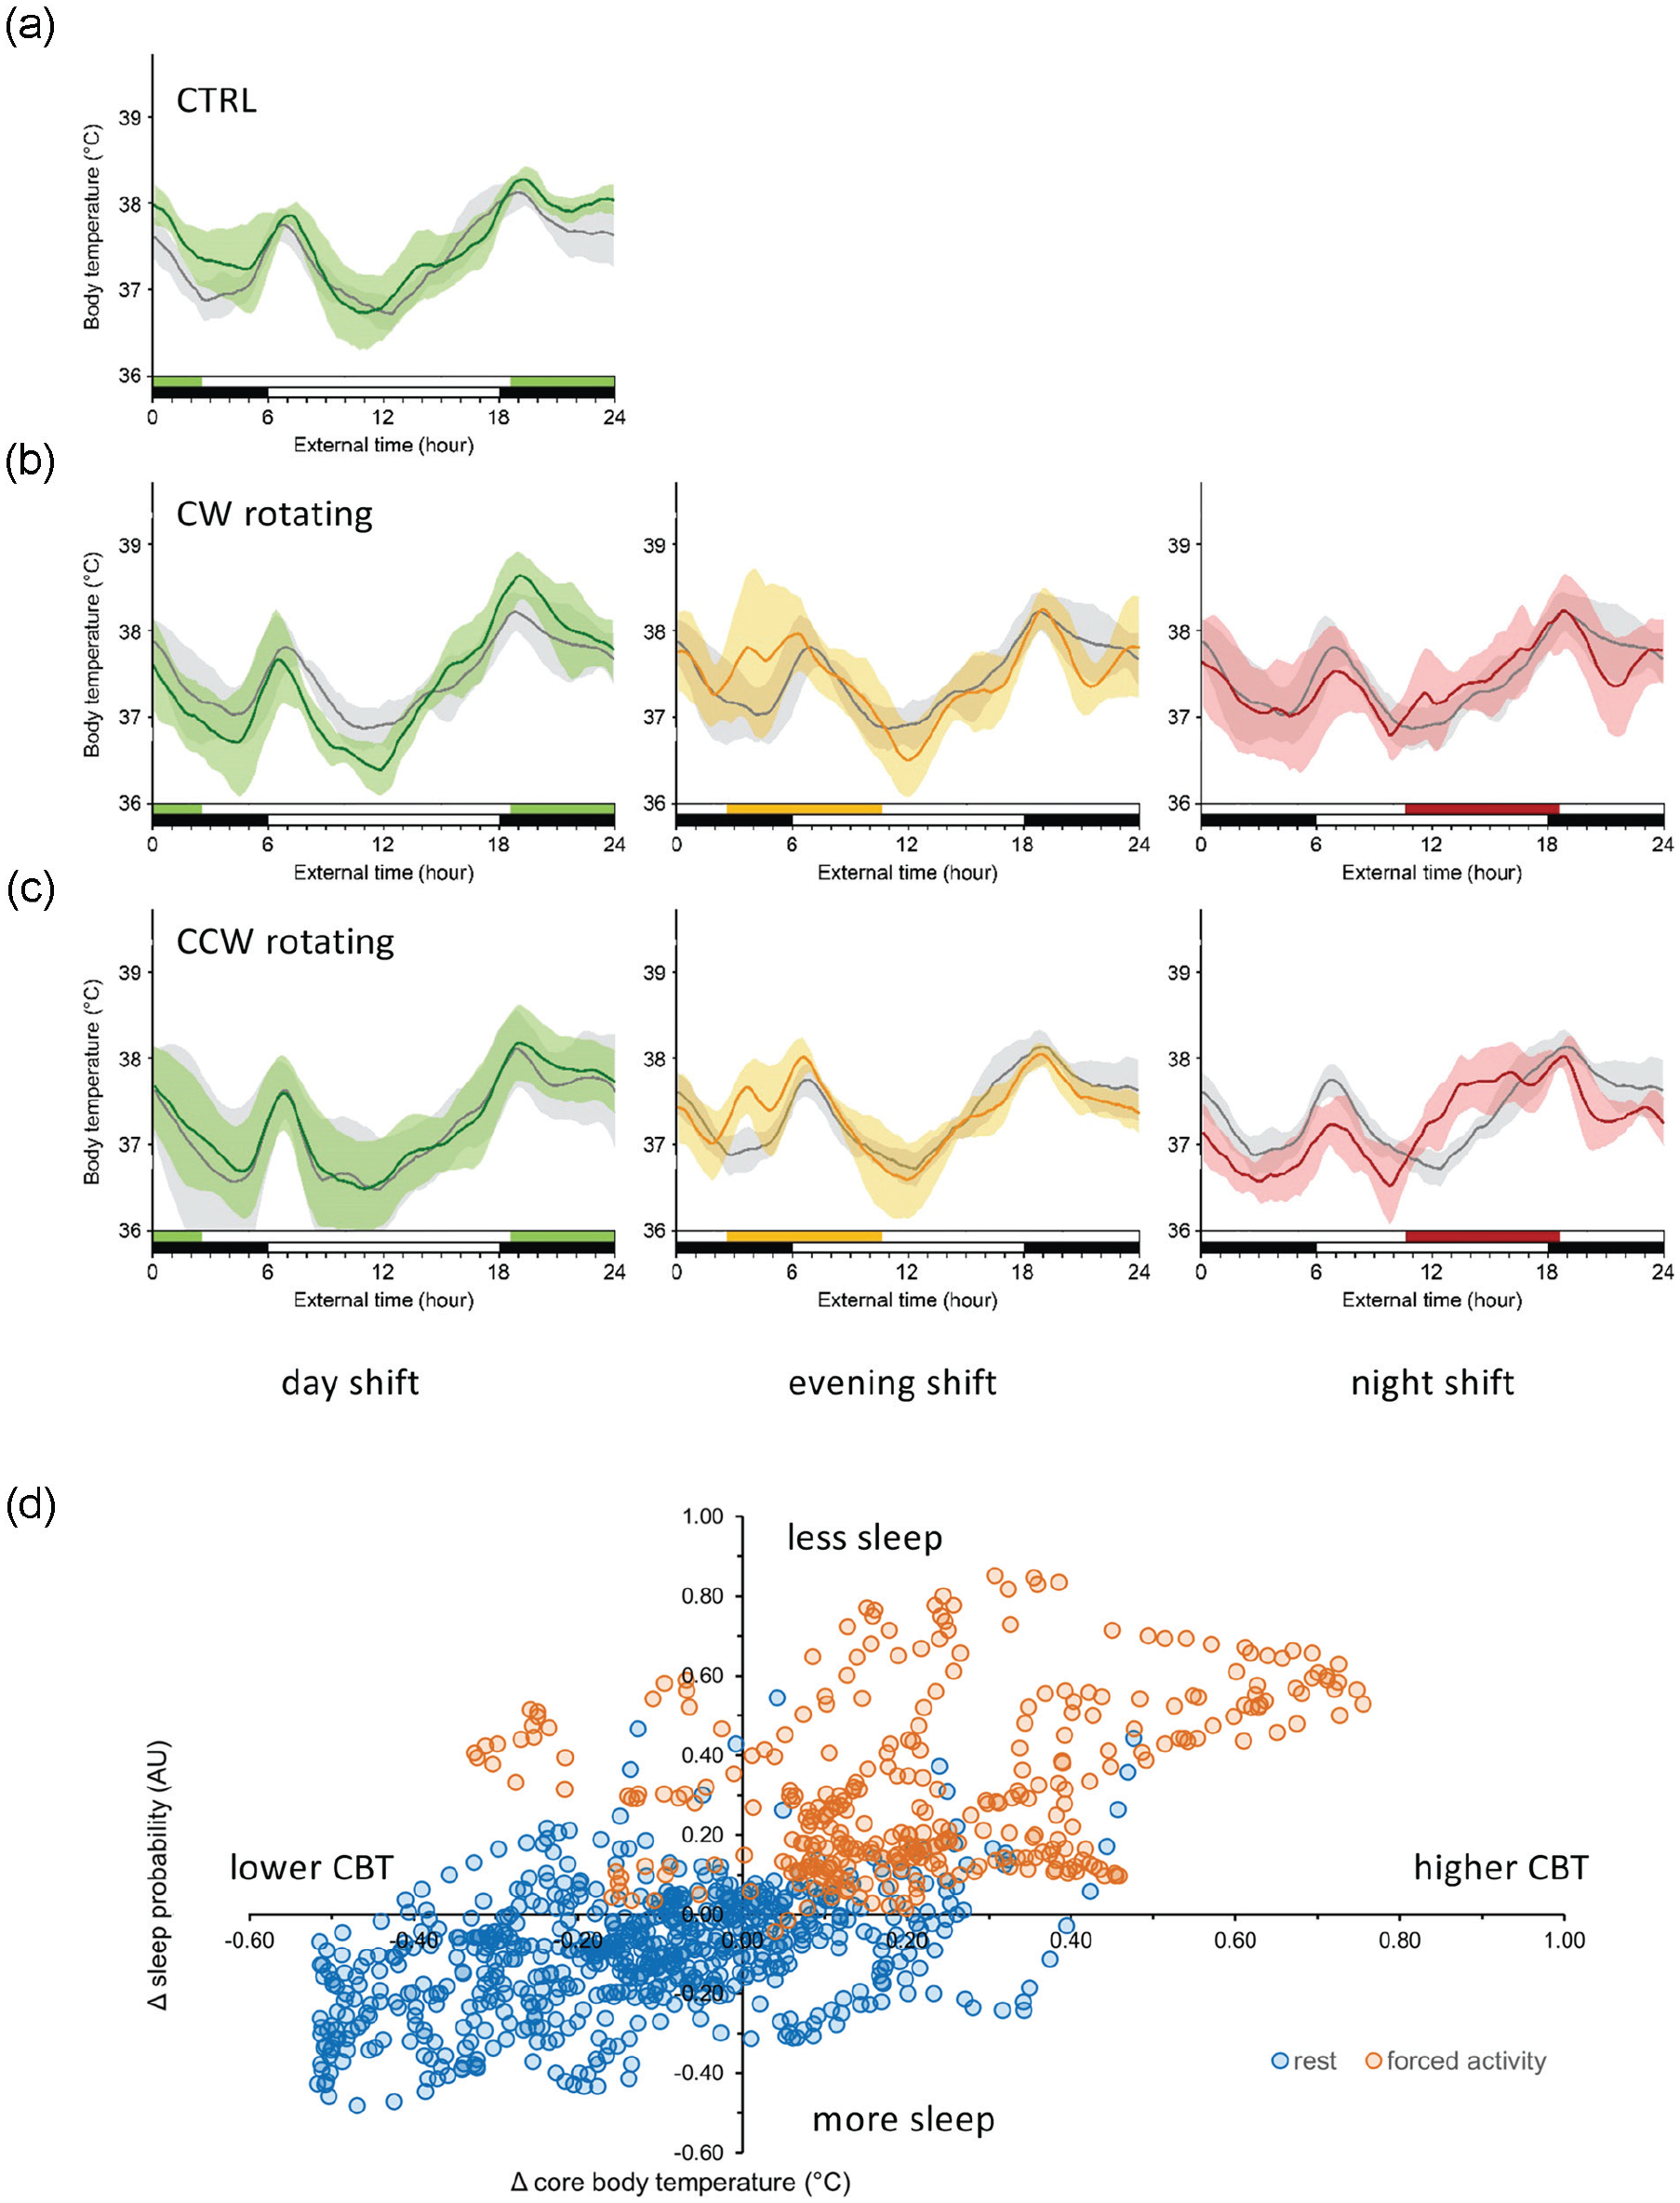
Core body temperature under normal or simulated shift work conditions. (a-c) Core body temperature day curves for animals (n = 4-5 per group) exposed to regular work weeks (CRTL; panel a), forward rotating shift work weeks (CW; panel b), and backward rotating shift work weeks (CCW; panel c). Shown are the temperature curves on free days (gray lines), regular/morning shift days (green lines), “evening shift” days (yellow/orange lines), or “night shift” days (red lines). Shaded areas delineate 1 standard deviation from the mean. Light/dark phases and forced activity periods are indicated by the black-and-white or colored horizontal bars, respectively. (d) Scatter plot of sleep probability differences (Δ sleep work days vs days off) against core body temperature differences (Δ CBT work days vs days off) for each available 10-min bin point. Orange and blue dots indicate time points (10 min bins) during which the rotating arm was on or off, respectively. Note that forced activity is linked to reduced sleep and higher core body temperature. Color version of the figure is available online.
Long-Term Health Effects
Previously, we found that circadian disturbance by chronic jet lag affects weight gain of young adult p53R270H©/+ WAPCre mice (Van Dycke et al., 2015b). As shown in Figure 5a, in this study we observed that the relative weight gain of mice exposed to forward (CW) or backward (CCW) rotating shift work protocols was not significantly different from control mice, which were exposed to “day shifts” (2-way repeated=measures ANOVA: F50,1325 = 0.75, p = 0.85).
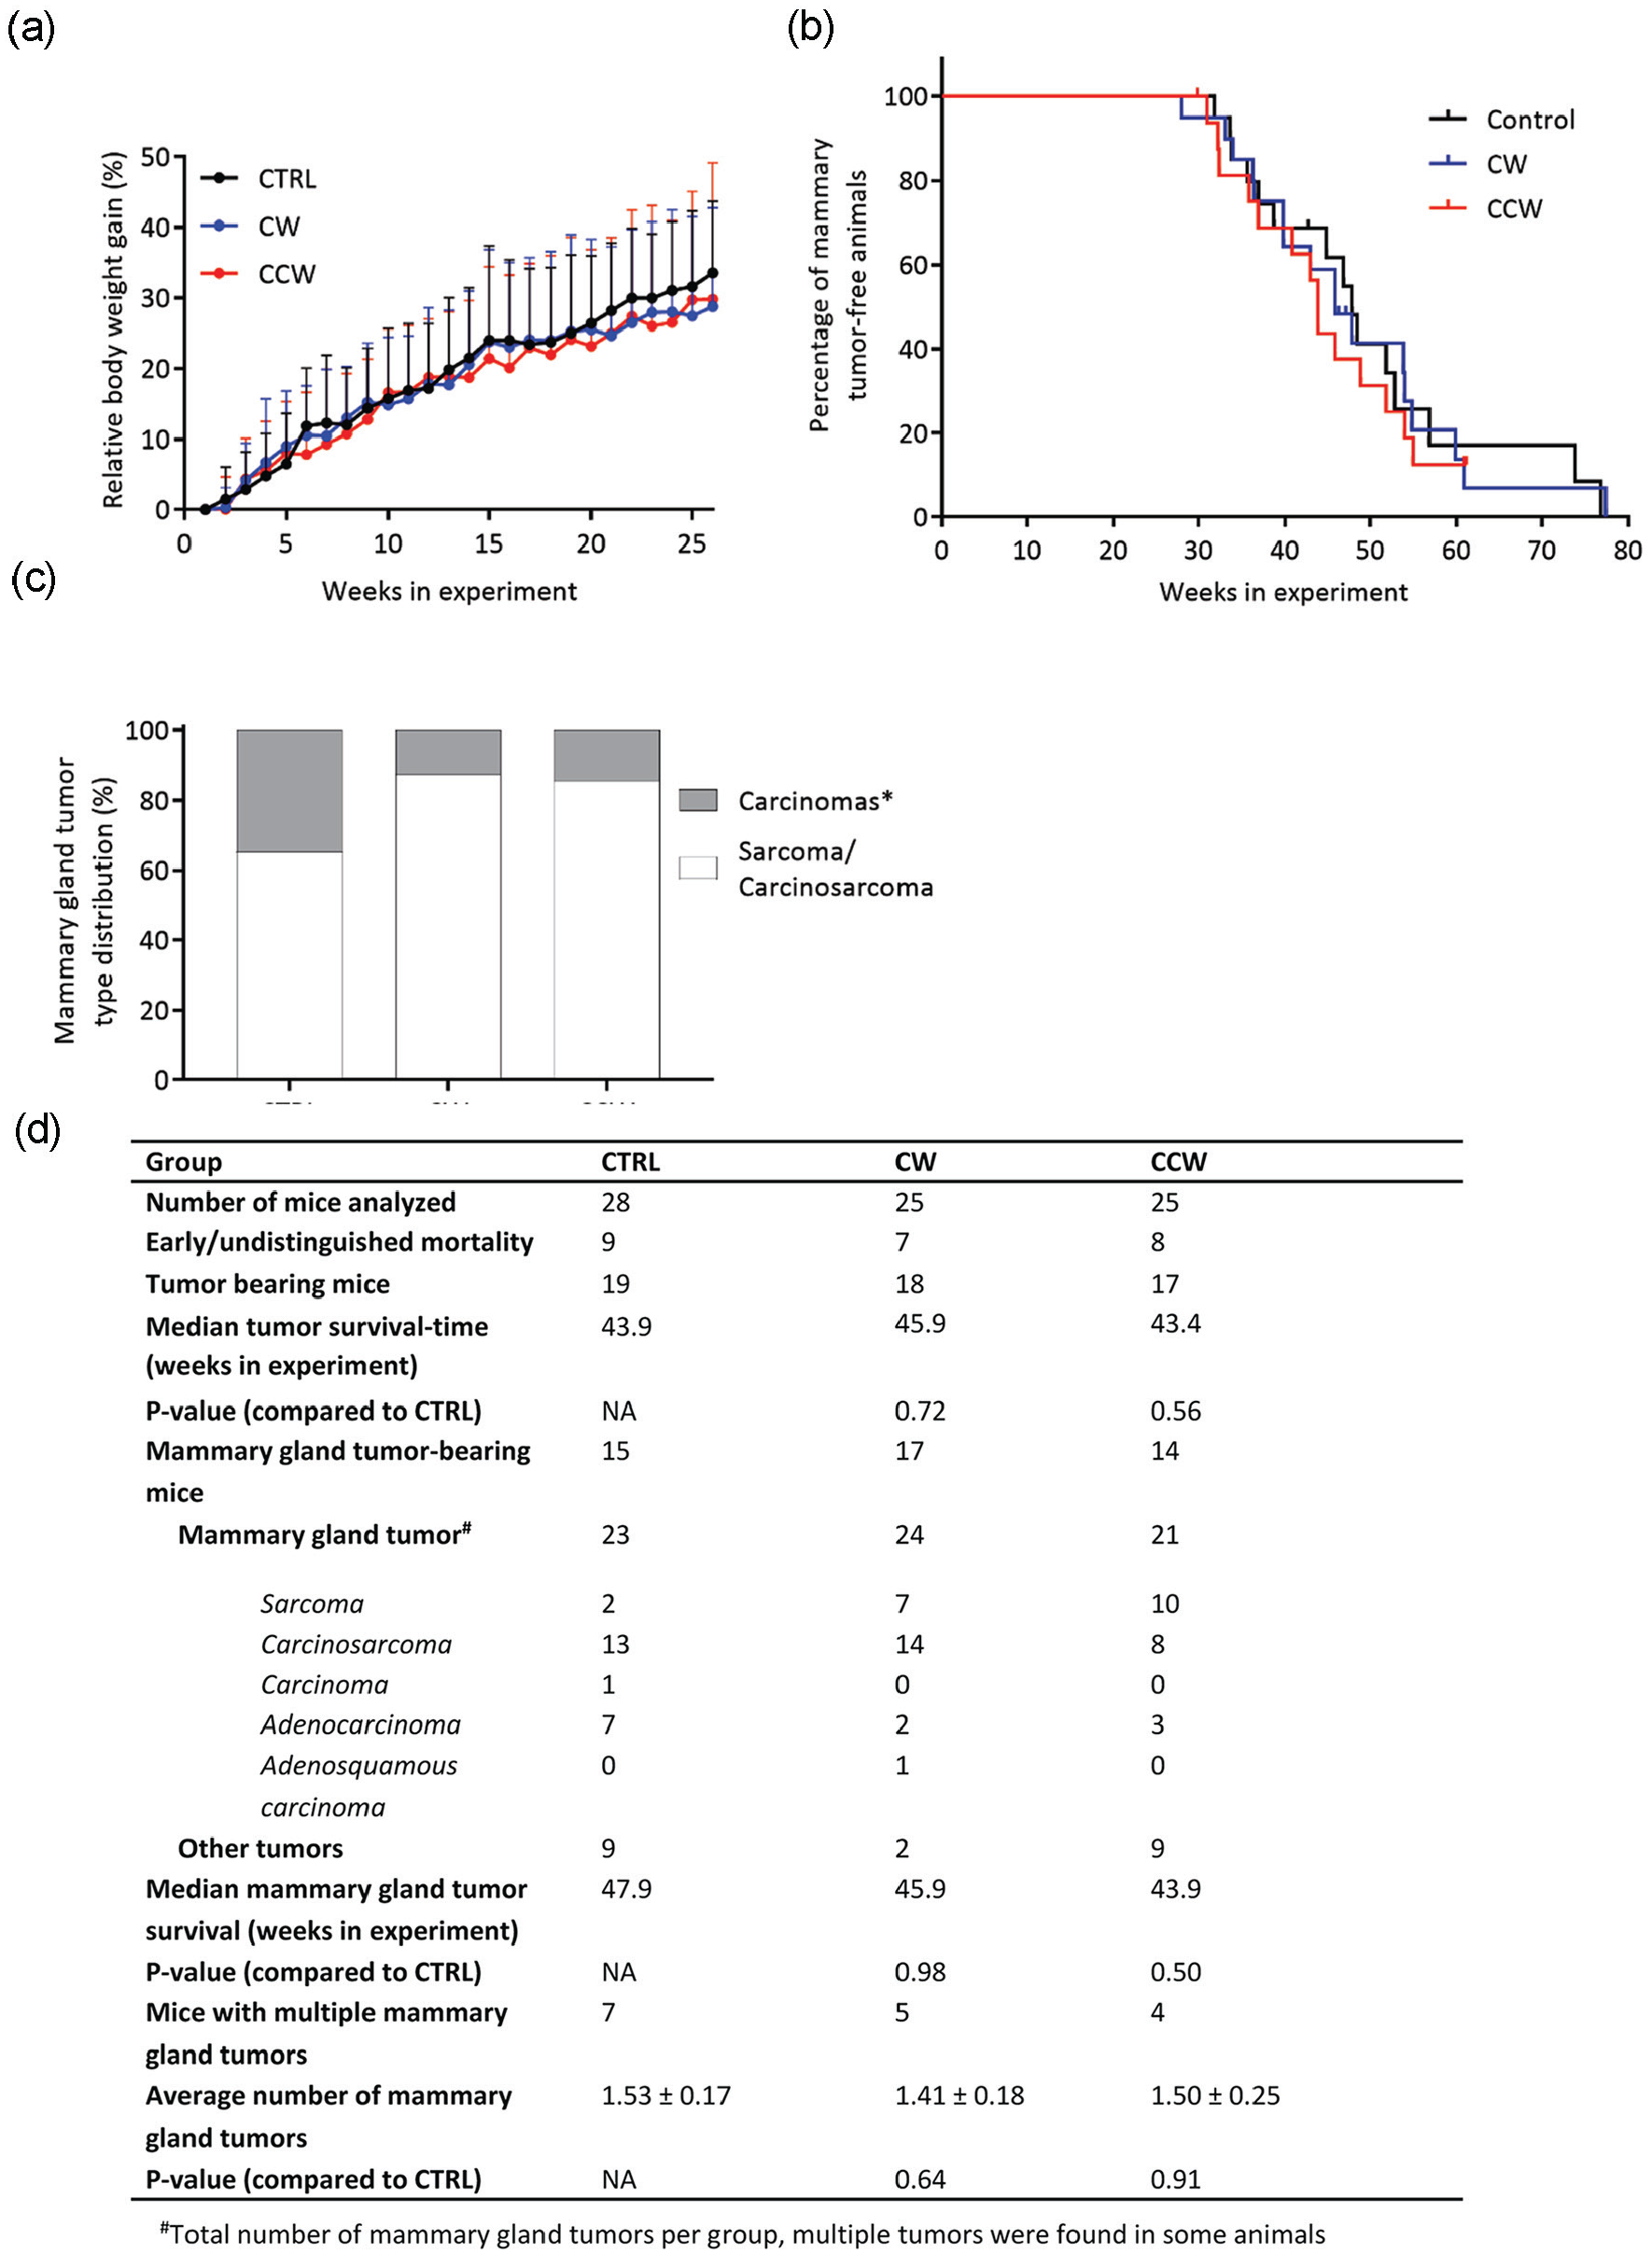
Effect of simulated rotating shift work on body weight gain, tumor latency, and mammary tumor spectrum in female p53R270H©/+WAPCre mice. (a) Relative body weight gains (%) over a 26-week period of exposure to simulated rotating shift work (“day shift” only) weeks (CRTL; n = 20) and forward (CW; n = 19) or backward (CCW; n = 17) rotating shift work weeks. Group means were calculated from individual animal weights, which were normalized to body weights at the start of the experiment. Error bars indicate 1 standard deviation from the mean (SD). (b) Survival curves were generated according to the Kaplan-Meier method; statistical comparisons were made using the log-rank (Mantel-Cox) method. Animals entered the experiment at the age of 7-11 weeks and were exposed to simulated rotating shift work until the end of life. Tumors appeared from about 28 weeks of experiment onward. The survival curve displays mice in which a mammary tumor was found, whereas a vertical small line on the curve illustrates mice that died because of another tumor. The CCW curve does not drop to zero as the last mouse was censored, as death was caused by another tumor (non-mammary tumor). (c) Bar chart indicating the mammary tumor type distribution (%) per experimental group. Tumor types were divided in 2 categories: carcinomas (*= which could be classified into solid carcinomas, adenocarcinomas, and adenosquamous carcinomas) and sarcomas or carcinosarcomas. The mammary tumor type distribution was not significantly different between the groups (chi-square test; p = 0.12) (d). Table listing several animal and tumor data per experimental group. Other tumors were found in lung (bronchioalveolar carcinoma), spleen (lymphosarcoma), uterus (histiocytic sarcoma, hemangiosarcoma, carcinoma and adenocarcinoma), ovary (histiocytic sarcoma), liver (histiocytic sarcoma), and lymph nodes (lymphosarcoma).
All animals were tumor-free over the first 26 weeks of exposure to simulated shift work and were sacrificed due to tumor growth from about 28 to 78 weeks in experiment (Figure 5b). Median survival were 47.9 weeks in the CTRL group and 45.9 and 43.9 weeks in the CW and CCW groups, respectively (Figure 5b and 5d), and there were no statistically significant differences between the groups (log-rank (Mantel-Cox) test, p = 0.88). This indicates that the used TSR protocol did not have an effect on mammary tumor initiation in the female p53R270H©/+WAPCre mice.
Each experimental group showed limited mortality that was unrelated to mammary tumor development (i.e., animals having a different tumor before a mammary tumor, or due to a diagnosed or unknown cause of death unrelated to tumors), and these animals were excluded from further data analysis (CTRL: n = 9, CW: n = 7, and CCW: n = 8; Figure 5d). This shows that the expression of the p53R270H©/+ WAPCre mutation was not exclusively restricted to the mammary gland, as was previously observed (Van Dycke et al., 2015b). The remaining animals were all sacrificed with mammary tumors (CTRL: n = 15, CW: n = 17, and CCW: n = 14), and there were some animals with multiple tumors (CTRL: n = 7, CW: n = 5, and CCW: n = 4). All mammary tumors were taken together per group and classified into 2 categories (carcinoma and sarcomas/following microscopic examination [Figure 5c]). Statistical analysis of the distribution of these mammary tumor classes across the groups revealed no significant result when comparing all groups (chi-square test, p = 0.12). This suggests that exposure to the rotating shift work schedule does not increase the incidence of specific mammary tumors, compared with exposure to the control shift work schedule.
In conclusion, there is no effect of simulated rotating shift work on metabolic outcome measures, such as body weight gains over time, or on mammary tumor latency time in female p53R270H©/+WAPCre mice.
Discussion
Previously, we have shown that circadian disturbance due to chronic jet lag promotes tumor development in the p53R270H©/+ WAPCre mouse model of breast cancer (Van Dycke et al., 2015b). In this study, we used the same mouse model to investigate the carcinogenic properties of shift work. To this end, we have designed and validated a shift work–mimicking protocol using TSR cages and exposed the animals to forward (CW) or backward rotating (CCW) shift work schedules and investigated the estimated sleeping patterns and effect on mammary tumor development.
To the best of our knowledge, this is the first study that has used TSR cages to mimic chronic shift work in mice, and we therefore first explored whether these cages kept animals awake during a “day,” “evening,” or “night” shift. The gold standard for sleep analysis in humans is taking electroencephalograms (EEGs) of brain activity, but doing this in mice is rather challenging. We therefore chose to predict sleep patterns from telemetry-based recordings of animal activity (Roenneberg et al., 2015; Van Dycke et al., 2015b). When the gentle forced activity was applied to mice, the sleep probability is close to zero, suggesting that, irrespective of the work shift type, the animals were awake during shift hours in which the bar inside the cage was rotating. There is no overall sleep loss due to the rotating shift work over a 3-week period, and this can be explained by catching up on sleep during free days. Previous studies in human shift workers generally do show a reduction in total sleep time in periods with night shifts (Hulsegge et al., 2019). This might be due to the fact that for shift workers it is more difficult to catch up on sleep on free days as a result of social obligations (e.g., parental commitments) and/or due to the inability to sleep during the day, when our biological clock dictates us to be awake (Åkerstedt and Wright, 2009; Costa, 2010; Sallinen and Kecklund, 2010; Juda et al., 2013; Casjens et al., 2022).
A limitation of using telemetry to predict sleep patterns is that we were unable to predict different sleep stages (e.g., NREM and REM sleep), and therefore, sleep architecture might still be affected. Studies investigating sleep structure in human night shift workers are limited, although there are indications that sleep structure might be affected in addition to sleep duration, in particular in night shift workers who experience fatigue (Gorlova et al., 2019). The development of multisensory trackers (such as commercially available health trackers) might allow more feasibility of studies into sleep architecture in night shift workers in the future (Clark et al., 2021). Another limitation of this is that all mice were exposed to the rotating bar and thus TSR. As such, we could not investigate whether being exposed to TSR during the active phase (our “day-shift” control group) influences sleep, activity, or core body temperature compared to no TSR at all (an “unemployed” control group). Whereas the alternating light schedules in our previous jet lag study were chronically shifting the core body temperature rhythm (Van et al., 2015a), in this study, the acrophase of the body temperature rhythms did not change when the mice were exposed to CW or CCW shift work schedules. The low variability between days in the sleep curves on shift work days, as indicated by the low standard deviation, further supports the absence of an effect on the body temperature rhythm. Taken together, these results show that the CW and CCW shift work–mimicking protocols do not lead to a phase shift of the biological clock in mice. These observations appear to be in line with human studies in which endogenous circadian rhythms do not adjust to shift work easily, although research in night shift workers is limited (Folkard, 2008; Arendt, 2010). Here, our data indicate that being awake does not shift the endogenous biological rhythm in mice. In contrast, previous research showed that non-photic stimuli, such as vigorous locomotor activity, were able to entrain the circadian rhythm, which can induce a phase shift (Mrosovsky, 1996; Mistlberger and Skene, 2004; Hilaire et al., 2007).
Another important entrainer of peripheral tissues is timing of food consumption (Stephan, 2002). In the study from Salgado-Delgado et al. (2008), for instance, rats were kept awake during the inactive phase by a slowly rotating wheel, and it was found that the nocturnal food consumption of the animals decreased while the diurnal consumption increased (Salgado-Delgado et al., 2008). In our study, food was not monitored separately for nocturnal and diurnal consumption, so it remains unknown whether the mice adapted their feeding habits. Salgado-Delgado and coworkers did not measure core body temperature rhythms, but instead observed that rhythmic expression of PER1 and PER2 proteins in the SCN remained unaltered. The absence of a phase shift in the core body temperature rhythm in the animals in our study, as well as in other parameters in the Salgado-Delgado study, may result from the stable light/dark cycles applied in both studies. Further studies are needed, therefore, to improve our understanding of how these factors may affect endogenous circadian rhythms. This might relate to the hypothesis that exposure to night shift work results not only in a misalignment between the circadian system and the external light-dark cycle, but also in a state of internal desynchronization between various levels of the circadian system (Boivin et al., 2022).
The forward or backward rotating shift work schedules did not affect mammary tumor latency tumor spectrum, or food consumption or body weight gain in the animals, compared with the regular “day shift” work schedule. No changes in tumor spectrum are in line with our previous study in which circadian rhythm disturbance was induced by exposing the mice to an alternating light/dark schedule (Van Dycke et al., 2015b). It is important to note that the strain of mice can influence tumor type in p53-deficient mice. For example, BALB/c mice tend to show a different tumor spectrum (Chan et al., 2021; Majhi et al., 2021), with a relatively high percentage of adenosarcomas compared with several other genetic backgrounds (such as A/J mice).
In our previous study, the mice exposed to weekly alternating light/dark schedules did show a reduction in mammary tumor latency and increased body weights (Van Dycke et al., 2015b). In this previous study, the latency to mammary gland tumor development was reduced by 17% in the mice exposed to alternating light/dark schedules compared with the control mice (median latency time: 42.6 vs 50.3 weeks, respectively). In this study, median survival was47.9 weeks in the CTRL group, and 45.9 and 43.9 weeks in the CW and CCW groups, respectively. A possible explanation for these contrasting results is that in this study no phase shift in core body temperature rhythms was detected. Another explanation could be that the rotating shift work schedules in the current setting were not severe enough as a circadian clock disturbing stimulus, as mice were only exposed to 5 nights of shift work every 3 weeks and this might have allowed for sufficient compensation time. This might be reflected in the observation that no differences in overall sleep duration between the groups were detected over these cycles of 3 weeks. Also, the difference in experimental setup is an important factor for finding different results. A last explanation could be that the ad libitum availability of food may have masked a minor effect from the altered sleep patterns induced by the simulated shift work. Interestingly, all these aspects (e.g., phase-shifting, sleep disturbance, timing of food consumption) have been proposed as underlying mechanisms to link shift work to increased breast cancer risk in humans. In addition, diet composition, in particular fat content, could be of influence on mammary tumor incidence (Zhu et al., 2016). Future studies could also include monitoring the effects of TSR on the estrous cycle, as chronic circadian disturbance is associated with irregular menstrual cycle and menopause age in women (Lawson et al., 2011; Stock et al., 2019). As unraveling causal mechanisms that link shift work to long-term health outcomes is difficult in epidemiological studies due to the complexity of factors involved and the relatively long duration of such studies in comparison with animal studies, the TSR cages presented in this study allow for further research disentangling these underlying mechanisms.
To summarize, TSR cages offer a unique opportunity to test potential factors underlying the health effect of night shift work in tractable mouse models and easily control for confounding factors, such as the daily light/dark cycle. Further studies using these cages will aid in further disentangling the complex interplay of factors involved in night shift work and other circadian disturbances. In conclusion, our study shows that TSR shift work protocols in female p53R270H©/+WAPCre mice merely alter sleep patterns, without affecting core body temperature rhythms, and light/dark exposure does not affect mammary tumor initiation or tumor types.
Supplemental Material
sj-tif-5-jbr-10.1177_07487304231178340 – Supplemental material for Impact of Simulated Rotating Shift Work on Mammary Tumor Development in the p53R270H©/+WAPCre Mouse Model for Breast Cancer
Supplemental material, sj-tif-5-jbr-10.1177_07487304231178340 for Impact of Simulated Rotating Shift Work on Mammary Tumor Development in the p53R270H©/+WAPCre Mouse Model for Breast Cancer by Astrid A. Streng, Kirsten C. G. Van Dycke, Conny T. M. van Oostrom, Daniela C. F. Salvatori, Gerben Hulsegge, Inês Chaves, Till Roenneberg, Serge A. L. Zander, Harry van Steeg, Gijsbertus T. J. van der Horst and Linda W. M. van Kerkhof in Journal of Biological Rhythms
Supplemental Material
sj-tif-6-jbr-10.1177_07487304231178340 – Supplemental material for Impact of Simulated Rotating Shift Work on Mammary Tumor Development in the p53R270H©/+WAPCre Mouse Model for Breast Cancer
Supplemental material, sj-tif-6-jbr-10.1177_07487304231178340 for Impact of Simulated Rotating Shift Work on Mammary Tumor Development in the p53R270H©/+WAPCre Mouse Model for Breast Cancer by Astrid A. Streng, Kirsten C. G. Van Dycke, Conny T. M. van Oostrom, Daniela C. F. Salvatori, Gerben Hulsegge, Inês Chaves, Till Roenneberg, Serge A. L. Zander, Harry van Steeg, Gijsbertus T. J. van der Horst and Linda W. M. van Kerkhof in Journal of Biological Rhythms
Supplemental Material
sj-tif-7-jbr-10.1177_07487304231178340 – Supplemental material for Impact of Simulated Rotating Shift Work on Mammary Tumor Development in the p53R270H©/+WAPCre Mouse Model for Breast Cancer
Supplemental material, sj-tif-7-jbr-10.1177_07487304231178340 for Impact of Simulated Rotating Shift Work on Mammary Tumor Development in the p53R270H©/+WAPCre Mouse Model for Breast Cancer by Astrid A. Streng, Kirsten C. G. Van Dycke, Conny T. M. van Oostrom, Daniela C. F. Salvatori, Gerben Hulsegge, Inês Chaves, Till Roenneberg, Serge A. L. Zander, Harry van Steeg, Gijsbertus T. J. van der Horst and Linda W. M. van Kerkhof in Journal of Biological Rhythms
Supplemental Material
sj-xlsx-1-jbr-10.1177_07487304231178340 – Supplemental material for Impact of Simulated Rotating Shift Work on Mammary Tumor Development in the p53R270H©/+WAPCre Mouse Model for Breast Cancer
Supplemental material, sj-xlsx-1-jbr-10.1177_07487304231178340 for Impact of Simulated Rotating Shift Work on Mammary Tumor Development in the p53R270H©/+WAPCre Mouse Model for Breast Cancer by Astrid A. Streng, Kirsten C. G. Van Dycke, Conny T. M. van Oostrom, Daniela C. F. Salvatori, Gerben Hulsegge, Inês Chaves, Till Roenneberg, Serge A. L. Zander, Harry van Steeg, Gijsbertus T. J. van der Horst and Linda W. M. van Kerkhof in Journal of Biological Rhythms
Supplemental Material
sj-xlsx-2-jbr-10.1177_07487304231178340 – Supplemental material for Impact of Simulated Rotating Shift Work on Mammary Tumor Development in the p53R270H©/+WAPCre Mouse Model for Breast Cancer
Supplemental material, sj-xlsx-2-jbr-10.1177_07487304231178340 for Impact of Simulated Rotating Shift Work on Mammary Tumor Development in the p53R270H©/+WAPCre Mouse Model for Breast Cancer by Astrid A. Streng, Kirsten C. G. Van Dycke, Conny T. M. van Oostrom, Daniela C. F. Salvatori, Gerben Hulsegge, Inês Chaves, Till Roenneberg, Serge A. L. Zander, Harry van Steeg, Gijsbertus T. J. van der Horst and Linda W. M. van Kerkhof in Journal of Biological Rhythms
Supplemental Material
sj-xlsx-3-jbr-10.1177_07487304231178340 – Supplemental material for Impact of Simulated Rotating Shift Work on Mammary Tumor Development in the p53R270H©/+WAPCre Mouse Model for Breast Cancer
Supplemental material, sj-xlsx-3-jbr-10.1177_07487304231178340 for Impact of Simulated Rotating Shift Work on Mammary Tumor Development in the p53R270H©/+WAPCre Mouse Model for Breast Cancer by Astrid A. Streng, Kirsten C. G. Van Dycke, Conny T. M. van Oostrom, Daniela C. F. Salvatori, Gerben Hulsegge, Inês Chaves, Till Roenneberg, Serge A. L. Zander, Harry van Steeg, Gijsbertus T. J. van der Horst and Linda W. M. van Kerkhof in Journal of Biological Rhythms
Supplemental Material
sj-xlsx-4-jbr-10.1177_07487304231178340 – Supplemental material for Impact of Simulated Rotating Shift Work on Mammary Tumor Development in the p53R270H©/+WAPCre Mouse Model for Breast Cancer
Supplemental material, sj-xlsx-4-jbr-10.1177_07487304231178340 for Impact of Simulated Rotating Shift Work on Mammary Tumor Development in the p53R270H©/+WAPCre Mouse Model for Breast Cancer by Astrid A. Streng, Kirsten C. G. Van Dycke, Conny T. M. van Oostrom, Daniela C. F. Salvatori, Gerben Hulsegge, Inês Chaves, Till Roenneberg, Serge A. L. Zander, Harry van Steeg, Gijsbertus T. J. van der Horst and Linda W. M. van Kerkhof in Journal of Biological Rhythms
Footnotes
Acknowledgements
We thank Stefanie Vester for assistance with the mouse experiment and processing all the mouse tissues and preparing the slides for histopathological evaluation. We thank Dr. Martijn Dollé for providing valuable feedback on this manuscript. This study was funded by the SPR Program of the Dutch National Institute for Public Health and the Environment (RIVM) (grant S015012), the Dutch Ministry of Social Affairs and Employment (KV11.16), Worldwide Cancer Research (grant 16-1345), and the BioClock Consortium (an NWA-ORC program of the Dutch Research Council; project number 1292.19.077).
Author Contributions
GTJvdH, HvS, TR, LVMvK, IC, and KCGVD came up with the research question and design of the study. KCGVD performed the animal study, with support from CTMvO. The animal material was processed by DCFS. Analyses of the data were done by AAS and KCGVD. GH assisted with data analysis of predicted sleep data. Generation and interpretation of pathology data were done by DCFS and SALZ. AAS wrote the first draft of the article with further contributions from SALZ, GvdH, LVMvK, and IC. All authors interpreted the data, reviewed, edited, and approved the manuscript.
Conflict of Interest Statement
The author(s) have no potential conflicts of interest with respect to the research, authorship, and/or publication of this article.
Notes
References
Supplementary Material
Please find the following supplemental material available below.
For Open Access articles published under a Creative Commons License, all supplemental material carries the same license as the article it is associated with.
For non-Open Access articles published, all supplemental material carries a non-exclusive license, and permission requests for re-use of supplemental material or any part of supplemental material shall be sent directly to the copyright owner as specified in the copyright notice associated with the article.