
Abstract
Organisms track time of day through the function of cell-autonomous molecular clocks. In addition to a central clock located in the brain, molecular clocks are present in most peripheral tissues. Circadian clocks are coordinated within and across tissues, but the manner through which this coordination is achieved is not well understood. We reasoned that the ability to track in vivo molecular clock activity in specific tissues of the fruit fly, Drosophila melanogaster, would facilitate an investigation into the relationship between different clock-containing tissues. Previous efforts to monitor clock gene expression in single flies in vivo have used regulatory elements of several different clock genes to dictate expression of a luciferase reporter enzyme, the activity of which can be monitored using a luminometer. Although these reporter lines have been instrumental in our understanding of the circadian system, they generally lack cell specificity, making it difficult to compare molecular clock oscillations between different tissues. Here, we report the generation of several novel lines of flies that allow for inducible expression of a luciferase reporter construct for clock gene transcriptional activity. We find that these lines faithfully report circadian transcription, as they exhibit rhythmic luciferase activity that is dependent on a functional molecular clock. Furthermore, we take advantage of our reporter lines’ tissue specificity to demonstrate that peripheral molecular clocks are able to retain rhythmicity for multiple days under constant environmental conditions.
The molecular circadian clock is highly conserved across organisms and functions as a transcriptional-translational feedback loop that involves reciprocal interactions between positive and negative elements. In the fruit fly molecular clock, the transcription factors CLOCK (CLK) and CYCLE (CYC) activate transcription of the period (per) and timeless (tim) genes by binding to a 6-base-pair (bp) regulatory sequence, termed the E-box (Darlington et al., 1998; Hardin, 2004). After translation, PER and TIM proteins accumulate in the cytoplasm, eventually translocating to the nucleus and inhibiting CLK and CYC, thereby repressing their own transcription. Subsequent degradation of PER and TIM then allows for another cycle of transcription to begin, with the entire process taking ~24 h to complete. The molecular clock continues to function in the absence of environmental cues, demonstrating its endogenous nature; however, endogenous clocks typically maintain free-running rhythms that deviate slightly from the 24-h cycle produced by the Earth’s daily rotation on its axis. Because of this, circadian clocks must be synchronized to environmental cues via the process of entrainment (Patke et al., 2020).
Molecular clocks are present both in specific populations of neurons in the brain, known as central clock cells, and in most peripheral tissues, and it is thought that the presence of clocks across tissues coordinates tissue-specific processes such that they occur at optimal times of day with respect to one another (Yildirim et al., 2022). This is facilitated by the fact that, in addition to generating rhythmic expression of the core clock genes per and tim, the molecular clock regulates transcription of hundreds of other clock-controlled genes, many of which contain E-boxes for direct CLK/CYC binding (Litovchenko et al., 2021). These genes in turn contribute to tissue-specific functions, thereby imposing circadian regulation on a myriad of important output processes.
An understanding of the mechanisms through which molecular cycling is coordinated across clock cell populations requires the ability to monitor clock function in a tissue-specific manner. Typically, this is achieved through assessment of clock protein or gene expression levels via immunohistochemistry or RNA quantification, respectively; however, these techniques are time-consuming and require lethal tissue extraction, resulting in the inability to record data from the same fly through time. Because of this, it is impossible to distinguish between dampened molecular clock cycling due to diminished clock function within tissues of individual flies or because of a loss of synchronization between flies. This is especially problematic under extended exposure to constant environmental conditions, as the free-running circadian period differs between individual animals.
To circumvent this issue, investigators developed reporter lines in which specific circadian gene regulatory sequences were used to control the expression of firefly luciferase, which catalyzes a reaction with luciferin substrate provided in the food to produce a luminescence signal that can be measured by a luminometer. Existing circadian gene reporter lines accurately report circadian transcriptional activity in single flies, allowing for a longitudinal assessment of molecular clock activity; however, they generally lack spatial resolution, since luciferase is present in all clock cells throughout the body (Brandes et al., 1996; Stanewsky et al., 1997, 2002; Darlington et al., 2000; McDonald et al., 2001). These per- and tim-luciferase reporters can be used to monitor tissue-specific gene activity by dissecting fly body parts and observing bioluminescence in vitro (Emery et al., 1997; Plautz et al., 1997), and with recent technological advances, this method has been used to measure bioluminescence of individual clock neurons (Roberts et al., 2015; Schubert et al., 2020; Versteven et al., 2020). However, despite these advances, an in vivo, tissue-specific approach is needed to allow us to distinguish clock activity in distinct tissues in living flies.
We therefore sought to create a system in which luciferase reporter activity could be induced in a spatially restricted manner, thus conferring cell specificity while maintaining the ability to track molecular clock function in individual flies in vivo. Here, we report the generation and characterization of multiple reporter lines in which flippase (FLP)-inducible luciferase expression is dictated by either a 70-bp (Hao et al., 1997) or 18-bp (Darlington et al., 2000) per regulatory sequence containing the core E-box to which transcription factors CLK and CYC bind. We demonstrate that these lines generate tissue-specific luciferase activity in an FLP-dependent manner. We further show that they faithfully report circadian clock transcriptional activity, as reporter flies exhibit rhythmic bioluminescence signals that depend on a functional molecular clock. Finally, we use our tissue-specific reporters to investigate molecular clock transcriptional activity in the fat body, a peripheral metabolic clock tissue in the fly (Xu et al., 2008; Li et al., 2019). We find sustained bioluminescence rhythms in the fat bodies of individual flies, demonstrating that this peripheral tissue is able to maintain molecular rhythms even under constant environmental conditions. We believe that our newly developed reporter lines will facilitate future investigations into molecular clock mechanisms in different clock-containing tissues.
Materials and Methods
Fly Stocks
iso31 (isogenic w1118) (Ryder et al., 2004), per01 (RRID:BDSC_80928) (Konopka and Benzer, 1971), to-GAL4 (FBti0202314), and tub-GAL4 (RRID:BDSC_5138) were provided by Amita Sehgal. UAS-FLPpest (RRID:BDSC_77141) was provided by Michael Rosbash. otd-nls:FLP (Asahina et al., 2014) was provided by David Anderson. UAS-ClkDN (RRID:BDSC_36319) (Tanoue et al., 2004) and UAS-GFPn (RRID:BDSC_4775) flies were obtained from the Bloomington Drosophila Stock Center.
Generation of FLP-Inducible Circadian Reporter Lines
To monitor Drosophila circadian clock transcriptional activity in vivo, we generated transgenic constructs in which luciferase expression is enabled by FLP-mediated recombination (Tanenhaus et al., 2012) and dictated by either a 70-bp fragment of the per promoter (-563 to -494 bp upstream of the transcriptional start site, containing a consensus E-box sequence), which we call P70E, or 3 concatenated repeats of an 18-bp per E-box element (-538 to -520 bp upstream of the transcriptional start site), which we call P18E. The E-box sequences are followed by a transcription initiation site, an ATG translation initiation codon, a cassette containing flippase recognition target (FRT) sites flanking the mCherry gene with tandem translational stop codons, and finally, the luciferase coding region without its normal ATG start codon (Figure 1a).
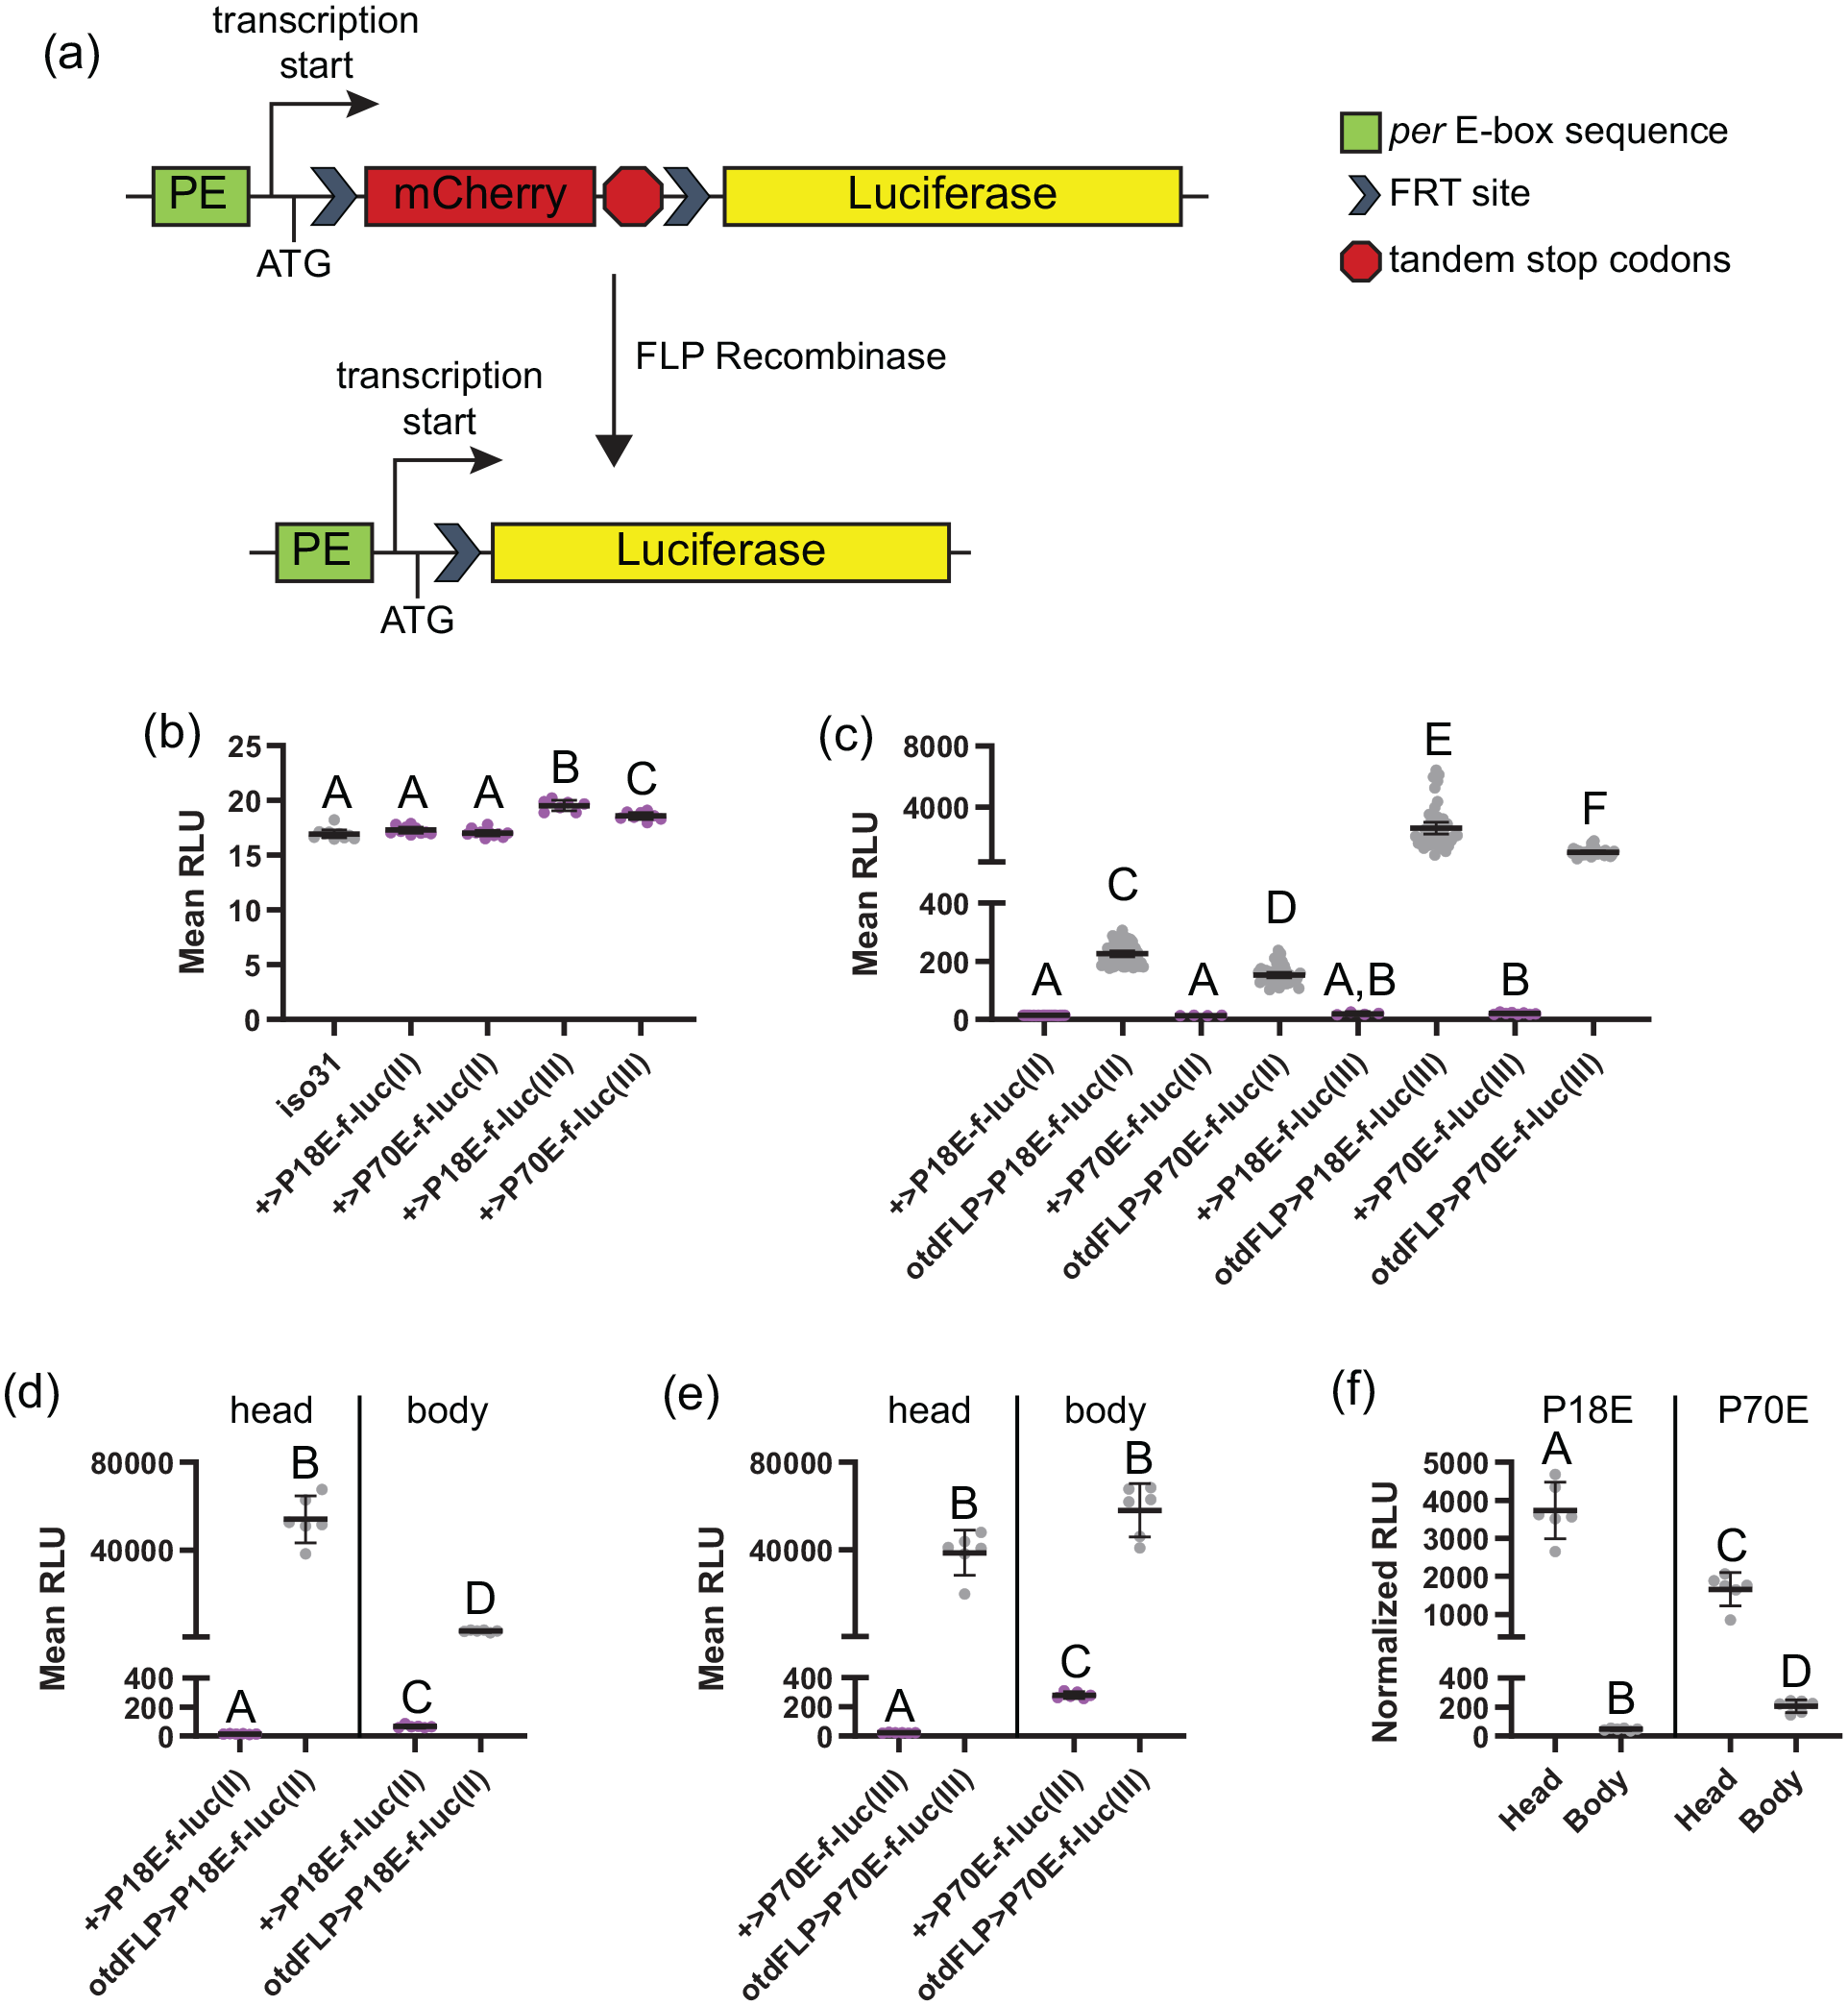
PE-f-luc reporters exhibit inducible, tissue-specific luciferase activity. (a) Cartoon of the reporter system. The per regulatory sequence (green) is placed upstream of the transcription (arrow) and translation (labeled ATG) initiation sites, an FRT-flanked open reading frame (ORF) for mCherry including 2 tandem stop codons (red), and the luciferase ORF (yellow). FLP recombinase, which can be expressed in a tissue-specific manner, catalyzes site-specific recombination at the FRT sites, activating the reporter. (b and c) Average bioluminescence intensity, reported as mean RLU, calculated over 6 days in DD for various genotypes. (b) Mean RLU of iso31 control flies (gray) is similar to flies carrying each PE-f-luc line (magenta). (c) Mean RLU of all 4 PE-f-luc lines is substantially increased in the presence of otdFLP. (d-f) Results of in vitro luciferase assays demonstrating enrichment of luciferase signal in expected tissues. (d-e) Mean RLU of P18E-f-luc(II) (d) and P70E-f-luc(III) (e) is substantially greater in both the head and body in the presence of otdFLP. (f) RLU for otdFLP>P18E-f-luc(II) and otdFLP>P70E-f-luc(III), normalized to tissue size, shows enrichment in head compared with body, consistent with the otdFLP expression pattern. For all graphs, dots represent individual flies/samples and lines are means ± 95% confidence intervals. Color is available in the on-line version. Different letters indicate a significant difference with p < 0.05, Dunnett’s T3 multiple comparisons test following Browne-Forsythe and Welch ANOVA. Abbreviations: FRT = flippase recognition target; FLP = flippase; RLU = relative light units; DD = constant darkness; ANOVA = analysis of variance.
We constructed reporter constructs from an existing plasmid (cre-f-luc) generously provided by the Yin Lab. We synthesized 70 bp and 3x18 bp oligonucleotides with NotI and BamHI compatible ends (Integrated DNA Technologies) and ligated these into BamHI- and NotI-digested cre-f-luc plasmids, thereby replacing the CREB binding site of the original reporter with per regulatory sequences. Oligonucleotide sequences were as follows, with per regulatory sequences in bold:
NotI-Per70-BamHI sense: 5′-GGCCGCATCT
NotI-Per70-BamHI antisense: 5′-GATCCAAAT
NotI-3xPer18-BamHI sense: 5′-GGCCGCATCT
NotI-3xPer18-BamHI antisense: 5′-GATCCAAAT
Prior to injection into embryos, we cloned the PE-mCherry-stop-luciferase fragments into the pattB cloning vector (DGRC Stock 1420; https://dgrc.bio.indiana.edu//stock/1420; RRID:DGRC_1420). We digested and ligated P70E-mCherry-stop-luciferase into the XhoI site and P18E-mCherry-stop-luciferase between the NotI and XhoI sites in the multiple cloning region of pattB. The resulting targeting plasmids were confirmed by Sanger sequencing. After sequencing, the plasmids were sent to BestGene Inc. for phiC31-mediated integration into attP sites located on the second (y[1] w[*]; P{y[+t7.7]=CaryIP}su (Hw)attP5) and third chromosome (y1 w1118; PBac{y+-attP-9A}VK00005). This created a total of 4 reporter lines, which we call P18E-f-luc(II), P70E-f-luc(II), P18E-f-luc(III), and P70E-f-luc(III).
Immunohistochemistry
We raised male flies on standard cornmeal-molasses food and entrained them to 12:12 light-dark (LD) conditions at 25 °C for ≥5 days prior to brain and abdomen dissections, which were conducted at zeitgeber time (ZT) 0-2 (where ZT0 corresponds to lights-on time). Flies were first anesthetized with CO2, then submerged for ~1 min in ethanol, and rinsed briefly in phosphate-buffered saline with 0.1% Triton-X (PBST) prior to dissections in PBST. To isolate fat bodies and oenocytes, we tore a small opening at the caudal end of the abdomen, which we used as an access point to remove reproductive and digestive tracts. We then dissected off the abdomen caudal to the halters and removed the posterior-most abdominal segment and ventral cuticle. To isolate brains, we removed them from the head cuticle and freed them of air sacs and trachea. We processed the resulting abdominal filets and brains as free-floating whole mounts.
Following dissection, we fixed abdomens and brains in 4% formaldehyde for 20 to 40 min followed by 3 × 15 min washes in PBST. We blocked tissues for 1 h in 5% normal donkey serum in PBST (NDST) and incubated them for 24 h in primary antibodies diluted in 5% NDST. We then washed tissues 3 × 15 min in PBST and incubated them ~24 h in secondary antibodies diluted in 5% NDST. Finally, we mounted specimens in Vectashield (Vector Laboratories) after 3 × 15 min washes in PBST. Prior to mounting, brains (but not abdomens) were cleared for 5 min in 50% glycerol in PBST. Primary antibodies were as follows: rabbit Living Colors DsRed Polyclonal Antibody 1:2000 (Takara 632496) and mouse anti-luciferase, Clone: Luci17 1:500 (Invitrogen MA112556). Secondary antibodies were as follows: Cy3 donkey anti-rabbit 1:1000 (Jackson 711-165-152) and FITC donkey anti-mouse 1:1000 (Jackson 715-095-150). Immunostained brains and abdomens were visualized with an Olympus Fluoview FV1000 confocal microscope.
In Vivo Luciferase Assays
We raised flies on standard cornmeal-molasses food and entrained them to 12:12 LD conditions at 25 °C for ≥3 days before loading 5- to 10-day old male or female flies into a white 96-well microplate (Berthold 23300) containing 5% sucrose, 2% agar, and 10 mM XenoLight D-Luciferin K+ salt (Perkin-Elmer 122799). To minimize crosstalk, we omitted flies from every other well of the plate. Bioluminescence in relative light units (RLU) was measured with a Berthold Centro-SX-3 luminometer at 25 °C for 7 days starting at the beginning of the dark period and continuing in constant darkness (DD) or 12:12 LD. We measured luminescence with a 10-sec dwell time per well every 30 min. For LD experiments, the microtiter plate was retracted into the luminometer only during measurements, and the first and last wells were left empty to calculate background luminescence levels associated with light absorption by the plate.
Ex Vivo Luciferase Assays
We performed ex vivo luciferase assays using the Steady-Glo Luciferase Assay System (Promega E2510) according to the manufacturer’s instructions. We entrained flies to 12:12 LD conditions before flash-freezing 6- to 8-day-old male flies at ZT0. We then vortexed the frozen flies for ~1 min to separate heads and bodies, and pooled 3 heads or bodies for each sample (for a total of 6 samples per genotype and tissue). We obtained RLU measurements on sample lysates with a Berthold Centro-SX-3 luminometer using a 10-sec dwell time per well. To determine FLP-mediated luciferase induction, we compared raw RLU of samples taken from PE-f-luc reporter lines in the presence or absence of FLP. We also calculated normalized RLU by dividing the RLU of a given experimental sample by the mean RLU of control samples taken from flies lacking FLP. We reasoned that this would account for differences in tissue size between heads and bodies, as the strength of background luciferase signal in control tissues should roughly scale with overall tissue size.
Data Analysis
For in vivo luciferase monitoring, we omitted the first 12 h of recording from analysis to allow flies time to acclimate to the monitoring conditions and consume sufficient luciferin. During LD experiments, the lighting conditions imposed an artificial rhythm due to the plate absorbing light that is detectable by the luminometer. To account for this, we averaged bioluminescence traces of wells without flies to create a baseline and then subtracted this baseline from experimental data. Flies that died during the course of luciferase monitoring were identified via visual inspection of luminometer plates and removed from analysis. For most in vivo luciferase experiments, we ran 2 to 3 independent runs and combined data from all runs. Mean RLU was determined for each individual fly across 6 consecutive days of data (excluding the first 12 h). To normalize and detrend in vivo bioluminescence data for circadian analysis, all data were passed through a 72-h low-pass Butterworth filter (MATLAB), and then each point was divided by the resulting trend line (Levine et al., 2002). Chi-square periodogram analysis was performed on detrended data with ClockLab software (Actimetrics) to determine rhythm strength (power) and period of bioluminescence readings. Rhythm power was calculated as the amplitude of the periodogram line at the dominant period minus the chi-square significance line (at significance of p < 0.01). A fly was considered rhythmic if analysis returned a period estimate between 16 and 32 h and a rhythm power>10. Welch’s t test (for groups of 2) and Browne-Forsythe and Welch analysis of variance (ANOVA) with Dunnett’s T3 multiple comparisons test (for groups of 3 or more) were used to compare mean signal strength and rhythm power between genotypes and lighting conditions. Fisher’s exact test was used to compare percent rhythmicity. Because period length does not follow a normal distribution, we compared period between lighting conditions with a nonparametric Mann-Whitney test (for groups of 2) or Kruskal-Wallis followed by Dunn’s multiple comparisons test (for groups of 3 or more). Only data from flies deemed rhythmic by periodogram analysis were included in mean period and power calculations.
Results
PE-f-luc Circadian Transcriptional Reporter Lines Are Inducible With Minimal Leakiness
We have created 4 circadian transcriptional reporter lines in which FLP-mediated excision of an mCherry-stop cassette (Tanenhaus et al., 2012) should enable CLK/CYC-regulated luciferase expression (Figure 1a). In contrast, an absence of FLP should lead to translation termination at the tandem stop codons upstream of the luciferase open reading frame, thereby preventing luciferase expression. To determine whether our reporter lines exhibit any leaky luciferase expression, we compared bioluminescence signals of wild-type iso31 flies, which lack the luciferase gene, with flies containing reporter constructs alone (in the absence of FLP). Importantly, there was no significant difference in mean bioluminescence signal over 6 days of recording in either second chromosome reporter line compared with wild-type flies (Figure 1b). Although both third chromosome lines exhibited bioluminescence slightly above that observed in wild-type flies (Figure 1b), the difference, which was only a few RLU, was negligible compared with the induced signal in the presence of FLP (see below). The basal luciferase signal present in PE-f-luc flies in the absence of FLP expression did not show any sign of circadian oscillation across multiple days of recording (Suppl. Fig. S1). These results confirm that there is minimal leakiness associated with the PE-f-luc reporter lines.
To test whether FLP can effectively induce luciferase expression, we compared bioluminescence levels of flies carrying PE-f-luc constructs alone with those that also contain a transgene consisting of FLP directly activated by a neuronal promoter (otdFLP) (Asahina et al., 2014). We observed robust FLP-mediated induction of luciferase expression in all 4 PE-f-luc reporters (Figure 1c). We noted that the bioluminescence signals varied depending on which chromosome held the PE-f-luc transgene, with flies carrying PE-f-luc on the third chromosome reporting higher RLU than flies carrying PE-f-luc on the second chromosome (Figure 1c). In addition, P18E-f-luc lines had marginally higher bioluminescence signals compared with P70E-f-luc reporters on the same chromosome (Figure 1c). In preliminary experiments, we found that reporters on the same chromosome performed comparably, regardless of specific per regulatory sequence. We therefore report data from one second chromosome (P18E-f-luc(II)) and one third chromosome reporter (P70E-f-luc(III)) in all subsequent experiments.
To assess the cell specificity of our approach, we used ex vivo luciferase assays in dissected tissues from reporter lines crossed to otdFLP flies to compare bioluminescent signals emanating from the head and body. Due to the restricted expression of otdFLP in photoreceptors and central brain neurons, we expected to find luciferase signals enriched in the head compared with the body. Indeed, this was the case for both P18E-f-luc(II) and P70E-f-luc(III) (Figure 1d-1f), but to varying extents. For P18E-f-luc(II), mean raw signal strength per head was ~17× higher than mean raw signal strength per body (Figure 1d). When normalized for overall tissue size, this equated to a ~80-fold enrichment in the head (Figure 1f). For P70E-f-luc(III), we actually observed substantial signal emanating from the body, such that the mean raw signal strength per body was slightly higher than for the head (Figure 1e). Nevertheless, this still represented a 7-fold relative enrichment for head samples once normalized to overall tissue size (Figure 1f). We conclude that our reporter lines confer FLP-mediated, tissue-specific expression, but perhaps with greater specificity offered by the P18E-f-luc(II) line.
The results from these ex vivo luminescence assays were further confirmed through immunohistochemical analysis of tissues taken from flies expressing PE-f-luc constructs in the presence of tissue-specific FLP expression. For these experiments, we crossed P18E-f-luc(II) and P70E-f-luc(III) reporters with 3 different FLP-expressing lines. In addition to otdFLP, described above, we used to-GAL4, which is expressed in fat body cells, and tub-GAL4, which is ubiquitously expressed, to drive a UAS-FLPpest construct (we denote these flies as toFLP and tubFLP, respectively). These assays demonstrated selective and spatially restricted induction of luciferase as expected based on FLP expression. Thus, otdFLP induced luciferase in clock cells of the brain, consistent with its expression in neurons, but failed to induce expression in peripheral clock tissues such as fat body and oenocyte cells (Figure 2a-2c and 2j-2k). Notably, we did not detect luciferase expression in abdominal tissues of otdFLP>P70E-f-luc(III) flies (to simplify nomenclature, otdFLP>P70E-f-luc(III) refers to flies in which the P70E-f-luc(III) reporter has been induced by otdFLP) (Figure 2j and 2k), indicating that the body-derived signal we observed in bioluminescence assays of these flies (Figure 1e and 1f) must either emanate from cells not present in our abdominal filets or result from luciferase expression that is below the detection threshold of our luciferase antibody. In contrast to otdFLP flies, which showed neuron-specific luciferase induction, toFLP flies exhibited selective luciferase expression in fat body cells (Figure 2d-2f and 2m-2o). Finally, tubFLP flies showed luciferase expression in multiple clock-containing tissues including the brain, fat body, and oenocytes (Figure 2g-2i and 2p-2r).
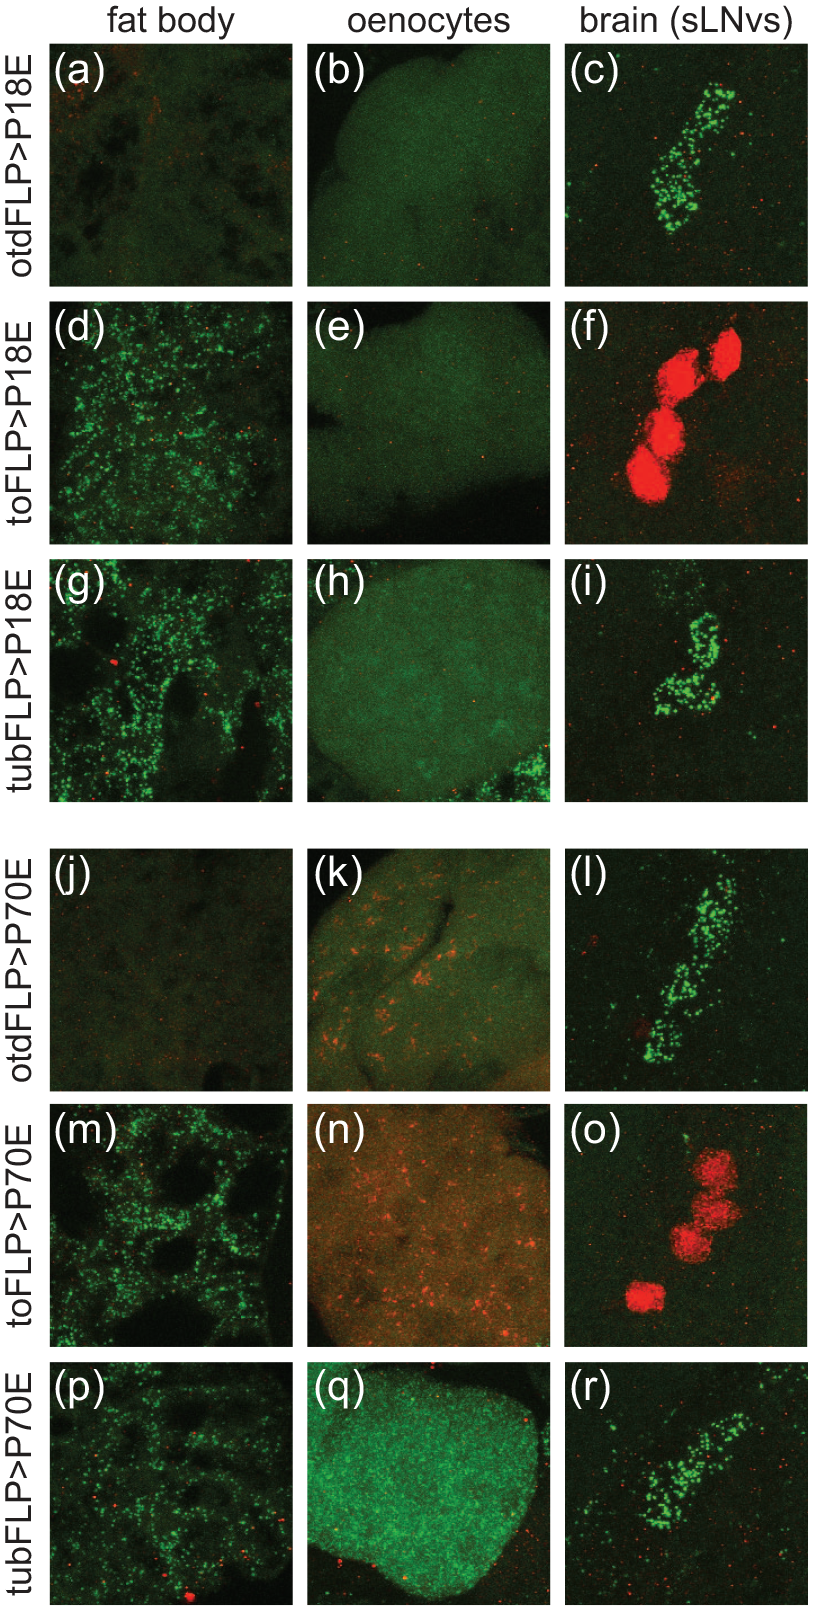
Immunohistochemical confirmation that PE-f-luc reporters exhibit specific, FLP-inducible luciferase expression. Panels show representative confocal images of tissues from P18E-f-luc(II) (a-i) and P70E-f-luc(III) (j-r) reporter lines stained with antibodies for mCherry (red) and luciferase (green). (a-c) otdFLP>P18E-f-luc(II) flies exhibit selective luciferase expression in neurons. (a) and (b) demonstrate a lack of luciferase expression in peripheral fat body or oenocyte cells. (c) shows robust luciferase expression in sLNv clock cells in the brain. Note that mCherry expression in (a) is quite faint, possibly due to diffuse expression in fat body cells. (d-f) toFLP>P18E-f-luc(II) flies exhibit selective expression of luciferase in fat body cells. In (d), we see punctate luciferase staining in the fat body. (e) shows a lack of both mCherry and luciferase expression in oenocytes, suggesting the P18E-f-luc(II) line is not expressed in these peripheral clock cells. (f) demonstrates mCherry expression in sLNv clock cells, consistent with a lack of FLP-mediated recombination. (g-i) tubFLP>P18E-f-luc(II) flies show a complete absence of mCherry and instead express luciferase both in fat body cells (g) and sLNv clock neurons (i). (j-l) otdFLP>P70E-f-luc(III) flies show selective luciferase expression in neurons, including sLNv clock cells in the brain (l). Fat body (j) and oenocytes (k) express mCherry (though this is quite faint in fat body cells). (m-o) toFLP>P70E-f-luc(III) flies exclusively express luciferase in fat body cells (m), and mCherry in oenoctyes (n) and sLNv (o) clock neurons. (p-r) tubFLP>P70E-f-luc(III) flies lack mCherry expression and show luciferase signal in all clock tissues monitored, including fat body (p), oenoctyes (q), and brain clock neurons (r). Abbreviations: FLP = flippase; sLNv = small ventrolateral.
In the absence of FLP, we observed mCherry expression that was largely restricted to clock-containing cells. For example, toFLP>PE-f-luc flies exhibited robust mCherry immunofluorescence in small ventrolateral (sLNv) clock cells (Figure 2f and 2o), but did not exhibit substantial reporter expression in non-clock neurons (data not shown). Interestingly, the different reporter lines showed slightly different expression patterns in the brain. For both lines tested, we noted especially strong signals in LNv cells compared with other clock cells (data not shown), suggesting that reporter expression is particularly robust in these cells. We did not observe appreciable reporter signal in other central brain clock cells in P18E-f-luc(II) flies. In contrast, P70E-f-luc(III) flies had reporter signal in all major clock cell populations, although the expression in non-LNv clock cells was relatively faint (data not shown). We also noticed a lack of P18E-f-luc(II) signal in peripheral oenocytes (Figure 2b, 2e, and 2h). It is possible that positional effects of the second chromosome insertion site repressed reporter expression in a cell-specific manner, which could contribute to the overall lower bioluminescence signals present in second chromosome lines.
Importantly, we found that FLP-induced recombination was efficient in both reporter lines. Thus, we did not observe appreciable mCherry signal in FLP-expressing tissues. For example, mCherry was completely absent in tubFLP flies, in which FLP is ubiquitously expressed (Figure 2g-2i and 2p-2r). Furthermore, in agreement with our luminescence experiments that demonstrated a lack of luciferase leakiness, we never observed both mCherry and luciferase immunofluorescence in a single cell. Together, these immunohistochemical assays affirm the effectiveness of our strategy for tissue-specific luciferase induction.
PE-f-luc Circadian Transcriptional Reporter Lines Exhibit Rhythmic Luciferase Activity That Depends on a Functional Molecular Clock
The 18-bp and 70-bp per regulatory elements used in our PE-f-luc reporters have previously been demonstrated to confer rhythmic transcriptional activity when used to drive ubiquitously expressed reporter constructs (Hao et al., 1997, 1999; Darlington et al., 2000). To test whether this rhythmicity is retained in our FLP-inducible system, we conducted bioluminescence monitoring over extended time periods in flies in which our PE-f-luc reporter lines were crossed to otdFLP flies. We conducted these analyses under both DD and LD conditions to assess free-running and light-entrained cycling. On a group mean level, we found that otdFLP>P18E-f-luc(II) flies exhibited weak bioluminescence rhythms under DD conditions, with little evidence of rhythmic oscillations after the first day (Figure 3a and 3b). However, we did note significant rhythmicity in a substantial number of individual flies, some of which retained robust cycling throughout the entire recording period (Figure 3c, 3j, and 3k; Table 1). In contrast, we observed strong group mean luciferase cycling under LD conditions (Figure 3e and 3f), with 2 daily peaks of luciferase activity, as has been noted previously (Brandes et al., 1996; Darlington et al., 2000). The enhanced group mean rhythmicity in LD was associated with an increased percentage of rhythmic flies as well as an increase in mean rhythm power compared with DD conditions (Figure 3j-3k; Table 1). These results suggest that the presence of entraining light cycles both increases the strength of molecular rhythms of individual flies and synchronizes oscillations between flies. Results from P70E-f-luc(III) flies largely recapitulated those observed with P18E-f-luc(II). Thus, these flies exhibited weak bioluminescence rhythms under DD conditions that were strengthened and synchronized via the presence of light-dark cues (Suppl. Fig. S2A-S2G, S2J, and S2K). However, we note that only ~35% of otdFLP>P70E-f-luc(III) exhibited DD bioluminescence rhythms compared with ~60% of otdFLP>P18E-f-luc(II) flies. It is unclear what accounts for the relatively weak rhythms of the P70E-f-luc(III) lines in these conditions.
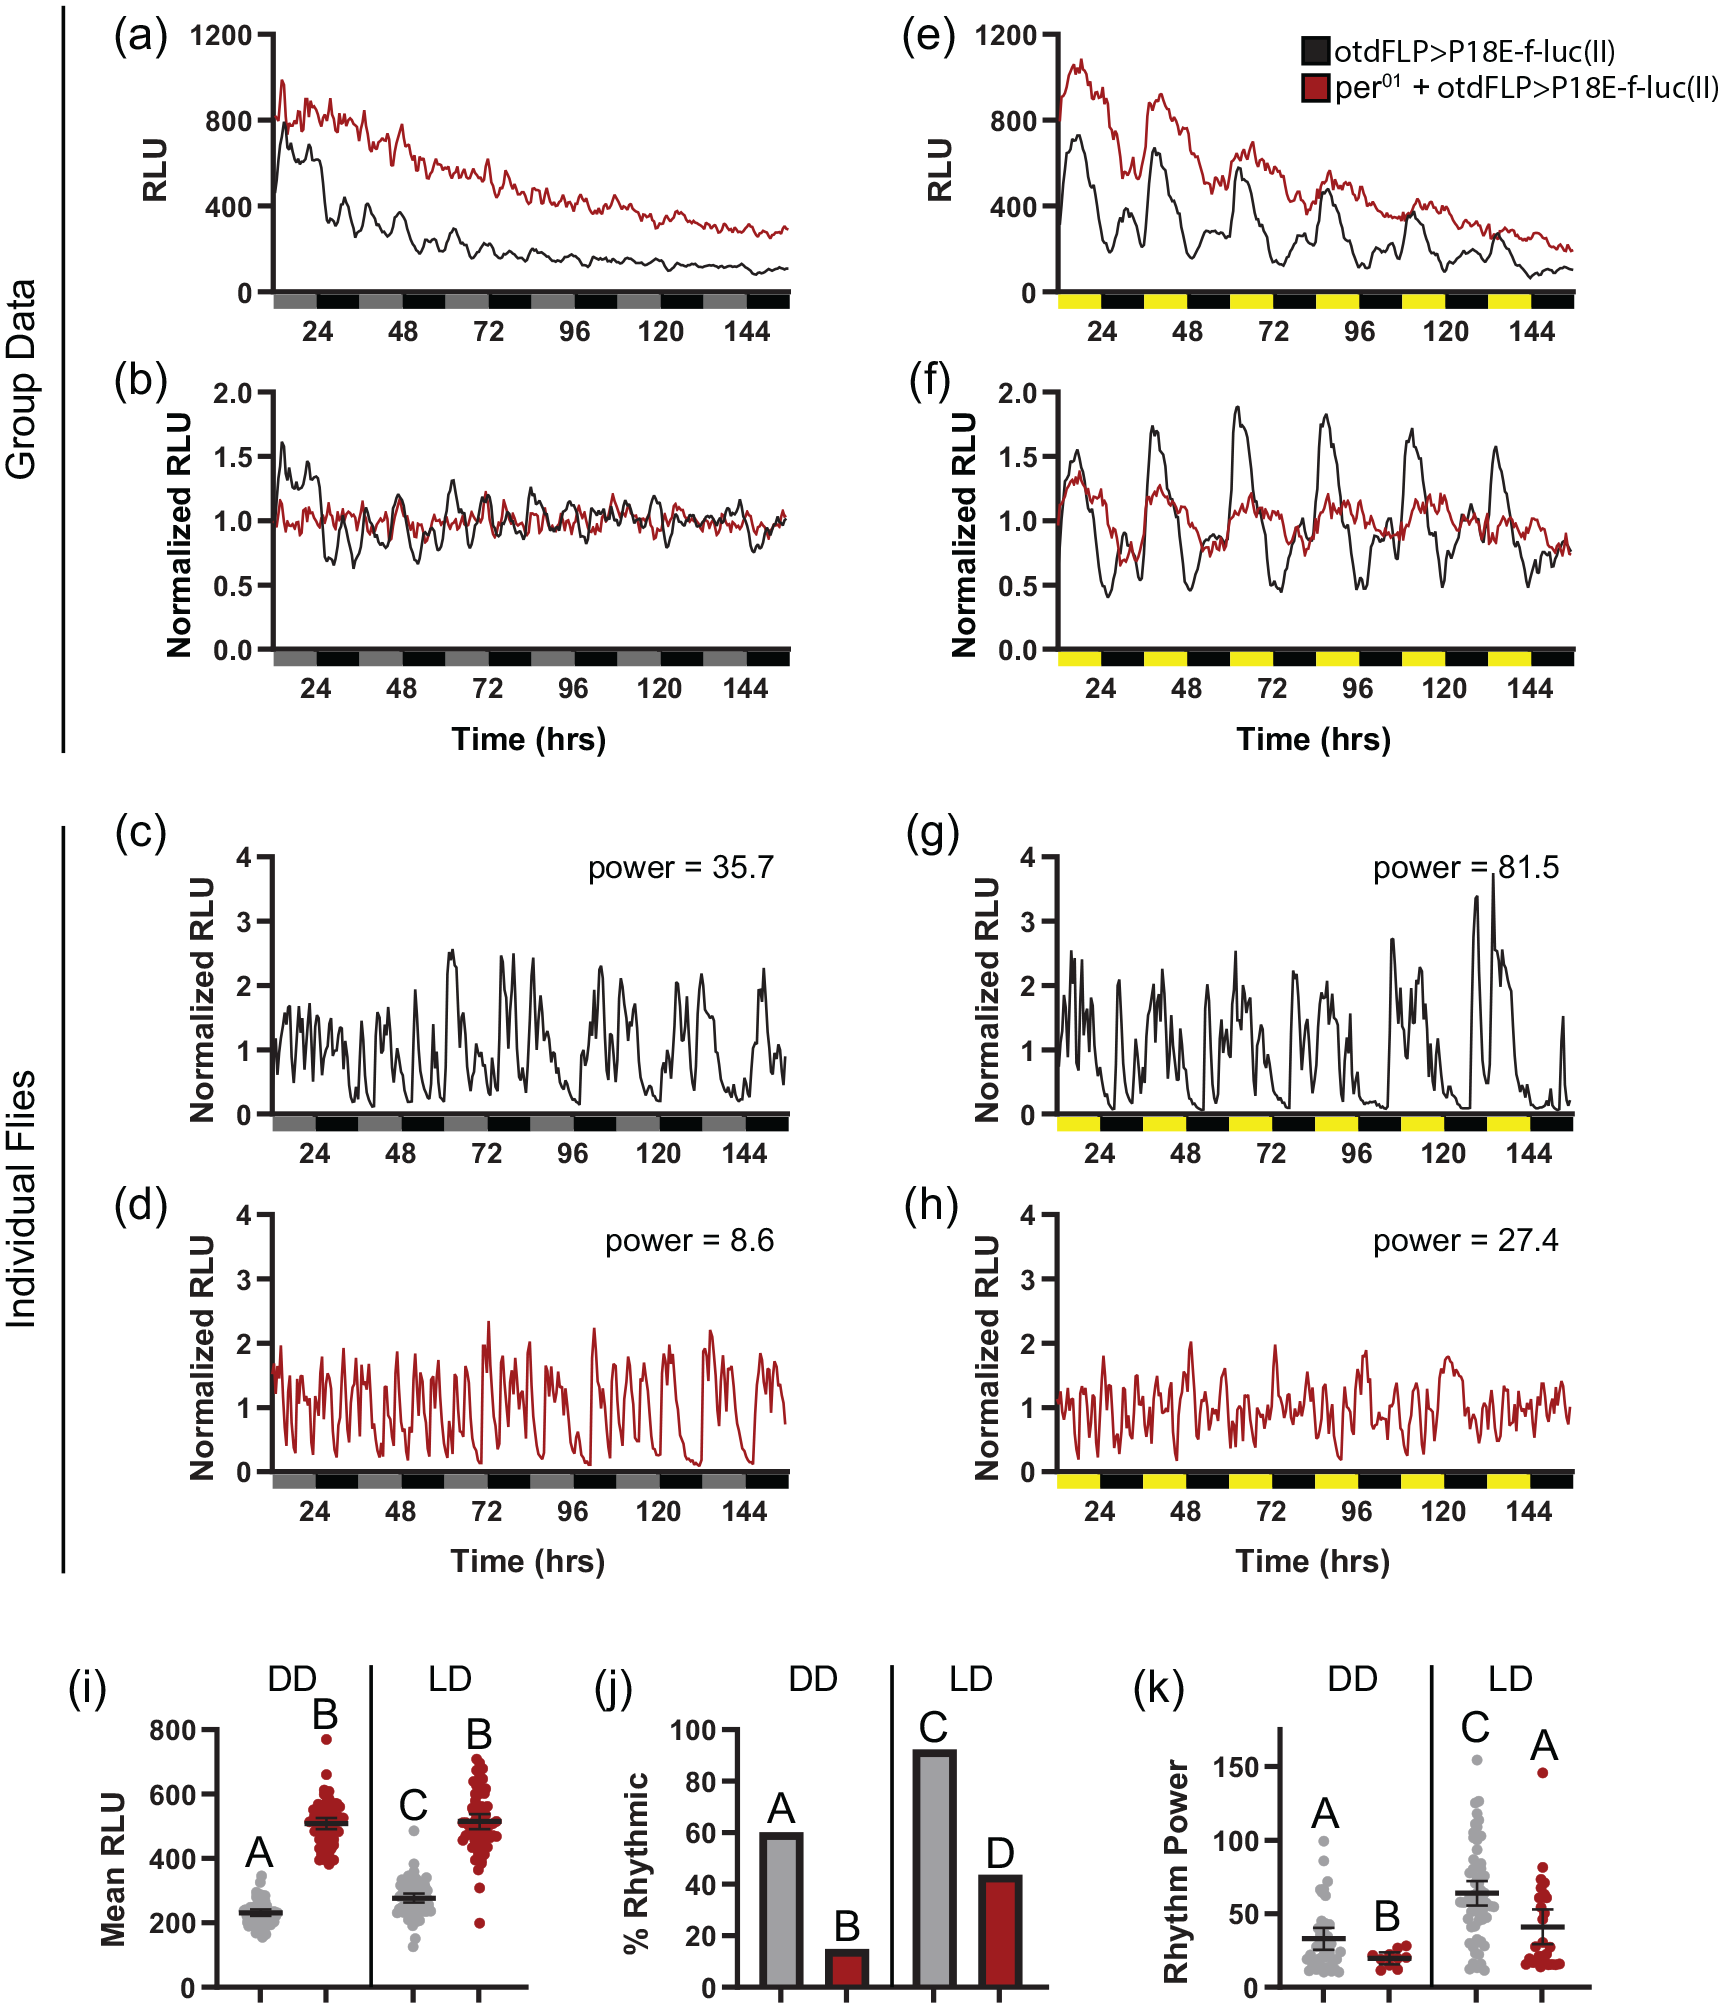
P18E-f-luc(II) luciferase activity depends on a functional molecular clock. (a and b) Raw and normalized group mean bioluminescence readings comparing per01 mutant (red) and non-mutant (black) otdFLP>P18E-f-luc(II) flies over 6 days in DD. (c and d) Representative examples of normalized DD luciferase signals from individual otdFLP>P18E-f-luc(II) flies in a wild-type (c) and per01 mutant (d) background. Gray and black bars underneath graphs in (a-d) represent subjective day and night, respectively. (e and f) Raw and normalized group mean bioluminescence readings comparing per01 mutant (red) and non-mutant (black) otdFLP>P18E-f-luc(II) flies over 6 days in LD. Note the blunted rhythmicity present in per01 mutants. (g and h) Representative examples of normalized LD luciferase signals from individual otdFLP>P18E-f-luc(II) flies in a wild-type (g) and per01 mutant (h) background. Yellow and black bars underneath graphs in (e-h) represent lights-on and lights-off, respectively. (i) Quantification of mean RLU over 6 days in DD or LD for wild-type (gray) and per01 mutant (red) flies. per01 mutants had significantly elevated luciferase signals, as expected based on the lack of PER-mediated repression. (j) Percentage of wild-type (gray) and per01 mutant (red) flies that exhibited rhythmic luciferase activity, as determined by chi-square periodogram analysis, under DD and LD conditions, demonstrating reduced rhythmicity in per01 flies. (k) Quantification of mean chi-square rhythm power of rhythmic flies over 6 days in DD or LD for wild-type (gray) and per01 mutant (red) flies shows a reduction in rhythm strength in per01 mutants. For all graphs, dots represent individual flies and lines are means ± 95% confidence intervals. Different letters indicate a significant difference with p < 0.05, Dunnett’s T3 multiple comparisons test following Browne-Forsythe and Welch ANOVA (for i and k), and Fisher’s exact test (for j). Individual graphs in (c), (d), (g), and (h) show bioluminescence records of flies around the 80th percentile of rhythm strength. Abbreviations: FLP = flippase; DD = constant darkness; LD = light-dark; RLU = relative light units.
Analysis of PE-f-luc reporter in vivo biolumenescence assays
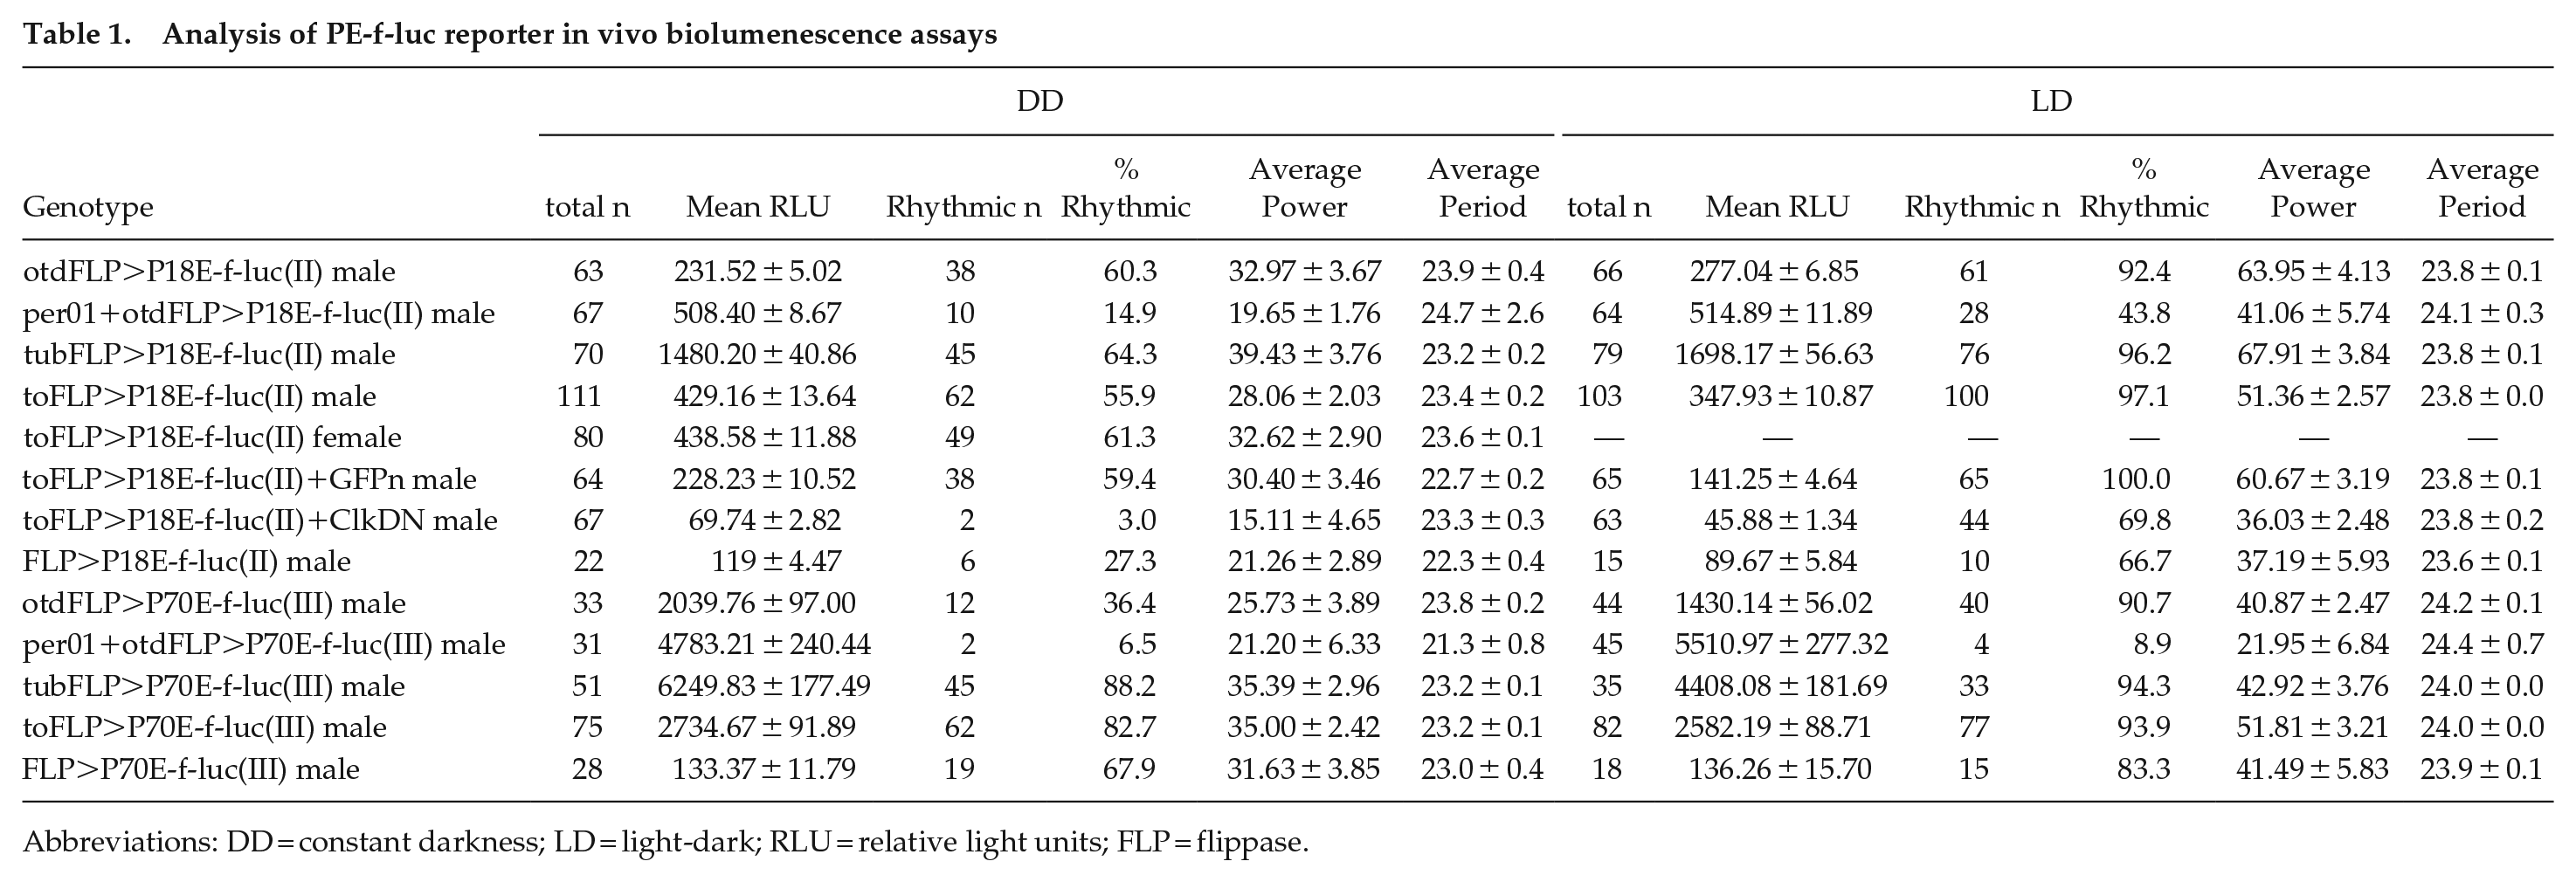
Abbreviations: DD = constant darkness; LD = light-dark; RLU = relative light units; FLP = flippase.
If the PE-f-luc lines faithfully report endogenous clock gene transcriptional activity, then bioluminescence rhythms should depend on a functional circadian clock. We therefore compared luciferase signals in otdFLP>P18E-f-luc(II) and otdFLP>P70E-f-luc(III) flies in the presence and absence of the per01 mutation, which eliminates molecular clock function (Konopka and Benzer, 1971). For P18E-f-luc(II) flies, we found that the percentage of rhythmic flies as well as the strength of rhythmic bioluminescence activity was significantly lower in per01 flies compared with non-mutant flies, both in DD and in LD (Figure 3j and 3k). Importantly, the majority of individual per01 flies exhibited arrhythmic bioluminescence signals, while most non-mutant flies showed significant rhythmicity (Figure 3c-3h and 3j). We did observe that a minority of otdFLP>P18E-f-luc(II) flies that contained the per01 mutation exhibited rhythmic luciferase oscillations under LD conditions (Figure 3j and 3k), which contributed to moderate initial cycling at the group mean level (Figure 3e and 3f); however, overall rhythmicity of these flies was clearly reduced compared with flies with an intact molecular clock (Figure 3j and 3k). In addition, mean bioluminescence levels of per01 flies were uniformly increased compared with flies without per01 (Figure 3i). This is expected, as flies without PER are unable to repress CLK/CYC-mediated transcription such that CLK/CYC activity should be constitutively high. This constitutively high luciferase signal is consistent with results obtained with non-inducible reporter lines using the same per regulatory sequence (Darlington et al., 2000).
We observed similar results with the P70E-f-luc(III) line. In this case, luciferase activity of per01 flies was predominantly arrhythmic under both DD and LD conditions (Suppl. Fig. S2A-S2F and S2J-S2K), which represented a significant decrease in the percentage of individual flies exhibiting rhythmic bioluminescence (Suppl. Fig. S2J-S2K; Table 1). In addition, as was the case for the P18E-f-luc(II) line, mean bioluminescence signal was significantly higher in per01 mutants (Suppl. Fig. S2I). The lack of rhythmicity and increased signal intensity in per01 mutants indicate that bioluminescence activity of the reporters is dictated by the molecular clock and effectively reports circadian transcriptional activity.
PE-f-luc Circadian Transcriptional Reporter Lines Perform Similarly to Existing Ubiquitously Expressed Reporters
To compare the performance of our reporter lines more directly with existing ubiquitously expressed per-luciferase reporters, we conducted additional experiments in which we monitored luciferase levels following simultaneous reporter induction in all cells of the fly using tubFLP. Consistent with its expanded expression throughout the body, bioluminescence was 3 to 7 times greater when our reporter lines were crossed to tubFLP compared with otdFLP (Table 1). As was the case for otdFLP, we also observed significantly greater mean luciferase signal when tubFLP was combined with the third chromosome P70E-f-luc(III) reporter compared with the second chromosome P18E-f-luc(II) line. Unexpectedly, we found that control flies lacking the GAL4 driver but containing UAS-FLPpest (denoted FLP>PE-f-luc) displayed luminescence signals that were significantly greater than reporter lines lacking FLP altogether, which indicates that the UAS-FLPpest construct we used exhibits some leaky expression (Table 1). These background signals were easily distinguished from the robust luciferase levels observed in experimental tubFLP>PE-f-luc flies (Table 1); however, they do set a sensitivity limit on our assay, especially in cases when luciferase expression is induced in a small number of cells. Because of this, we always included control flies in luciferase experiments that contained the PE-f-luc reporter and UAS-FLPpest in the absence of a GAL4 driver, to ensure that any recorded luciferase signal in experimental flies could be differentiated from background bioluminescence.
Importantly, tubFLP>PE-f-luc flies exhibited bioluminescence rhythms that were qualitatively similar to those observed with previously generated lines (Darlington et al., 2000). Thus, we found that ~65% of tubFLP>P18E-f-luc(II) flies had rhythmic bioluminescence under DD conditions (Figure 4j; Table 1). Although this was roughly comparable to the ~60% of otdFLP>P18E-f-luc(II) flies that had rhythmic DD luciferase activity, in the case of tubFLP, this resulted in appreciable group mean rhythms that persisted throughout the monitoring period, with a slight dampening toward the end of the 6 days of recording (Figure 4a and 4b). We also observed individual flies that maintained strong, non-dampening bioluminescence rhythms throughout all days of monitoring (Figure 4c and 4d), which suggests that the dampening of group mean oscillations could result, at least in part, from a progressive loss of synchrony between flies.
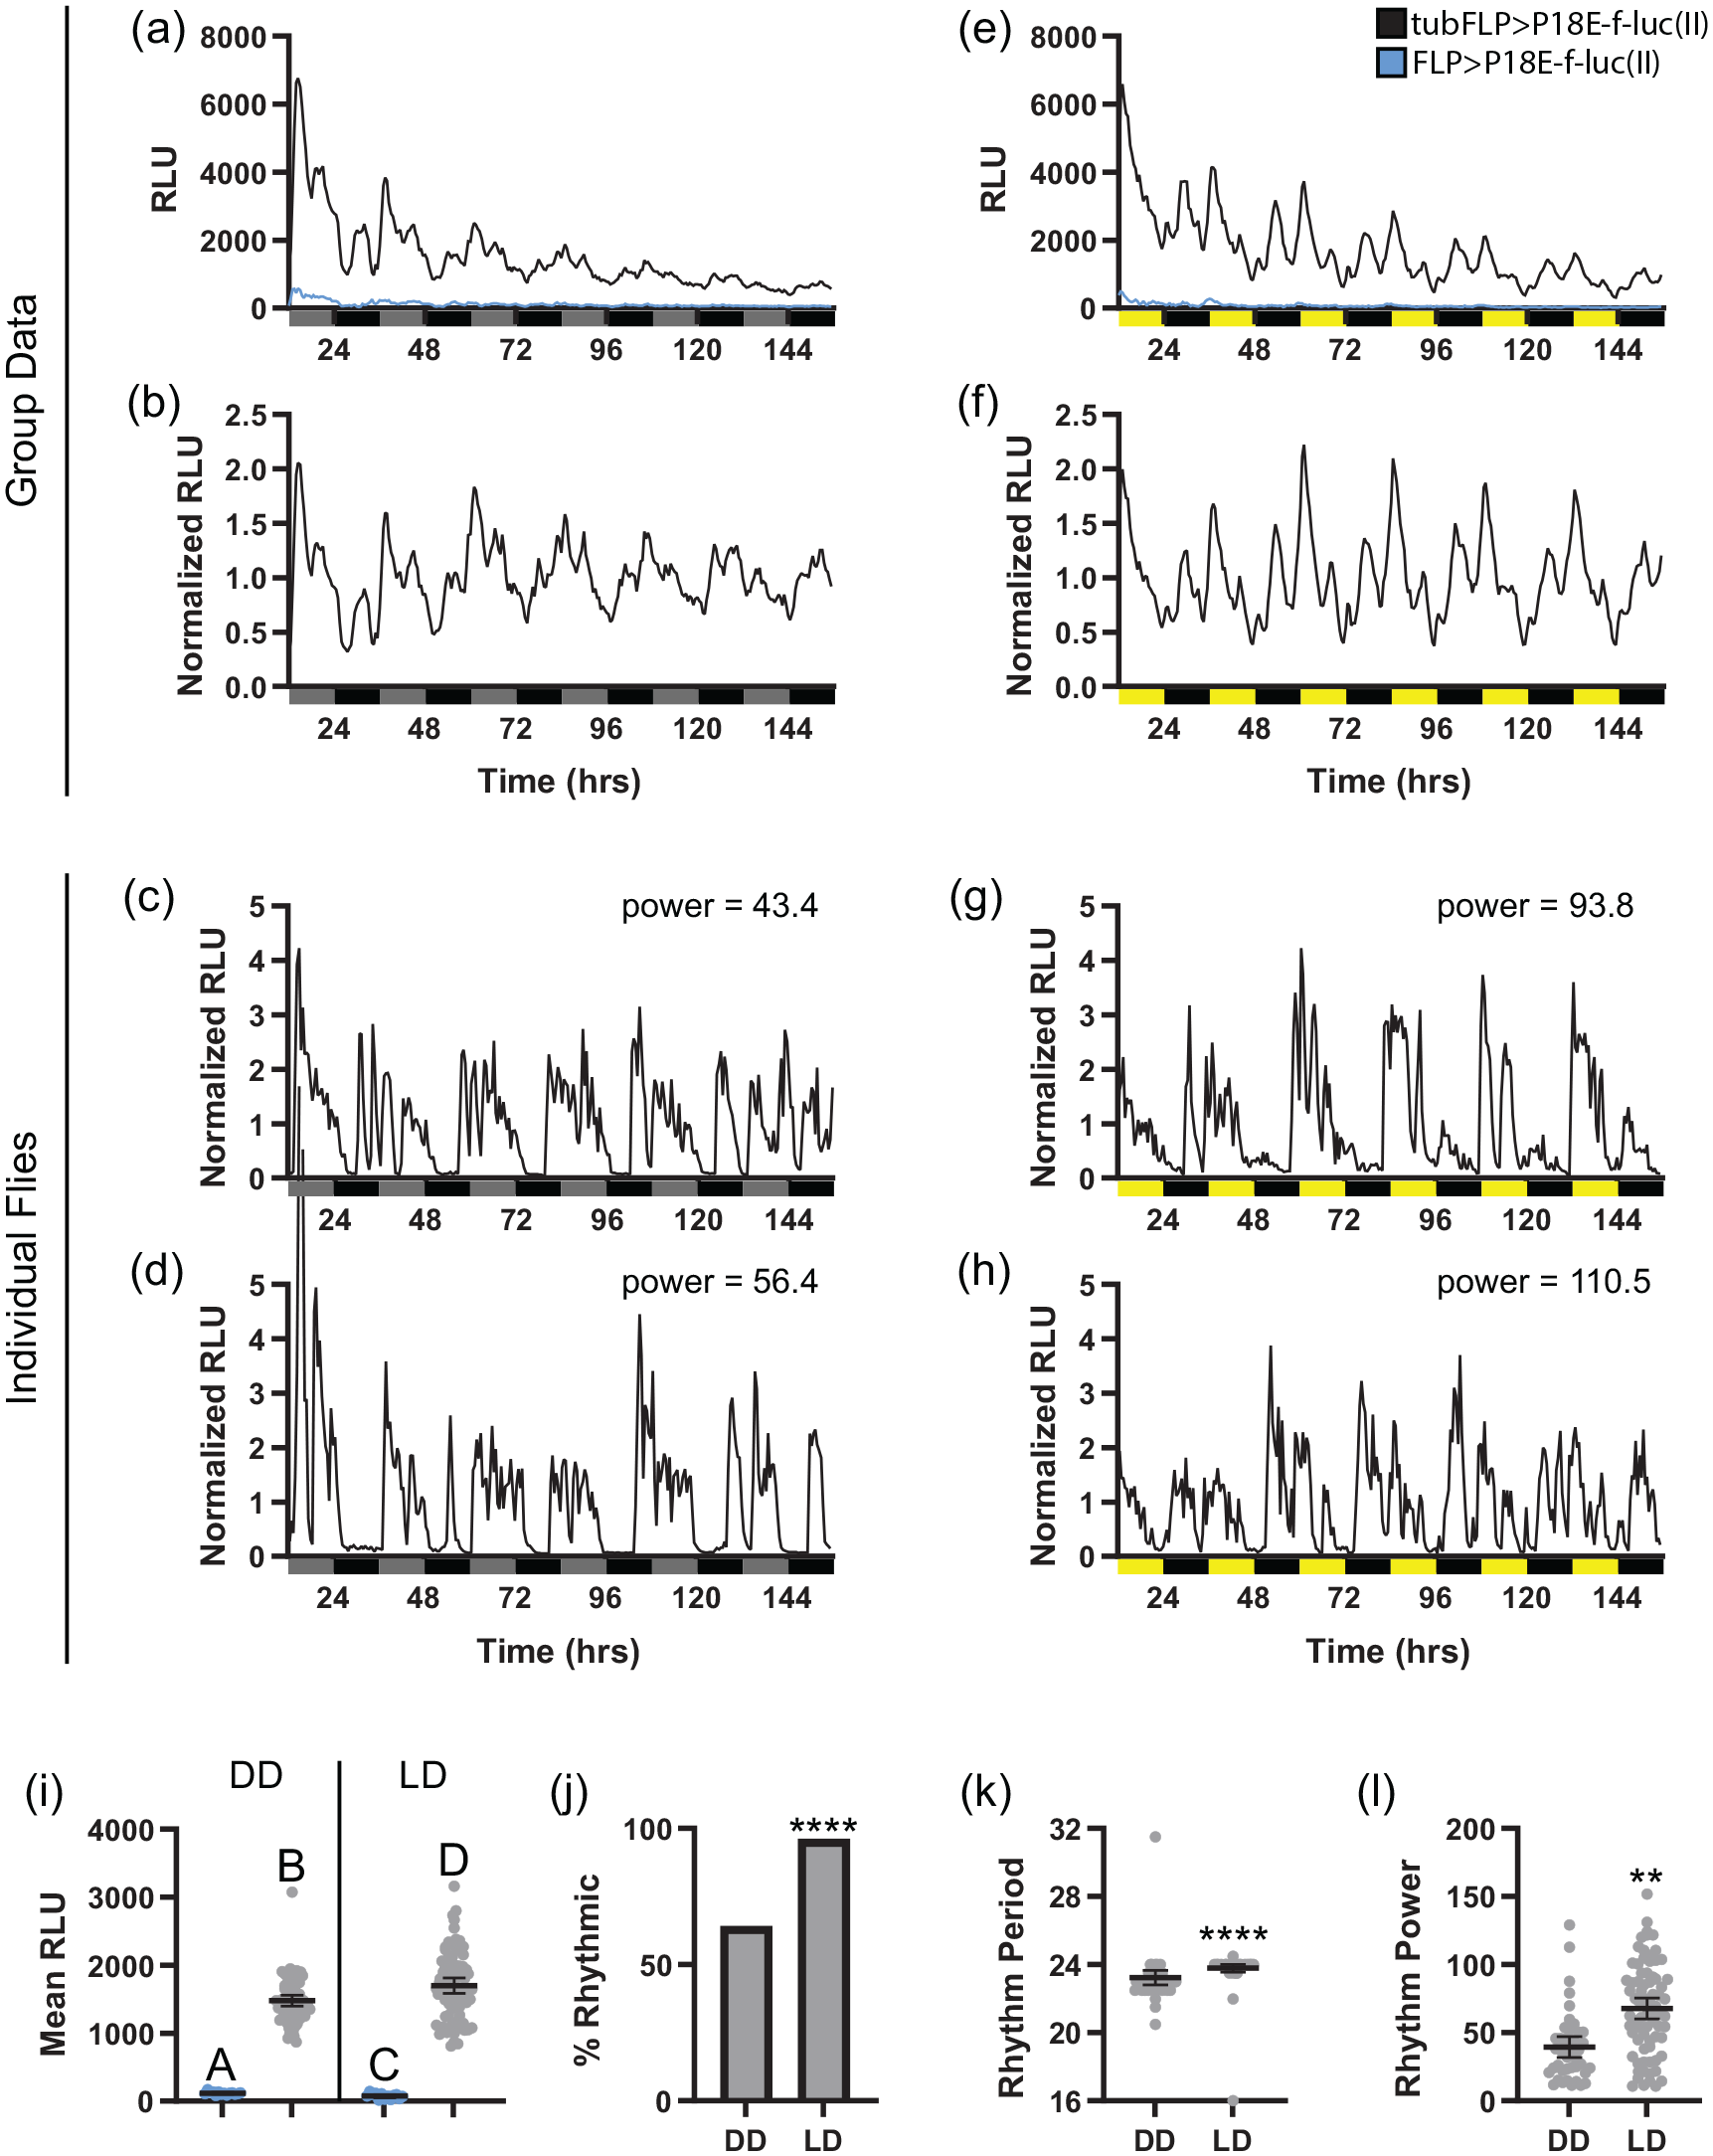
PE-f-luc reporters perform similarly to existing ubiquitous clock gene reporters. (a and b) Raw and normalized group mean bioluminescence is depicted for tubFLP>P18E-f-luc(II) (black) and control flies lacking tub-GAL4 (FLP > P18E-f-luc(II); blue) over 6 days in DD. (c and d) Representative examples of normalized DD luciferase signals from individual tubFLP>P18E-f-luc(II) flies around the 80th (c) and 90th (d) percentile of chi-square rhythm strength. Gray and black bars underneath graphs in (a-d) represent subjective day and night, respectively. (e and f) Raw and normalized group mean bioluminescence is depicted for tubFLP>P18E-f-luc(II) (black) and control FLP>P18E-f-luc(II) flies (blue) over 6 days in LD. (g and h) Representative examples of normalized LD luciferase signals from individual tubFLP>P18E-f-luc(II) flies around the 80th (g) and 90th (h) percentile of chi-square rhythm strength. Yellow and black bars underneath graphs in (e-h) represent lights-on and lights-off, respectively. (i), Quantification of mean RLU over 6 days in DD or LD for tubFLP>P18E-f-luc(II) (gray) and control FLP>P18E-f-luc(II) flies (blue). Different letters indicate a significant difference with p < 0.05, Dunnett’s T3 multiple comparisons test. (j) Percentage of tubFLP>P18E-f-luc(II) flies that exhibited rhythmic luciferase activity under DD and LD conditions, demonstrating increased individual fly rhythmicity in LD. ****p < 0.0001, Fisher’s exact test. (k and l) Mean chi-square bioluminescence rhythm period (k) and power (l) for rhythmic tubFLP>P18E-f-luc(II) flies shows that the presence of LD cycles narrowed the range of period values and increased individual fly rhythm strength. ****p < 0.0001; **p < 0.01, Mann-Whitney (k) or Welch’s t test (l). For (i), (k), and (l), dots represent individual flies and lines are means ± 95% confidence intervals. Abbreviations: FLP = flippase; DD = constant darkness; LD = light-dark; RLU = relative light units.
As was the case for otdFLP, both group mean and individual fly rhythmicity increased in LD compared with DD, with nearly all flies showing bioluminescence rhythms in LD (Figure 4j and 4l; Table 1). At the group mean level, this resulted in strong and persistent cycling across all monitoring days (Figure 4e and 4f), which was paralleled by robust and non-dampening individual bioluminescence rhythms (Figure 4g and 4h). In addition to increasing overall rhythm strength, LD cycles also reduced variability in the circadian period length of individual flies and brought mean period length closer to 24 h (Figure 4k; Table 1), consistent with an entraining effect of the light cues.
We also observed strong bioluminescence rhythms in tubFLP>P70E-f-luc(III) flies. In this case, ~88% of flies were rhythmic in DD conditions, and this increased to nearly 95% in LD (Suppl. Fig. S3; Table 1). In both DD and LD, mean bioluminescence signal strength exhibited substantial oscillations, and we observed persistent circadian cycling at both the group mean and individual fly levels (Suppl. Fig. S3A-S3H).
Sustained Molecular Cycling in Peripheral Tissues Under Constant Environmental Conditions
We next sought to use our tissue-inducible reporters to investigate rhythmicity of a peripheral circadian clock. We again used the GAL4-UAS system to induce PE-f-luc expression, but in this case used a to-GAL4 driver to drive UAS-FLPpest. To-GAL4 is relatively selectively expressed in the fat body (Dauwalder et al., 2002), a peripheral metabolic tissue that functions similar to mammalian liver and adipose tissue, with some additional expression in other parts of the gastrointestinal tract (Xu et al., 2008). We were particularly interested in the effect of constant environmental conditions on fat body circadian clock activity, as it has been previously reported that per expression in the abdomen of Drosophila quickly dampens in DD based on experiments conducted with a lucifierase reporter (Stanewsky et al., 1997), RNA extraction (Xu et al., 2011), or antibody staining (Fulgham et al., 2021), suggesting that fat body clocks are not sustained without light cues.
Results with toFLP flies were largely similar to those observed with tubFLP, with both reporter lines showing robust rhythmicity under both DD and LD conditions. Signal strength in toFLP>P18-E-f-luc(II) flies was intermediate between results obtained with otdFLP and tubFLP; nevertheless, it could still be easily distinguished from background luminescence observed in control flies lacking to-GAL4 (Figure 5a, 5b, and 5i). In DD, toFLP>P18E-f-luc(II) group mean data showed an initial double peak of bioluminescence that coalesced into a single peak following the first complete day in DD (Figure 5a and 5b). Cycling amplitude of group mean data appeared to dampen slightly during the last few days of recording. Notably, however, ~55% of individual toFLP>P18E-f-luc(II) flies exhibited rhythmic luciferase activity (Figure 5j; Table 1), and many of these clearly retained rhythmic cycling throughout the full recording period (Figure 5d). Thus, in contrast to previous results, we find that fat body molecular clock transcriptional activity is robust in the absence of environmental cues, at least in a subset of flies. We therefore hypothesize that the dampening of DD rhythmicity at the group mean level that we and others have seen occurs in part through a desynchronization of the phases of individual fly rhythms. This is consistent with a relatively broad distribution of period lengths in these flies (Figure 5k).
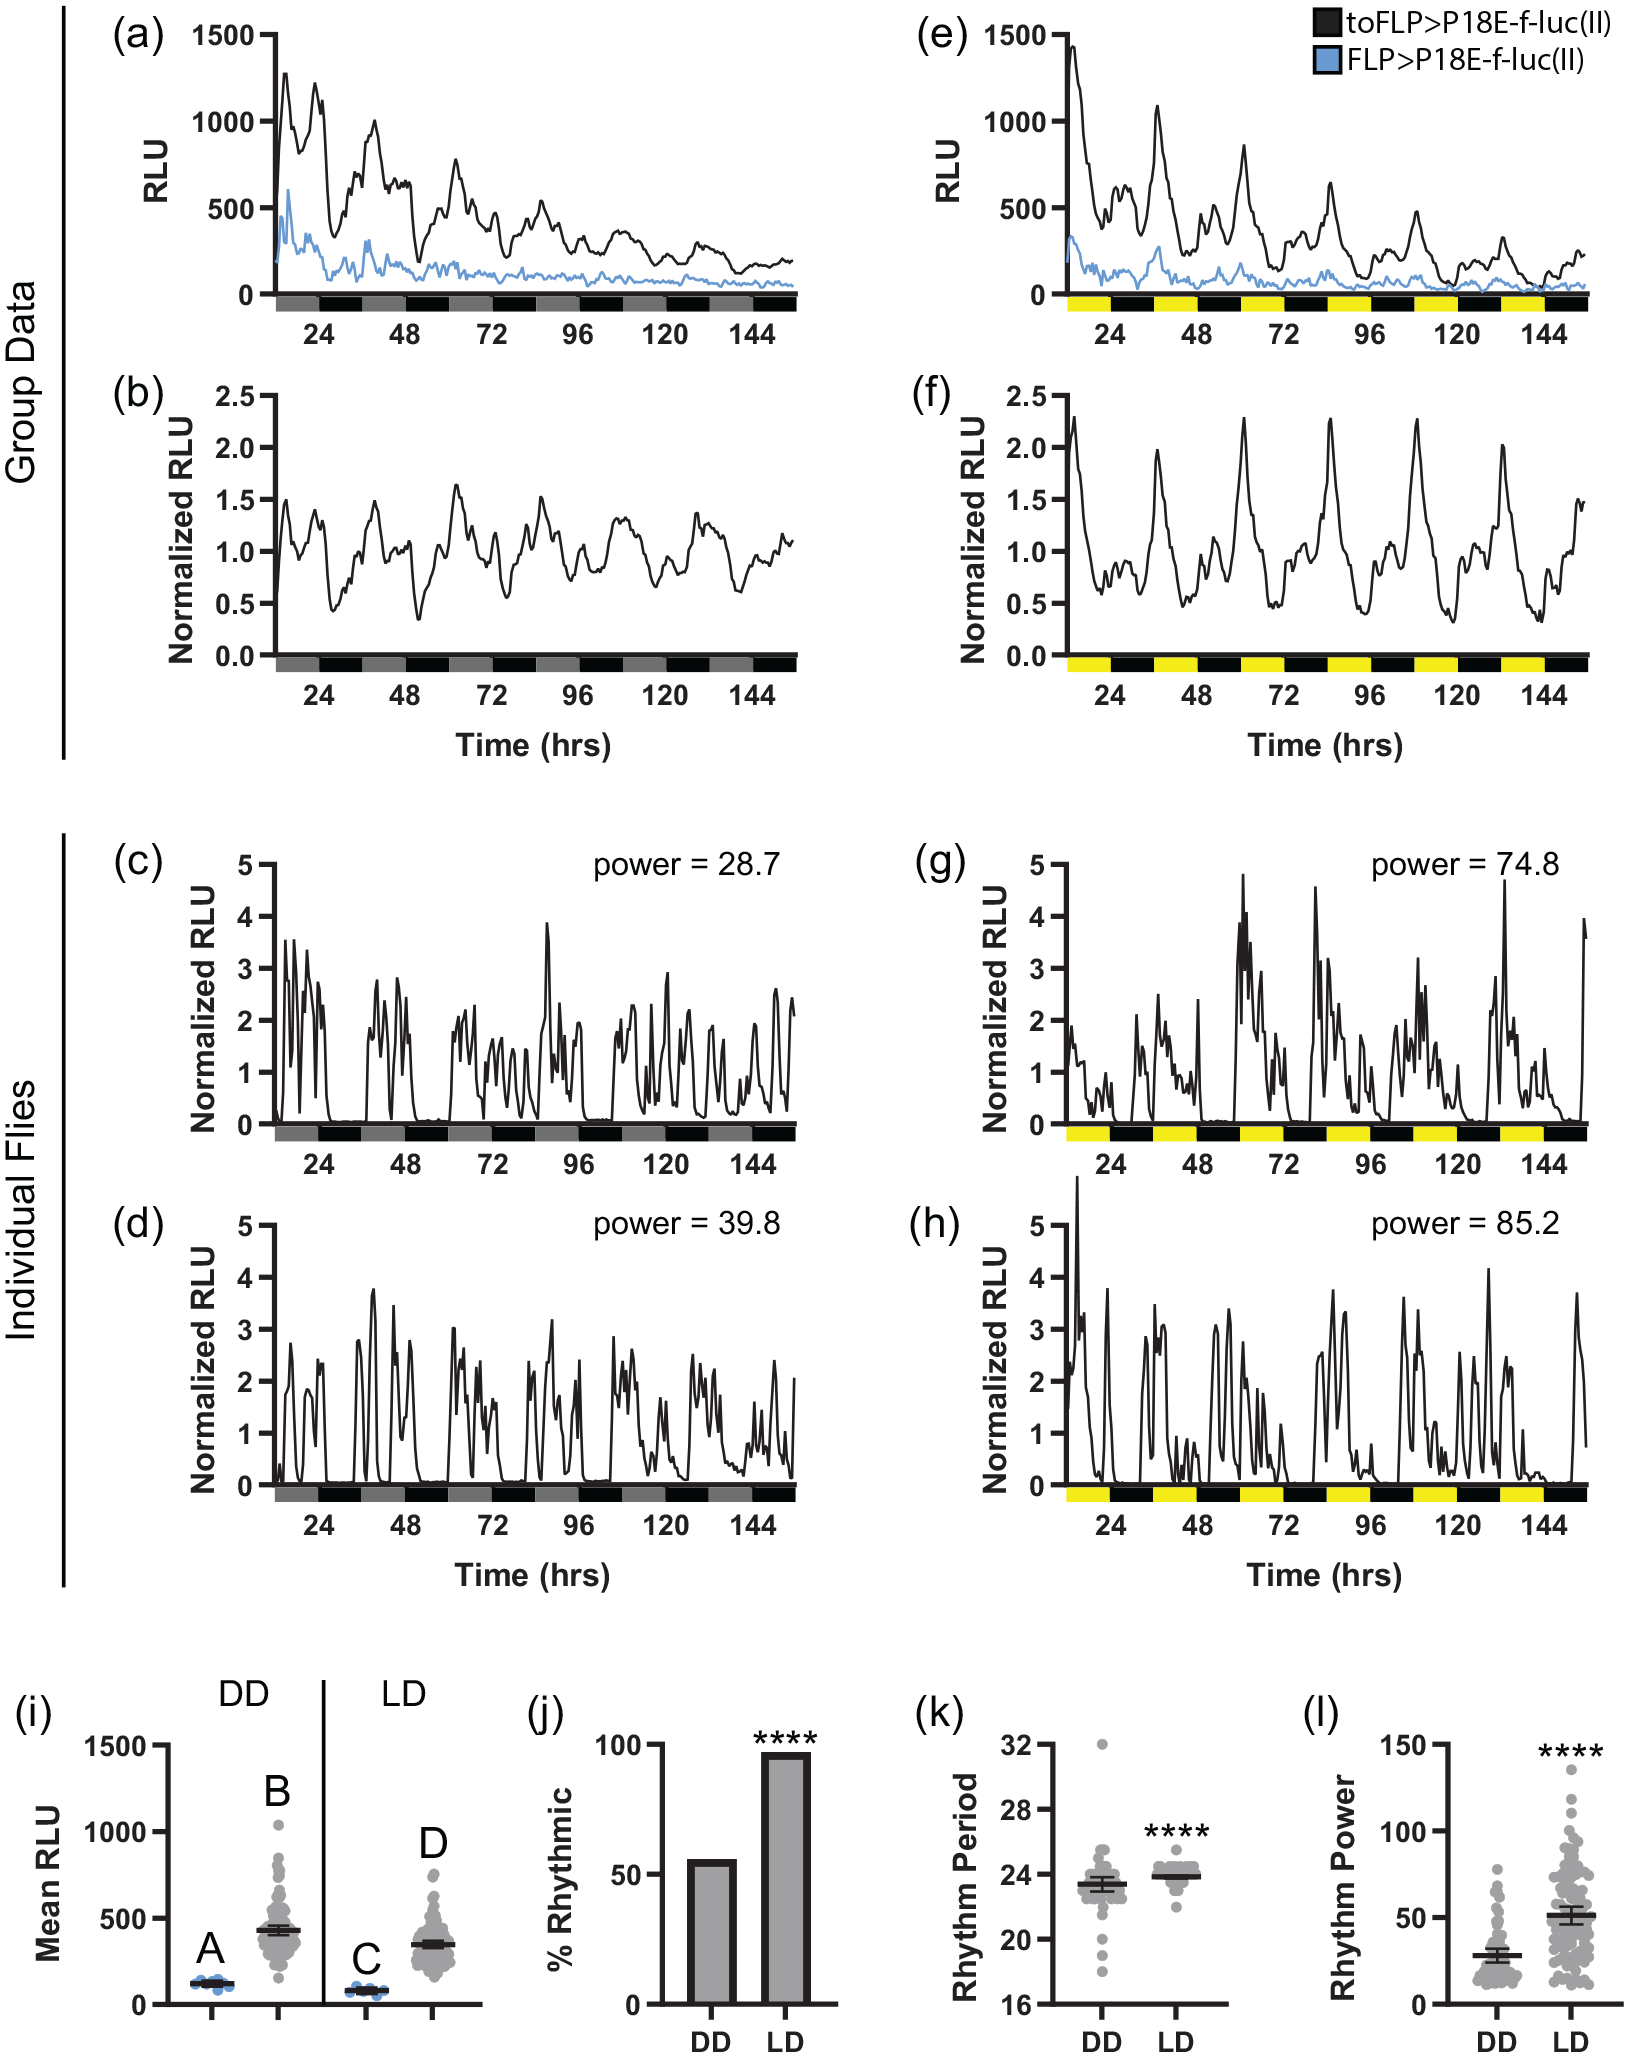
P18E-f-luc(II) reporter line demonstrates sustained circadian clock transcriptional activity rhythms in fat body cells. (a and b) Raw and normalized group mean bioluminescence is depicted for toFLP>P18E-f-luc(II) (black) and control flies lacking to-GAL4 (FLP>P18E-f-luc(II); blue) over 6 days in DD. (c and d) Representative examples of normalized DD luciferase signals from individual toFLP>P18E-f-luc(II) flies around the 80th (c) and 90th (d) percentile of chi-square rhythm strength. Gray and black bars underneath graphs in (a-d) represent subjective day and night, respectively. (e and f) Raw and normalized group mean bioluminescence is depicted for toFLP>P18E-f-luc(II) (black) and control FLP>P18E-f-luc(II) flies (blue) over 6 days in LD. (g and h) Representative examples of normalized LD luciferase signals from individual toFLP>P18E-f-luc(II) flies around the 80th (g) and 90th (h) percentile of chi-square rhythm strength. Yellow and black bars underneath graphs in (e-h) represent lights-on and lights-off, respectively. (i) Quantification of mean RLU over 6 days in DD or LD for toFLP>P18E-f-luc(II) (gray) and control FLP>P18E-f-luc(II) flies (blue). Different letters indicate a significant difference with p < 0.05, Dunnett’s T3 multiple comparisons test. (j) Percentage of toFLP>P18E-f-luc(II) flies that exhibited rhythmic luciferase activity under DD and LD conditions, demonstrating that a substantial percentage of flies had rhythmic bioluminescence rhythms under both conditions but that this was relatively increased in LD. ****p < 0.0001, Fisher’s exact test. (k) Quantification of mean chi-square rhythm period over 6 days in DD or LD in rhythmic toFLP>P18E-f-luc(II) flies shows a narrowing of the range of periods under LD conditions. ****p < 0.001, Mann-Whitney test. (l) Quantification of mean chi-square rhythm power over 6 days in DD or LD in rhythmic toFLP>P18E-f-luc(II) flies shows mean rhythm strength is increased in LD compared with DD. ****p < 0.0001, Welch’s t test. For (i), (k), and (l), dots represent individual flies and lines are means ± 95% confidence intervals. Abbreviations: FLP = flippase; DD = constant darkness; LD = light-dark; RLU = relative light units.
When exposed to LD conditions, both individual and group mean rhythmicity increased in toFLP>P18E-f-luc(II) flies (Figure 5e-5h, 5j, and 5l). At the group mean level, we observed a clear double daily peak of biolumenescence in LD that persisted with constant amplitude across all recording days (Figure 5e and 5f). We also observed an increase in the percentage of individual flies exhibiting significant rhythmicity as well as the relative strength of those rhythms (Figure 5j and 5l; Table 1). Furthermore, the mean period length of luciferase activity rhythms of individual flies was slightly lengthed to near 24 h, and this was associated with a narrowing of the range of period lengths (Figure 5k). These findings were largely recapitulated in toFLP>P70E-f-luc(III) flies, which exhibited substantial and persistent rhythmicity under DD conditions that increased in strength when LD cycles were imposed (Suppl. Fig S4; Table 1).
Because all of our experiments thus far were conducted on male flies, we also assessed bioluminescence in females to test for potential sex-specific effects. Importantly, we saw similar results with sustained rhythmicity when we used our reporters to monitor fat body circadian transcriptional activity in female flies under DD conditions (Table 1). Together, these experiments demonstrate that molecular clock oscillations persist in fat body tissue for several days under DD and LD conditions, with rhythm strength and precision increasing in the presence of externally imposed light signals.
Cell-Specific Disruption of the Molecular Clock Within the Fat Body Dampens Intrinsic Bioluminescence Oscillations
When combined with other cell-specific manipulations, our inducible reporter system offers the opportunity to assess the tissue autonomy of the molecular circadian clock. We therefore chose to again use toFLP to induce luciferase expression within fat body cells while simultaneously driving a dominant-negative clock construct (UAS-ClkDN; Tanoue et al., 2004) within these cells, which effectively suppresses molecular clock activity. In these flies, the molecular clock is functional in non-GAL4-expressing tissue. Furthermore, we and others have found that flies in which circadian clock function has been selectively abrogated in fat body cells retain locomotor activity and feeding rhythms (Xu et al., 2008; Fulgham et al., 2021). Thus, any systemic cues that derive indirectly from these behavioral cycles should remain intact.
As a control, we monitored luciferase activity in P18E-f-luc(II) reporter in flies in which we used to-GAL4 to drive both UAS-FLPpest and UAS-GFPn. The latter construct was included to normalize for any potential GAL4 dilution effect produced by addition of UAS-ClkDN in experimental flies. Notably, control toFLP>P18E-f-luc(II)+GFPn flies demonstrated robust mean bioluminescence rhythms in both DD and LD conditions (Figure 6a-6d). This was associated with significant rhythmicity of ~60% of individual flies under DD conditions, which increased to ~100% in LD (Figure 6j). In addition to a higher percent rhythmicity, LD conditions produced stronger mean rhythm power and a narrower range of rhythm periods (Figure 6k and 6l; Table 1). As expected, these results were largely in line with those we obtained with toFLP>P18E-f-luc(II) flies (Figure 5), which are genetically identical except for the absence of UAS-GFPn. However, we did note a reduction in overall signal strength with the addition of UAS-GFPn, potentially as a result of diluted GAL4 potency in driving FLP expression (Figure 6i; Table 1).
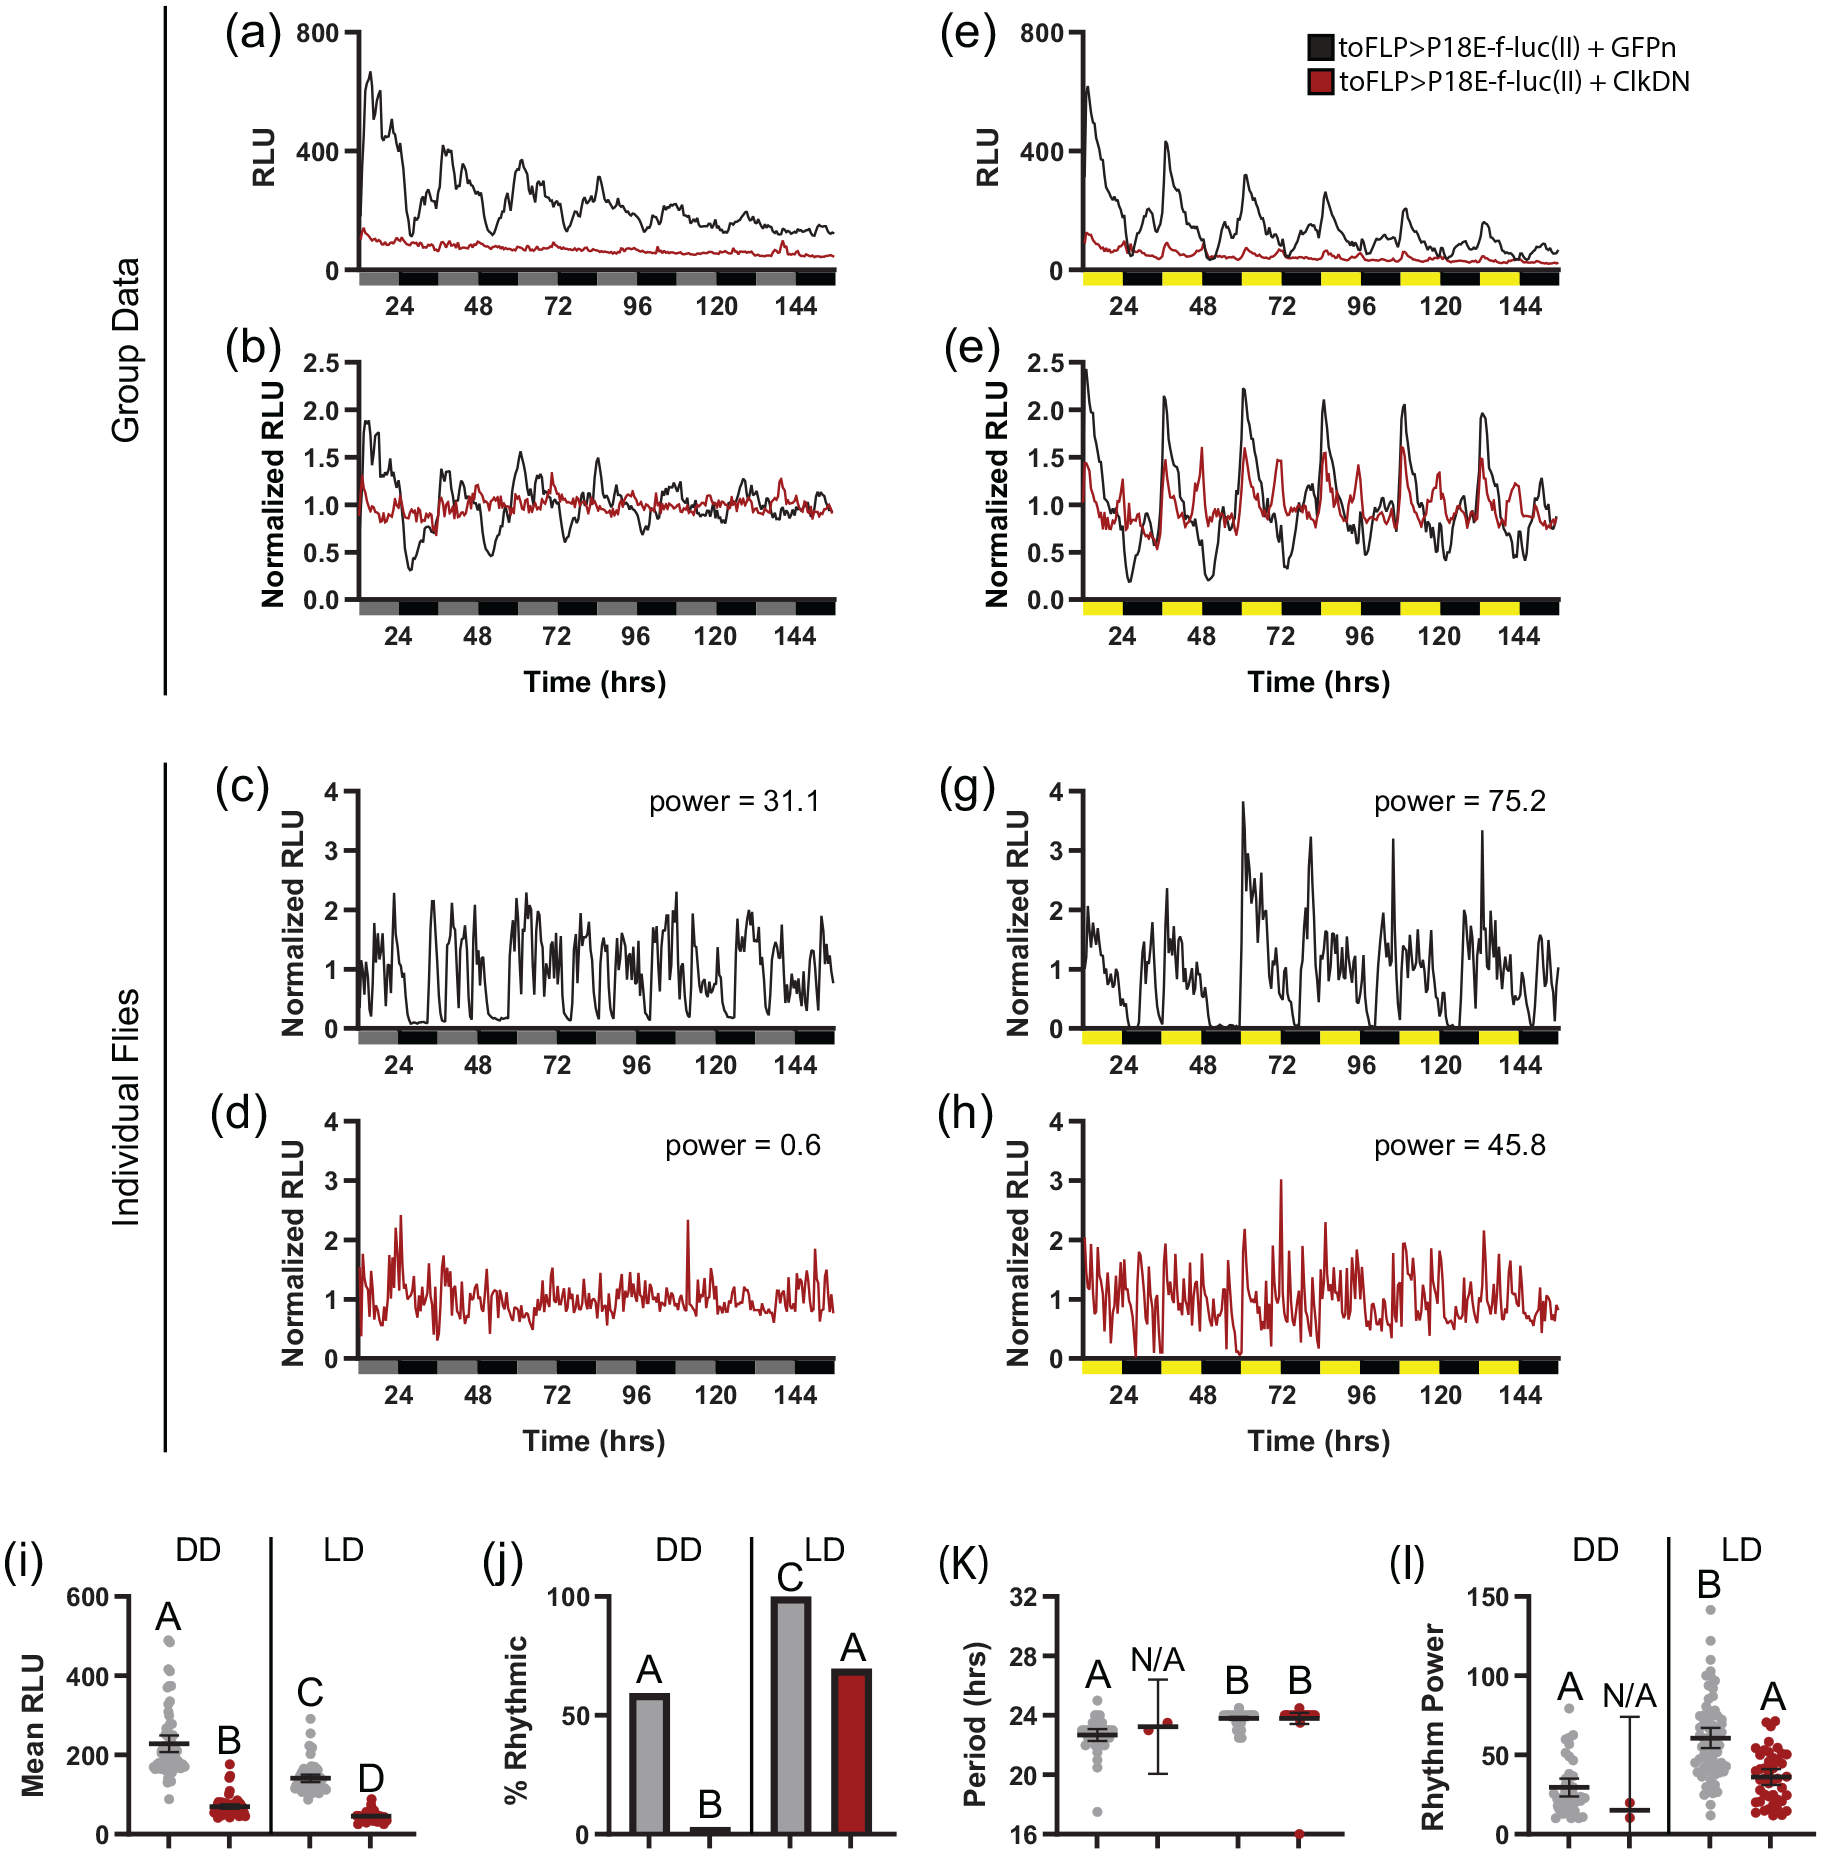
Bioluminescence rhythms in the fat body depend on the intrinsic fat body clock. (a and b) Raw and normalized group mean bioluminescence readings over 6 days in DD comparing control toFLP>P18E-f-luc(II)+GFPn flies (black) and toFLP>P18E-f-luc(II)+ClkDN (red) flies, which express a dominant-negative clock transgene selectively in fat body cells. (c and d) Representative examples of normalized DD luciferase signals from individual toFLP>P18E-f-luc(II)+GFPn (
Fat-body-specific expression of ClkDN had 2 major effects on bioluminescence. First, we found that mean signal strength was drastically reduced in toFLP>P18E-f-luc(II)+ClkDN flies compared with GFPn controls (Figure 6i). This is expected, as the ClkDN construct should interfere with CLK/CYC-mediated transcription, thereby reducing the expression of genes under direct CLK/CYC transcriptional control. Second, the rhythmicity of the residual bioluminescence was substantially reduced compared with controls. This was especially obvious under DD conditions, which resulted in near-total arrhythmicity at both the group mean and individual fly levels (Figure 6a-6d and 6j; Table 1). We did find that a substantial number of individual ClkDN-expressing flies produced rhythmic bioluminescence under LD conditions; however, there was a clear reduction in the prevalence, amplitude, and strength of these rhythms (Figure 6e-6h, 6j, and 6l; Table 1). Furthermore, a close inspection of luciferase activity over time revealed notable differences compared with controls. Flies expressing ClkDN typically had abrupt peaks associated with the times of lights-on and lights-off, whereas control flies had oscillations that anticipated these light transitions (Figure 6e and 6f). Bioluminescence recordings also appeared much noiser in individual ClkDN-expressing flies (Figure 6h). It is possible that the per regulatory sequences we included in our reporters are directly light-responsive or that the bioluminescence rhythms we observed in LD in ClkDN flies are artifactual due to positional changes of flies associated with light-induced startle responses. Nevertheless, the reduction in overall signal strength and the virtual lack of rhythmicity under DD conditions demonstrate that our reporter constructs are sensitive to molecular clock function and that fat body cells must have competent cell-intrinsic clocks to maintain rhythmic circadian transcriptional control.
Discussion
An understanding of the function of circadian clocks in different tissues and under different environmental conditions requires a means to track molecular clock activity in a spatially controlled manner in single flies. Longitudinal monitoring of clock activity in specific tissues has typically required in vitro culturing, which eliminates systemic signals emanating from other tissues (Emery et al., 1997; Plautz et al., 1997; Roberts et al., 2015; Schubert et al., 2020; Versteven et al., 2020). In rare cases, cell-specific reporter expression has been reported as a surreptitious consequence of genomic insertion location (Veleri et al., 2003), but this cannot be used to intentionally and reliably direct reporter activity to tissues of interest. Here, we have generated and characterized several inducible luciferase reporters of Drosophila molecular clock transcriptional activity. The reporters exhibit minimal leakiness and can be expressed in a cell-specific manner through use of the GAL4-UAS system. The increasing availability of GAL4 drivers that selectively target many different central and peripheral clock tissues therefore confers the ability to investigate the function and interdependence of circadian clocks in single flies in vivo.
Our PE-f-luc reporters place luciferase expression under the control of relatively small regulatory sequences of the per gene that surround the core per E-box to which CLK and CYC bind to induce transcription. These per regulatory sequences have been previously demonstrated to generate rhythmic transcriptional activity, thus confirming the sufficiency of the E-box in circadian clock regulation of oscillatory gene expression (Hao et al., 1997, 1999; Darlington et al., 1998; Hardin, 2004). However, it is clear that the ultimate pattern of per gene expression depends on multiple regulatory elements spread throughout a much larger per promoter region as well as intronic regions of the per gene (Stanewsky et al., 1997, 2002). Thus, we consider our reporter lines as general indicators of CLK/CYC transcriptional activity rather than as specifically monitoring per levels. One benefit of this approach is that it can provide information about the overall state of circadian transcriptional outputs instead of being tied to the regulation of a single gene; however, the reduced specificity may also result in less coherent rhythms as a consequence of a broader phase of CLK/CYC activity across a range of clock-controlled genes.
We used phiC31-mediated integration (Bischof et al., 2007) to insert the PE-f-luc transgenes at known sites in the fly genome, thus making direct comparisons between the P70E and P18E constructs possible. Even though sequences in the larger 70-bp regulatory region flanking the E-box have been demonstrated to contribute to levels and spatial expression of per (Lyons et al., 2000), we found that reporters on the same chromosome displayed broadly similar features, like bioluminescence intensity and cycling parameters, regardless of the specific regulatory sequence used. Despite overall similarities, we did record slightly higher luciferase signal in P18E-f-luc flies compared with P70E-f-luc flies. This could be due to the fact that the P18E-f-luc construct contains 3 concatemerized E-boxes, compared with only a single E-box in the P70E-f-luc construct. In contrast to the subtle differences between reporters on the same chromosome, we found that third chromosome reporters displayed markedly increased luciferase signal compared with second chromosome lines. For example, second chromosome reporter lines exhibited mean bioluminescence levels of ~150-250 RLU when driven with a neuronally restricted FLP line, compared with ~1000-2000 RLU for third chromosome lines (Table 1). This large difference in signal intensity between second and third chromosome reporters suggests there are significant insertional effects. It is possible that DNA sequences surrounding the second chromosome insertions act to suppress expression. In line with this possibility, we found in immunohistochemical assays that the P18E-f-luc(II) reporter line failed to express in all clock-containing cells. Thus, among brain clock neurons, we noted strong expression of this line in LNv clock neurons, but could not detect reporter expression above threshold in other clock cells. We also observed no appreciable expression in peripheral oenocyte cells. In contrast, we observed reporter expression in these cells in P70E-f-luc(III) flies.
Importantly, our lines show rhythmic luciferase activity, both on the group mean and on individual fly level, in a range of tissues and under different lighting conditions (Table 1). We note that individual flies often exhibited high-frequency fluctuations in luciferase activity in addition to circadian oscillations (e.g., see Figure 4d). It is difficult to differentiate whether these represent actual fluctuations in CLK/CYC activity or whether they are instead artifacts associated with fly movement, which is known to induce noisiness in luciferase recordings (Stanewsky et al., 1997). Nevertheless, we consistently observed multiple peaks of bioluminescence over the course of a single day in group mean data, especially under LD conditions. The multiple peaks do not appear to occur simply as a result of averaging together data from individual flies with dispersed phases, as we found clear evidence for multiple peaks in single flies that roughly aligned with the timing of peaks in group mean data (Suppl. Fig. S5A-S5B). In most cases, this consisted of a major peak immediately following lights-on and a second broad peak toward the middle to end of the dark period. However, the duration and magnitude of these varied somewhat by tissue and reporter line, which could reflect tissue-specific regulation (Suppl. Fig. S5C-S5D). Despite this tissue-to-tissue variability, we observed a consistent progressive decrease in bioluminescence throughout the light period that reached a nadir around the time of the transition to darkness, regardless of the cell type in which luciferase had been induced. We note that the phenomenon of biphasic luciferase activity has been observed previously using traditional luciferase reporters, although the extent of this appears to depend on the specific reporter line used as well as luciferase monitoring conditions (Brandes et al., 1996; Stanewsky et al., 1997; Darlington et al., 2000). In general, the timing of the multiple peaks we observed is consistent with those reported in Darlington et al. (2000) which used the same concatemerized 18-bp E-box sequence to drive luciferase in a ubiquitous manner, although in that case the different peaks appeared to be somewhat broader and less well resolved.
To confirm the fidelity of our reporter lines, we conducted analysis on flies in which we simultaneously manipulated components of the molecular circadian clock. Importantly, we observed changes in overall luciferase signal strength that were consistent with CLK/CYC-mediated regulation of reporter expression. Thus, per mutants showed constitutively high bioluminescence, as expected based on a loss of feedback repression of the molecular clock, while ClkDN flies exhibited severely dampened signal strength, in line with a reduction in CLK/CYC activity. These changes were accompanied by a reduction in the prevalence and strength of luciferase activity rhythms (Figure 3 and Suppl. Figs. S4 and S6; Table 1). This result is particularly striking for flies in which we monitored fat body luciferase signals while selectively expressing ClkDN within these cells (Figure 6). As these flies retain feeding rhythms (Xu et al., 2008; Fulgham et al., 2021), the results help to rule out the possibility that luciferase rhythms arise secondary to rhythmic consumption of luciferin-containing food.
Interestingly, for both per mutant and ClkDN flies, we found that although DD rhythms were nearly eliminated, a substantial number of flies with putatively disrupted molecular clocks retained residual rhythmicity in LD. However, the oscillatory bioluminescence pattern in clock-disrupted flies was clearly distinct from that observed in controls. Thus, increases in bioluminescence in clock-disrupted flies were largely restricted to the light phase. Signals remained elevated at the end of the light phase, when bioluminescence reached a low point in control flies, and additionally failed to show a secondary peak during the dark period. As this rhythmicity was absent in DD conditions, we speculate that the oscillations present in per mutant and ClkDN flies are not due to residual molecular clock function, but instead represent either direct effects of light on transcription or are artifacts of fly movement within the recording well, which is modulated by light exposure. We note that these possible masking factors would also be expected to affect bioluminescence signals in control flies and should be taken into account when analyzing results. It may therefore be beneficial to better restrict fly movement during monitoring, which has previously been shown to reduce noise in bioluminescence assays (Stanewsky et al., 1997).
As noted, our reporter lines exhibit virtually no bioluminescence signal in the absence of FLP. This lack of leakiness suggests the translational stop codons present in the constructs are able to strongly suppress run-through translation. Although we did note slightly increased luciferase signal in third chromosome reporter lines compared with iso31 controls, the values differed by only a few RLU, which is insignificant compared with induced signal recorded in the presence of FLP. In contrast, we observed significant leakiness of UAS-FLP effector lines, which decreases signal to noise when our PE-f-luc lines are used in combination with the GAL4-UAS system to drive FLP. Notably, we compared GAL4-independent FLP expression in 4 different UAS-FLP lines and observed substantial leakiness in all lines tested. The leakiness of UAS-FLP lines underlines the importance of conducting parallel control experiments in flies containing PE-f-luc reporter constructs and UAS-FLP but in the absence of GAL4, to ensure that any recorded signal in experimental lines can be differentiated from background bioluminescence generated by GAL4-independent FLP. This is especially important for more spatially restricted GAL4 lines that may express in a small number of cells. For example, we were unable to detect signal above background when we used Clk856-GAL4 (Gummadova et al., 2009) to drive reporter expression in brain clock cells (data not shown). It is unclear in which cells the leaky FLP expression occurs, but the relatively small luciferase intensity suggests that it is not widespread. Interestingly, these FLP>PE-f-luc control flies exhibited moderate bioluminescence rhythms that were roughly similar to experimental lines with GAL4-directed FLP expression (Table 1), consistent with circadian regulation of background signals under control of the per regulatory sequences present in the reporter constructs.
We have used our reporter lines to compare CLK/CYC transcriptional activity in 3 different groups of cells: neurons using otdFLP, ubiquitously throughout the fly using tubFLP, and in fat body cells using toFLP. In accordance with the tissue specificity of our approach, we found that luciferase expression levels varied with driver type, with drivers that label larger cell populations reporting more luciferase activity (Table 1). All 3 of these manipulations primarily drive luciferase in peripheral clock tissues. We believe this to be true even in the case of otdFLP flies, in which luciferase signal is likely mostly derived from photoreceptor cells, which are known to contain functional circadian clocks and vastly outnumber central clock neurons in the brain (Zerr et al., 1990; Gunawardhana et al., 2021). Previous studies using both cross-sectional and longitudinal approaches have reported significant and progressive dampening of molecular clock cycling in peripheral tissues upon extended exposure to constant environmental conditions, suggesting that these peripheral clocks require light inputs for sustained and synchronous cycling (Hardin, 1994; Stanewsky et al., 1997; Giebultowicz et al., 2000; Ivanchenko et al., 2001; Veleri et al., 2003; Xu et al., 2008; Fulgham et al., 2021). Dampening of peripheral clock activity has also been noted in a number of mammalian studies. However, the extent of this molecular dampening has been a cause of debate and appears to vary based on monitoring conditions (Brandes et al., 1996; Stanewsky et al., 1997; Yoo et al., 2004; Finger et al., 2020). Importantly, we find that a substantial number of our reporter flies exhibit rhythmic luciferase activity across various peripheral clock tissues under DD conditions, and this included many flies that maintained robust cycling throughout the entire 6-day monitoring period. These results indicate that peripheral clock dampening is not a necessary consequence of a lack of light entrainment. Nevertheless, we consistently observed that bioluminescence rhythms were stronger and more robust in LD compared with DD (Table 1). A greater percentage of individual flies exhibited rhythmic luciferase activity in LD conditions, and overall rhythm strength was higher. This could result from a synchronization of molecular clocks in individual peripheral clock cells that are directly light-responsive due to expression of the blue-light photoreceptor cryptochrome (Emery et al., 1998).
In particular, our experiments shed light on the function of the peripheral clock in the fat body, as we provide the first longitudinal analysis of rhythmic clock–mediated transcription within the fat body of individual flies. Previous experiments using cross-sectional approaches have demonstrated that cyclical period gene or protein expression in the fat body dampens out by day 6 of constant conditions (Xu et al., 2008; Fulgham et al., 2021). However, as these experiments were done on combined tissue from multiple individual flies, it is impossible to determine whether the dampening is due to a diminution of clock cycling in individual fat body cells, a loss of synchrony between cells within the fat body, or a loss of synchrony between flies that have different endogenous periods. Our findings that molecular clock oscillations can persist in fat body tissue for several days under DD conditions indicate that the dampened fat body rhythms observed in previous studies result at least in part from a progressive desynchronization of molecular clock oscillations between flies. However, for individual bioluminescence traces that dampened in DD, we could not distinguish whether fat body cells within an individual fly become desynchronized or whether molecular clock oscillations within individual cells truly dampened in DD. This could be delineated with studies of single-cell oscillations in dissected fat body tissue, as has been done with luciferase reporters in the brain of flies (Roberts et al., 2015; Schubert et al., 2020; Versteven et al., 2020).
There are several areas of circadian research that could benefit from the use of our inducible circadian reporters. It has been suggested that the fat body clock requires input from the central clock to maintain rhythmic clock gene oscillations in constant darkness (Erion et al., 2016). Our PE-f-luc reporters could be used to further investigate the dependency of the fat body or other peripheral tissues on the central clock by monitoring bioluminescence of PE-f-luc flies that have an ablated central clock. Our reporters could also be used to track the influence of other circulating factors on peripheral clock oscillations. For example, several studies have indicated that, as in mammals, fly peripheral clocks are sensitive to cycles of food availability (Damiola et al., 2000; Stokkan et al., 2001; Xu et al., 2011; Parasram et al., 2018). It would be of interest therefore to track molecular clock transcriptional activity in flies exposed to different feeding regimens. Finally, our reporters could be used to assess the emergence of circadian clock transcriptional activity rhythms in distinct peripheral tissues, as has been done broadly for the entire fly using ubiquitously expressed luciferase reporters (Zhao et al., 2019). These and other studies would serve to expand our knowledge of the function and interaction of molecular clocks in tissues throughout organisms.
Supplemental Material
sj-ai-1-jbr-10.1177_07487304221138946 – Supplemental material for Inducible Reporter Lines for Tissue-specific Monitoring of Drosophila Circadian Clock Transcriptional Activity
Supplemental material, sj-ai-1-jbr-10.1177_07487304221138946 for Inducible Reporter Lines for Tissue-specific Monitoring of Drosophila Circadian Clock Transcriptional Activity by Lilyan M. Mather, Meghan E. Cholak, Connor M. Morfoot, Katherine C. Curro, Jacob Love and Daniel J. Cavanaugh in Journal of Biological Rhythms
Supplemental Material
sj-ai-2-jbr-10.1177_07487304221138946 – Supplemental material for Inducible Reporter Lines for Tissue-specific Monitoring of Drosophila Circadian Clock Transcriptional Activity
Supplemental material, sj-ai-2-jbr-10.1177_07487304221138946 for Inducible Reporter Lines for Tissue-specific Monitoring of Drosophila Circadian Clock Transcriptional Activity by Lilyan M. Mather, Meghan E. Cholak, Connor M. Morfoot, Katherine C. Curro, Jacob Love and Daniel J. Cavanaugh in Journal of Biological Rhythms
Supplemental Material
sj-ai-3-jbr-10.1177_07487304221138946 – Supplemental material for Inducible Reporter Lines for Tissue-specific Monitoring of Drosophila Circadian Clock Transcriptional Activity
Supplemental material, sj-ai-3-jbr-10.1177_07487304221138946 for Inducible Reporter Lines for Tissue-specific Monitoring of Drosophila Circadian Clock Transcriptional Activity by Lilyan M. Mather, Meghan E. Cholak, Connor M. Morfoot, Katherine C. Curro, Jacob Love and Daniel J. Cavanaugh in Journal of Biological Rhythms
Supplemental Material
sj-ai-4-jbr-10.1177_07487304221138946 – Supplemental material for Inducible Reporter Lines for Tissue-specific Monitoring of Drosophila Circadian Clock Transcriptional Activity
Supplemental material, sj-ai-4-jbr-10.1177_07487304221138946 for Inducible Reporter Lines for Tissue-specific Monitoring of Drosophila Circadian Clock Transcriptional Activity by Lilyan M. Mather, Meghan E. Cholak, Connor M. Morfoot, Katherine C. Curro, Jacob Love and Daniel J. Cavanaugh in Journal of Biological Rhythms
Supplemental Material
sj-ai-5-jbr-10.1177_07487304221138946 – Supplemental material for Inducible Reporter Lines for Tissue-specific Monitoring of Drosophila Circadian Clock Transcriptional Activity
Supplemental material, sj-ai-5-jbr-10.1177_07487304221138946 for Inducible Reporter Lines for Tissue-specific Monitoring of Drosophila Circadian Clock Transcriptional Activity by Lilyan M. Mather, Meghan E. Cholak, Connor M. Morfoot, Katherine C. Curro, Jacob Love and Daniel J. Cavanaugh in Journal of Biological Rhythms
Footnotes
Acknowledgements
We thank David Anderson, Michael Rosbash and Amita Sehgal for fly stocks and Jerry Yin for providing the cre-f-luc plasmid. This work was supported by the Division of Integrative Organismal Systems of the National Science Foundation, CAREER Award 1942167 to D.J.C.
Conflict of Interest Statement
The author(s) have no potential conflicts of interest with respect to the research, authorship, and/or publication of this article.
Notes
References
Supplementary Material
Please find the following supplemental material available below.
For Open Access articles published under a Creative Commons License, all supplemental material carries the same license as the article it is associated with.
For non-Open Access articles published, all supplemental material carries a non-exclusive license, and permission requests for re-use of supplemental material or any part of supplemental material shall be sent directly to the copyright owner as specified in the copyright notice associated with the article.