
Abstract
In Drosophila, as in other animals, the circadian clock is a singular entity in name and concept only. In reality, clock functions emerge from multiple processes and anatomical substrates. One distinction has conventionally been made between a central clock (in the brain) and peripheral clocks (e.g., in the gut and the eyes). Both types of clock generate robust circadian oscillations, which do not require external input. Furthermore, the phases of these oscillations remain exquisitely sensitive to specific environmental cues, such as the daily changes of light and temperature. When these cues conflict with one another, the central clock displays complex forms of sensory integration; how peripheral clocks respond to conflicting input is unclear. We therefore explored the effects of light and temperature misalignments on peripheral clocks. We show that under conflict, peripheral clocks preferentially synchronize to the light stimulus. This photic dominance requires the presence of the circadian photoreceptor, Cryptochrome.
Keywords
The intrinsic periodicity of most earthly habitats has led to the evolution of circadian clocks across all phyla. These endogenous, ~24-h oscillators allow organisms to optimize their biology for an isochronal world. For instance, in the fruit fly, Drosophila melanogaster, locomotor activity shows daily periodicity with a steady increase toward the evening (Allada and Chung, 2010). In both insects and mammals, these circadian systems comprise “molecular clocks” exhibiting transcription-translation feedback loops of specific clock genes.
To be robust, it is essential that such oscillations can be resynchronized, or “entrained,” to external cues (zeitgebers) (Dunlap et al., 2004). Research into entrainment has largely focused on cues from single modalities. In Drosophila, both light-dark cycles (LD) and temperature cycles (TC) entrain locomotor activity rhythms (Wheeler et al., 1993), via light- and temperature-entrainable molecular rhythms of the core clock proteins Period (PER) and Timeless (TIM) in the central clock network (Yoshii et al., 2005; Zerr et al., 1990). A major route for photic entrainment is the light-dependent degradation of TIM, mediated by the circadian photoreceptor, Cryptochrome (CRY) (Busza, 2004; Stanewsky et al., 1998). Less is known about the mechanisms of thermal entrainment.
Circadian systems have evolved in the presence of, and are subject to, multisensory challenges. Recent work investigating the coincidence of light and temperature shows that these cues act in a cooperative manner to entrain molecular rhythms in the brain of Drosophila (Yoshii et al., 2009). Conversely, misalignments between LD and TC lead to reduced-amplitude PER oscillations in these clock neurons, dissociation between different light- and temperature-sensitive cell groups, and an associated loss of evening anticipation behavior (Harper et al., 2016). Together, these findings highlight the exquisite sensitivity, and thus vulnerability, of the circadian system in Drosophila to environmental phase relationships, tolerating only certain degrees of zeitgeber mismatch.
Along with neurons in the central clock network of the fly brain, the circadian system includes peripheral oscillators in tissues around the body, including the retina, antenna, proboscis, leg, wing, Malpighian tubules, gut, cuticle, and reproductive organs (Giebultowicz et al., 2001; Giebultowicz and Hege, 1997; Ito et al., 2008; Krishnan et al., 1999; Plautz, 1997). These peripheral clocks are diverse, displaying varying levels of autonomy and involving different forms of molecular machinery (for review, see Ito and Tomioka, 2016).
The entrainment of peripheral clocks to single zeitgebers has also been studied. For instance, many respond directly to both light and temperature, entraining PER rhythms to LD and TC when isolated in vitro (Glaser and Stanewsky, 2005; Ivanchenko et al., 2001; Plautz, 1997). As in the central clock, light sensitivity of peripheral clocks appears to act via CRY, which mediates the light-dependent degradation of TIM (Ivanchenko et al., 2001; Stanewsky et al., 1998). Unlike the central clock, however, peripheral CRY may serve a dual function as a core clock component (Collins et al., 2006; Krishnan et al., 1999; Levine et al., 2002b). This latter role of CRY resembles that which is observed in mammalian systems (Okamura, 1999; van der Horst et al., 1999).
While unimodal entrainment of peripheral clocks has been demonstrated, the responses of these oscillators in multisensory environments remains unknown. Thus, building on previous work in the central clock, we asked how peripheral circadian networks respond to conflicts between light and temperature. For this, we used a well-established period-luciferase fusion gene (XLG-luc) reporting PER expression in peripheral clocks (Veleri et al., 2003). Furthermore, given that peripheral clocks form part of a wider circadian network throughout the fly, we investigated responses in vivo rather than purely in isolated tissues. We show that unlike the central clock network, peripheral clock oscillations do not collapse under sensory conflict. Instead, light dominates peripheral clock entrainment and this light dominance depends on the circadian photoreceptor CRY.
Materials and Methods
Fly Maintenance and Stocks
Flies were reared under 12 h:12 h (12:12) LD cycles on Drosophila medium (0.8% agar, 2.2% sugar-beet syrup, 8.0% malt extract, 1.8% yeast, 1.0% soy flour, 8.0% corn flour, and 0.3% hydroxybenzoic acid) at 25 °C and approximately 60% humidity. The following fly stocks were used: XLG-luc1-1 (Veleri et al., 2003), tim01;XLG-luc1-1 (Glaser and Stanewsky, 2005), and XLG-luc1-1 cryb double mutants generated by meiotic recombination between XLG-luc1-1 and cryb bearing chromosomes. Only male flies between 3 and 6 days of age were used in experiments.
Activity Monitoring
Flies were individually placed into small glass recording tubes containing 5% sucrose and 2% agar medium, which occupied approximately one third of the tube. These tubes were then loaded into MB5 activity monitors (Trikinetics, Waltham, MA), with 17 infrared beam detectors distributed across the length of each activity tube. An interruption of the infrared light beam by the movement of a fly produced a signal, which was then recorded by a microprocessor. The number of beam breaks was recorded for each fly in 5-min time bins and summed into bin counts. Thus, 12 activity scans were obtained for each fly per hour. Monitors were placed in a light- and temperature-controllable incubator (Percival, Perry, IA) for the duration of the experiments.
Zeitgebers
Field studies show that temperature increases continuously (and almost linearly) throughout the day and decreases in a similar fashion during the night (Vanin et al., 2012). However, apart from some recent exceptions (e.g., Yoshii et al., 2010), it has been traditional to use sharp, “square-wave-like” transitions between cold and warm conditions to study temperature-dependent circadian entrainment. Our preliminary experiments showed that such square-wave-like temperature cycles gave rise to sharp peaks in bioluminescence readings at the transitions between cold and warm (see Suppl. Fig. S1A for examples). The fact that these peaks were also present in clock-null mutant flies (tim01; Suppl. Fig. S1A, bottom trace) suggests they are extrinsic to the circadian oscillator, possibly reflecting an altered metabolic activity during sharp temperature transitions (Sehadova et al., 2009). At a conceptual level, we can draw a comparison with “masking,” which commonly describes direct stimulus-evoked (i.e., clock independent) changes in locomotor behavior at points of sharp environmental transition. In analogy, the clock-independent bioluminescence responses could be described as a form of “molecular masking,” which might well be linked to the behavioral responses. To mitigate these masking effects, we used more naturalistic, “ramped” temperature cycles (Vanin et al., 2012), which made the transitional bioluminescence responses disappear (as is also the case with behavioral masking) (Suppl. Fig. S1A).
The 12:12 light-dark cycles were generated through square wave transition between ~2500 and 0 lux, respectively. The 12:12 temperature cycles were achieved through gradual transitions between 26 and 16 °C occurring over 9.5 h (see Suppl. Fig. S1, B and C). ZT0 denotes the beginning of an increase from 16 °C to 26 °C over 9.5 h, and ZT12 denotes the start of a corresponding decrease from 26 °C to 16 °C.
Cue misalignment is quantified as the absolute distance, in hours (delta time, or Δt), between the onset-offset of 2 cyclic 12:12 signals. For example, ΔtL,T = 3 h denotes that light onset-offset occurs 3 h after the beginning of temperature increase or decrease.
Environmental conditions were recorded with an environmental monitor placed inside the incubator. The monitors were checked to validate scheduled conditions. The average activity of the population was plotted as histograms using the MATLAB Flytoolbox library, a signal processing toolbox developed by Levine et al (2002a), using functions written by MATLAB (Mathworks, Natick, MA).
Bioluminescence Imaging
The images shown in Figure 1 were acquired using an LV200 bioluminescence imaging system (Olympus, Tokyo, Japan). Flies were kept in 12:12 LD at 25 °C (Fig. 1, A and B) or 12:12 naturalistic TC in DD (Fig. 1, C and D) for at least 3 days in vials containing a 1% agar and 5% sucrose food supplemented with 15 mM luciferin. Individuals were then anesthetized with ether and dry mounted under an UPLSAPO 20× Apochromat objective (Olympus). Light microscopy was used to obtain a reference image of the fly. The lights were then turned off and a CCD camera (Hamamatsu ImageEM X2, Hamamatsu City, Japan) was used to capture the bioluminescence signal over a 5-min exposure period. All images were processed and quantified using the same settings in FIJI (Schindelin et al., 2012). For quantification (Fig. 1, B and D) background pixel intensity was subtracted from the mean intensity of the abdomen and divided by the area measured.
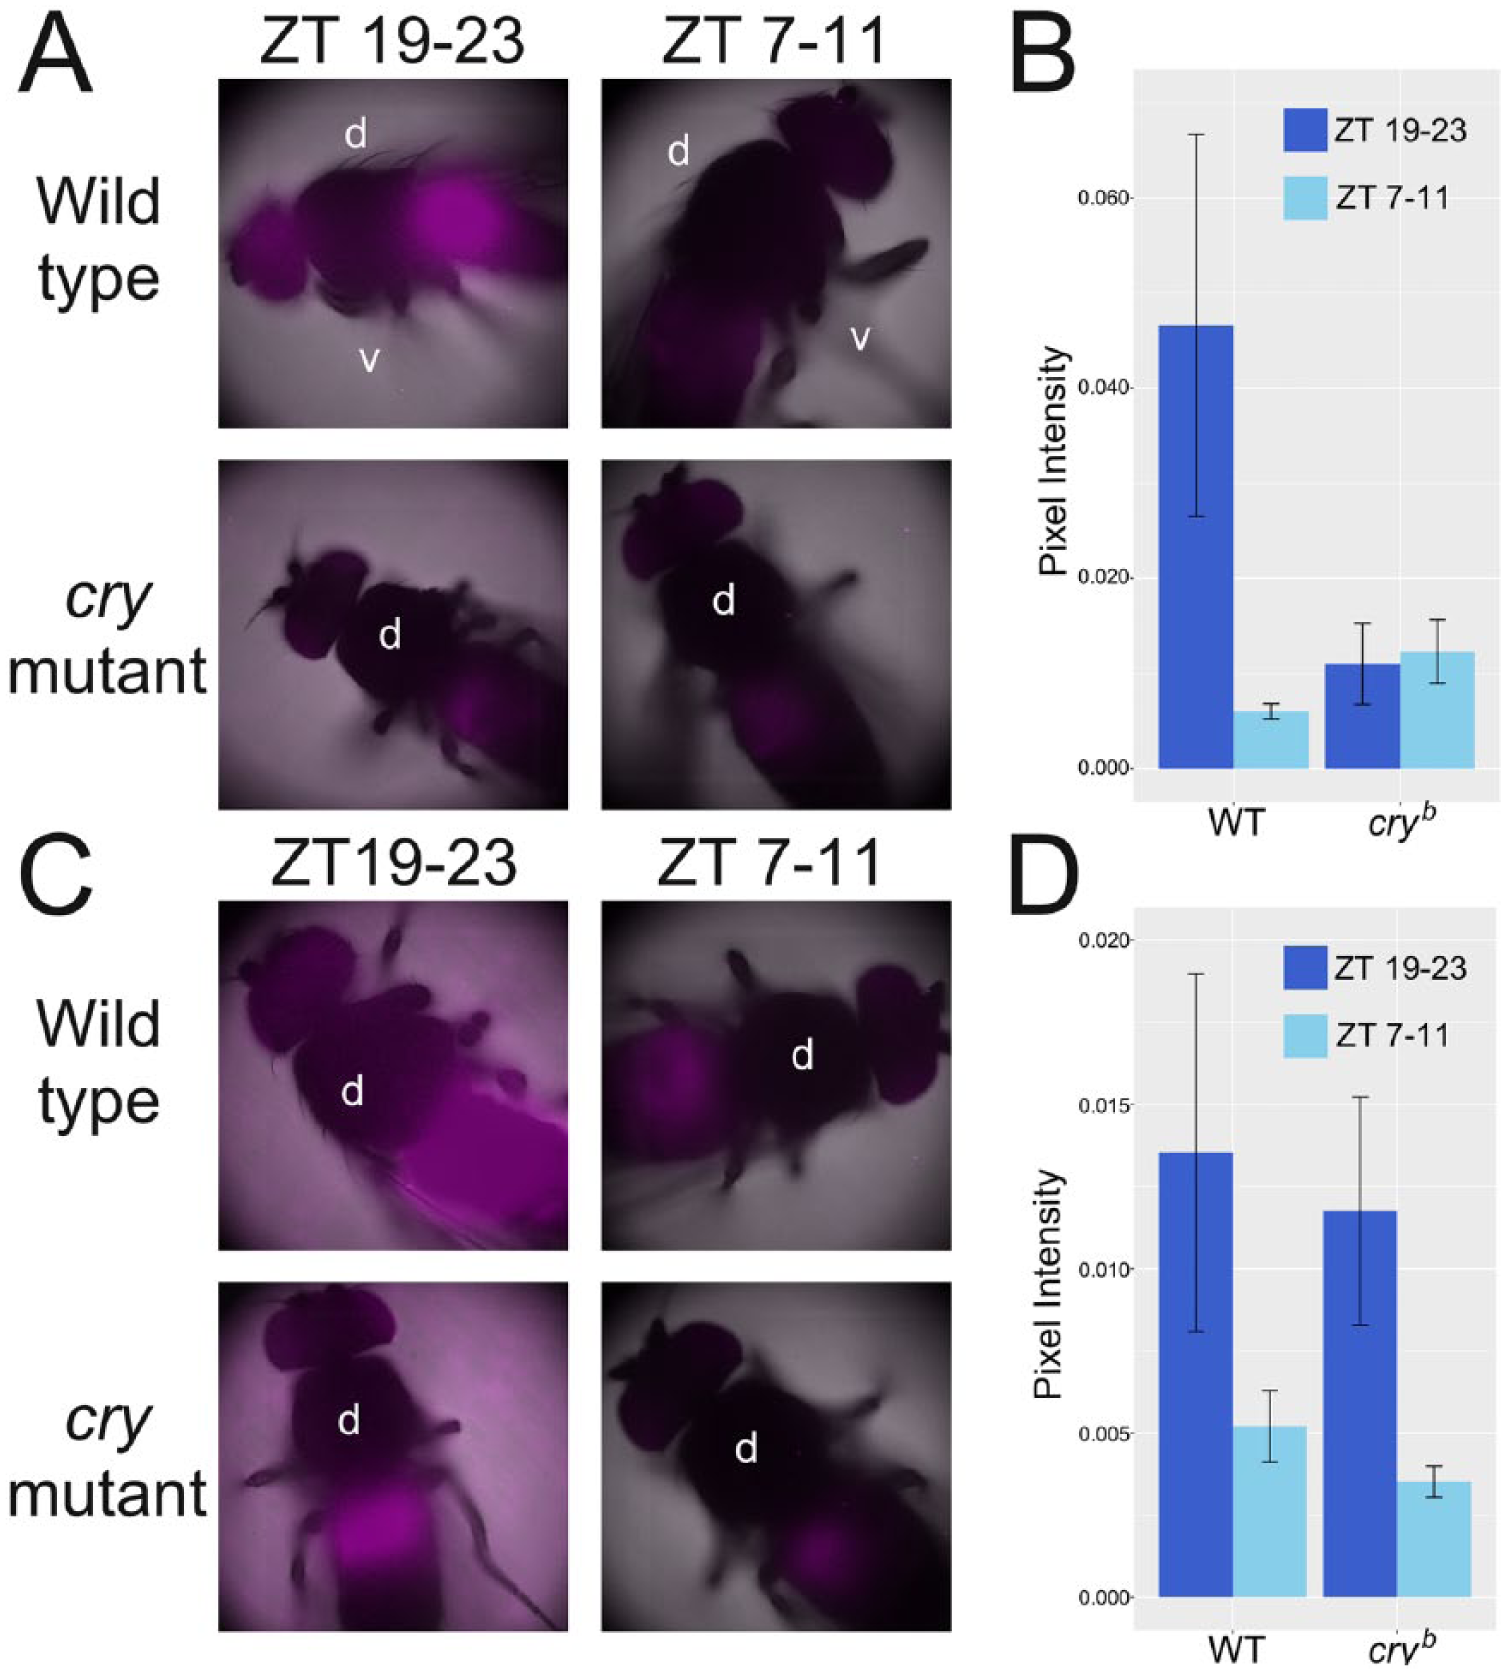
Bioluminescence imaging of XLG-luc transgenic flies. Pseudo-color image of XLG-luc bioluminescence superimposed on a bright-field (black and white) reference image. Male XLG-luc and XLG-luc cryb flies were fed on luciferin-fortified food (15 mM) for 3 days in LD (A, B) or 16:26 °C ramping TC (C, D) conditions and imaged for 10 min with the LV200 Bioluminescence imaging system (Olympus). Images were taken between ZT 19 and ZT 23 and between ZT 7 and ZT 11, reflecting PER peak and trough expression levels, respectively. Panels B and D show quantifications of abdominal bioluminescence intensities for both LD (B) and TC (D) entrainment regimes at the different circadian times indicated. The orientation of the fly is specified by the label “d” (dorsal) and “v” (ventral). Note the main signal sources in the abdomen and eyes. (B) n = 7/n = 8 and n = 4/n = 10 for peak/trough expression in wild-type and cry mutant flies, respectively. (D) n = 10/n = 8 and n = 7/n = 5 for peak/trough expression in wild-type and cry mutant flies, respectively. Error bars indicate SEM.
Bioluminescence Rhythm Acquisition
Bioluminescence assays were performed as previously described (Glaser and Stanewsky, 2005). Three- to 6-day-old male flies were placed in alternate wells of a 96-microtiter plate (48 flies per plate). Each well contained 100 µL luciferin medium (1% agar, 5% sucrose, and 15 mM luciferin; Biosynth, Staad, Switzerland). With a Packard TopCount Multiplate Scintillation Counter (Perkin-Elmer, Waltham, MA) that was placed in a light- and temperature-controllable incubator (Percival), the photon count per second (CPS) emitted from each well was measured every 60 min for 15 sec per well, unless otherwise stated in the text. Flies were exposed to the experimental regime as specified at relevant points in the Results.
If at any point in the experiment individual well emissions decreased to background levels (approximately 50-100 CPS), flies were regarded as dead, and their data were excluded from this point onward.
Bioluminescence Data Analysis
A custom analysis toolbox was developed in MATLAB and R. Raw data were loaded into MATLAB, and bioluminescence signals from living flies were selected. A mean trace of 20 to 40 tim01;XLG-luc1-1 flies lacking a functional clock was subtracted from each individual in the XLG-luc1-1 and XLG-luc1-1 cryb groups to remove components of the bioluminescence signal that were not clock-driven (Suppl. Figs. S1A, S2, and S3). Individual traces were then detrended and normalized as described by Levine et al. (2002a) to have a mean time course equal to 1 and to preserve the appearance of percentage changes for oscillations around the long-term trend line (Suppl. Fig. S2).
Next, individual bioluminescence signals in the XLG-luc1-1 and XLG-luc1-1 cryb groups were quantified to produce an empirical distribution of values, from which the median and 95% confidence intervals were calculated in R. Nonparametric Mann-Whitney U tests were also used for statistical comparisons between genotypes and environmental conditions.
Peak phases were determined by first smoothing individual traces using a low-pass filter to remove noise (threshold = 12 h). The mean peak phase was then measured across multiple days according to ZTT (Suppl. Fig. S2). The amplitude was measured from the smoothed trace as the mean difference between the peak and trough across multiple days (Suppl. Fig. S2). Finally, autocorrelation analysis of the raw signal was used to calculate rhythm strength as the height of the third peak in the correlogram divided by the confidence interval (see Levine et al., 2002a). As the rhythm strength analysis is sensitive to the amount of data provided, exactly 2 days were used for all analyses of this type. Free-running period was estimated as the location of the third peak in the correlogram divided by 2 (see Levine et al., 2002a). A mean average trace, with shaded region showing SEM, was then plotted in R for each genotype (Suppl. Fig. S2).
Separate sections of the experimental regime (described in Results) were quantified as separate experimental regions of interest (ROIs). In this way, data loss resulting from fly death during the experiment affected only subsequent ROIs, leaving previous ROIs intact and thus improving the overall power of our analysis. Note that sample (n) numbers within a genotype accordingly vary between different ROIs during a single experiment.
Results
Spatial Expression Pattern of the XLG-luc Transgene
We studied bioluminescence changes using the XLG-luc transgene. XLG-luc contains the endogenous period promoter, driving the expression of a period-luciferase fusion gene. The XLG-LUC protein is expressed in most, if not all, per-expressing cells (Veleri et al., 2003), including neurons in the fly brain (Veleri et al., 2003) as well as those in the periphery (Glaser and Stanewsky, 2005). However, the construct is widely used as a peripheral clock reporter, since signals from the central clock are expected to be overwhelmed by those from the peripheral per-expressing cells (Glaser and Stanewsky, 2005; Sehadova et al., 2009; Veleri et al., 2003). Evidence for this comes from the fact that rhythmic photon counts in XLG-luc flies are by a factor of ~250-times greater than those observed for an 8.0-luc transgenic line, in which luciferase expression is restricted to central clock cells (Suppl. Fig. S3) (Veleri et al., 2003). Nevertheless, exactly which per-expressing tissues predominantly contribute to the bioluminescence signal of XLG-luc flies is not known.
To visualize the source of the luciferase reporter signal measured in our time series assays, we performed whole-animal bioluminescence imaging on flies that had been reared in circadian light and temperature conditions (Fig. 1). XLG-luc transgenic flies in wild-type and cry mutant background were imaged between ZT 19-23 and ZT 7-11 in LD (Fig. 1A) and naturalistic TC (Fig. 1C), when PER expression is expected to be at peak and trough levels, respectively (Glaser and Stanewsky, 2005) (Suppl. Fig. S1, F and G). Bioluminescence levels varied markedly between time points for wild-type flies in both LD and TC (Fig. 1, B and D, left two columns). However, a similar change in cry mutants was observed only during TC (Fig. 1, B and D, right two columns), consistent with a drastically weakened light input pathway in flies lacking functional CRY (Fig 1) (Glaser and Stanewsky, 2005; Stanewsky et al., 1998). This finding was confirmed in our own bioluminescence time series assays (Suppl. Fig. S1, F and G).
In both genotypes, we saw an overwhelming majority of signal emanating from the abdomen and eyes, consistent with that observed in other per-luc transgenics (Fig. 1, A and C) (Stanewsky et al., 1997). We thus conclude that in vivo assays monitoring bioluminescence changes in XLG-luc reporter lines will be dominated by signals from these peripheral clock components.
Sensory Conflict Generates P-like Behavior under Naturalistic Temperature Cycles
Recent work has shown that a 6-h misalignment between LD and (square-wave-like) TC can disrupt normal circadian locomotor patterns in Canton-S wild-type flies, characterized by a loss of evening anticipation. In place of this, flies display “plateau” (P) behavior, which features a period of sustained high activity, bordered by relative inactivity (Harper et al., 2016) (Fig. 2B). This P behavior is also associated with a breakdown of molecular oscillations in central clock neurons.
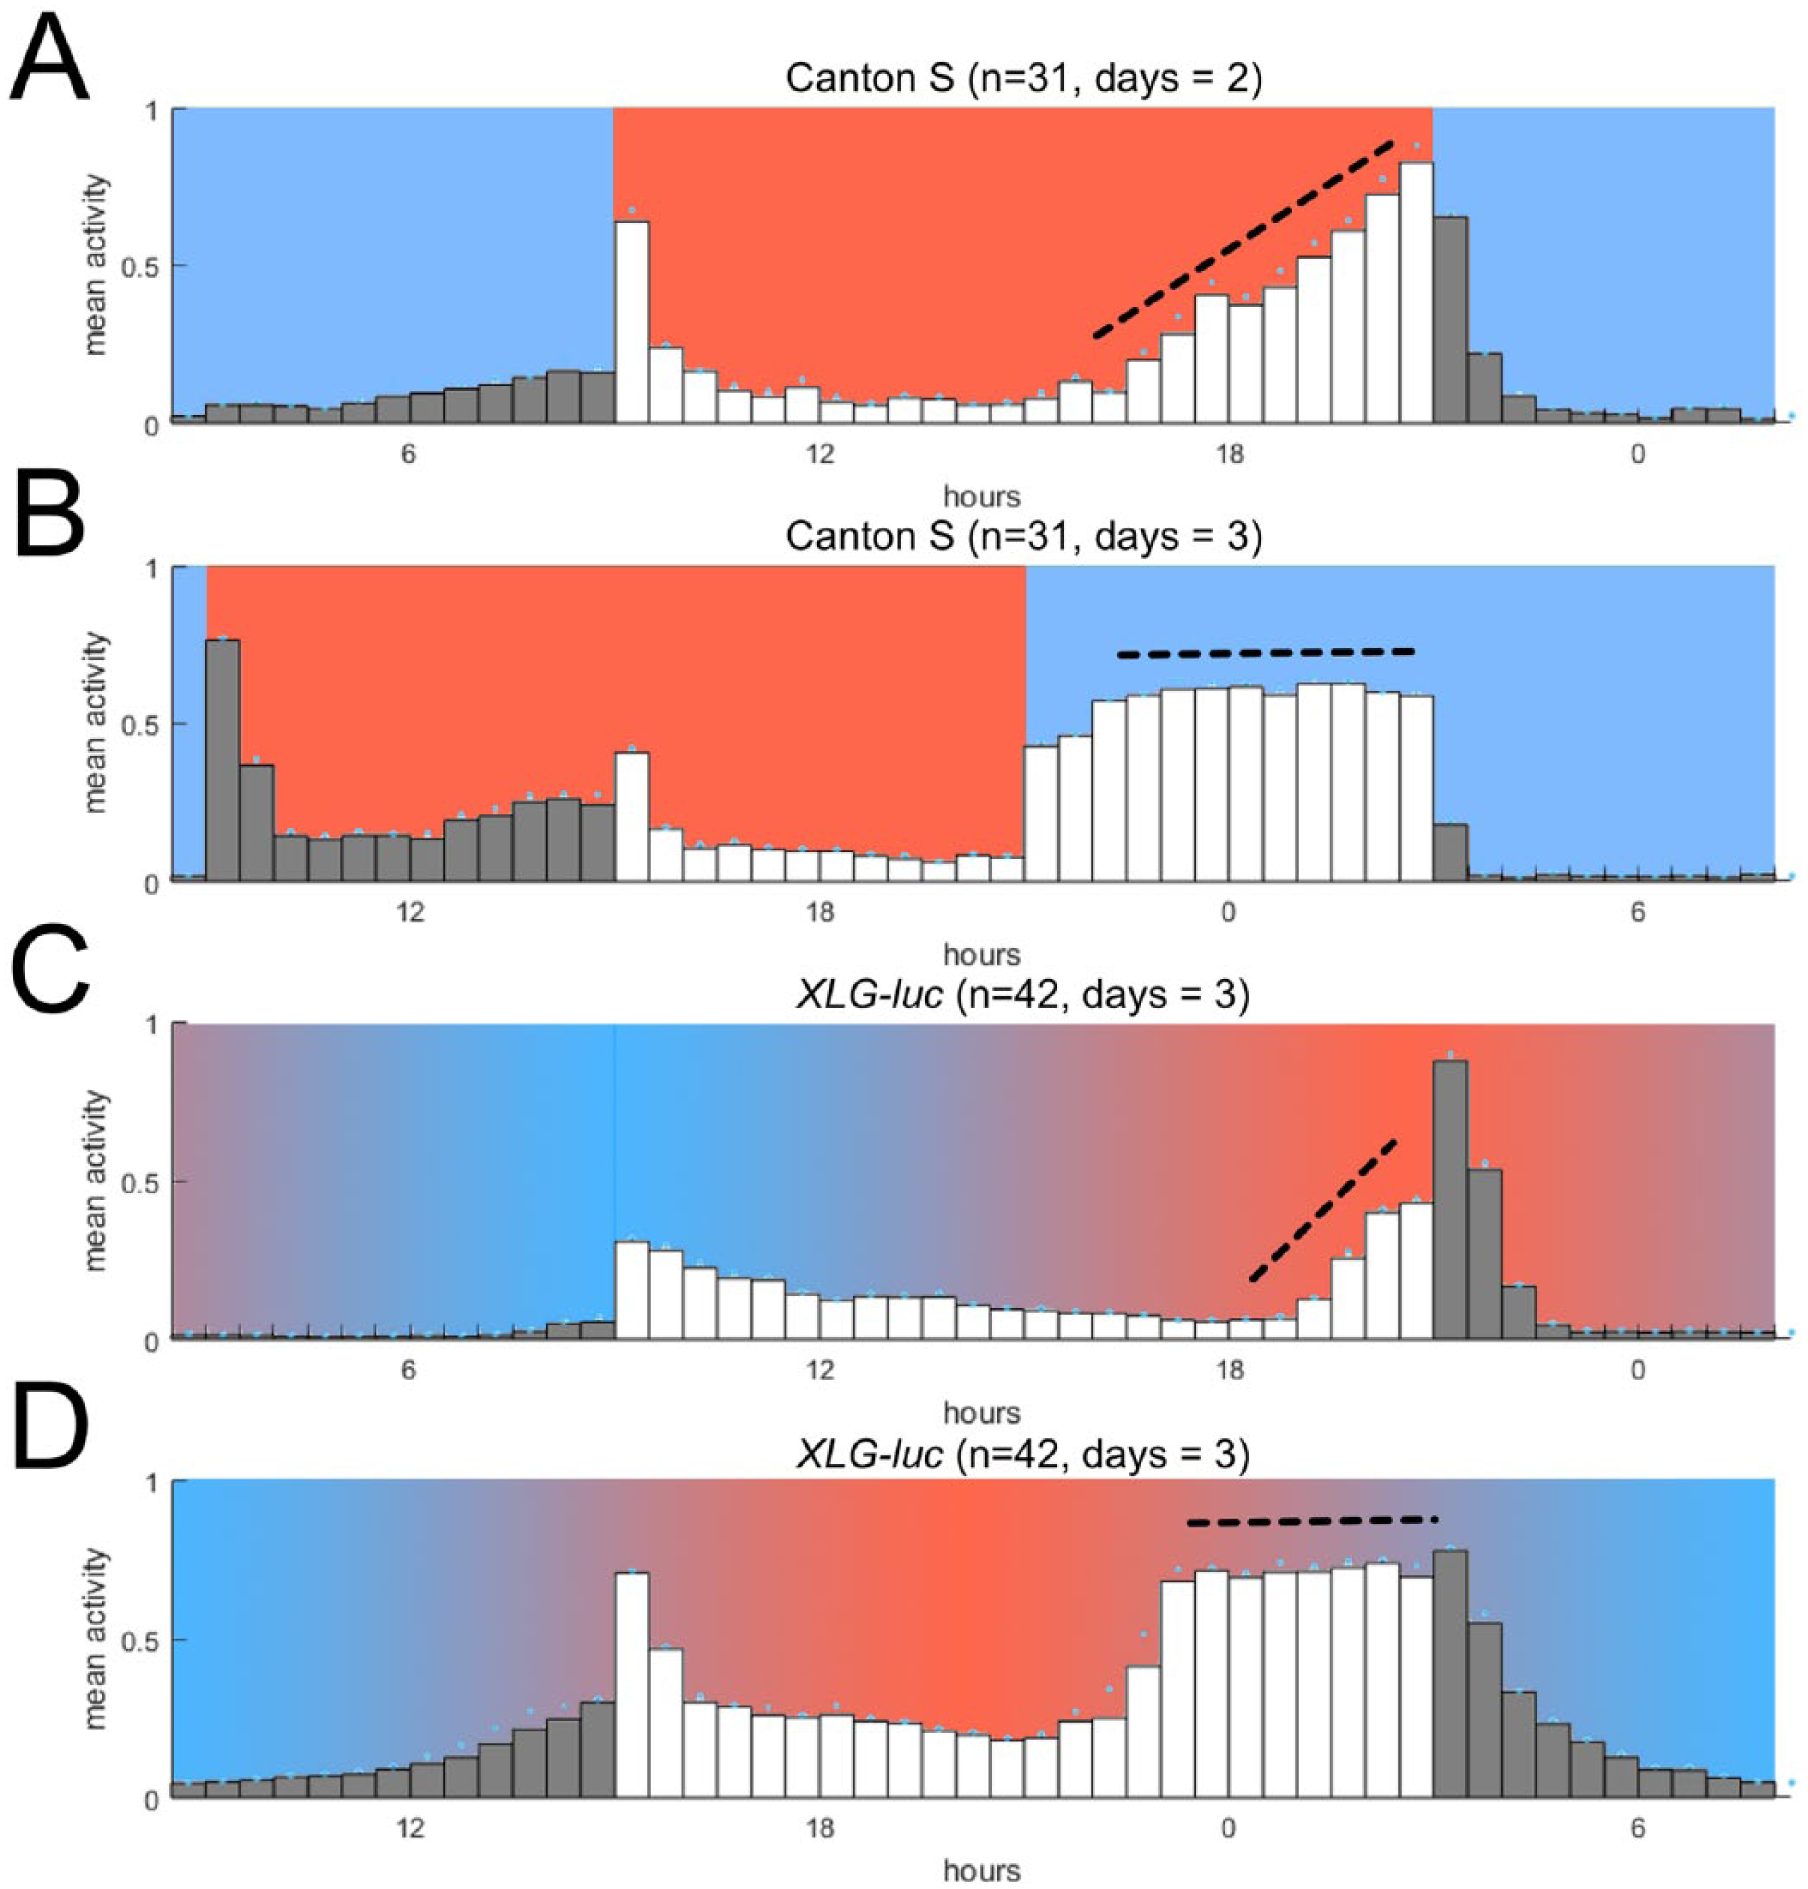
Locomotor behavior during sensory conflict using square-wave and naturalistic TC. (A) Average locomotor activity in aligned LD:TC (lights-on coincides with temperature-on, n = 31). (B) Average locomotor activity in 6-h misaligned LD:TC (lights-on delayed by 6 h relative to temperature-on, n = 31). (C, D) New data in which a naturalistic temperature regime was used to generate sensory conflict. (C) Average locomotor activity in aligned LD:TC (lights-on coincides with the start of temperature increase, n = 42). D) Average locomotor activity in 6-h misaligned LD:TC (LD delayed by 6 h relative to temperature increase, n = 42). Locomotor data for each plot were rescaled in the range of 0 and 1 to facilitate profile comparisons. Mean raw activity across days (total beam breaks per 5 min per fly) was (A) 13.3, (B) 11.8, (C) 10.4, and (D) 17.9. Black dashed lines highlight presence or absence of evening anticipation. Data in A and B adapted from Harper et al. (2016), in which a square-wave temperature regime was used to generate sensory conflict.
We first examined whether P behavior is present in XLG-luc transgenic flies during misaligned LD:TC for temperature cycles that are naturalistic. We administered an environmental regime comprising aligned LD:TC (ΔtL,T = 0) for 3 days, followed by incremental 2-h delays of LD (ΔtL,T = 2, ΔtL,T = 4) to generate what is ultimately a 6-h misalignment (ΔtL,T = 6) for 3 days. Here, Δt is the absolute distance, in hours between the onset-offset of 2 cyclic 12:12 signals (see Methods). During aligned LD:TC, XLG-luc flies displayed a characteristic bimodal profile of activity, with evening anticipation and a peak coinciding with the end of photo/thermo-phase (Fig. 2C). During 6-h misaligned LD:TC, XLG-luc locomotor activity displayed P behavior as observed previously (Harper et al., 2016) (Fig. 2, B and D), forming a broad, flat bout of activity between lights-off and the beginning of decreasing temperature.
As expected, there were some differences in the behavioral pattern between misaligned LD:TC using naturalistic TC compared with that using rectangular TC. XLG-luc flies did not exhibit the sharp activity increases at the beginning of the warm phase, nor did they show a rapid decrease in activity after lights-off (compare Fig. 2, B and D). Instead they showed a smoother activity increase during the increasing temperature phase, punctuated by the lights-on transition, and a similarly smooth activity decrease during the decreasing temperature phase after lights-off (Fig. 2D). We attribute these minor differences to the fact that we applied naturalistic temperature cycles (cf. Yoshii et al., 2009). Importantly, however, we did observe P behavior during misaligned naturalistic TC and LD conditions, demonstrating that the clock’s behavioral output during sensory conflict is broadly similar between rectangular and naturalistic entrainment conditions.
Light Dominates Peripheral Clock Entrainment in Wild-type Flies
We next sought to investigate the response of the peripheral clock system during the P behavior induced under our conflicting 6-h phase-shifted LD:TC. We first assessed the stability of peripheral endogenous rhythms in free-running conditions (DD:26 °C) after entrainment to aligned and misaligned LD:TC (Fig. 3, A and B). To investigate potentially richer forms of conflict, we conducted further experiments in which the period of free-running conditions was then followed by either aligned or misaligned LD:TC (Fig. 3C; Suppl. Fig. S1, D and E). These experiments were performed in XLG-luc flies in both wild-type and cryb mutant genetic backgrounds.
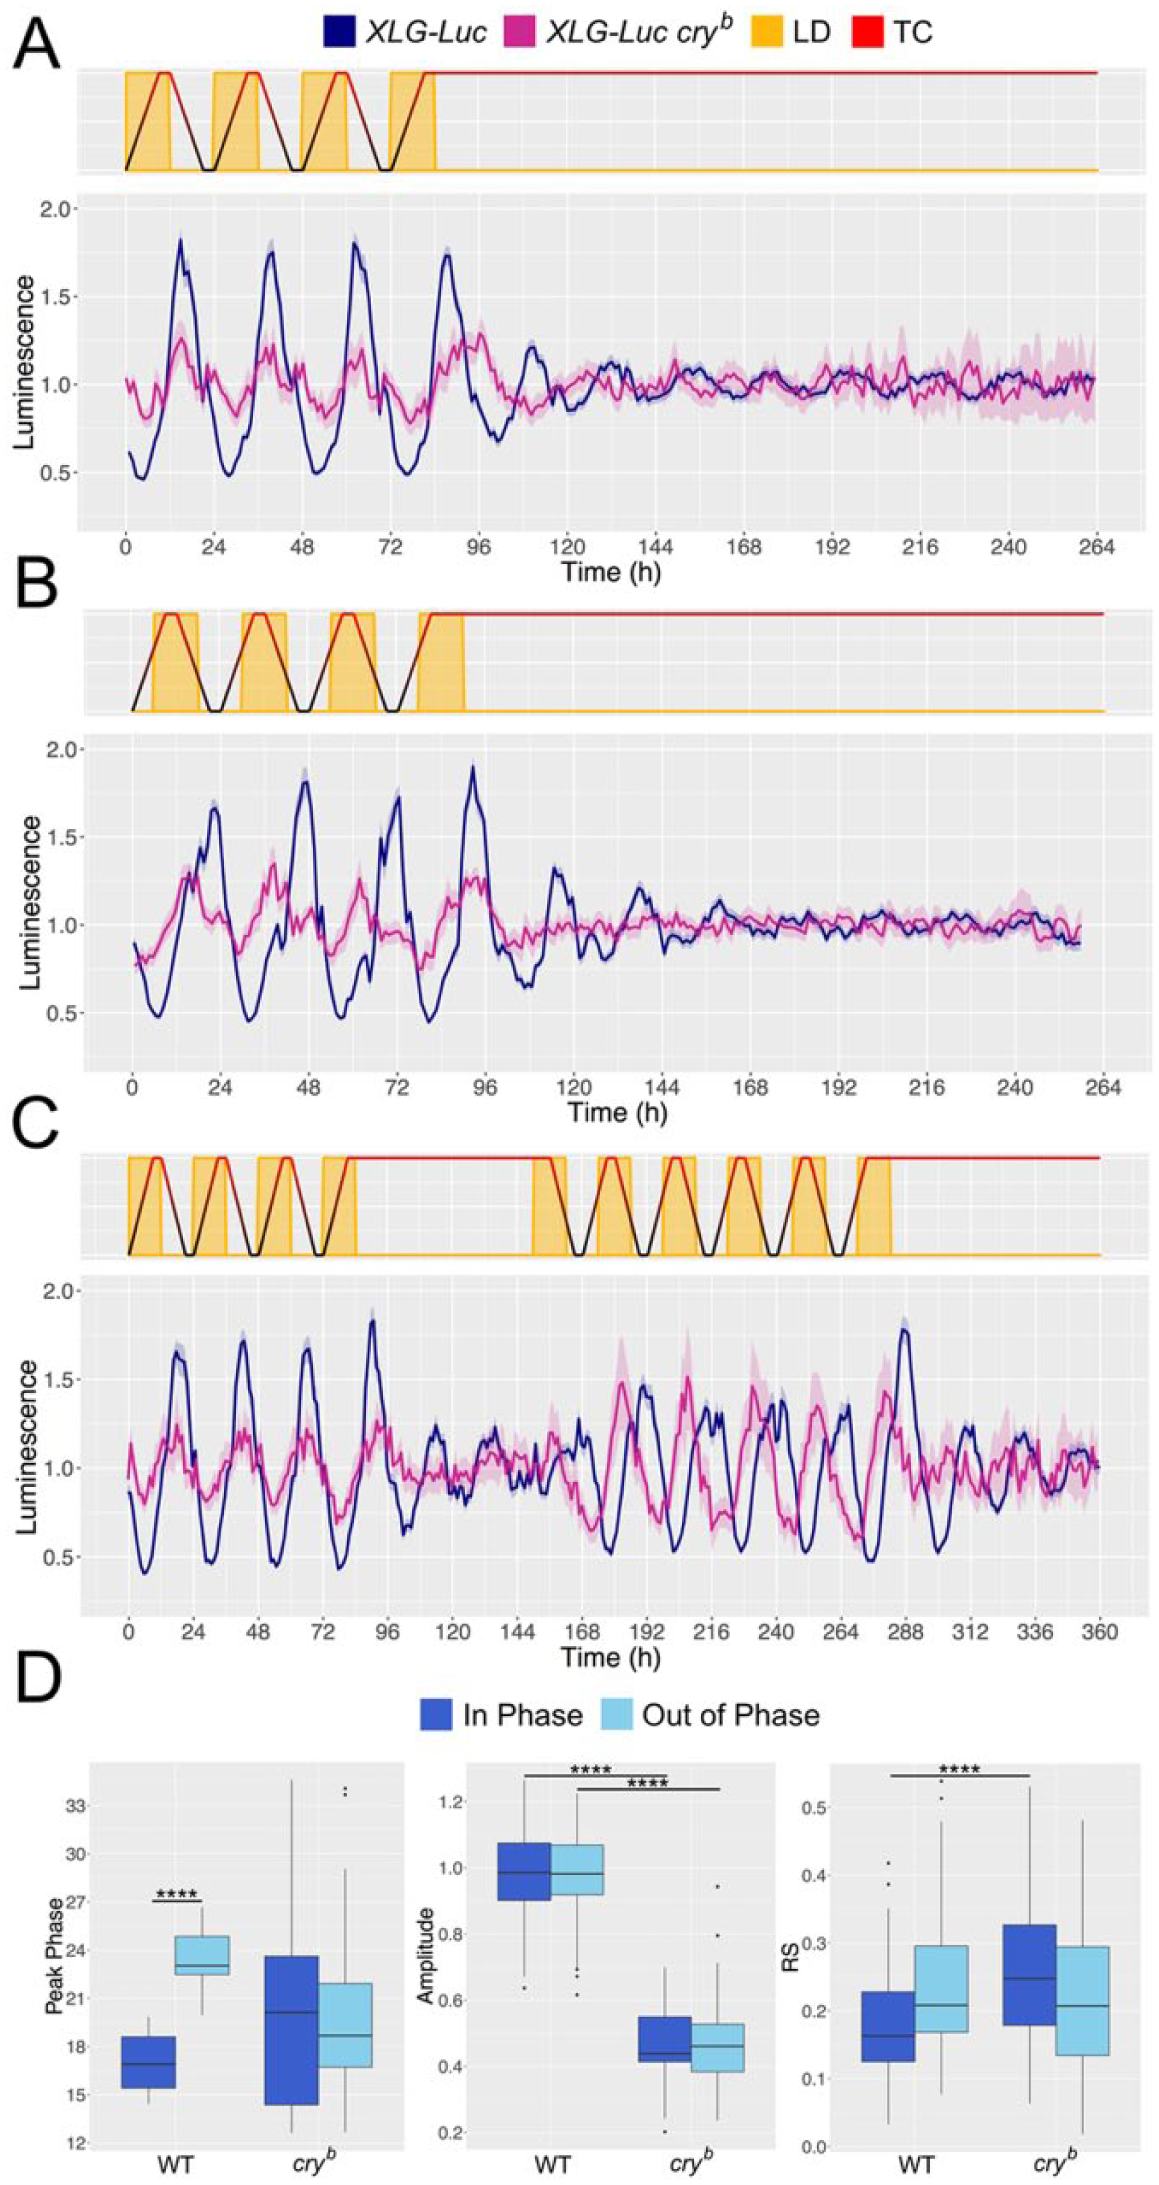
Bioluminescence recordings. Dark blue and magenta lines show mean average of XLG-luc and XLG-luc cryb flies, respectively. Shaded regions show SEM. (A) Experimental regime in which environmental conditions followed 4 days of LD:TC in phase and 7 days of free run in DD at 26 °C (n = 43-46 and n = 15-30 for wild-type and cry mutants, respectively). (B) Experimental regime in which environmental conditions followed 4 days of misaligned LD:TC and 7 days of free run in DD at 26 °C (n = 47-48 and n = 28-35). (C) Experimental regime in which environmental conditions followed 4 days of LD:TC in phase, 2 days of free run in DD at 26 °C, 6 days of misaligned LD:TC via 6-h delay of LD, and 3 days of free run at DD and 26 °C (n = 37-44 and n = 7-14 for wild-type and cry mutants, respectively). All bioluminescence readings recorded at a resolution of 1 h. (D) Quantification of bioluminescence signal peak phase (left), amplitude (middle), and rhythmicity (right) during aligned and misaligned LD:TC. Analysis of the aligned condition used adult flies taken from the last full 2 days of aligned LD:TC (Fig. 3, A and C) (n = 80 and n = 22 for wild-type and cry mutants, respectively). Analysis of the misaligned condition used flies taken from the last full 2 days of misaligned LD:TC (Fig. 3B and Suppl. Fig. S1D) (n = 91 and n = 47 for wild-type and cry mutants, respectively). Box plots show first, second, and third quartiles of the data, with the upper and lower whiskers extending to ±IQR from the third and first quartiles, respectively. Data points beyond the whiskers are plotted as outliers. Mann-Whitney U test used to compare between condition and genotype (****p < 0.00001).
During aligned conditions, both wild-type and cryb flies displayed rhythms of bioluminescence, peaking during the night (as defined by both light and temperature) (Fig. 3, A and C; Fig. 3D left; Suppl. Fig. S1, D and E). This observation agrees with previously reported PER protein oscillations in wild-type flies during unimodal LD and TC entrainment (Glaser and Stanewsky, 2005) and also agrees with our own observations (Suppl. Fig. S1, F and G). During 6-h delay of LD relative to TC, peak bioluminescence in wild-type flies was also delayed by approximately 6 h (Fig. 3, B, C, and D left; Suppl. Fig. S1, D and E). However, a similar shift was not observed in the cryb background, which instead showed no change in peak phase (Fig. 3, B, C, and D left; Suppl. Fig. S1, D and E). Together, these results indicate that peripheral PER rhythms in wild-type flies entrain preferentially to light during conflicting LD:TC, whereas cryb flies entrain preferentially to temperature. This directly contrasts results obtained in the central clock of the fly brain.
Strikingly, no significant effect of misaligned LD:TC was observed on the amplitude or rhythmicity in either wild-type or cry mutant flies when pooling across experiments (Fig. 3D, middle and right). This again contrasts with findings in the central clock neurons of wild-type flies under similar environmental conflicts, in which the amplitude of PER oscillations was severely dampened during misaligned conditions (Harper et al., 2016). In fact, the amplitude of peripheral clock bioluminescence rhythms was consistently larger in wild-type flies compared with cryb mutants (Fig. 3D, middle), contrasting with observations made during conflict in the central clock neurons. Because we did observe a comparable degree of P behavior, suggesting a similar breakdown of PER oscillations in the central clock neurons as described previously (Fig. 2, B and D) (Harper et al., 2016), we conclude that peripheral molecular clocks do not collapse during 6-h misalignment of LD and TC but rather synchronize to the light cue. In contrast, removal of CRY has similar consequences for both central and peripheral oscillators, rendering them preferentially sensitive to temperature cycles.
During free-running conditions, cry-negative flies became arrhythmic, consistent with the reported role of Cryptochrome in the core clock machinery of peripheral clocks (Collins et al., 2006). The cry-positive flies, in contrast, continued to show bioluminescence rhythms after both aligned and misaligned conditions. These free-running rhythms then gradually dampened with time (Fig. 3, A-C; Suppl. Fig. S1, D and E), consistent with previous studies in XLG-luc (Veleri et al., 2003). Median free-running period of wild-type flies after aligned and misaligned LD:TC was 21.5 h and 22.0 h, respectively, with no significant difference observed between entrainment conditions. This suggests no lasting effect of sensory conflict on peripheral clock rhythms. An equivalent analysis for cry mutant flies was made impossible by the complete lack of free-running rhythmicity.
Discussion
Sensory entrainment of circadian systems is a multimodal problem. We used a per-luciferase transgenic reporter to study the combination of light and temperature zeitgebers in peripheral clocks of Drosophila. We showed that the responses of peripheral clocks during conflicting entrainment conditions differ markedly from those of the central clock, further highlighting the diversity within the wider circadian system.
Disruptions of locomotor behavior in wild-type flies (leading to P behavior) have been shown to result from a 6-h delay of LD relative to square-wave-like TC (Harper et al., 2016). We here report that evening locomotor behavior is also altered during equivalent misalignments under more naturalistic temperature fluctuations. Indeed, the activity profile that results from a more naturalistic form of sensory conflict (using ramped TC) closely mimics the previously reported P behavior, displaying a similar breakdown of evening anticipation, yet without the abrupt changes in activity observed previously at the end of thermo-phase and photo-phase. While conflict between light and temperature caused behavioral disruptions in XLG-luc control flies, we did not see an associated disruption of molecular cycling in the peripheral clocks using an XLG-luc reporter assay: A 6-h misaligned LD:TC results in an equivalent phase shift of PER rhythms (i.e., peripheral clock rhythms remain synchronized to the light stimulus).
In further contrast to the central clock, the amplitude of PER oscillations is not significantly changed between aligned and misaligned conditions. Taken together, this strongly suggests that during sensory conflict, peripheral clocks in flies entrain preferentially, perhaps exclusively, to light. Peripheral clocks thus exhibit a separate, and distinct, response to sensory conflict compared with that observed in the central clock neurons. Future work would benefit from an investigation into how this response is affected by varying environmental phase relationships.
One outstanding question, for example, is whether the peripheral clock has no effect on locomotor behavior at all. Indeed, our own finding that peripheral PER rhythms in control flies display no change during sensory conflict other than shifting their phase with the light cue might indicate that the circadian anomalies observed during sensory conflict result purely from disruptions of the central clock. However, an alternative explanation could be that the P-like behavior we have observed emerges from a discrepancy between the peripheral and central clock networks. If peripheral clocks do contribute to locomotor behavior, then activity under sensory conflict will necessarily be driven by 2 out-of-sync circadian networks. A potential route for future research would be to use the kinases Doubletime and Shaggy to generate period discrepancies between peripheral and central clocks, as was used previously to assess autonomy between neuronal subgroups within the central clock network (Yao and Shafer, 2014). Another option would be to simultaneously measure peripheral clock bioluminescence and activity in individual flies and investigate any subtle correlations therein (Guo et al., 2016; Khabirova et al., 2016).
Our bioluminescence imaging data show that XLG-luc—a previously used transgenic reporter line—is expressed primarily in the eyes and abdomen. Thus, our findings predominantly relate to peripheral clocks located in these body parts. The peripheral circadian system, however, exhibits much heterogeneity, specifically with regard to the degree of independence from the central clock (Ito and Tomioka, 2016). It is not yet clear how our findings translate to other areas in the wider peripheral network. A similar rationale could be applied to the role of Cryptochrome in peripheral clocks. In this study, we show that light dominance in the periphery depends on cry expression. Whether the cry dependence of this light dominance reflects a cry dependence within the peripheral clock itself or elsewhere in the circadian system, however, remains unclear.
The question of why the peripheral clock network might respond differently to sensory conflict, when compared with the central clock, remains unclear. The central clock is a highly interconnected network with strong coupling through the action of pigment-dispersing factor (PDF) (e.g., Lin et al., 2004). Thus, a dissociation between oscillatory components, resulting from sensory conflict, is a potential cause for the disruptions observed. Less is known about connectivity in the peripheral clock system. The resilience of these oscillators to sensory conflict may therefore hint at a more independent network architecture, with less coupling between subparts. This theory lends itself to modeling approaches; weakly coupled oscillator theory, for example, might provide a useful framework to infer coupling strengths and guide experimentation. Equally, from a more Bayesian perspective, we might ask why the central clock does not appear to coordinate peripheral gut and eye clocks during conflict. Perhaps an uncertainty in central clock oscillations, reflected in their reduced amplitude, is projected to the periphery in the form of a low precision signal, thus leading to more autonomous behavior in these peripheral clocks. Such hypotheses could explain aspects of the heterogeneity observed throughout the wider clock network. We anticipate the benefits to come from embracing these mathematical viewpoints, alongside more holistic experimental studies of circadian systems in multisensory environments.
Footnotes
Acknowledgements
We thank David Whitmore for permitting the use of his bioluminescent microscope and Mechthild Rosing for experimental support. We thank Jason Somers for continued scientific discussions, and we express our deep gratitude to Andrew Millar, who generously donated 2 bioluminescence setups to the lab of J.T.A., which have also contributed to this study. R.E.F.H. received funding from the Engineering and Physical Sciences Research Council (EP/F500351/1). This work was further supported by a grant from the European Research Council to J.T.A. (H2020-ERC-2014-CoG/648709/Clock Mechanics), a grant from the BBSRC to R.S. (BB/J018589/2), and a grant from the Gatsby Charitable Foundation to P.D.
Author Contributions
R.E.F.H. and R.S. conducted the bioluminescence assays. R.E.F.H. conducted the behavioral assays, analyzed the data, and developed the bioluminescence data analysis toolbox. M.O. performed the bioluminescence imaging. R.E.F.H., R.S., P.D., and J.T.A. designed the experiments and prepared the manuscript.
Conflict of Interest Statement
The author(s) have no potential conflicts of interest with respect to the research, authorship, and/or publication of this article.
Notes
References
Supplementary Material
Please find the following supplemental material available below.
For Open Access articles published under a Creative Commons License, all supplemental material carries the same license as the article it is associated with.
For non-Open Access articles published, all supplemental material carries a non-exclusive license, and permission requests for re-use of supplemental material or any part of supplemental material shall be sent directly to the copyright owner as specified in the copyright notice associated with the article.