
Abstract
Uncontrollable stress is linked to the development of many diseases, some of which are associated with disrupted daily rhythms in physiology and behavior. While available data indicate that the master circadian pacemaker in the suprachiasmatic nucleus (SCN) is unaffected by stress, accumulating evidence suggest that circadian oscillators in peripheral tissues and organs can be shifted by a variety of stressors and stress hormones. In the present study, we examined effects of acute and chronic social defeat stress in mice and addressed the question of whether effects of uncontrollable stress on peripheral clocks are tissue specific and depend on time of day of stress exposure. We used mice that carry a luciferase reporter gene fused to the circadian clock gene Period2 (PER2::LUC) to examine daily rhythms of PER2 expression in various peripheral tissues. Mice were exposed to social defeat stress in the early (ZT13-14) or late (ZT21-22) dark phase, either once (acute stress) or repeatedly on 10 consecutive days (chronic stress). One hour after the last stressor, tissue samples from liver, lung, kidney, and white adipose tissue (WAT) were collected. Social defeat stress caused a phase delay of several hours in the rhythm of PER2 expression in lung and kidney, but this delay was stronger after chronic than after acute stress. Moreover, shifts only occurred after stress in the late dark phase, not in the early dark phase. PER2 rhythms in liver and WAT were not significantly shifted by social defeat, suggesting a different response of various peripheral clocks to stress. This study indicates that uncontrollable social defeat stress is capable of shifting peripheral clocks in a time of day dependent and tissue specific manner. These shifts in peripheral clocks were smaller or absent after a single stress exposure and may therefore be the consequence of a cumulative chronic stress effect.
Keywords
In mammals, circadian clocks are present in almost all tissues and organs (Yoo et al., 2004; Dibner et al., 2010). In this constellation of endogenous oscillators, the SCN of the anterior hypothalamus is often considered to be the pacemaker or master clock. The SCN directly drives many rhythms in behavior and physiology, including the rest/activity cycle, feeding/fasting rhythm, body temperature oscillation, and the rhythmic release of various hormones (Dibner et al., 2010; Schibler et al., 2015). In addition, through a variety of neuronal and hormonal signals, the SCN coordinates and synchronizes the clocks and rhythms in other tissues and organs. Via the retina and retinohypothalamic tract, the phase of SCN is reset daily by the environmental light-dark (LD) cycle. The SCN thus coordinates the internal rhythms of various organs and tissues and also keeps them in pace with the external geophysical time (Dibner et al., 2010; Buijs et al., 2013; Schibler et al., 2015).
Disruption of circadian organization and disturbance of the relationship between the various fine-tuned rhythms in the body is thought to be an important factor in the development of diseases (Takahashi et al., 2008; Bass and Lazar, 2016; Roenneberg and Merrow, 2016). One potential cause for a disturbance in circadian rhythmicity might be stress (Meerlo et al., 2002; Ota et al., 2021). Stress-related disorders, such as mood or anxiety disorders, are often associated with abnormalities in the sleep/wake cycles, body temperature patterns, and circulating hormone levels (Meerlo et al., 2002; Ota et al., 2021). Collectively, the literature suggests that, although the circadian pacemaker in the SCN is well-protected against effects of stress, peripheral clocks can be shifted in response to a variety of stressors and stress hormones (Ota et al., 2021). Indeed, our earlier studies in rats and mice show that the period and phase of the SCN or rhythms driven by the SCN are unaffected, even by severe social defeat stress (Meerlo et al., 1997; Meerlo and Daan, 1998; Ota et al., 2018, 2020). However, several recent publications show that uncontrollable stressors, such as defeat or restraint, can phase shift rhythms in clock gene expression in various tissues such as liver, kidney, pituitary, and adrenals (Bartlang et al., 2014; Razzoli et al., 2014; Tahara et al., 2015; Ota et al., 2020). One explanation for this difference in stress susceptibility between SCN and other body clocks may be that glucocorticoid receptors (GRs) are present in most peripheral tissues but are absent in the adult SCN (Morimoto et al., 1996; Balsalobre et al., 2000).
While stress and stress hormones can exert potent effects on peripheral clocks, these effects appear to be partly tissue-specific and time-of-day dependent (Bartlang et al., 2014; Tahara et al., 2015). Phase advances of clock gene expression in peripheral tissues were reported after stress exposure during the light phase or resting phase in nocturnal rodents and phase delays after stress in the late dark phase or activity phase in nocturnal rodents(Ota et al., 2021). However, one unanswered question is whether peripheral clocks are differently affected by acute or chronic stress. Most studies that reported shifts in peripheral clocks were based on repeated or chronic stress exposure stress (Bartlang et al., 2014; Razzoli et al., 2014; Ota et al., 2020). While a number of studies suggest that a single injection or repeated injections of glucocorticoids can shift peripheral clocks (Balsalobre et al., 2000; Pezuk et al., 2012; Kamagata et al., 2017; Wu and Fu, 2017), no studies have directly compared the effects of single stress exposure with repeated or chronic stressors. It is possible that chronic stress has cumulative effects that are not seen after a single stress exposure. In fact, acute stress and chronic stress can even have contrasting effects on physiological functions (Yaribeygi et al., 2017). Moreover, it might be that acute and chronic stress have different effects that are dependent on the time of stress exposure and the specific tissue under study.
In the present study, we are building on our previous work with social defeat stress to address the questions of whether peripheral clocks are differently affected by acute and chronic stress and whether this is time-of-day dependent and tissue specific. To answer these questions, we used transgenic PERIOD2::LUCIFERASE (PER2::LUC) mice, which produce a PER2::LUC fusion protein that allows for prolonged and continuous tracking of PER2 expression by means of measurement of luciferase-driven bioluminescence (Yoo et al., 2004; Yamazaki and Takahashi, 2005; Ota et al., 2020). Adult male mice were subjected to acute (single) or chronic (10 day) social defeat stress either in the early or the late dark phase. On the last day of stress, mice were sacrificed and peripheral tissues (liver, lung, white adipose tissue, kidney) were collected for ex vivo assessment of PER2 rhythms.
Materials and Methods
Animals and Housing
Adult 2- to 6-month-old male PER2::LUC knock-in mice with a C57BL/6 background from our own breeding colony were used as experimental animals. The animals were individually housed in cages with a running wheel and allowed to acclimate for 2 weeks before the start of the experiment. Male CD-1 mice (4-8 months of age, Charles River, Sulzfeld, Germany) were used as aggressors for the social defeat stress and were housed on the same LD as the defeated animals. These CD-1 mice were individually housed in a different room, where social defeats took place. All mice were housed under a 12 h:12 h LD cycle with ambient temperature kept at 21°C ± 1°C and relative humidity at 50% ± 2%. Food and water were provided ad libitum. The experiments were conducted in accordance with the Dutch rules and regulations and approved by the Central Authority for Scientific Procedures on Animals (CCD, license number: AVD1050020198665).
Experimental Design
Different groups of mice were exposed to social defeat stress, either once or 10 times on consecutive days (acute and chronic stress, respectively), and either in the early dark phase (EDP) or late dark phase (LDP) (Zeitgeber time [ZT] 13-14 and 21-22, respectively). This resulted in four stress treated groups (acute stress EDP, acute stress LDP, chronic stress EDP, and chronic stress LDP) and their four control groups. All stress and control groups were matched for age. Running wheel rotations were recorded prior to the experiment to confirm stable daily rhythms and to assess effects of chronic social defeat stress. We also assessed effects of chronic stress on food, water and body mass. One hour after the last stressor, mice were sacrificed and trunk blood was collected for corticosterone (CORT) analysis and samples of other tissues were collected for culturing and measurement of PER2::LUC rhythms.
Social Defeat Stress
Social defeats took place in the home cage of the CD-1 aggressors mice, which were housed in a different room than the experimental mice. The LD cycle in the room of the aggressors was similar to that in the home room of the experimental mice. The cages of the aggressors measured 35 cm x 30 cm x 30 cm (L*W*H), with a separation compartment of 10 cm x 30 cm x 30 cm (L*W*H). Transport of the experimental mice and social defeat procedures took place under dim red-light conditions (<9 lux), similar to the red light illuminating the home room during the dark phase. The social defeat protocol was the same as used in our previous studies (Ota et al., 2018, 2020). Briefly, each social defeat session had a total duration of 20 min, divided in 3 phases. Phase 1 (5 min) was the initiation phase and separated by a perforated acrylic wall, only allowing olfactory and visual contact. Phase 2 (10 min) was the actual phase of physical interaction and defeat. If during this phase, the intruder received more than 10 attacks in less than 10 min, the animals were separated and the remaining time was added to Phase 3. In Phase 3 (5 min), the mice were separated by the perforated divider again.
At the end of the procedure, experimental animals were returned to their home cage. Social defeated animals were exposed to a new aggressor each day to avoid habituation. Every day when the mice in the chronic social defeat group were exposed to the stress protocol, the associated control mice were gently picked up and handled for body weight measurement, and their bedding was disturbed. The acute control mice were left undisturbed.
Food, Water, and Body Weight
In the chronic stress groups and the respective controls, body weights, food intake, and water consumption were measured each day of the chronic stress protocol. Body weight gain over stress days was calculated by subtracting the body weight of stress day one from that of the day in question. Food and water intake were calculated by subtracting the weight of food or water from those of the previous day, respectively.
Running Wheel Activity
Running wheel rotations were recorded and stored in 2 min bins by an automated computer system (Circadian Activity Monitor System [CAMS], designed by Cooper, INSERM U486; Ota et al., 2018). Data were extracted with Actoview (version 4.0) and further exported to Excel for calculation of daily and hourly activity counts (Mulder et al., 2013; Ota et al., 2018). In the mice exposed to chronic stress and the corresponding control groups, wheel rotations were analyzed for two time-blocks consisting of 7 baseline days and 10 stress days, respectively. Since each social defeat stress resulted in 20 min of missing activity data, we removed a similar 20 min episode of running wheel rotations in the recordings of the corresponding control animals.
Plasma Corticosterone
One hour after the last defeat, mice were euthanized under dim red light by cervical dislocation followed by decapitation. Trunk blood was collected in EDTA-coated tubes (Sarstedt, Numbrecht, Germany), placed on ice, and centrifuged at 4°C (RPM = 14,S000, 10 min) to obtain plasma which was stored at -20°C. Plasma CORT was determined by radioimmunoassay using an ImmuChem Double Antibody 125I RIA kit (intra-assay coefficient of variation 7%; lower and upper levels of detectability 5 and 1000 ng/ml; MP Biomedicals, LLC, USA).
Tissue Culturing and Measurement of PER2 Rhythms
The procedures for tissue preparation and in vitro measurement of PER2 expression were similar to a previously described procedure, with minor adaptations (Yamazaki and Takahashi, 2005; Ota et al., 2020). In brief, after decapitation and blood collection, the head and body of the mouse was placed on ice for transportation to the culture room where dissection and collection of peripheral tissues was done in the light. Samples were taken from WAT, lung, liver, kidney cortex and kidney medulla. Tissues were first placed in a plate (60 x 15 mm, Greiner bio-one) with chilled cutting medium and further dissected into smaller pieces (1-9 mm3) by disposable scalpels under a long working distance microscope. These pieces of tissues were then placed in separate dishes (35 mm x 10 mm, Greiner bio-one) with pre-warmed recording medium. The cutting and recording medium used in the present study was the same as published standards (Yamazaki and Takahashi, 2005; Ota et al., 2020). Finally, the dishes were sealed by grease (Molykote® 111 Compound) and cover glasses (40 mm in diameter, thickness No.1, VWR) and placed in a LumiCycle photon top counter machine for 5 to 7 days for ex vivo culturing (~37°C) and PER2 rhythms recording (Yoo et al., 2004).
Bioluminescence data were processed and analyzed with LumiCycle software (Version 3.002; Actimetrics Inc., Evanston, IL). The first 12 h of data in culture were excluded because the tissue bioluminescence during this period may exhibit fluctuations due to dissection and culture medium exposure (Stokkan et al., 2001; Bartlang et al., 2014; Ota et al., 2020). Bioluminescence rhythm data were detrended by subtracting a centered 24 h running mean (RM) from each data point. As a result, the first and last 12 h data had to be deleted since no 24 h RM data can be calculated over these time windows. The final range of detrended data used for analysis was 24 to 96 h after the start of bioluminescence recording. This detrended data were further processed by fitting a dampened LM sin fit curve in the LumiCycle software. Onset1 (defined as the first positive crossing through 0 in the selected time range, Figure 3a) was selected as the phase marker and only the samples with a “goodness of fit” value greater than 70% were selected for further analysis.
As we used different 12 h:12 h LD cycle timing between the early dark phase experiment (light on/off: 20:00/8:00) and late dark phase experiment (light on/off: 13:00/01:00), phase value (onset1) was normalized as hours relative to respective ZT0.
Statistics
Body weight, food intake and water consumption were subjected to repeated measures ANOVA with between-subjects factor stress treatment (social defeat vs control) and within-subjects factor time (stress days 1-10). Similarly, total daily running wheel counts were subjected to repeated measures ANOVA with between-subjects factor stress treatment (social defeat vs control) and within-subjects factor time (baseline days 1-7 days and stress days 1-10). To test for differences in daily profiles of activity, the hourly running wheel counts were subjected to repeated measures ANOVA with experimental group as between-subjects factor (social defeat vs control) and time (hours of the day) as within-subjects factor. Šidák test was used as a post hoc when repeated measures ANOVA revealed a significant difference.
One-way ANOVA was applied to compare the phase and period of the PER2 rhythms among the four groups (acute and chronic social defeat stress and their controls) in the EDP stress experiment and the LDP stress experiment. When ANOVA revealed a significant effect of treatment, Tukey’s HSD method was applied for post hoc analysis to compare experimental groups of interest, i.e. acute stress vs acute control (AS vs AC), chronic stress vs chronic control (CS vs CC), chronic stress vs acute stress (CS vs AS). Significance threshold was set at α = 0.05.
Results
The Influence of Chronic Social Defeat Stress on General Body Condition
All experimental animals in the social stress groups were readily attacked and defeated by the aggressors. Most animals received 10 attacks before the end of the 10 min interaction (in 91% of the cases during the interactions in the early dark phase and 94% of the cases during late dark phase stress).
Mice in both the EDP and LDP stress group gained more weight during the 10 consecutive stress days than the respective control groups (Figure 1a and 1b). For the EDP stress group (Figure 1a), two-way repeated measures ANOVA indicated a significant effect of stress treatment (F1,18 = 37.74, p < 0.001) and an interaction between stress treatment and time (days) (F9, 162 = 3.19, p < 0.01). For the LDP stress group (Figure 1b), there was a significant effect of stress treatment (F1, 17 = 5.18, p < 0.05), but no significant interaction between stress treatment and time (days) (F9, 153 = 1.37, p = 0.21). Water intake increased in the EDP and LDP stress groups relative to their controls (Figure 1c and 1d). Two-way repeated measures ANOVA revealed a significant stress effect on daily water intake for the EDP stress group (F1, 11 = 16.23, p < 0.01) and the LDP stress group (F1, 18 = 51.10, p < 0.001). Although mice from the stress groups gained more body weight than those from the unstressed group, no significant difference in daily food consumption was found (Figure 1e and 1f).
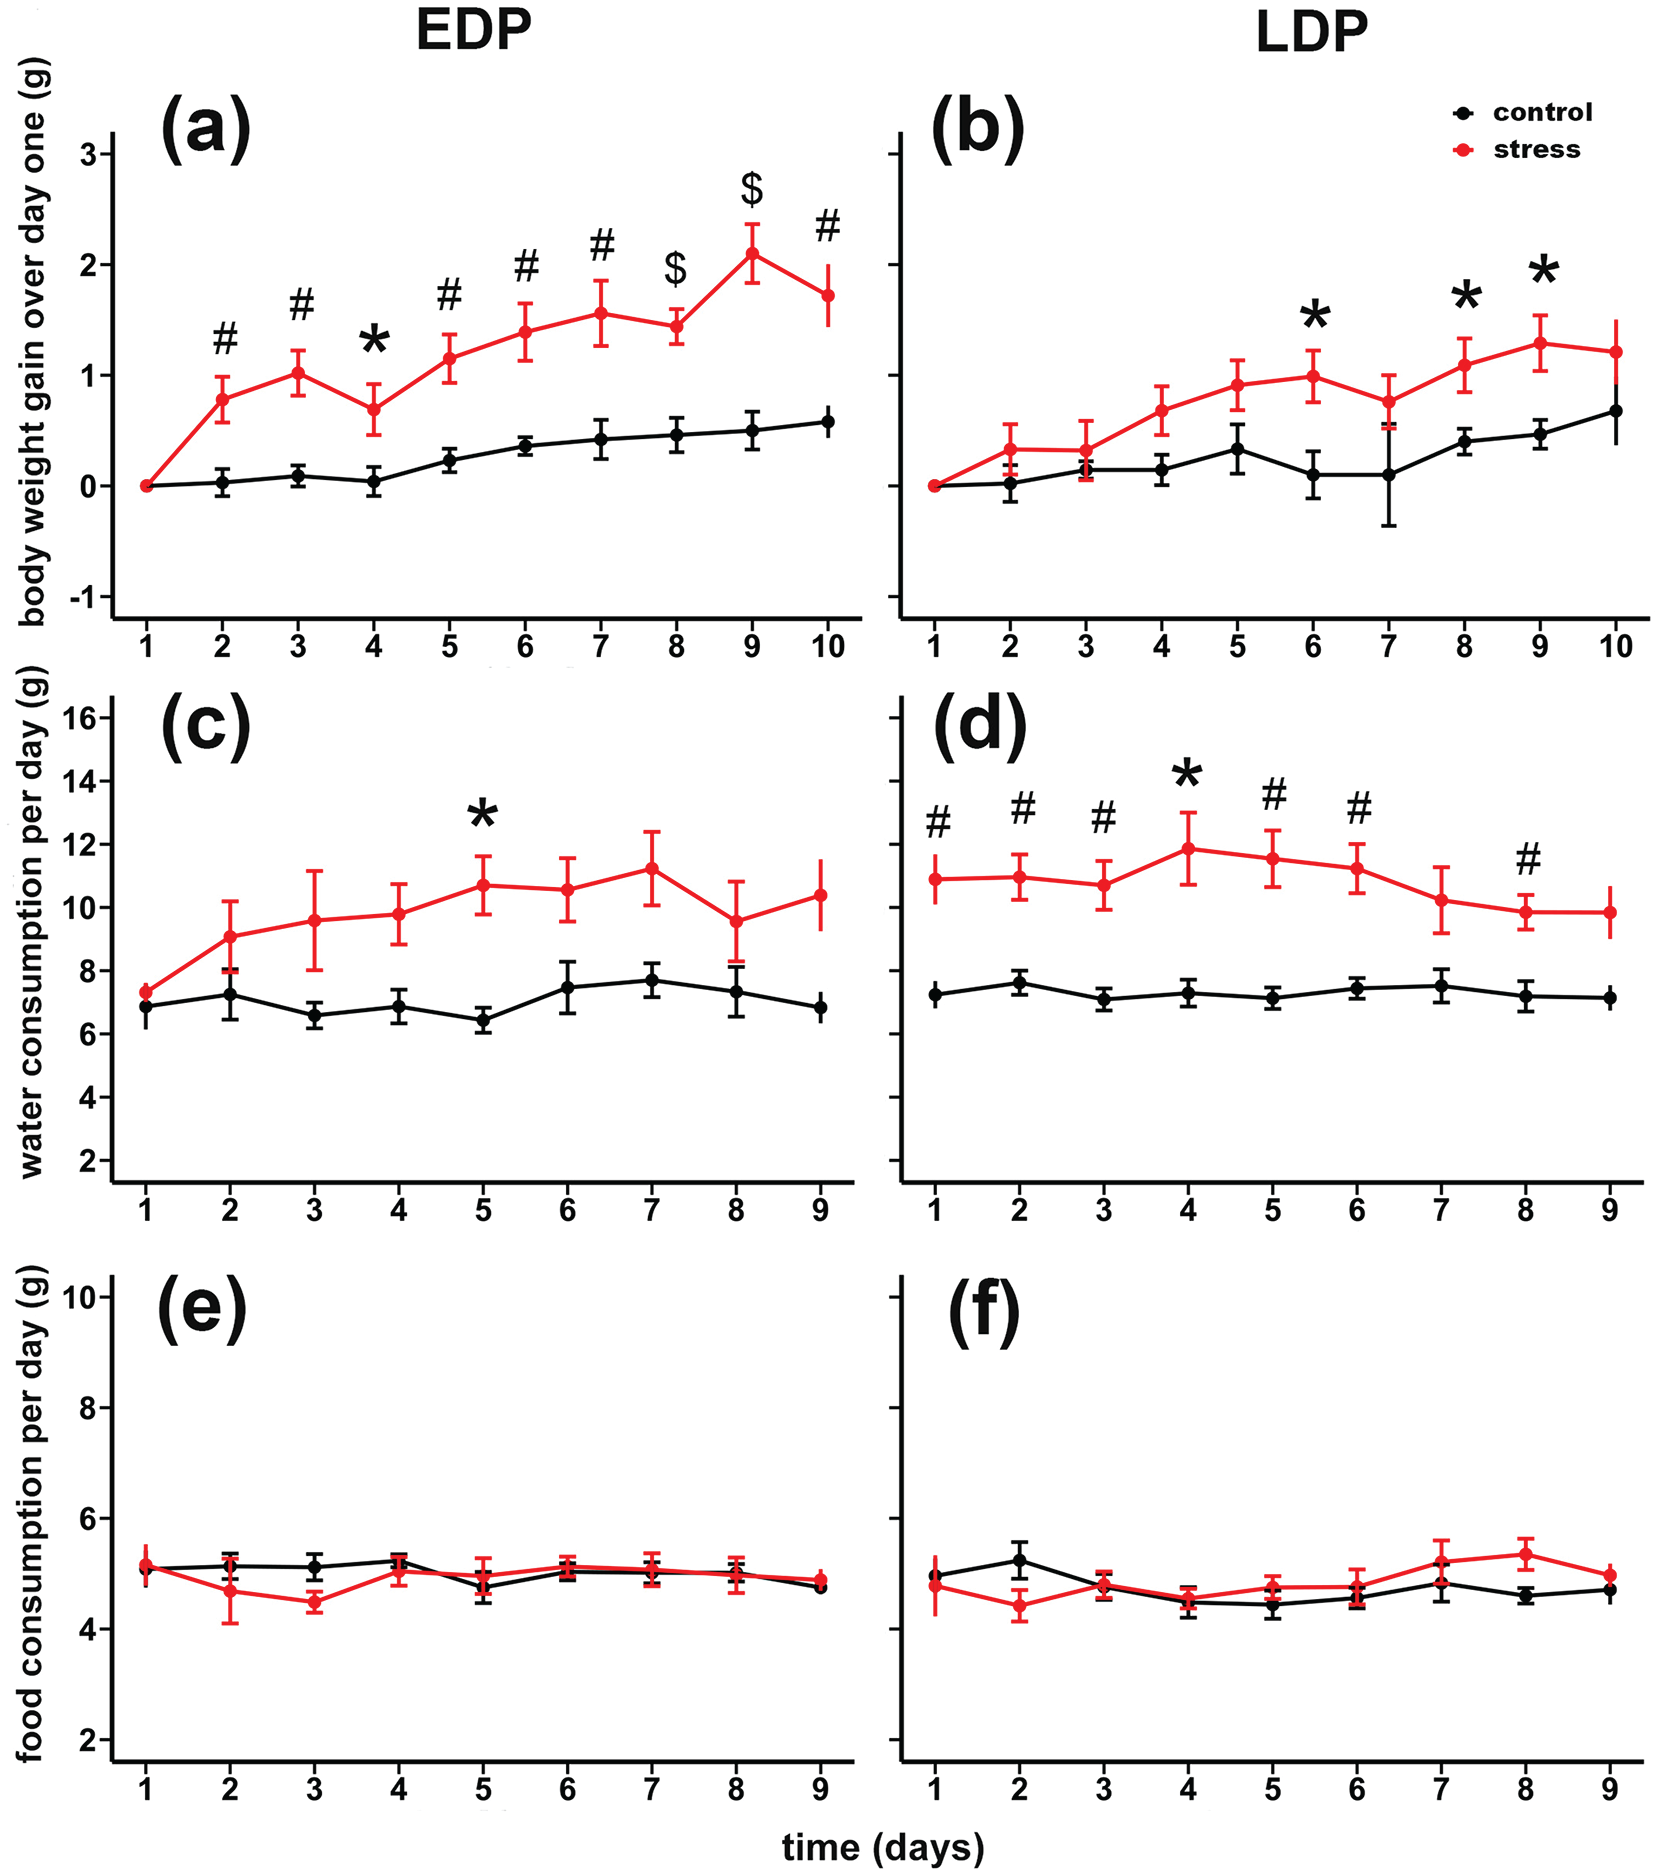
Influence of chronic social defeat stress on general body condition during stress days. Body weight gain during daily stress, applied in the early (a) or late (b) dark phase for stressed and control mice relative to the first day of stress (day 1). Significant stress effects were seen from Day 2 to Day 10 in early dark phase (a), and Days 6, 8, and 9 in late dark phase (b). Daily water intake for early (c) and late (d) dark phase stress. significant stress effect during exposure to stress were from Day 5 in EDP (c), and Days 1, 2, 3, 4, 5, 6, and 8 in LDP (d). Daily food intake for early (e) and late (f) dark phase stress. No significant changes in food intake during exposure to stress were found. Data are expressed as the mean ± SEM. Abbreviations: EDP = early dark phase; LDP = late dark phase; SEM = standard error of the mean.
Effects of Chronic Social Defeat Stress on Running Wheel Activity
Figure 2a shows representative running wheel actograms of an EDP and LDP stressed mouse and two respective control animals. In the actogram of the EDP stress mouse, a clear suppression of running wheel activity can be seen during the remainder of the dark phase following each daily defeat (Figure 2a left panels). In the LDP stress mice no such activity suppression is visible, possibly because stress occurred at a time in the late dark phase when there was little running wheel activity to begin with (Figure 2a right panels).
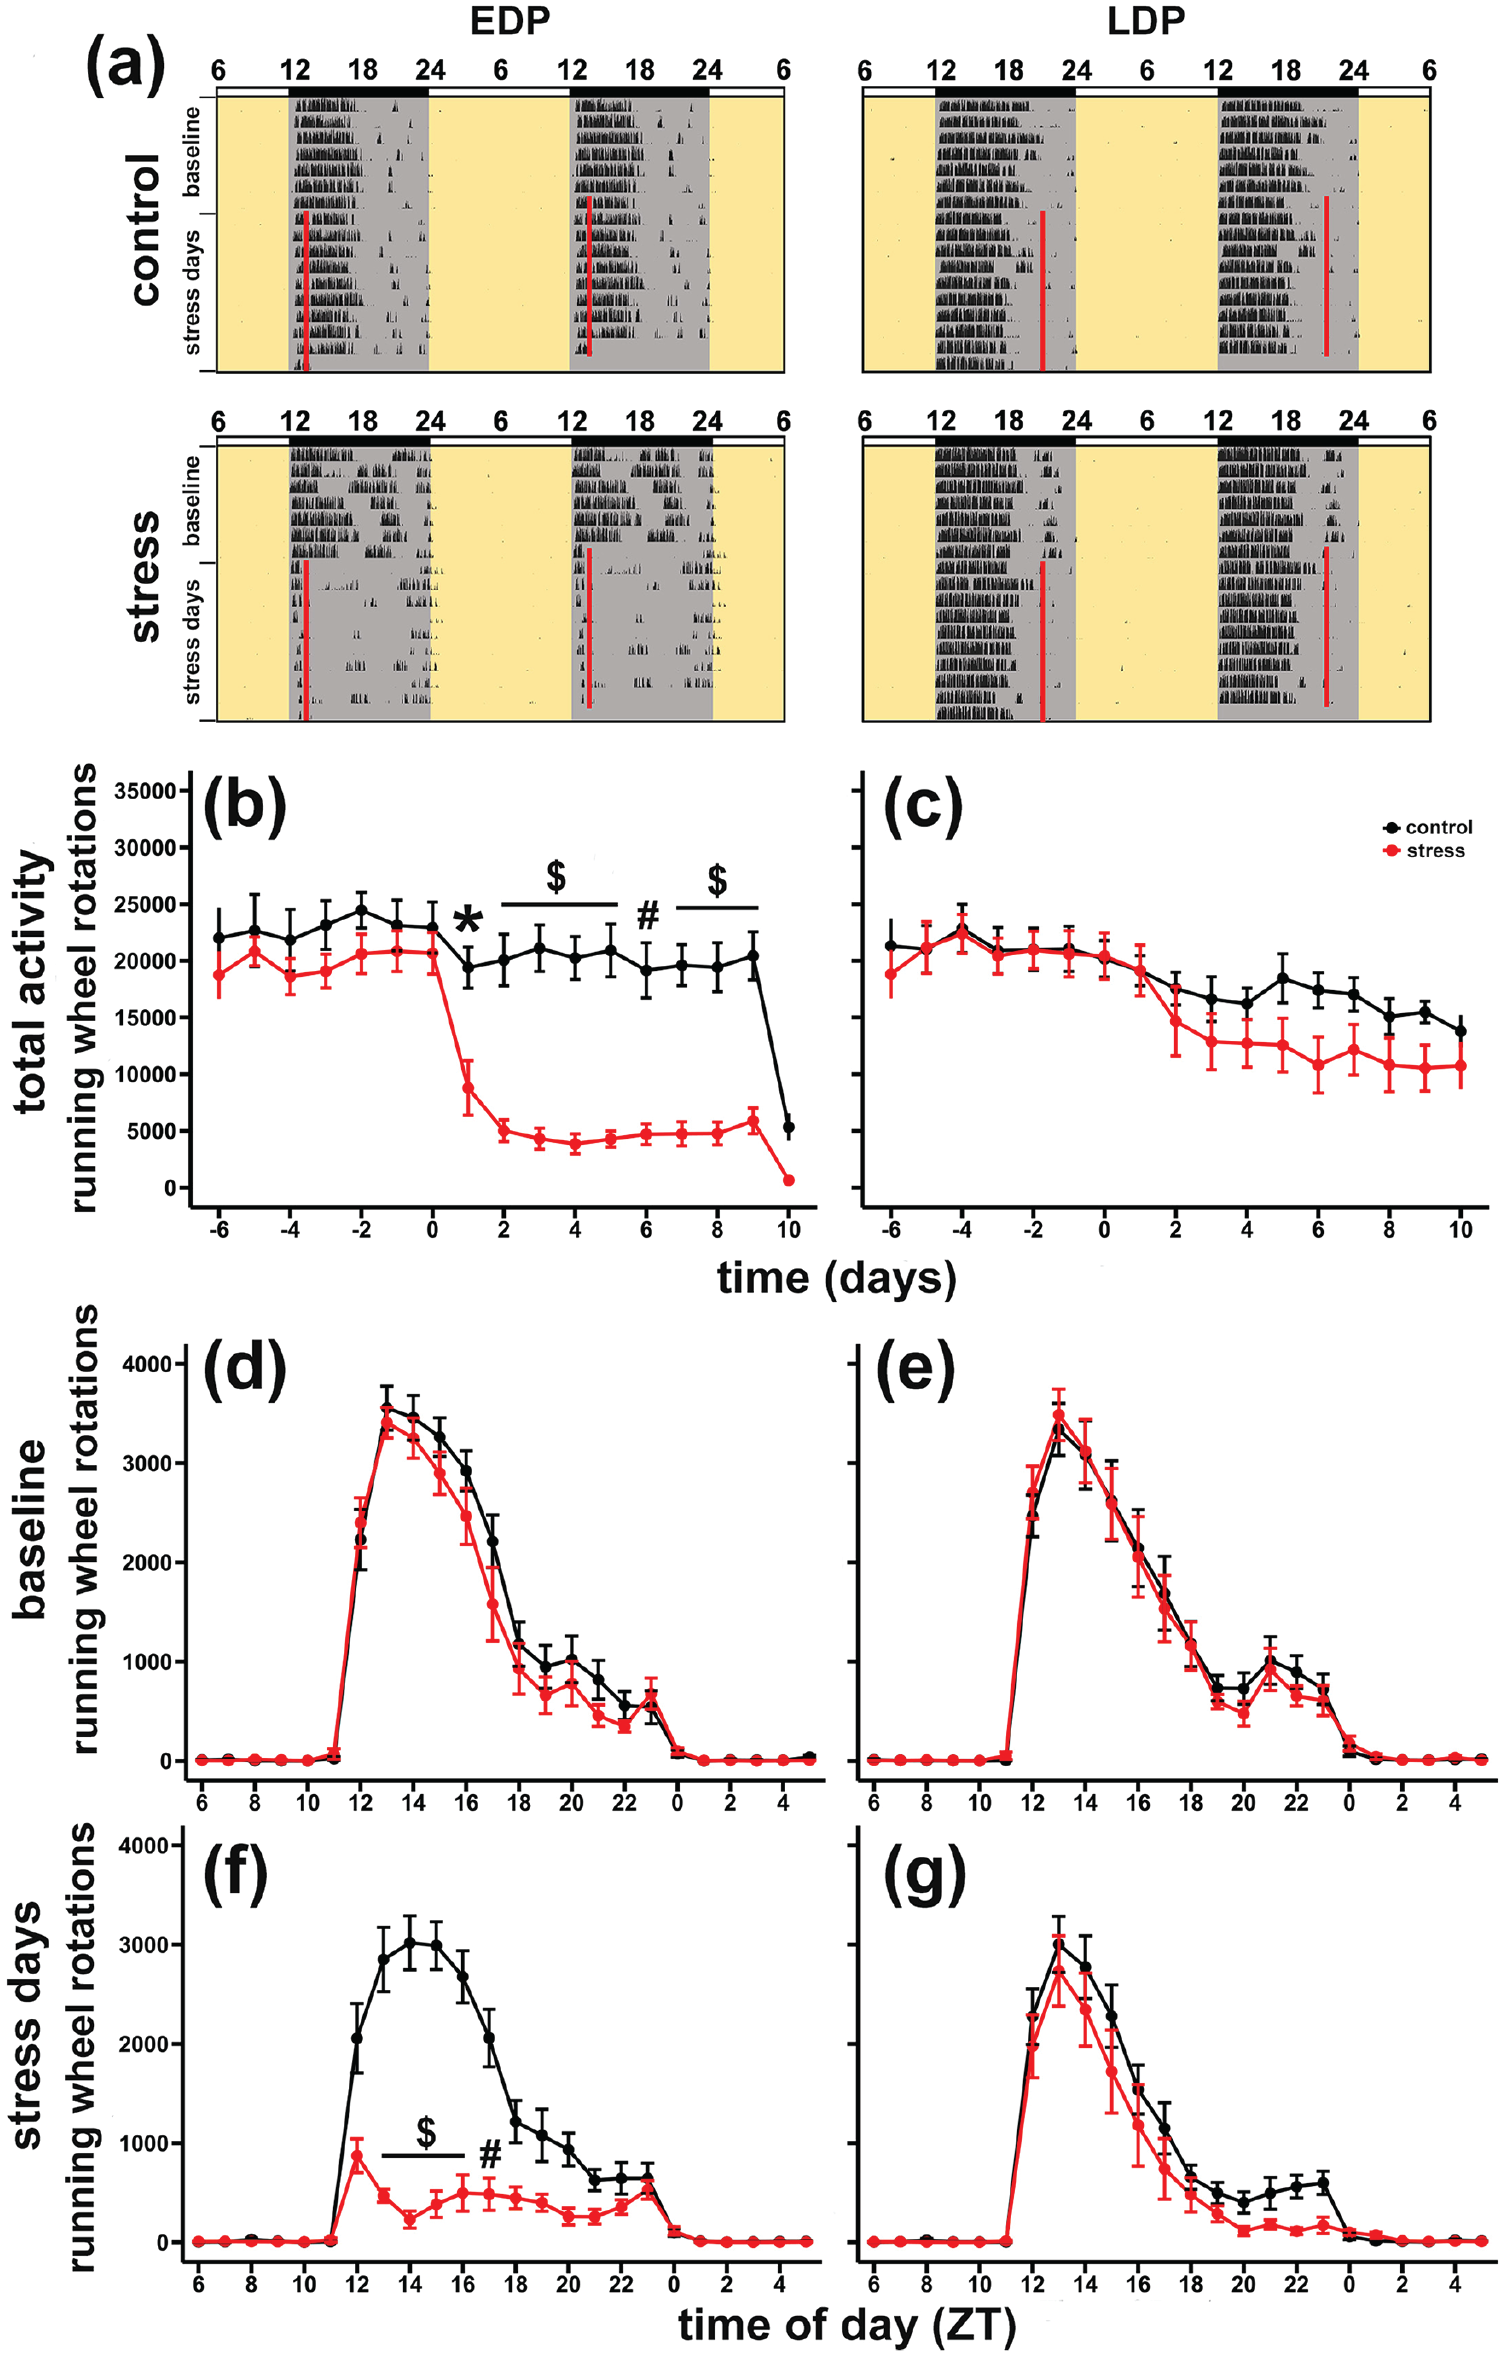
Effects of chronic social defeat stress on running wheel activity. (a) Representative double-plot actograms of individual control mice (upper panels) and stressed mice (lower panels), for early (left panels) and late (right panels) dark phase treated mice. Red lines indicate when handling or social stress occurred. Time is represented as ZT. (b, c) Total running wheel rotations per day during 7 baseline (-6 to 0) and 10 social defeat days (1 to 10). During social defeat days, there was a difference between early dark stress and its control group (b), but not between late dark stress and its control group (c). Total running wheel activity per hour during Baseline (d, e) and Stress days (f, g). During social defeat days, a significant suppression from ZT 13-17 were found following early dark stress (ZT 13-14, g) but not late dark stress (ZT21-22, f). Symbols represent mean ± SEM. Abbreviations: ZT = Zeitgeber time; SEM = standard error of the mean; EDP = early dark phase; LDP = late dark phase.
During the baseline week, the experimental groups and their controls did not differ in the daily number of wheel rotations (Figure 2b and 2c). However, during the 10 consecutive stress days, running wheel activity was significantly suppressed by repeated social defeat stress in the EDP stress group (two-way repeated measures ANOVA were done from Day 1 to Day 9, since Day 10 is an incomplete recording, F1, 19 = 70.47, p < 0.001), but not in the LDP stress group (F1, 20 = 3.19, p = 0.09). In the EDP stress group, average daily running wheel activity during the 10-day stress period was suppressed by 76% relative to the control, whereas in the LDP group this was only 25% (T20 = 3.9, p < 0.001, EDP vs LDP).
During the baseline week, the mice displayed a stable rhythm of wheel running with most activity occurring during the first half of dark phase (ZT12-17; Figure 2d and 2e). The daily stress exposure resulted in a short-term or transient suppression of activity during the remainder of the dark phase but did not affect the activity onset next day (Figure 2a, 2f, and 2g). While in the case of LDP stress the suppression of activity did not reach statistical significance (Figure 2g; F1, 20 = 2.6, p = 0.12), daily chronic EDP stress exposure resulted in a significant reduction of activity (Figure 2f; F1, 18 = 70.86, p < 0.001). Post hoc analysis showed that this EDP stress-induced activity suppression lasted for 5 h from ZT 13-17, exactly when normally most activity occurred (Figure 2f).
Effects of Social Defeat Stress on PER2 Expression in Peripheral Tissues
All tissues showed robust PER2::LUC bioluminescence rhythms with dampening amplitudes, as normally observed in these sealed cultures (Figure 3a). There were no significant amplitude differences between the stress groups and their respective controls. Chronic LDP stress had a clear effect on the PER2 rhythms in some of the tissues (Figure 3a, lower panels, red traces compared to black traces). Social defeat stress in neither EDP nor LDP had a clear effect on the period of the rhythm in most of tissues, except for a ~0.85 h shortening of the period in the liver after LDP chronic stress as compared to the relevant controls (Figure 3b right panel, p < 0.05). While in most tissues the period of the PER2::LUC rhythm was unaffected by stress, the phase of the rhythm was significantly delayed in several of the tissues, particularly after LDP stress (Figure 3c, right panel). Specifically, a significant phase delay was found in kidney medulla and cortex after chronic LDP stress (both p < 0.001), and in lung after both acute and chronic LDP stress (p < 0.05 and p < 0.001 respectively). In the lung especially, chronic LDP stress resulted in a striking 9 h phase delay in the PER2-coupled bioluminescence rhythm (Figure 3c, right panel). No significant phase changes were seen in the WAT and the liver.
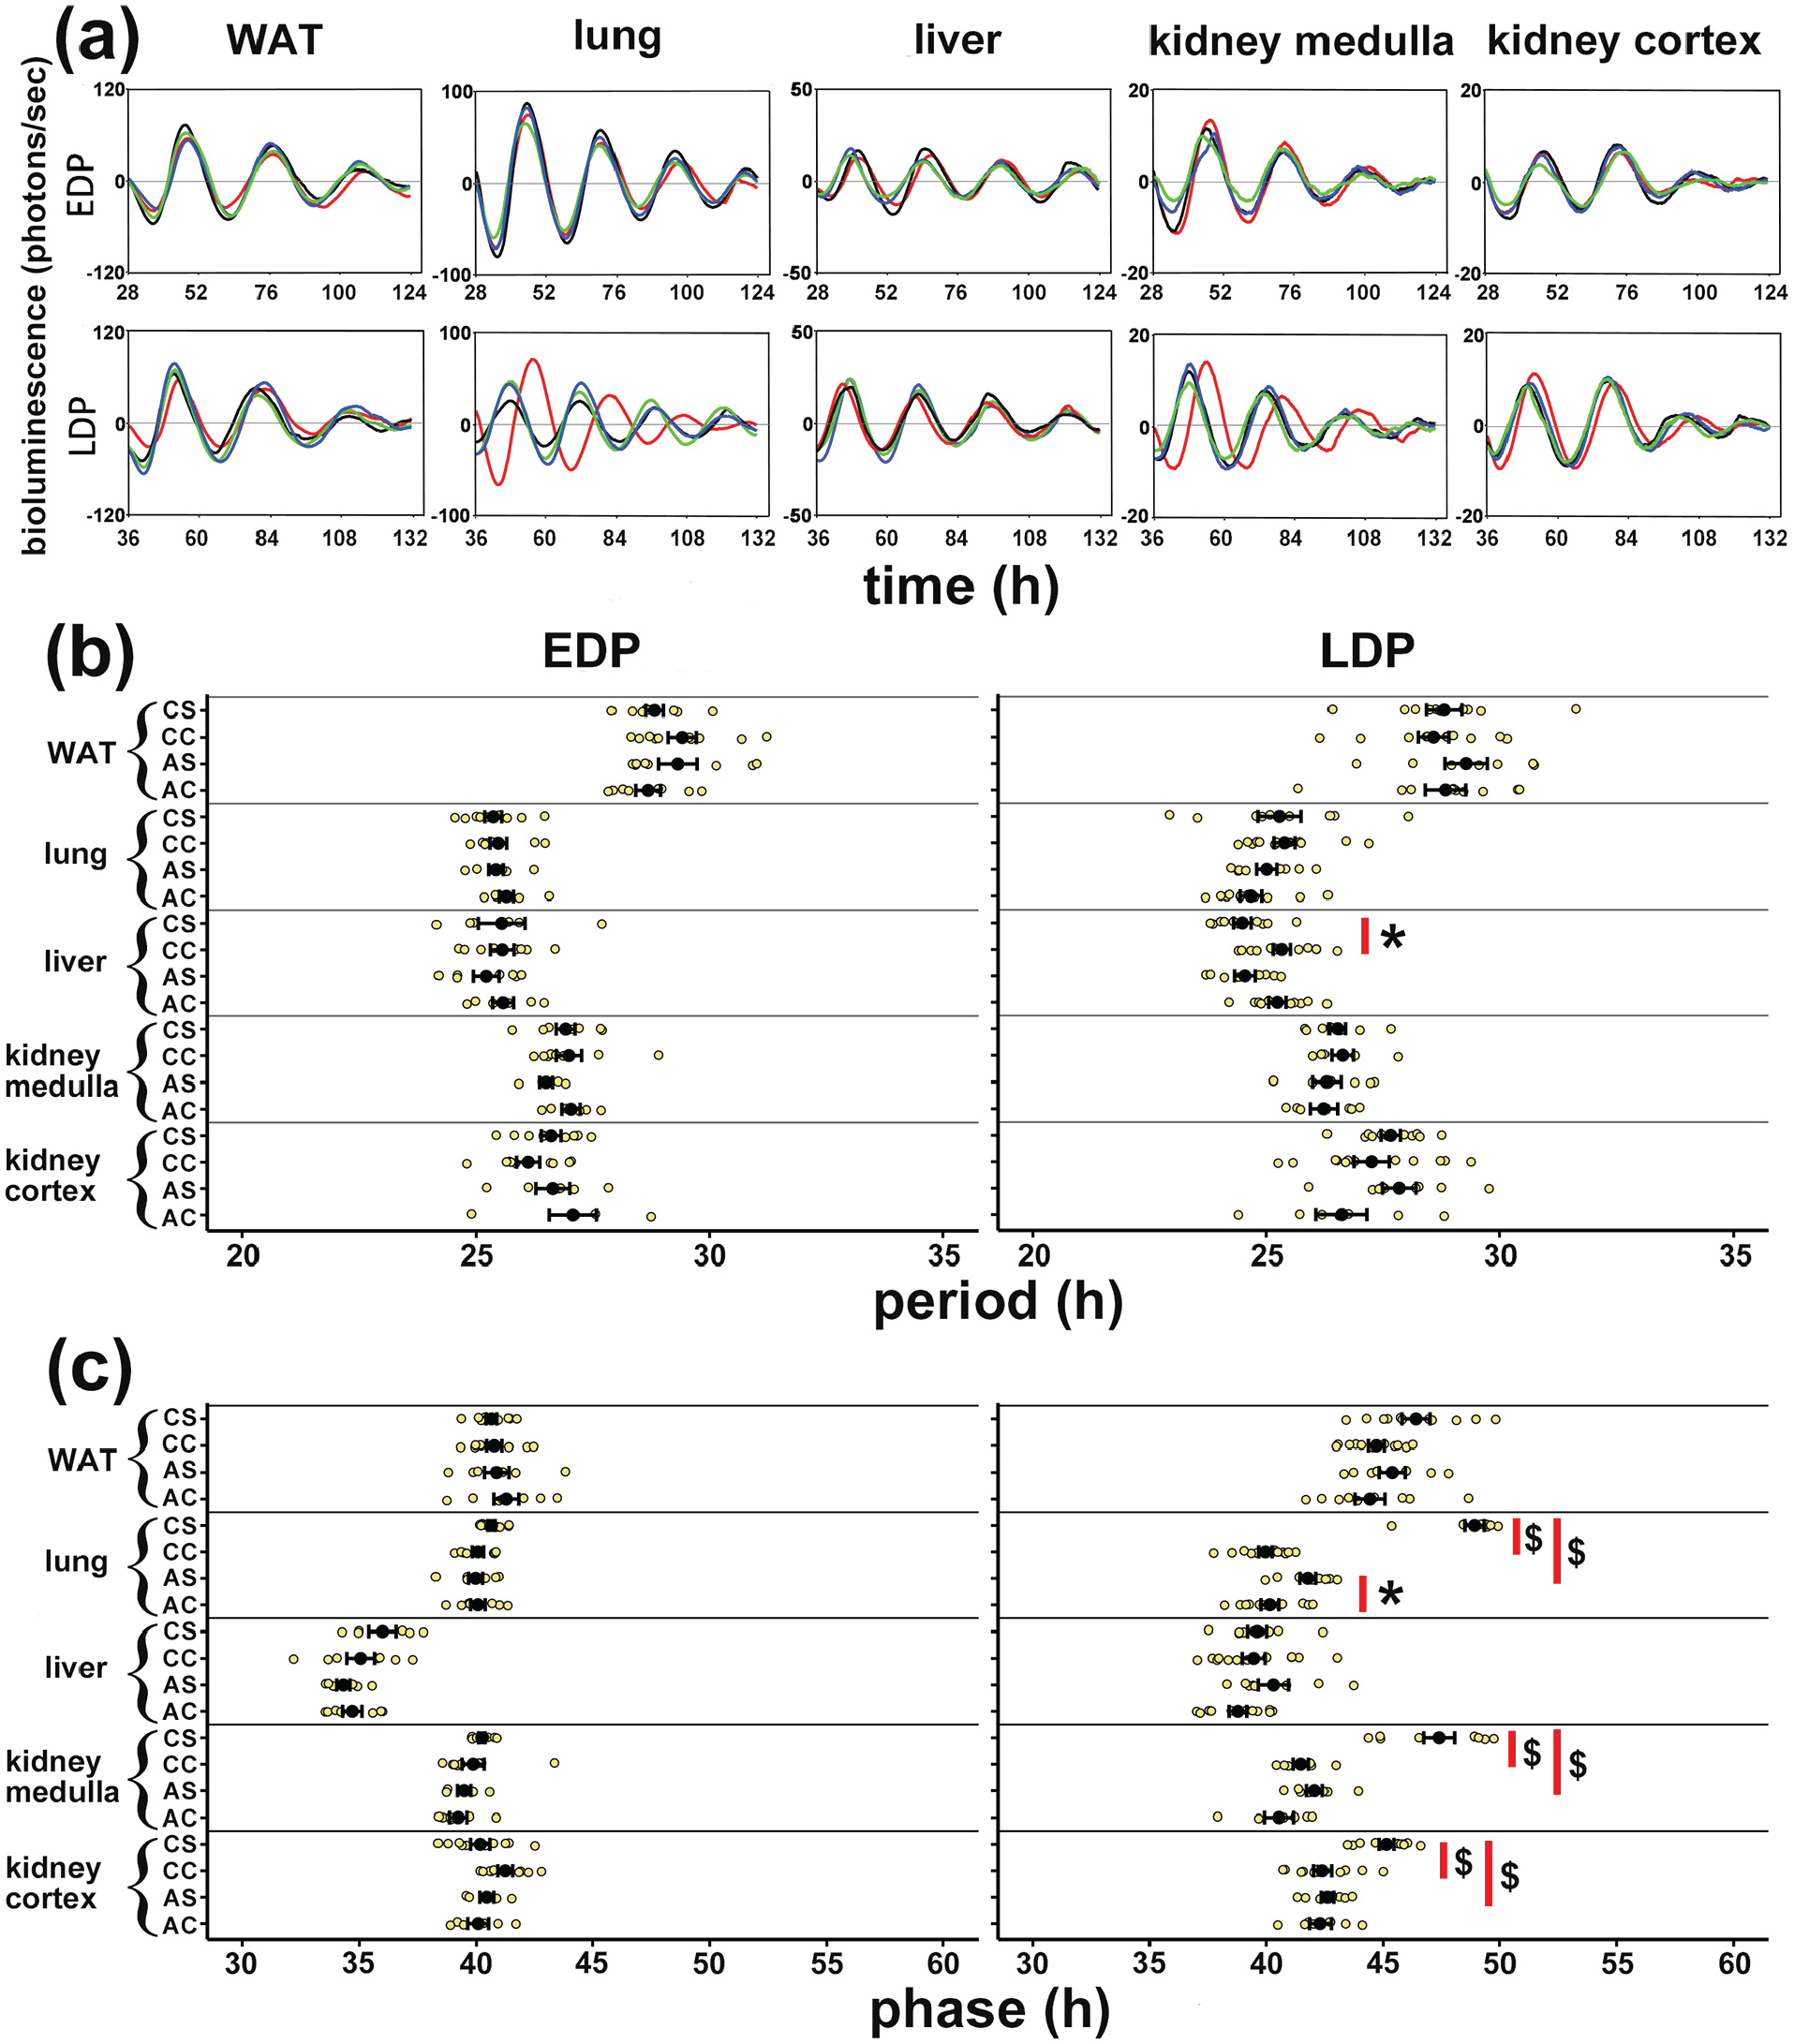
Effects of social defeat stress on PER2 expression in peripheral tissues. (a) Representative ex vivo PER2::LUC bioluminescence rhythms from (left to right panels) WAT, lung, liver, kidney medulla and kidney cortex samples taken from control mice and mice subjected to stress in either early dark phase (EDP, upper panels) or late dark phase (LDP, lower panels). Line colors: blue = acute stress, green = acute control, red = chronic stress, black = chronic control. Values are plotted as 24 h running mean baseline subtracted photon counts per second. Recordings are from 12 h to 108 h after the start of the culture, but time is recalculated to represent ZT before sacrifice. Period (b) and phase (c) values of PER2::LUC rhythms from WAT, lung, liver, kidney medulla and cortex from control mice and mice that had been subjected to stress in either EDP (left panels in b and c) or LDP (right panels in b and c). Phase was calculated as the time of the first onset of the trace, defined as its first incremental baseline crossing (see traces in A). Abbreviations: PER2::LUC = PERIOD2::LUCIFERASE; WAT = white adipose tissue; EDP = early dark phase; LDP = late dark phase; ZT = Zeitgeber time; SEM = standard error of the mean; CS = chronic stress; CC = chronic control; AS = acute stress; AC = acute control. Big black dots and error bars represent mean ± SEM. Color is available in the online version.
Plasma CORT Levels in Different Groups
CORT levels in trunk blood collected 1 h after the last defeat in stressed and control mice indicated significant time-of-day differences in basal control CORT levels (T16 = 5.2, acute control EDP vs acute control LDP, p < 0.001). Both acute and chronic stress induced a significant increase in CORT levels (Figure 4a, EDP: acute stress vs acute control: p < 0.01, chronic stress vs chronic control: p < 0.01; LDP, acute stress vs acute control: p < 0.001, chronic stress vs chronic control: p < 0.01). The relative increase compared to baseline was stronger after LDP stress due to the lower baseline levels at that time of day (for fold-increases, see Figure 4a). The acute corticosterone response persisted, even after 10 days of repeated stress, although there was a slight attenuation of the response after repeated stress in the late dark phase (Figure 4a, p < 0.001).
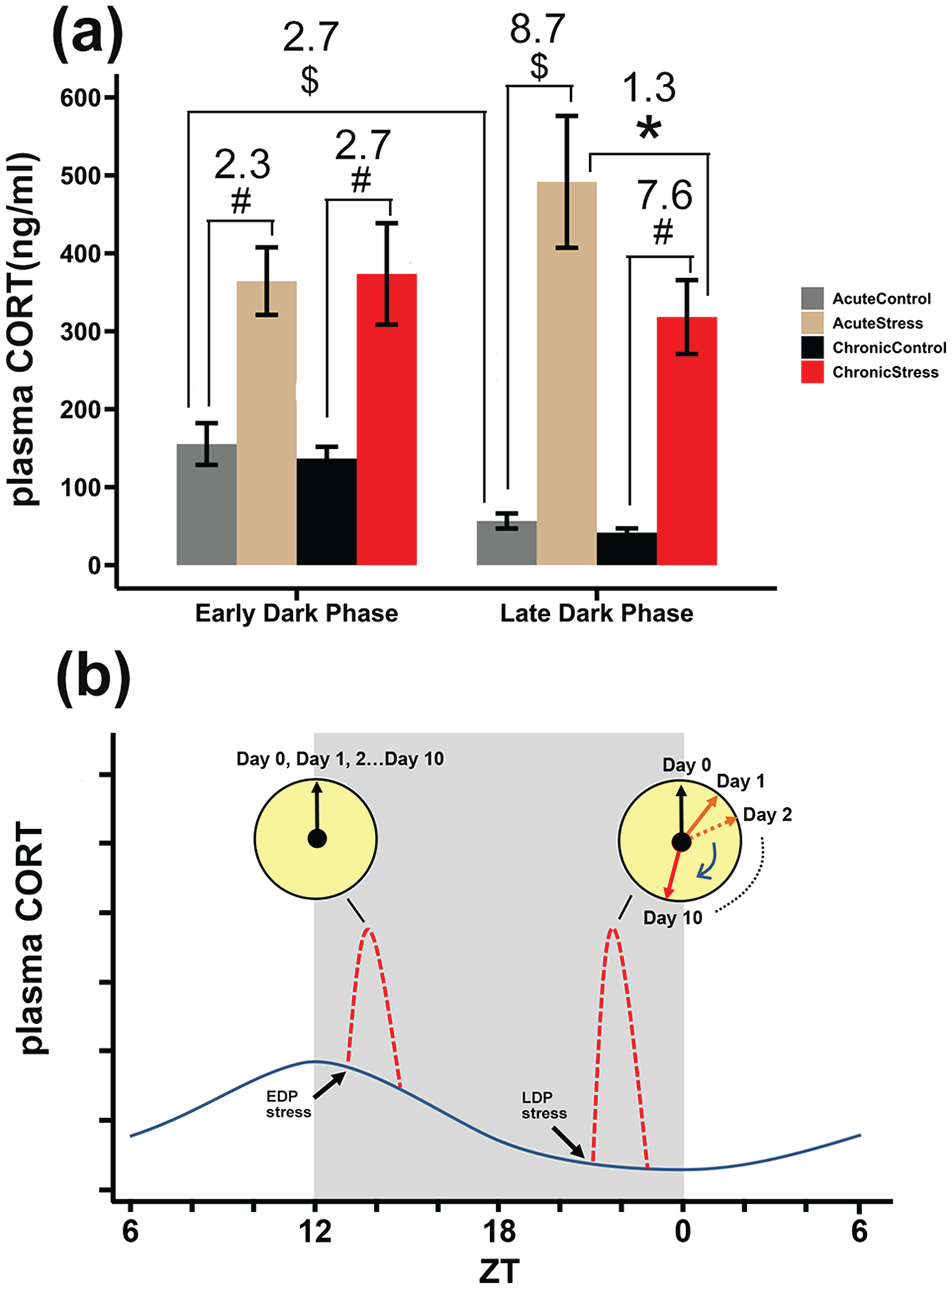
Influence of acute and chronic stress during early and late dark phase on plasma corticosterone levels and graphical representation explaining cumulative effect of social defeat stress on peripheral clocks. (a) Acute and chronic stress cause similar increase in CORT levels in the early dark phase, but acute stress causes stronger increase in CORT in late dark phase. Numbers indicate fold change in CORT levels relative to control. Data are plotted as mean ± SEM. Significance differences detected with Student’s T-test are indicated as *p < 0.05. #p < 0.01. $p < .001. (b) Graphical representation explaining differential effects found between EDP and LDP stress on stress-sensitive peripheral clocks (e.g. in lungs, kidney). Dark blue wave represents the normal circadian plasma CORT levels of mice, red dashed lines represent stress induced CORT surge. Day 0 is the day before stress, Day 1 is the first day of stress (acute stress), and so forth. Arrows in the yellow clocks indicate the phase of the peripheral rhythms with no phase change after EDP stress and a cumulative phase change with LDP stress. Abbreviations: CORT = corticosterone; SEM = standard error of the mean; EDP = early dark phase; LDP = late dark phase; ZT = Zeitgeber time.
Discussion
In the present study, we demonstrated in mice that chronic uncontrollable stress is capable of phase shifting peripheral circadian clocks in a time of day dependent and tissue specific manner. Specifically, chronic intermittent social defeat stress caused a phase delay of several hours in the rhythm of PER2 expression in lung and kidney, but only when stress occurred in the late dark phase, not in the early dark phase. PER2 rhythms in liver and WAT were not significantly affected by social defeat stress. Importantly, the phase delays in lung and kidneys after social defeat stress in the late dark phase were much stronger after 10 days of repeated social defeat stress than after a single stress exposure (lung) or even non-significant after a single defeat (kidney). The latter finding suggests a cumulative effect of daily intermittent or chronic stress.
Social Defeat Stress Influenced General Physiology and Behavior
To study the effects of stress on circadian organization, we applied the well-established and extensively validated social defeat model (Koolhaas et al., 1997; Meerlo et al., 2002; Koolhaas et al., 2013). This model is based on territorial aggression, i.e. a resident male mouse defending its home cage against intruders. This form of aggression normally only occurs when the intruder is a male, not a female, which explains why the current study was only done in male subjects. Interestingly, a recent study showed that applying male urine to female mice can trigger resident male aggressive behavior toward these females (Harris et al., 2018). While this may be an interesting approach to study effects of social defeat stress in female mice, it remains uncertain whether the nature of the interaction and the level of aggression that is experienced is similar for male and female intruders (Harris et al., 2018). Therefore, if the aim is to specifically address potential sex-differences in effects of stress on circadian organization, other models that do not depend on social interactions might be a simpler start. For example, immobilization stress has been shown to affect circadian rhythms in peripheral tissues in female mice in a way that is qualitatively similar to what we find after social defeat stress in males (Tahara et al., 2015). Clearly, since the current study was done in male mice only, care has to be taken with extrapolating these findings on social defeat stress to female subjects.
In the present study, we confirmed the acute neuroendocrine activation that occurs upon social defeat as reflected in strongly elevated corticosterone levels 1 h after the interaction (Figure 4). We also found that mice subjected to chronic intermittent social defeat gained more weight during the 10-day stress period than the control animals, which agrees with another study on effects of stress in mice (Goto et al., 2014), but not with other studies (Chuang et al., 2010; Warren et al., 2013). Whereas in the study by Goto and colleagues (2014), body weight gain was associated with increased daily food and water intake, the mice in our study did not show a change in daily food intake (Figure 1e and 1f). Instead, the increase in body weight in stressed mice might be partly explained by an increase in water intake (Figure 1c and 1d) and/or by a lower energy expenditure resulting from the observed reduction in running wheel activity (Figure 2).
Social defeat stress resulted in a strong suppression of activity, which is in line with our earlier reports on social defeat stress in both mice (Ota et al., 2018, 2020) and rats (Meerlo et al., 1996, 1999). In the present study, we found this suppression of activity particularly after social defeat in the early dark phase, which is the time when mice normally run in their wheel the most. After defeat stress in the late dark phase there was no major suppression in the daily running wheel counts, presumably because at that time of day there was little wheel running activity to begin with, even under baseline conditions (see Figure 2g). Although, social defeat stress can have strong suppressive effects on locomotor activity, previous studies have clearly shown that the clock work underlying the circadian regulation of activity is unaffected. Social defeat stress does not change the phase and period of the free-running activity rhythm under constant conditions (Meerlo et al., 1997; Meerlo and Daan, 1998; Ota et al., 2018), nor does it affect the phase and period of master clock in the SCN that drives the activity rhythm (Ota et al., 2020).
Phase Resetting of Peripheral Clocks by Stress: Cumulative, Time-of-Day Dependent, and Tissue-Specific Effects
One important outcome of the present study is that effects of social defeat appeared to accumulate with repeated exposure to the stress (Figure 4b). The phase delays in the PER2 rhythm in both lung and kidney after social defeat stress in the late dark phase were much larger after 10 defeats than after a single defeat (Figure 3c). The PER2 rhythm in the lung was delayed by 1.6 h after a single defeat but with a staggering 9 h after 10 days of repeated defeat (Figure 3c).
Another important finding was that the PER2 rhythms in lung and kidney were only shifted by stress in the late dark phase and not by stress in the early dark phase. This difference is not easily explained by a variation in the intensity of the stress. Our observations clearly indicated that the experimental mice were attacked and defeated by the dominant aggressors, irrespective of when the interaction took place. Moreover, compared to late dark stress, early dark stress resulted in a stronger suppression of running wheel activity, a slightly stronger body-weight gain, and comparable CORT levels. This suggests phase changes of peripheral clocks by stress depends on the time of day. This finding is in line with various other studies, particularly a study in mice by Tahara and colleagues (2015), who reported time-of-day dependent phases shifts in various tissues following repeated restraint stress (Tahara et al., 2015). They showed phase advances following repeated restraint in the light phase and, similar to our findings, no phase changes following stress in the early dark phase and phase delays following stress in the late dark phase. It remains to be determined whether this is a consistent pattern, also in other species than nocturnal mice.
In addition, we found that in mice the effects of social defeat stress were highly tissue specific, with clear delays after repeated late dark phase defeat in lungs and kidney, but not in liver and WAT. In lung, kidney cortex and medulla, the phase delays were approximately 9 h, 3.5 h and 6 h respectively. This was also found in other tissues following various stressors, such as submandibular gland (~5 h) and adrenals (~2 h) (Bartlang et al., 2014; Razzoli et al., 2014; Tahara et al., 2015). It thus seems that circadian clocks in different tissues are differentially sensitive to stress signals. The mechanism underlying this difference is unclear, but one of the factors involved might be the glucocorticoid stress hormones and their interaction with ‘glucocorticoid receptors’. Glucocorticoids such as CORT bind with GR’s, which then can modulate the transcription of many genes, including Per2 and other clock genes, by binding to glucocorticoid responsive elements (GRE) in the promoter region (Balsalobre et al., 2000; So et al., 2009; Cheon et al., 2013; Dickmeis et al., 2013; Oster et al., 2017). Perhaps tissue specific effects result from differences in local cellular CORT concentrations and cytoplasmatic GR availability (Oakley and Cidlowski, 2013; Scheschowitsch et al., 2017). The likelihood of GRE occupancy by activated CORT bound GR is also tissue specific due to differences in chromatin accessibility and exposure of the GRE (Oakley and Cidlowski, 2013). Further study is required to assess whether this might explain differences in phase shifts in various tissues after stress.
The magnitude of phase shifts after stress and tissue differences herein might also be modulated by other neuroendocrine stress signals. In addition to activation of HPA axis and CORT release, stress also stimulates the sympathetic-adrenal-medullary (SAM) system and the release of adrenaline and noradrenaline, which can affect the clock genes such as Per1 and Per2 through cyclic adenosine monophosphate and mitogen-associated protein kinase signaling (Tahara et al., 2015, 2017). It is possible that the phase shifting effects of these different neuroendocrine signals are additive in some tissues but not in others. Also, there may be other processes or signals that have a tissue-specific buffering effect against stress. One of these could be the feeding-related signals. Feeding is the strongest known synchronizer of the peripheral clocks in liver, white and brown adipose tissues, and skeletal muscle, but not so much for other organs such as lung and kidney (Froy, 2010; Zani et al., 2013; de Goede et al., 2018; Greenwell et al., 2019; Manella et al., 2021). Therefore, the phase shifting effects of stress in some tissues may strongly depend on how much the feeding activity and feeding pattern is affected. When feeding activity is unaltered, as perhaps indicated by unaltered activity onset (Figure 2f and 2g), the tissue clocks such as in the liver or WAT that are strongly responsive to feeding signals may be less affected by stress-related signals.
Notwithstanding this argument, our finding of no significant shift of the PER2 rhythm in the liver after social defeat stress is in contrast to earlier studies reporting clear shifts in the liver after social defeat stress and restrain stress (Tahara et al., 2015; Ota et al., 2020) and also after direct administration of the synthetic glucocorticoid dexamethasone (Balsalobre et al., 2000). It is unclear why we did not find an effect of stress on the liver clock in the current study but one might argue that it could be related to differences in effects of stress on feeding in the current study and the ones that did report a shift in the liver clock. For example, in our previous studies animals were subjected to stress under DD conditions (Ota et al., 2020) whereas in the current study defeat took place under entrained LD conditions, which might affect feeding patterns and changes herein after stress. Moreover, it is interesting that in one of these other studies, the PER2 expression of the liver returned to its original phase 24 h after the 3 day restraint stress, which was not the case for the kidney and submandibular gland (Tahara et al., 2015). This indeed seems to suggest that the shift in the liver clock was more potently counteracted by other signals, which might be a strong feeding rhythm driven by an unaffected SCN entrained to a light-dark cycle.
A recent study reported that the dissection time of tissues may affect the subsequent phase of the ex vivo PER2 rhythms, and this resetting effect of dissection was enhanced by circadian disruption (Leise et al., 2020). While such a dissection effect on phase implies that the ex vivo phase in our study may not have exactly represented the in vivo phase in the living animals, we are confident that this does not affect the interpretation of our findings. With respect to the effect of dissection time on phase it is important to note that we did not compare PER2 rhythms in tissues dissected at different times of day. We only directly compared the bioluminescence rhythms in tissues collected at the same time of day (i.e. EDP stress versus the corresponding control, or LDP stress versus the corresponding control; see Figure 3). Still, for samples collected at the same time of day, one might wonder if some of the phase differences between control and stressed mice in our study were the result of an increased dissection effect after social defeat stress. However, the model of circadian disruption in the study by Leise and colleagues consisted of exposing mice to a short 10 h:10 h LD cycle. Since the mice did not entrain to this short LD cycle, this model involves exposure to light at inconsistent circadian times that directly impacts the master clock in the SCN. This is quite different from our social stress model under a normal 12 h:12 h LD cycle. The difference is clearly demonstrated by the fact that in the Leise study the phase resetting effect of dissection appears to be stronger particularly for the SCN of circadian disrupted mice on LD 10 h:10 h whereas in our model of social defeat stress the phase of the SCN is unaffected. In our previous study, the ex vivo PER2::LUC rhythm in the SCN did not differ between control mice and stressed mice (Ota et al., 2020). Hence, it may be that the finding of a stronger phase resetting by dissection in a model of circadian disruption is specific for light-induced disruption of SCN function that does not hold true for stress.
Future Perspectives
Together, our experiment suggested that chronic social defeat stress can phase shift PER2 expression in many peripheral tissues, and the phase shifting effects are cumulative, tissue specific, and dependent on the time of day. Further studies are required to unravel the detailed physiological mechanism involved in the stress-induced phase shifts and to determine why some tissue clocks are more sensitive to stress than others. An additional important challenge will be to assess whether the changes in circadian organization following stress are a functional adaptation to optimally deal with the stressors or the beginning of a maladaptive state that may sensitize the organism to disease (Ota et al., 2021).
Footnotes
Acknowledgements
The authors thank Jan Bruggink for the corticosterone essay. This work was supported by a Bernoulli scholarship from the Faculty of Science and Engineering at the University of Groningen, The Netherlands; a scholarship from Coordenação de Aperfeiçoamento de Pessoal de Nível Superior (CAPES), Brazil; and a scholarship from China Scholarship Council and support from Hunan Normal University, China. Deborah Suchecki is the recipient of a Research Fellowship from Conselho Nacional de Desenvolvimento Científico e Tecnológico (CNPq # 302608/2019-2). The equipment used was funded by ALW-IN grant 834.11.005 “Tracing Time” to Roelof Hut.
Conflict of Interest Statement
The author(s) have no potential conflicts of interest with respect to the research, authorship, and/or publication of this article.