
Abstract
Valproic acid (VPA) is an anticonvulsant used to treat bipolar disorder, a psychiatric disease associated with disturbances in circadian rhythmicity. Little is known about how VPA affects circadian rhythms. The authors cultured tissues containing the master brain pacemaker for circadian rhythmicity, the suprachiasmatic nuclei (SCN), and skin fibroblasts from transgenic PERIOD2::LUCIFERASE (PER2::LUC) mice and studied the effect of VPA on the circadian PER2::LUC rhythm by measuring bioluminescence. VPA (1 mM) significantly phase advanced the PER2::LUC rhythm when applied at a time point corresponding to the lowest (trough, ~ZT 0) PER2::LUC expression but phase delayed the PER2::LUC rhythm when the drug was administered at the time of highest (peak, ~ZT 12) protein expression. In addition, it significantly increased the overall amplitude of PER2::LUC oscillations at time points at or close to ZT 12 but had no effect on period. Real-time PCR analyses on mouse and human fibroblasts revealed that expressions of other clock genes were increased after 2 h treatment with VPA. Because VPA is known to inhibit histone deacetylation, the authors treated cultures with an established histone deacetylation inhibitor, trichostatin A (TSA; 20 ng/mL), to compare the effect of VPA and TSA on molecular rhythmicity. They found that TSA had similar effects on the PER2::LUC rhythm as VPA. Furthermore, VPA and TSA significantly increased acetylation on histone H3 but in comparison little on histone H4. Lithium is another commonly used treatment for bipolar disorder. Therefore, the authors also studied the impact of lithium chloride (LiCl; 10 mM) on the PER2::LUC rhythm. LiCl delayed the phase, but in contrast to VPA and TSA, LiCl lengthened the PER2::LUC period and had no effect on histone acetylation. These results demonstrate that VPA can delay or advance the phase, as well as increase the amplitude, of the PERIOD2::LUCIFERASE rhythm depending on the circadian time of application. Furthermore, the authors show that LiCl delays the phase and lengthens the period of the PER2::LUC rhythm, confirming previous reports on circadian lithium effects. These different molecular effects may underlie differential chronotherapeutic effects of VPA and lithium.
Keywords
The anticonvulsant compound valproic acid (VPA) and the mood stabilizer lithium are both commonly used drugs to treat bipolar disorder (Burgess et al., 2001; Grunze et al., 2009, 2010; Macritchie et al., 2001), a psychiatric disease that involves alterations in circadian rhythmicity (Jindal and Thase, 2004; Jones, 2001; Lamont et al., 2007; Wirz-Justice et al., 1999). It has been suggested that bipolar patients have a circadian rhythm that is misaligned to the external environment (Lamont et al., 2007). In a number of studies, it has been shown that lithium lengthens the circadian period of physiological rhythms in humans, mammalian cells, and model organisms (Abe et al., 2000; Iwahana et al., 2004; LeSauter and Silver, 1993; O’Donnell and Gould, 2007; Reghunandanan et al., 1989), and recently effects of lithium on mammalian clock gene expression have been reported (Osland et al., 2011). However, very little is known about how VPA affects circadian rhythms, and the results from the few existing reports are not consistent: Klemfuss and Kripke (1995) found no effect of VPA on circadian parameters in hamsters. In Drosophila, VPA lengthened the circadian period of activity rhythms of the flies (Dokucu et al., 2005). In contrast, VPA shortened the period of Period1-luciferase in mouse fibroblasts (Chansard et al., 2007). To our knowledge, it is not known how VPA affects the clockwork in the master pacemaker in the brain, the suprachiasmatic nucleus (SCN). VPA affects several signaling pathways, including γ-aminobutyric acid (GABA), voltage-gated calcium channels, mitogen-activated protein kinase (MAPK) activity, and c-Jun N-terminal kinase (JNK) phosphorylation (Chansard et al., 2007; Johannessen Landmark, 2008; Terbach and Williams, 2009), and is also well known for inhibiting class I histone deacetylase (HDAC) (Gottlicher et al., 2001). HDAC activity has an important function in histone modification, chromatin remodeling, and regulation of gene expression. Rhythmic histone acetylation and deacetylation are linked to the circadian regulation of clock genes, in which the transcription factor CLOCK plays a role as a histone acetyltransferase (HAT) (Grimaldi et al., 2009).
To investigate how VPA affects the circadian clock, we examined the effects of VPA on rhythmic expression of the clock gene protein PERIOD 2 in the SCN. We also studied effects on a peripheral cell type, fibroblasts from the skin, as these cells may reflect chronotype and could be used to identify circadian dysfunctions and effects of psychopharmacological drugs in human tissue (Brown et al., 2008). For precise measurements of molecular rhythmicity, we treated cultured SCN tissues and fibroblast cultures from transgenic PERIOD2::LUCIFERASE (PER2::LUC) knock-in mice with VPA and recorded the effect on the PER2 protein rhythm by measuring bioluminescence. We also studied the effect of a histone deacetylation inhibitor, trichostatin A (TSA) (Yoshida et al., 1995), to compare it with the effect of VPA. Finally, we took advantage of the dynamic luciferase reporter method to perform precise studies of lithium effects on the molecular clock. We here report that VPA and TSA significantly phase shift the PER2::LUC rhythm in a direction that is dependent on the circadian time of drug administration, whereas lithium delays the rhythm independently of time of administration and lengthens the circadian period of the PER2::LUC rhythm.
Materials and Methods
Cell and Tissue Cultures and Bioluminescence Recordings
We used fibroblast cells and SCN tissues from homozygous PER2::LUC female knock-in mice (Yoo et al., 2004), 3 to 4 months old, housed in a 12:12-h light:dark (LD) cycle. Mice were anaesthetized with isoflurane and decapitated. Fibroblasts were grown and cultured from skin tissue from the base of the ear (see Supplementary Online Material [SOM]). To obtain SCN cultures, the brain was removed and sectioned in the coronal plane at a thickness of 250 µm. Brain slices containing the bilateral SCN were used to isolate the nuclei. Unilateral SCN tissues (one serving as control in each pair) were cultured on membranes in sealed 35-mm Petri dishes containing air-buffered Dulbecco’s modified Eagle’s medium (DMEM) (Yamazaki et al., 2000) (see video article by Savelyev et al., 2011). Bioluminescence was recorded with Photomultiplier tube (PMT) detector assemblies (Hamamatsu, Bridgewater, NJ). For more detailed description of the culturing procedure, see Methods in the SOM.
Stock solutions of drugs or vehicle (0.1-1% of total medium volume) were administered once directly to the medium (to avoid artifacts due to medium exchange) in the culture dishes after 2 to 3 cycles of initial recording, where the time of highest PER2::LUC expression (“peak”) in the SCN tissue corresponded to ~zeitgeber time (ZT) 12 and lowest expression (“trough”) in the SCN tissue corresponded to ~ZT 0, the latter here defined as the time of lights-on in the animal’s housing environment. Recordings were thereafter continued for 5 to 7 cycles. Because the phases of fibroblast rhythms are highly dependent on medium exchange and other experimental procedures, ZT 0 was in the fibroblast cultures defined as lowest (trough) expression of PER2::LUC and ZT 12 defined as highest (peak) expression.
Analyses of PER2::LUC Rhythms
Period, phase, and amplitude analyses of the PER2::LUC records were performed using Origin software. Records were first de-trended by subtraction of the 24-h running average from the raw data.
Period
The period of 1 cycle was determined as the time between 2 consecutive peaks. Peaks were defined as the highest photon count within 1 cycle (≈24 h). Average periods were calculated before and after treatment with either drug or vehicle.
Phase
Phase shifts were calculated by comparing the time of the peak immediately before treatment with the time of peak immediately after treatment. The shift in the drug-treated culture was subtracted from the shift of the paired control culture, in order to normalize for possible small shifts caused by the handling associated with drug treatment. For statistical analysis, the calculated shift of the drug was then tested against zero.
Amplitude
For each recorded culture, the amplitudes from 3 half-cycles were averaged immediately before treatment with drug or vehicle, and amplitudes from 3 half-cycles were averaged immediately after treatment. (The amplitude of 1 half-cycle is here defined as the difference in value between “peak and subsequent trough” or “trough and subsequent peak.”) The differences between amplitudes before and after treatment were then analyzed and plotted as percentage amplitude change.
Drugs
The following drugs were used in the experiments: sodium valproate (1 mM; Sigma-Aldrich, St. Louis, MO), trichostatin A (20 ng/mL; Sigma-Aldrich), lithium chloride (10 mM; Sigma-Aldrich), sodium chloride (as vehicle), EtOH (as vehicle) SP600125 (50 µM, JNK phosphorylation inhibitor; Sigma-Aldrich), bicuculline (50 µM, GABAA receptor antagonist; Tocris Bioscience, Bristol, UK), CGP52432 (10 µM, GABAB receptor antagonist; Tocris Bioscience), and UO126 (10 µM, MAPK inhibitor; Promega, Madison, WI). For co-treatments with VPA, SP600125, UO126, or CGP52432 + bicuculline was added to the culture dishes 15 min prior to VPA treatment.
Analysis of Histone Acetylation with Enzyme-Linked Immunosorbent Assay
Acetylated histones H3 and H4 were analyzed in fibroblast cultures with PathScan sandwich enzyme-linked immunosorbent assay (ELISA) kits (#7232 and #7238) according to the manufacturer’s manual (Cell Signaling Technology, Danvers, MA). Cultures were treated with TSA, VPA, lithium, or vehicle at time of PER2 protein trough expression. One, 2, 4, 6, and 8 h after treatment, the cultures were lysated, sonicated, and centrifuged and supernatants were removed and immediately frozen at −80 °C. For histone acetylation analysis, see the Methods section in the SOM.
Human Fibroblast Cultures
Cutaneous biopsies were obtained from the arms of consenting volunteers recruited at Karolinska University Hospital, Huddinge. Biopsies were minced and placed in 35-mm dishes (Corning, Inc., Corning, NY) under a sterile glass coverslip and cultured in DMEM GlutaMAXTM, 10 mM HEPES, 1x minimum essential medium (MEM) amino acids, 1 mM sodium pyruvate supplemented with 100 U/mL penicillin, 100 µg/mL streptomycin, and 15% fetal calf serum (all from Invitrogen, Paisley, UK), in a humidified 37 °C, 5% CO2 incubator. After 2 passages, cells were seeded into 35-mm culture dishes (Corning, Inc.). At confluence 2 to 3 days later, treatments were performed.
Extraction of RNA and Reverse Transcription
Total RNA was extracted from fibroblast cells using the RNeasy Mini kit (Qiagen, Hilden, Germany). The amount and purity of the RNA were assessed by spectrophotometry using a Nanodrop ND-1000 (NanoDrop Technologies, Wilmington, DE). See the Methods section in the SOM.
Real-Time PCR
One-µL cDNA templates were added to triplicate 25-µL reaction mixtures using Platinum SYBR Green qPCR Supermix UDG (Invitrogen). An ABI Prism 7500 real-time thermocycler was used (Applied Biosystems, Palo Alto, CA). Primers (Invitrogen) are provided in Supplemental Tables S1 and S2. Threshold cycle (Ct) values, from the exponential phase of the PCR amplification plot for each target transcript, were normalized to that encoding for cyclophilin E and glyceraldehyde-3-phosphate dehydrogenase (GAPDH). From these values, fold-differences in the levels of transcripts between individual untreated and treated cell cultures were calculated according to the formula 2−ΔΔCt (Livak and Schmittgen, 2001).
Statistical Analyses
Data are presented as mean ± standard error of mean (SEM). Differences between the groups were assessed by one-way analysis of variance (ANOVA), followed by the Dunnett multiple comparison test. All statistical analyses were performed by GraphPad Prism version 3.0 (GraphPad Software, La Jolla, CA). Differences were considered statistically significant at p < 0.05.
Results
Valproic Acid Phase Shifts the PER2::LUC Rhythm
In vehicle-treated cultures, SCN oscillated with an average period of 23.91 ± 0.13 h (n = 47). The period of cultures treated with VPA (24.03 ± 0.23 h, n = 22) did not differ from cultures treated with vehicle alone. VPA phase advanced the PER2::LUC rhythm by 4.24 ± 0.72 h (p < 0.001, n = 7) when administrated at ~ZT 0 and phase delayed the PER2::LUC rhythm with 3.43 ± 0.73 h (p < 0.05, n = 7) when added at ~ZT 12 (Fig. 1A,C, Fig. 4A). To further study the phase response of VPA treatment on SCN, we treated additional SCN cultures with VPA at ZT 6, 9, 18, and 21 (n = 4 at each time point). Altogether, the results showed that VPA phase advanced the SCN at ZT 0, 6, 9, and 21 and phase delayed the SCN at ZT 12 and 18 (see phase response curve in Fig. 2). The amplitude of SCN PER2::LUC oscillations was increased by VPA by 34% (p < 0.001; n = 40; Fig. 4C) when VPA was added at peak but not when added at trough (SOM Fig. S1).
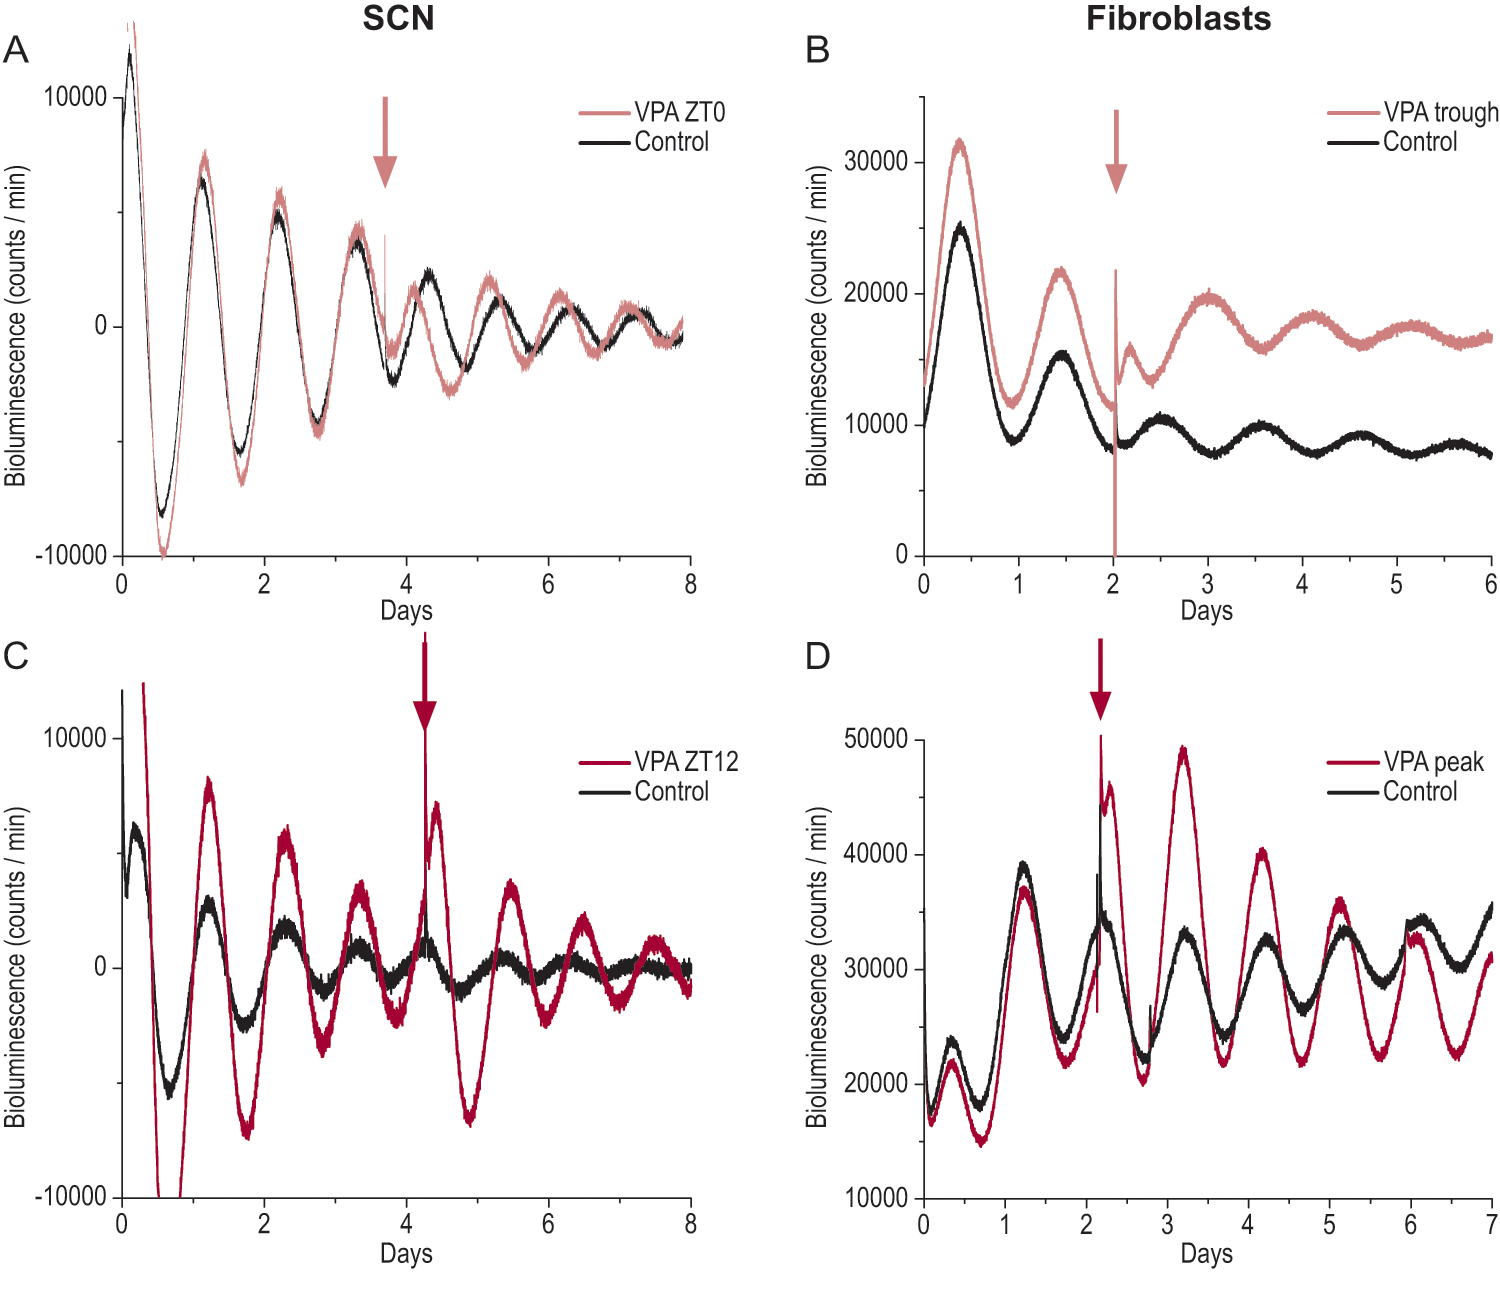
Valproic acid shifts the PERIOD2::LUCIFERASE (PER2::LUC) rhythm in the suprachiasmatic nucleus (SCN) and fibroblasts. (A, C) De-trended bioluminescence recordings of PER2::LUC expression in SCN slices. SCN cultures were treated with control vehicle or 1 mM valproic acid (VPA) at trough (A) or peak (C) of PER2::LUC expression at the fourth day in culture. (B, D) Bioluminescence recordings of PER2::LUC expression in primary fibroblast cultures. Cultures were treated with control vehicle or 1 mM VPA at trough (B) or peak (D) of PER2::LUC expression at the third day after starting bioluminescence recording. Arrows indicate times of control vehicle or VPA administration. Bars represent standard error of mean (SEM).
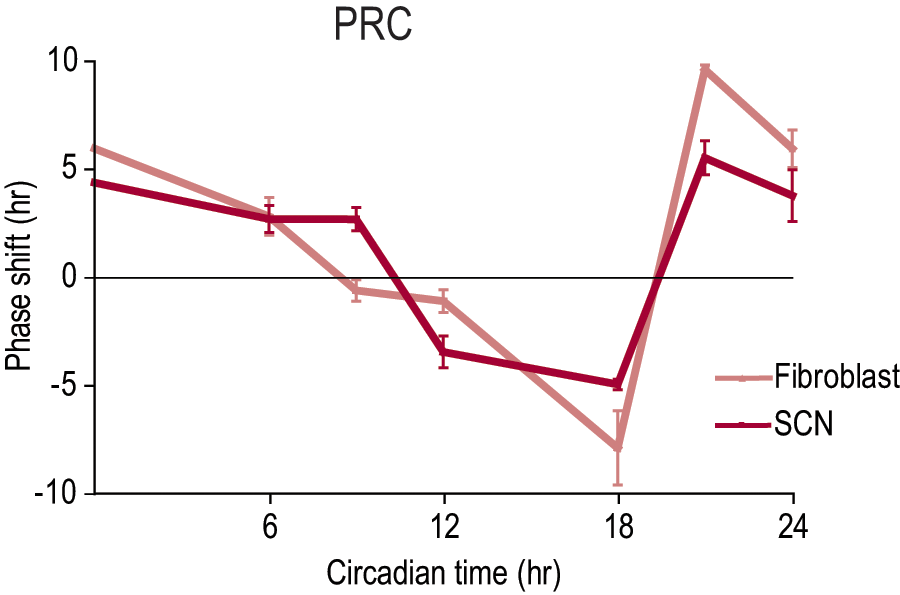
Phase response curves (PRCs) for valproic acid in the suprachiasmatic nucleus (SCN) and fibroblast cultures. Positive values represent phase advances; negative values represent phase delays. Bars represent standard error of mean (SEM).
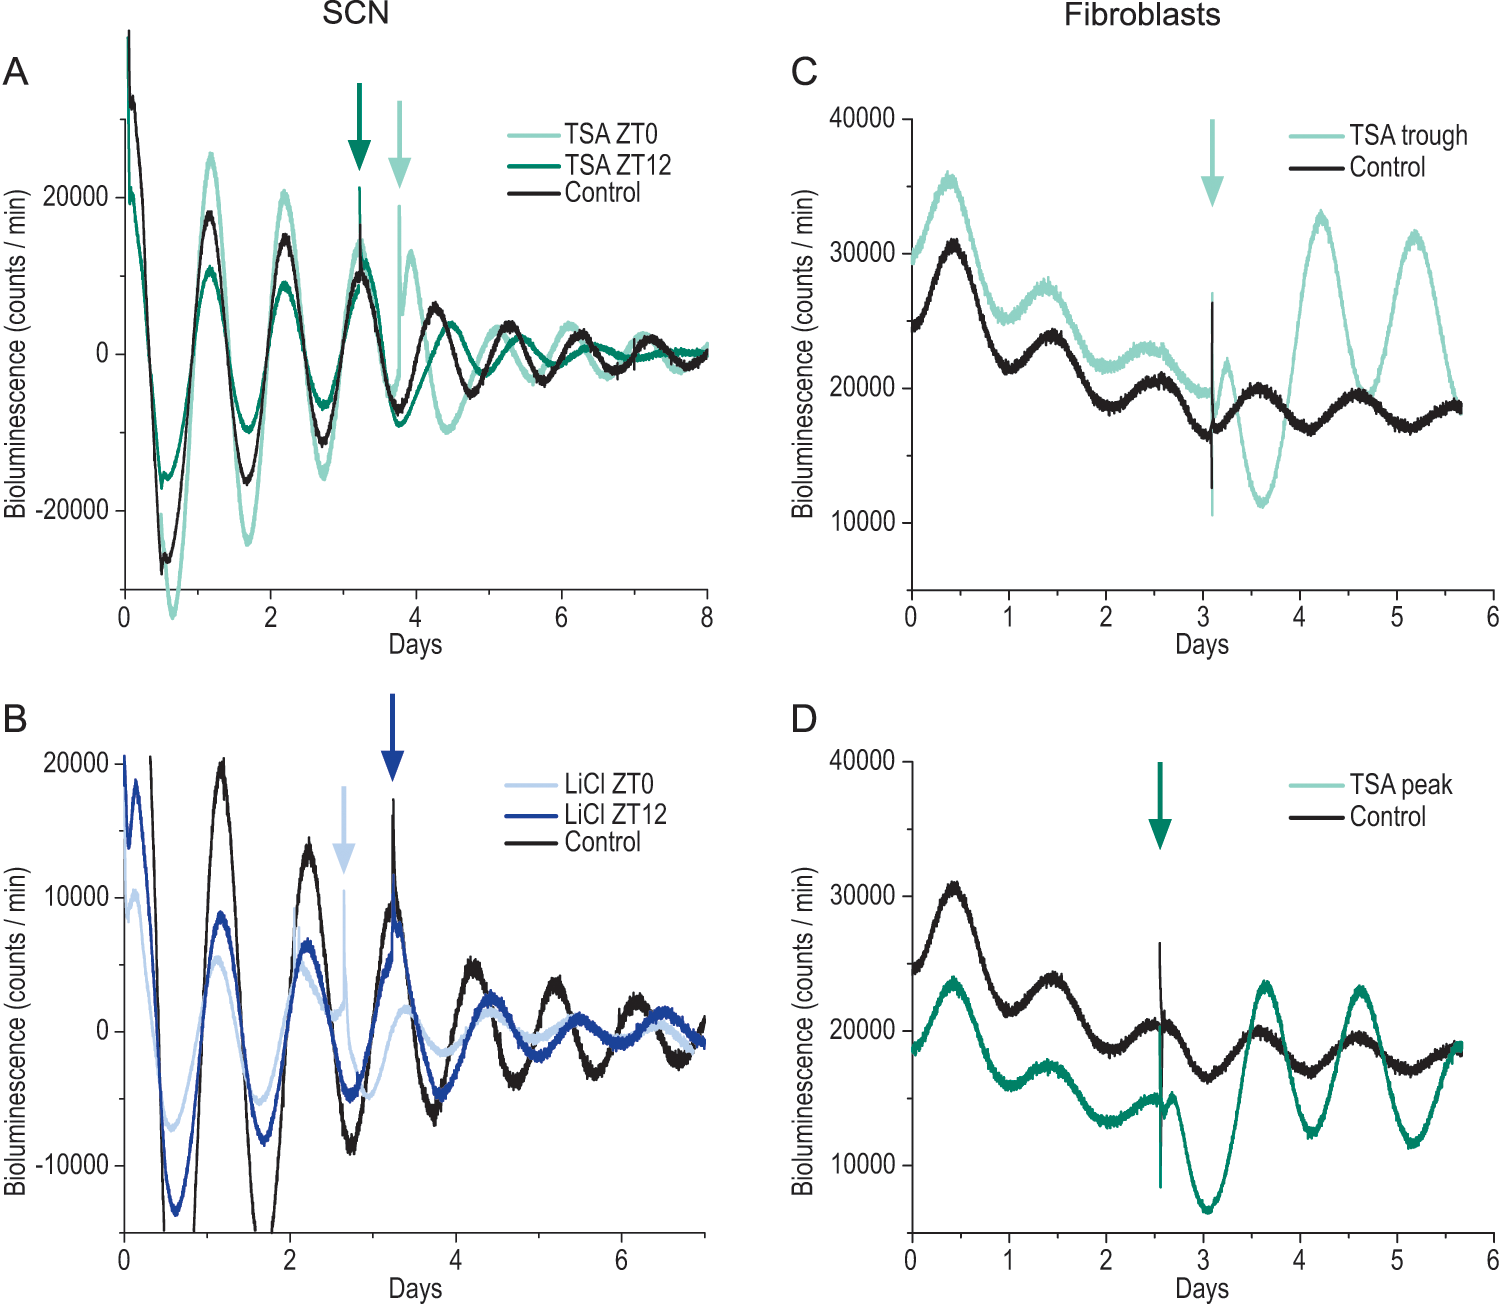
Effects of trichostatin A and lithium chloride on the PERIOD2::LUCIFERASE (PER2::LUC) rhythm. (A, B) De-trended bioluminescence recordings of PER2::LUC expression in suprachiasmatic nucleus (SCN) slices. The slice cultures were treated with control vehicle, 20 ng/mL of the histone deacetylation inhibitor trichostatin A (TSA) (A), or 10 mM lithium chloride (LiCl) (B) at ZT 0 or 12 the third or fourth day in culture. (C, D) Bioluminescence recordings of PER2::LUC expression in primary fibroblast cultures. The cultures were treated with control vehicle or 20 ng/mL TSA at trough (C) or peak (D) of PER2::LUC expression at the third day after starting bioluminescence recording. Arrows indicate times of control vehicle or drug administration.
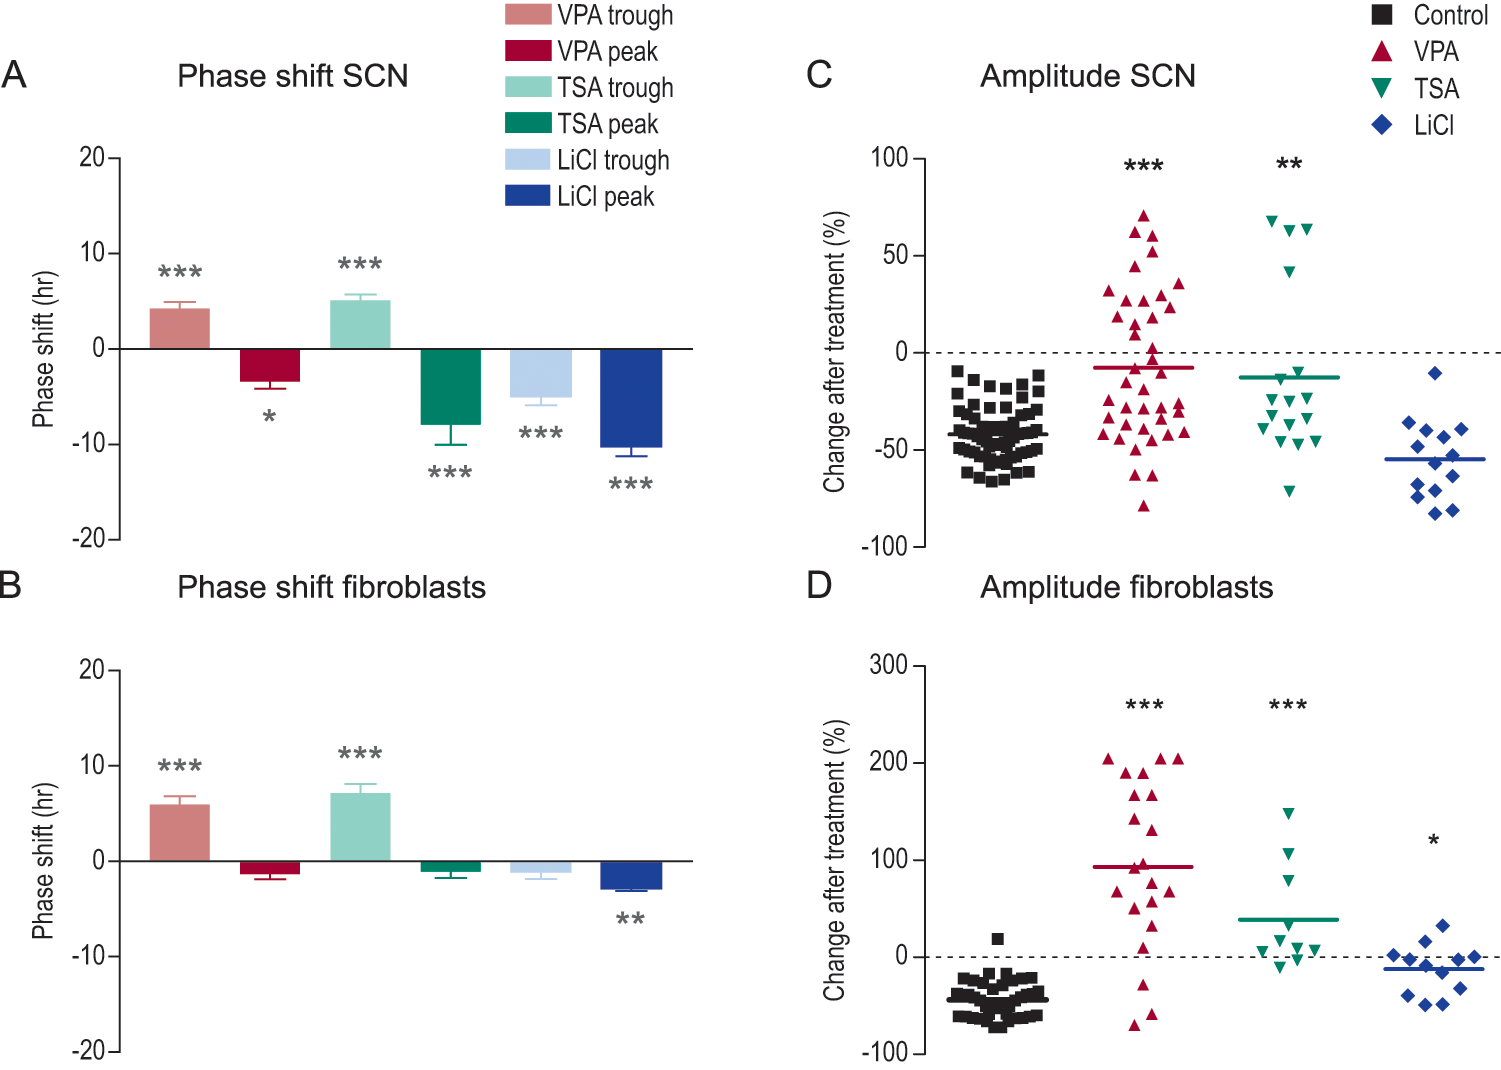
Phase-shifting and amplitude effects of valproic acid, trichostatin A, and lithium chloride. Phase shifts in cultures of suprachiasmatic nucleus (A) and fibroblasts (B) after administration of valproic acid (VPA, 1 mM), trichostatin A (TSA, 20 ng/mL), or lithium chloride (LiCl, 10 mM) at times of trough (~ZT 0) or peak (~ZT 12) expression of PERIOD2::LUCIFERASE. Positive values represent phase advances; negative values represent phase delays. Percent changes in amplitude after treatment with control vehicle, VPA, TSA, or LiCl in SCN (C) and fibroblasts (D). Horizontal bars represent mean values. Control levels of amplitude are negative because of the reduction in amplitude that normally takes place after a few days in tissue or primary cell culture. *p < 0.05. **p < 0.01. ***p < 0.001.
The average period in vehicle-treated fibroblast cultures was 24.96 ± 0.12 h (n = 40). The fibroblast cultures showed strong oscillations immediately after PMT recording in air-buffered culture medium started, without any other specific rhythm-triggering/synchronizing treatment (serum shock, forskolin, dexamethasone, etc.). The phase of the PER2::LUC rhythm was dependent on the time when the air-buffered medium was added (SOM Fig. S2). The period in VPA-treated fibroblast cultures (24.81 ± 0.29 h, n = 16) did not differ from cultures treated with vehicle. A similar but not identical phase-shifting effect of VPA as in SCN was observed in the fibroblast cultures (Fig. 2). VPA phase advanced the rhythm by 5.92 ± 0.87 h (p < 0.001, n = 8) when applied at CT 0 (Fig. 1B,D, Fig. 4B). At CT 12, there was a tendency for a small phase delay but was not statistically significant (n = 8). Altogether, VPA phase advanced at CT 0, 6, and 21; had no significant effect at CT 9 and 12; and phase delayed at CT 18. The amplitude of PER2::LUC oscillations in fibroblasts was increased by VPA by 137% (p < 0.001, n = 22; Fig. 4D), when added before, during, and after peak, but was not altered when added at trough (SOM Fig. S1).
Trichostatin A Phase Shifts the PER2::LUC Rhythm Similar to VPA
We treated SCN and fibroblast cultures with TSA. We reasoned that if VPA targets the same mechanism as TSA in our cultures, TSA would phase shift the PER2::LUC rhythm in a similar way as VPA. We found that TSA, similar to VPA, phase advanced the SCN PER2::LUC rhythm by 5.11 ± 0.60 h (p < 0.001, n = 9) when added at ~ZT 0 and phase delayed the rhythm by 7.92 ± 2.09 h (p < 0.001, n = 7) when added at ~ZT 12 (Fig. 3A). The average period in TSA-treated SCN (24.52 ± 0.17 h, n = 16) did not differ from vehicle (23.91 ± 0.13 h, n = 47). The amplitude was increased by 29% (p < 0.01, n = 17; Fig. 4C).
Similar patterns were observed when fibroblast cultures were treated with TSA, which phase advanced PER2::LUC rhythm by 7.15 ± 0.97 h (p < 0.001, n = 6) at trough and showed a trend toward a phase-delaying effect, although statistically not significant, when added at peak time (n = 7; Fig. 3C,D, Fig. 4B). The period was shortened (p < 0.01) in TSA-treated fibroblast cells (24.48 ± 0.92 h) as compared with vehicle 24.96 ± 0.12 h (n = 40). The amplitude of PER2::LUC oscillations was increased by 83% (p < 0.001, n = 10; Fig. 4D). No additional effects were observed in amplitude or phase when cell cultures were simultaneously treated with TSA and VPA at the same time point (n = 2) compared to cells treated with VPA (n = 2) or TSA (n = 2) alone.
Lithium Delays Phase and Lengthens the Period
Because lithium and VPA both are commonly used drugs for the treatment of bipolar disorder, we also examined the effect of lithium on the PER2::LUC rhythm to compare it with the effect of VPA. The clinically used concentration of 1 mM LiCl did not have any effect on the PER2::LUC rhythm, and 20 mM completely abolished the PER2::LUC rhythm in the SCN (data not shown). However, 10 mM LiCl lengthened the average period to 25.27 ± 0.37 h (n = 16, SCN, p < 0.01) and 25.29 ± 0.16 h (n = 20, fibroblasts, p < 0.05), as compared with vehicle (23.91 ± 0.13 h, n = 47, SCN; 24.96 ± 0.12 h, n = 40, fibroblasts). LiCl phase delayed the SCN rhythm both at ~ZT 0 and 12 with 4.93 ± 0.94 h (p < 0.001, n = 8) and 10.21 ± 1.00 h (p < 0.001, n = 9), respectively (Fig. 3B, Fig. 4A). In fibroblasts there was a trend toward a phase-delaying effect at trough (n = 8), although statistically not significant. In contrast, LiCl phase delayed by 3.15 ± 0.34 h at peak (p < 0.01, n = 8; Fig. 4B). LiCl did not increase the amplitude in SCN but increased the amplitude by 32% in fibroblasts (n = 16, p < 0.05; Fig. 4C,D).
Valproic Acid and Trichostatin A, but Not Lithium, Increase Histone Acetylation
Valproic acid, as TSA, is a potent histone deacetylation inhibitor (Gottlicher et al., 2001). Thus, the two substances increase levels of acetylated histones. We compared the amounts of acetylated histones H3 and H4 in fibroblast cultures after treatment with VPA or vehicle for 1, 2, 4, 6, and 8 h. Acetylation of H3 was increased after 1, 2, 4, 6, 8, and 24 h (p < 0.05, n = 5 at each time point for both VPA and vehicle). Acetylation of H4 was increased after 6 h but not after 1, 2, 4, 8, and 24 h. Acetylation of histones H3 and H4 was increased after 6 (n = 2) and 8 (n = 2) h of TSA treatment. LiCl did not affect acetylation on either histone H3 or H4 after 2, 4, and 6 h (n = 2 at each time point) (Fig. 5).
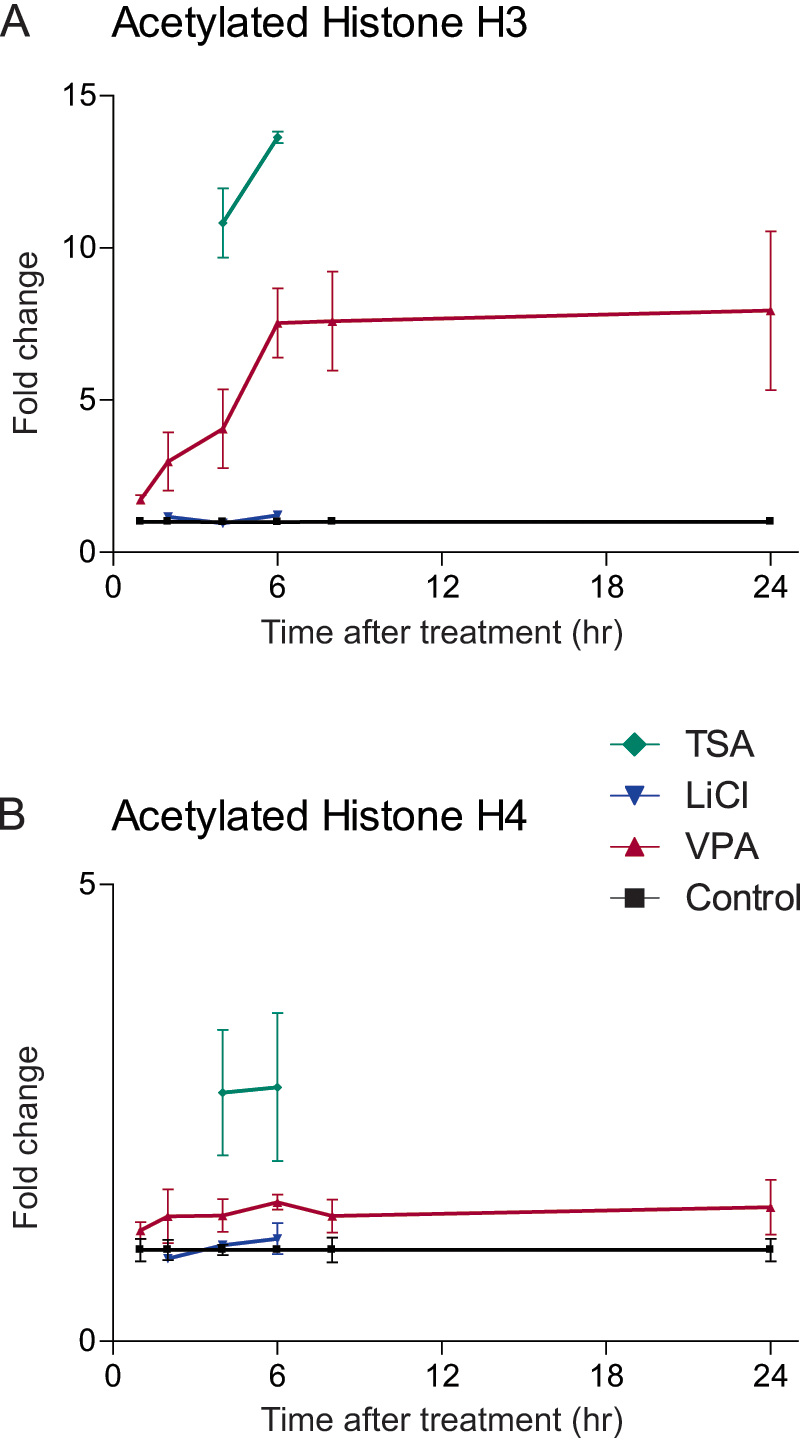
Effects of valproic acid (VPA), trichostatin A (TSA), and lithium chloride (LiCl) on histone acetylation. Change in acetylation levels of histone H3 (A) and H4 (B) in fibroblasts after treatment with control vehicle (H2O), valproic acid, trichostatin A, or lithium chloride. Acetylation levels were examined 1, 2, 4, 6, 8, and 24 h after treatment.
Inhibitors against GABA Receptors, MAPK Kinase, and JNK Phosphorylation Do Not Affect the Phase-Shifting Effect of Valproic Acid
Valproic acid also affects other signaling pathways. It increases GABA signaling by inhibiting GABA transaminase, phosphorylates JNK, and activates the MAPK kinase pathway (Chansard et al., 2007; Terbach and Williams, 2009). To investigate other possible mechanisms underlying the VPA-induced phase shifts, we treated cultures with VPA in the presence of GABAA and GABAB receptor antagonists (bicuculline + CGP52432; n = 4), MAP kinase inhibitor (UO126; n = 5), or a JNK phosphorylation inhibitor (SP600125; n = 5) to analyze if the phase shifts could be blocked by coadministration of any of these compounds. None of these co-treatments inhibited the VPA-induced phase shifts (SOM Fig. S3) or amplitude increases. When added individually, bicuculline + CGP52432 and UO126 had no effect on period (for period values, see legend to SOM Fig. S3), phase, or amplitude as compared with matched vehicle (SOM Fig. S3). However, the JNK phosphorylation inhibitor SP600125 added alone lengthened the average period to 30.91 ± 0.72 h (p < 0.05, n = 5), as compared with vehicle (24.96 ± 0.12 h, n = 40). SP600125 together with VPA increased the circadian period to 30.72 ± 0.77 h (p < 0.05) as compared with vehicle but not compared to SP600125 alone (SOM Fig. S3E,F). Compared to vehicle (−34.4% ± 9.25%), the amplitude of PER2::LUC oscillations was increased by SP600125 alone by 165.3% ± 84.7% (p < 0.05, n = 5). When cultures were simultaneously treated with SP600125 and VPA, the amplitude was increased by 173.5% ± 90.2% (p < 0.05). Matched VPA treatment alone increased the amplitude with 56.1% ± 9.31%.
Effects of Valproic Acid on Other Clock Genes in Mouse and Human Fibroblasts
To investigate if VPA affects other clock genes, confirm the results obtained with luciferase reporter technology, and confirm the effect in human cells, we treated mouse and human fibroblast cultures with VPA for 1 to 2 h and then analyzed the expression of mPer1, mPer2, mCry1, mBmal1, mClock, mRora, hPer1, hPer2, hCry1, hCry2, hBmal1, and hClock using real-time PCR. No difference in gene expression was observed after 1 h VPA treatment; however, after 2 h VPA treatment, mPer2, mCry1, hPer1, hPer2, hCry2, and hBmal1 were significantly increased as compared with controls (SOM Fig. S4).
Discussion
Valproic Acid and Lithium Exert Different Effects on the Molecular Rhythm
In the clinics, lithium (plasma levels 0.6-1 mM) or valproate (300-700 mM; 40-100 mg/L) (Burgess et al., 2001; Grunze et al., 2009, 2010; Macritchie et al., 2001) is often chosen as a mood-stabilizing medication for patients suffering from bipolar disorder and may also affect the sleep and rhythm pattern. In our study, VPA had a distinct effect on the molecular rhythm compared to the period-lengthening effect of lithium. In contrast to the effects of VPA, lithium affects cAMP-mediated signaling and CREB binding (Jope, 1999) and inhibits phosphomonoesterases such as inositol monophosphatase (York et al., 1995). Both VPA and lithium increase B cell lymphoma 2 expression (Chen et al., 1999b), affect the arachidonic acid cascade, increase expression of brain-derived nuclear factor, and affect glycogen synthase kinase (GSK) 3b (Chen et al., 1999a; Quiroz et al., 2010). The partly differential mechanistic effects of the two drugs may explain the different effects of VPA and lithium observed in our study.
Valproic Acid Phase Shifts and Increases Amplitude Differentially Depending on Circadian Time
In contrast to lithium, VPA had a significant time-dependent phase-shifting effect on both SCN and fibroblast cultures without an effect on period. In contrast to the findings in our study, Dokucu et al. (2005) found in Drosophila that VPA, as well as lithium, lengthened the circadian locomotor activity period and increased arrhythmicity. The difference between the effects of VPA in the Drosophila study and ours could partly be explained by the different protocols used; Dokucu et al. administered the drugs ad libitum in the food and not at selected time points.
In the present study, the phase response curves (PRCs) for 1 mM VPA were similar in SCN and fibroblasts, but with the difference that at CT 9 to 12, the fibroblast PRC showed a nonresponsive interval (“dead zone”), and SCN PRC showed significant phase delays. The PRCs for VPA were of “type 1” in both SCN and fibroblasts—that is, the slope of the phase transition curve is closer to 1, and the new phase is thus dependent on the circadian time of treatment, the “old phase” (Johnson, 1992). Interestingly, as for the phase, amplitude increase was also dependent on time of VPA administration. The amplitude increase was most significant when VPA was added at peak, and in contrast, no amplitude increase was observed when VPA was added at trough, suggesting that the effect on amplitude, although sustained during several cycles, is to a large extent an initial phenomenon that is dependent on the circadian phase. Histone acetylation was still highly elevated after 24 h in the culture medium, but because global histone acetylation was significantly increased when VPA was added at trough (when little or no amplitude increase was detected), we do not think it is likely that increased histone acetylation alone causes the amplitude increase. However, our results do not suggest that any of the other mechanisms examined in this study underlie the VPA-induced amplitude increase.
VPA May Exert Phase-Shifting Effects on PER2::LUC Expression by Inhibiting Histone Deacetylation
Because (1) acetylated histone H3 was significantly increased after VPA administration in fibroblast cultures, (2) TSA (but not GABA receptor antagonists, JNK phosphorylation antagonist, or MAP kinase inhibitor) had similar phase-shifting effect as VPA on the PER2::LUC rhythm, and (3) GABA receptor, MAP kinase, and JNK phosphorylation antagonists did not inhibit VPA-induced phase shifts or amplitude increases, we suggest that VPA, in contrast to lithium, affects the phase of the PER2::LUC rhythm by inhibiting HDAC. However, we are not certain why co-treatment with TSA + VPA did not give an additive effect on PER2::LUC amplitude and phase. If the hypothesis is correct that both drugs act on the PER2::LUC by inhibiting histone deacetylation, we speculate that there is a saturation level of HDAC inhibitors in terms of effects on PER2::LUC amplitude and phase, which could explain why TSA + VPA together did not cause a greater effect. However, it should be emphasized that we cannot fully exclude other, perhaps additional, possible mechanisms causing the effects on the PER2::LUC rhythm. Nevertheless, the possible involvement of histone acetylation and deacetylation in phase shifting is not unlikely since clock gene expression is coupled to circadian fluctuations in histone changes (Crosio et al., 2000; Etchegaray et al., 2003; Naruse et al., 2004; Ripperger and Schibler, 2006), and a recent mechanism involving histone deacetylation has been reported for negative feedback within the PER complex (Duong et al., 2011). In accordance with our results, Naruse et al. (2004) showed that TSA phase shifted the Per1 rhythm in fibroblast NIH 3T3 cells when TSA was administered in the culture 4 h after serum shock. Furthermore, in the study by Naruse et al., TSA induced expression of Per1 and Per2 in the SCN in vivo, which is consistent with our results that show increased amplitude of PER2::LUC expression after TSA and VPA administration, as well as increased Per1 and Per2 mRNA in fibroblasts after VPA treatment.
The question of how inhibited histone deacetylation can cause both phase delays and phase advances remains. Histone acetylation affects a number of genes and presumably not only Per2. Indeed, we observed an upregulation of several clock gene transcripts after VPA treatment, confirming that not only the Per2 expression is affected. One example of how acetylation and deacetylation are involved in control of circadian rhythmicity is the finding regarding the involvement of the nicotinamide-adenine-dinucleotide (NAD+)–dependent deacetylase SIRT1 (sirtuin 1; silent mating type information regulation 2 homolog 1) in circadian rhythmicity. SIRT1 directly deacetylates PER2 (Asher et al., 2008), and SIRT1 thereby counterbalances the activity of the histone acetyltransferase CLOCK (Doi et al., 2006; Nakahata et al., 2008), thus providing a regulatory mechanism of clock-controlled gene expression. However, SIRT1, belonging to the class III HDAC, is most likely not the target of the VPA/TSA action as VPA/TSA inhibits class I and II HDAC. Because VPA/TSA presumably increases gene expression by inhibiting histone deacetylation, we speculate that when VPA/TSA is administered at a time of lower PER2 protein expression, VPA/TSA phase advances the PER2 rhythm by increasing gene transcription, thus producing a protein peak “too early” in the cycle. If this hypothesis is correct, drug administration at the time of higher protein expression could delay the time of high, already saturated gene expression, thus “prolonging” the protein peak and delaying the rhythm, as observed in SCN; alternatively, it should not have as strong an effect because the system is already partly “saturated” with high levels of PER2 (and other clock gene proteins). Indeed, we did not observe any large phase-delaying effect when VPA or TSA was administered at protein peak in the fibroblast cultures. However, considering how complex the molecular clock machinery is with all its interactions, the total effect is probably far more complicated than that and therefore difficult to predict. The reason for the difference in phase response after VPA or TSA treatment in SCN versus fibroblast at ZT 12/protein peak is unclear, but it is possible that histone acetylation and deacetylation can be modified by ion channel activities in the SCN synaptic network, thus producing a slightly different phase response. This hypothesis is supported by the study by Naruse et al. (2004), who found that light pulses transmitted via the glutamatergic retinohypothalamic tract induce Per1 and Per2 histone acetylation in the SCN.
Use of VPA and Lithium in the Clinic
Bipolar patients have been suggested to be more easily phase shifted because of increased sensitivity to light (Lewy et al., 1985). Light inhibits release of the pineal hormone melatonin, and it has been found that VPA decreases the melatonin sensitivity to light in bipolar patients (Hallam et al., 2005). Hypothetically, the decreased melatonin response to light caused by VPA in the study by Hallam et al. (2005) could be due to VPA inhibiting HDAC, as light pulses lead to nuclear responses that affect the chromatin (Crosio et al., 2000), and light-induced clock gene transcription is dependent on histone acetylation and deacetylation (Naruse et al., 2004). Even if a comparison between mouse in vitro and human in vivo experiments is a far stretch, in contrast to our study, Hallam et al. did not find evidence for a possible phase-shifting effect of VPA. However, in the protocol by Hallam et al., VPA was given twice a day, once in the morning and once in the evening, corresponding to time points that, according to our findings, result in phase shifts in opposite directions.
If the cellular response in humans is similar to the response in mice, as the analyses of clock gene expression in VPA-treated human fibroblasts suggest, the finding that lithium and VPA have different effects on phase could possibly have importance for the choice of drug to patients depending on “chronotype.” Furthermore, VPA could hypothetically be used as a phase-shifting agent in individuals who are diagnosed with a misaligned circadian rhythm. Lithium, in contrast to VPA, lengthened the circadian PER2::LUC period, consistent with the recent findings by Osland et al. (2011), which also could play a role in individual response to the two different drugs. It has been demonstrated that different chronotypes (e.g., “larks” and “owls”) have differences in fibroblast clock gene expression (Brown et al., 2008). It is therefore possible that also certain genetic diseases, such as bipolar disorder, may involve alterations in clock gene rhythm period and amplitude. Indeed, reduction in clock gene amplitudes has recently been described in fibroblast cell lines derived from bipolar patients (Yang et al., 2009). It is not clear how altered amplitude in circadian rhythmicity affects the individual’s physiology, but old rodents have been reported to show reduced amplitude in clock gene expression (Kolker et al., 2003) and electrical SCN activity (Aujard et al., 2001), and aging is associated with deterioration of circadian rhythmicity. It is therefore not unlikely that reduced amplitudes in clock gene expression could be associated with rhythmic deterioration in patients afflicted with affective disorders. In context of the present study, this is of interest because both lithium and VPA increased the amplitude of PER2::LUC oscillations in fibroblasts, thus providing a possible “restoring” and “boosting” function of decreased clock gene amplitudes in peripheral cells.
In summary, we have demonstrated that VPA is a potent phase-shifting agent that can phase shift the molecular clock in different directions depending on time of exposure. Furthermore, VPA increases the rhythm amplitude at selected circadian time points. Our data suggest that VPA phase shifts the molecular clock via its histone deacetylation-inhibiting effect. We have shown that the VPA impact on the molecular clock is significantly different from lithium’s period-lengthening effect, which may be of significant importance when treating patients with mood stabilizers.
Footnotes
Acknowledgements
This study was supported by The Swedish Medical Research Council (2007-1910, 2008-3197); The Swedish Medical Nanoscience Center, FONCICYT 000000000091984; the foundations of Söderström Königska sjukhemmet, Märta Lundqvist, Thuring, Wolff, Bergwall, Golje, and Jeansson; and the Swedish Society of Medicine. We thank Lukas S. Keller for synchronizing fibroblasts in Supplemental Figure S2, Dr. Ola Hermanson for advice regarding the histone analysis experimental protocol, Dr. Jos Rohling for valuable comments on the manuscript, and Karsten Schmitz Photo & Design for the layout of the figures.
The author(s) have no potential conflicts of interest with respect to the research, authorship, and/or publication of this article.
Notes
References
Supplementary Material
Please find the following supplemental material available below.
For Open Access articles published under a Creative Commons License, all supplemental material carries the same license as the article it is associated with.
For non-Open Access articles published, all supplemental material carries a non-exclusive license, and permission requests for re-use of supplemental material or any part of supplemental material shall be sent directly to the copyright owner as specified in the copyright notice associated with the article.