
Abstract
Circadian rhythms are driven by daily oscillations of gene expression. An important tool for studying cellular and tissue circadian rhythms is the use of a gene reporter, such as bioluminescence from the reporter gene luciferase controlled by a rhythmically expressed gene of interest. Here we describe methods that allow measurement of circadian bioluminescence from a freely moving mouse housed in a standard cage. Using a LumiCycle In Vivo (Actimetrics), we determined conditions that allow detection of circadian rhythms of bioluminescence from the PER2 reporter, PER2::LUC, in freely behaving mice. The LumiCycle In Vivo applies a background subtraction that corrects for effects of room temperature on photomultiplier tube (PMT) output. We tested delivery of d-luciferin via a subcutaneous minipump and in the drinking water. We demonstrate spikes in bioluminescence associated with drinking bouts. Further, we demonstrate that a synthetic luciferase substrate, CycLuc1, can support circadian rhythms of bioluminescence, even when delivered at a lower concentration than d-luciferin, and can support longer-term studies. A small difference in phase of the PER2::LUC bioluminescence rhythms, with females phase leading males, can be detected with this technique. We share our analysis scripts and suggestions for further improvements in this method. This approach will be straightforward to apply to mice with tissue-specific reporters, allowing insights into responses of specific peripheral clocks to perturbations such as environmental or pharmacological manipulations.
Circadian rhythms arise from cycles of gene expression that occur in cells throughout the body. These cellular rhythms can be observed using a transgenic mouse with a circadian clock promoter or protein, linked to a reporter that generates signal as fluorescence or bioluminescence. The mPer2Luc mouse, created in the laboratory of Joseph Takahashi (Yoo et al., 2004), has allowed many major advances in our understanding of circadian biology, largely through studies conducted using explant culture techniques. The transgene in this animal produces a fusion protein linking PERIOD2 (PER2) with firefly luciferase. Firefly luciferase, when provided with a substrate such as d-luciferin, will emit light (bioluminescence; for an overview, see Shimomura, 2012).
Bioluminescence has several advantages compared to fluorescence for long-term studies, including low phototoxicity and very low background noise (Troy et al., 2004). Studies of bioluminescence in tissue explants can reveal cellular activity, but can often only assess isolated tissues outside their natural physiochemical environment. In addition, in some circumstances, the time of dissection for tissue preparation can reset the phase of cellular circadian clocks (Noguchi et al., 2020; Leise et al., 2020), thereby limiting the comparison of circadian phase recorded in vitro to the preceding phase in vivo. More complex interactions between tissues are best studied within a living intact animal.
To address these challenges, we and others have explored methods for recording bioluminescence in vivo. One approach is to use anesthetized animals, detecting bioluminescence using a camera-based system. This approach has been used to assess the phase of peripheral tissue rhythms (Tahara et al., 2012) but has the unavoidable disadvantage of repeated general anesthesia. Anesthesia has been shown to disrupt circadian rhythms in body temperature and in rest/activity cycles, and may inhibit photic entrainment of the circadian clock (Poulsen et al., 2018). The method also requires bioluminescence assessments at six to nine time points, each requiring experimenter presence, over 24-36 h for a single circadian phase assessment. A second approach is to record bioluminescence from freely behaving mice, detecting light emission using sensitive photomultiplier tubes (PMTs). Here we build on the pioneering work from the Schibler laboratory (Saini et al., 2013) that demonstrated the feasibility of recording light emitted from a mouse in a specialized housing chamber, the “RT Biolumicorder” (LESA Technology). In their work, rhythmic signal was detected from bioluminescent reporters directed to the liver using viral transduction in hairless mice, as well as in mPer2Luc C57BL/6 mice with fur removed from the dorsal region. In addition to establishing feasibility of the method, the system was used to control food availability and provide lighting regimens for studies of entrainment. Some areas of further research are to develop a system that allows housing in standard cages, to test nonsurgical methods for delivery of d-luciferin, and to test synthetic luciferins that may offer increased sensitivity (Evans et al., 2014).
We present here results from studies of PER2::LUC bioluminescence in C57BL/6J mice (both black and albino), recorded in standard housing cages within the “LumiCycle In Vivo” system (designed for these experiments by Actimetrics Inc.). We compare two methods of delivery for the substrate: delivery through drinking water and using subcutaneous osmotic minipumps. In addition, we assessed whether a synthetic luciferin, CycLuc1 (Evans et al., 2014; Reddy et al., 2010), can offer advantages as a substrate in these experiments. In the course of this work, we encountered several methodological challenges and address here how they may be overcome. We believe that these methods could be widely adopted and could also be improved through further innovation. Ultimately, we predict the field of circadian biology will benefit from expanded use of unrestrained, in vivo, bioluminescence recordings.
Methods
The LumiCycle In Vivo
Bioluminescence was measured using the “LumiCycle In Vivo” system, designed by David Ferster (Actimetrics). The system can record luminescent emissions from freely behaving animals housed in a standard mouse cage placed within a light-tight chamber (Suppl. Fig. S1).
Each unit contained two PMTs (Hamamatsu H8259-01, selected for low dark counts and positioned for sensitivity across the cage area), and was equipped with programmable LED lights, and a high-capacity internal fan that provided 15 air changes per hour. A simple sum of the two PMT counts (corrected for dark counts as described below) was used as the signal (Suppl. Fig. S2). A programmable shutter periodically blocked the PMTs and allowed the collection of dark counts. In the studies reported here, dark counts were measured every 15 min by closing the shutter for 1 min. Each dark count value was subtracted from the counts recorded during the subsequent 14 min to obtain the background-corrected count values. This was necessary to remove the effect of external temperature fluctuations on PMT noise. Temperature alters the PMT dark counts, but not PMT sensitivity (https://www.hamamatsu.com/resources/pdf/etd/PMT_handbook_v4E.pdf). Prior to this correction, we observed noise highly correlated to temperature (R2 = 0.96; see Figure 1) and less so with humidity (R2 = 0.30). One degree Celsius of chamber ambient temperature increase was associated with an increase of circa 35 counts/s. A chamber history for all recording units was collected, to monitor temperature, relative humidity, and light measures within each unit. Animal welfare was checked once a day at varied times using an infrared viewer (Carson OPMOD DNV 1.0), or goggles (Pulsar Edge Night Vision Goggles PL75095).
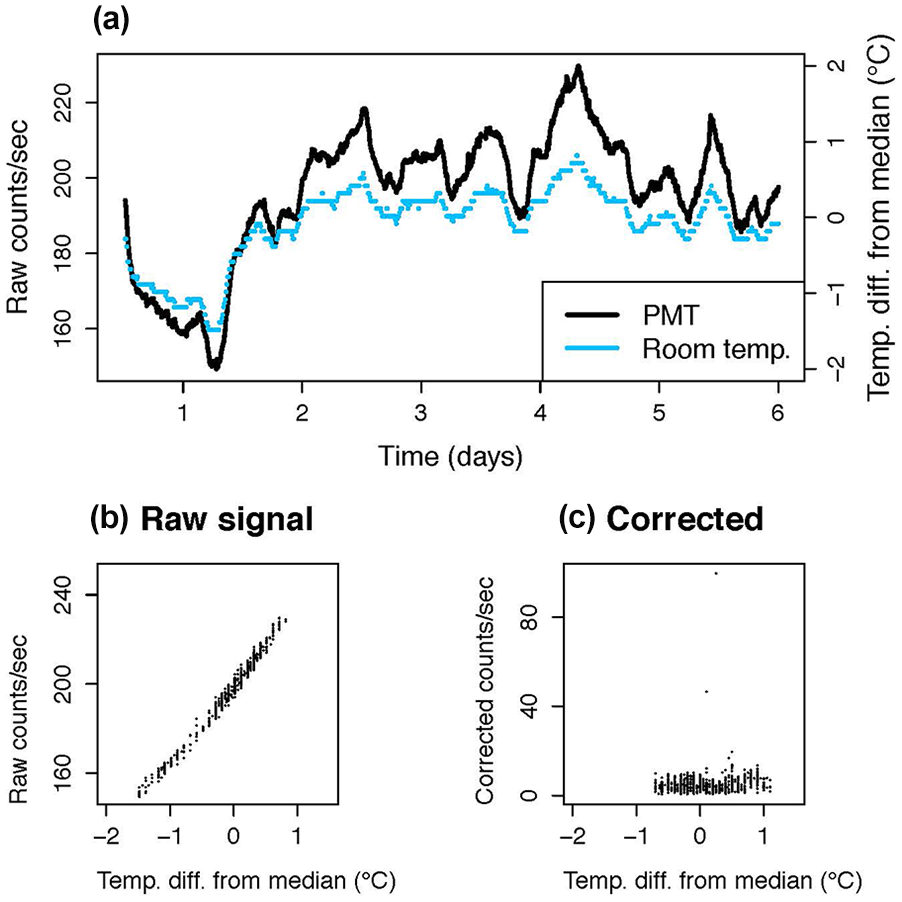
Fluctuations in room temperature impact photomultiplier (PMT) output, as shown in a recording from an empty recording chamber with no animal present over 5 days with extreme temperature variations. This is corrected by subtracting dark counts in the LumiCycle In Vivo (Actimetrics) as shown in (c). (a) Raw photomultiplier tube output (black line) tracks room temperature (shown in blue dotted line) prior to adding the capability for dark count subtraction. (b) Same data as in (a) plotted to demonstrate the tight correlation. (c) Following installation of software to collect background readings every 15 min and subtract these from prior PMT outputs, effects of room temperature fluctuations are corrected (compare [c] to [b]). Abbreviation: PMT = photomultiplier tube.
Animals
For initial studies conducted at Smith College, homozygous mPer2Luc/Luc male and female mice animals were bred in-house from founders obtained from Jackson Labs (JAX #006852) (Yoo et al., 2004). Mice ranged in age from 4.5 to 8 months. We chose homozygous mice to maximize luciferase expression.
Mouse (IVIS) imaging studies were conducted at the University of Massachusetts Chan Medical School, and employed either FVB/NJ mice purchased from Jackson Laboratories and given intravenous injection of AAV9-CMV-WTluc2 as previously described (Mofford et al., 2015) or, in separate studies, mice with a single copy of the PER2::LucSV allele (Welsh et al., 2004; Yoo et al., 2017). The latter mice are referred to as mPer2LucSV/+ to distinguish them from the homozygous mice used elsewhere.
Studies of albino C57BL/6J reporter mice used mice bred at the University of Massachusetts Medical School, and tested at Smith College. These mice were albino C57BL/6J background (JAX #000058), and carried one or two reporter alleles (mPer2LucSV/+ or mPer2LucSV/LucSV). Both male and female mice were used.
All animal studies were approved by the Institutional Animal Care and Use Committees of the appropriate institution.
Delivery of Substrates by Subcutaneous Osmotic Minipump
A delivery method that can provide continuous dosing is to use a subcutaneous osmotic minipump. Prior studies have reported mixed results with similar methods (Gross et al., 2007; Saini et al., 2013; Hamada et al., 2016). We determined that 100 mM was close to the limit of solubility for d-luciferin in our conditions and therefore tested this concentration in both 7- and 14-day Alzet osmotic minipumps (models 1007D and 1002, respectively) to vary the rate of delivery (0.5 and 0.25 uL/h). A total of 100-mM d-luciferin was prepared in sterile 0.1-M sodium phosphate buffer (PB) and mixed on an Eppendorf ThermoMixer (Thermo Fisher Scientific, Waltham, MA) at 37 °C for 2 min at 1500 r/min. Following surgery to implant an osmotic minipump subcutaneously, we allowed 3-days recovery before initiating bioluminescence recording (see Suppl. Methods for details).
A synthetic luciferin, CycLuc1, has been shown in prior studies to offer better distribution throughout the body and greater light emissions at lower concentrations (Evans et al., 2014). We tested whether this synthetic luciferin could provide comparable or superior results to d-luciferin when delivered via an osmotic pump. CycLuc1 (produced in the lab of Dr. Stephen Miller, University of Massachusetts Chan Medical School, Worcester, MA) was prepared in a 5-mM solution in sterile 0.1-M phosphate-buffered saline (PBS) and was mixed as for d-luciferin. Both 7- and 14-day pumps were tested.
In the initial experiment, the bioluminescence data were collected until day 9 for 7-day pumps and until day 11-13 for 14-day pumps. After removal, any residual volume remaining in pumps was measured to check against the expected rate of delivery, and any changes in the appearance of the solution were noted. Data files were truncated if necessary to remove measures taken after calculated pump depletion. In the subsequent experiment, each animal received only one pump implant, a 14-day pump with CycLuc1.
Each animal underwent two minipump trials using the procedures described above. The two pump implantation surgeries were separated by 28 days and within each group of surgeries, pump volumes were selected in a counterbalanced design. Each animal received the same substrate on both occasions, with only the pump type (7 or 14 day) differing.
Delivery of Luciferin by Drinking Water
A technically simple manner of substrate delivery is to provide the compound in the drinking water. A prior study suggested this approach of substrate delivery would be feasible (Hiler et al., 2006). This approach depends on the availability of a reasonably inexpensive substrate in appropriate amounts, solubility, acceptability by the mouse, and low toxicity. For our initial experiments, d-luciferin, potassium salt (LUCK-1G, GoldBio, St Louis, MO) was selected. Major advantages of this approach are the potential to conduct long-term studies with fresh solutions provided at regular intervals, and the avoidance of surgical procedures. A concern with administration of substrate in the drinking water is the possibility that the rhythmic behavior of drinking would lead to rhythmicity in substrate ingestion and availability, thus producing bioluminescence rhythms that reflect drinking behavior rather than reporter gene expression.
To study dose response to d-luciferin through drinking and reversibility, each mouse was tested for approximately 3 days at each concentration. We tested 10, 0, 1, and 5 mM of d-luciferin, in that order. Solutions were made by dissolving powdered d-luciferin in water in 50-mL conical tubes, vortexing 1-2 min to dissolve particulate and then protected from light. Experiments were thereafter conducted in constant darkness. Drinking was monitored by measuring residual volume and all doses were equally tolerated by the mice tested. An additional 3-day experiment with 0-mM d-luciferin was conducted 5 weeks later, to test baseline levels when it was certain that no substrate remained within the animal after prior exposure. On the first day of this experiment as well as immediately prior to the recording conducted 5 weeks later, animals were anesthetized briefly (circa 5 min) in an induction chamber at 3% isoflurane followed by placement in a nose cone to allow shaving of back and abdomen (see Suppl. Fig. S3). Animals were put into the LumiCycle In Vivo unit at the end of the light portion of the 12:12 LD cycle and were thereafter recorded in constant darkness. The bottle of d-luciferin was changed to the new dose every 3 days between CT 6 and CT 11. Mice drank on average 3.9 mL/day.
To determine if mice showed an aversion or preference for the two substrate solutions, we offered 8 mice (4 males) the opportunity to drink from two tubes presented simultaneously for 48 h in their home cage while single housed in constant darkness. They were offered 10 ml in each drinking tube, and after 24 h, the tubes were switched in left-right positions. All mice were preexposed to the substrate solutions. Mice were then offered either CycLuc1 or d-luciferin vs water, in a counterbalanced order, and then all mice were offered a choice between CycLuc1 and d-luciferin.
To compare d-luciferin and CycLuc1 delivered in drinking water, four mice were tested using an ABA design with 0.1-mM d-luciferin, 0.1-mM CycLuc1, and a second treatment of 0.1-mM d-luciferin. Treatments were given for approximately 3 days each, with approximately 1 day with plain water available in between each treatment. Mice were given CycLuc1 for 4 days, due to a circa 1-day equipment failure during this experimental run. Bioluminescence was measured in DD using the LumiCycle In Vivo unit, and volume consumed was monitored by noting initial and final water volumes.
To better understand the correspondence between behaviors and bioluminescence, we conducted experiments with mice housed in a cage designed to allow measures of contact with the drinking tube (see Suppl. Methods). For these experiments, we delivered CycLuc1 (0.1 mM; MedChemExpress, Monmouth Junction, NJ) or d-luciferin (5 mM) in the drinking water for up to 9 days in constant darkness using albino Per2LucSV/+ mice.
Assessment of the Source of Bioluminescence by IVIS Imaging
mPer2LucSV/+ mice were allowed ad libitum access to drinking water containing d-luciferin (2 mM, n = 10 or 0.1 mM, n = 6) or CycLuc1 (0.1 mM, n = 10) for at least 12 h before study. Another group of animals (n = 7) had water available and received d-luciferin by injection (0.1 mL of 10 mM, ip). Separately, we examined results from mice both while intact and also while surgically anesthetized with ketamine/xylazine and the abdomen opened to reveal signal source more clearly, using mice either administered d-luciferin ip (0.1 mL of 10 mM, n = 3), d-luciferin in the drinking water (2 mM, n = 5), CycLuc1 in the drinking water (0.1 mM, n = 5), or CycLuc1 by acute oral administration (0.05 mM [in 50% apple juice]), n = 2. Animals were studied at clock times at which elevated bioluminescence was expected based on our previous studies (ZT15-21, van der Vinne et al., 2018). Mice were anesthetized with isoflurane, as well as ketamine/xylazine when dissected, removed briefly to be shaved, and images were captured of ventral and dorsal views using Living Image software on an In Vivo Imaging System (IVIS-100, Caliper, now Perkin Elmer) in the UMass Chan Medical School Small Animal Imaging Core Facility. Quantitative analysis of bioluminescence was performed using Living Image 4.4 software.
Data Analysis
All data were analyzed using RStudio, with the exception of the Bayesian MCMC analysis, which was run in MATLAB. Data files and R code are posted on Open Science Framework (https://osf.io/shgbv/). A discrete wavelet transform (DWT) was applied to each time series to detrend and to calculate the rhythm phase using the wavelets R package (https://cran.rstudio.com/web/packages/wavelets/index.html), as described in Leise and Harrington (2011) and Leise (2017). We applied the la12 filter on 15-min median binned data; medians were used to reduce the effect of large outliers. Data before the first trough and after the last trough were discarded to avoid edge effects.
The signal-to-noise ratio (SNR) in decibels was calculated for 2-day windows, starting at the first trough (dropping most of the first day of recording), as 10 times the log10 of the ratio of the sum of squares of DWT circadian component D6 to the sum of squares of all DWT components at least 2 levels below the circadian scale (D1-D4). The level immediately below circadian (D5) contains an inseparable mix of circadian and noise energy, so was discarded. An SNR value above 0 indicates the signal is stronger than the noise (ratio was greater than 1). The SNR does not statistically test whether there is a significant circadian rhythm present, although a high SNR value strongly suggests it. A negative SNR value can mean either a rhythm swamped by noise or no rhythm (ratio of signal-to-noise energy was less than 1).
The circadian energy is the sum of squares of the DWT circadian component D6 divided by the sum of squares of all DWT components D1-D6, yielding the proportion of total energy that is at the circadian scale, for the same window as the SNR. This proportion does not indicate whether there is a significant circadian rhythm present.
As a measure of uncertainty in whether the period can be determined from the data, we ran a Bayesian statistical analysis via MCMC sinusoid fitting, as described in Cohen et al. (2012), for 4-day windows, dropping the first 24 h of recording. The procedure generates a distribution of period estimates, where the 95% credible interval (CI) is the interval of most likely period values. A mean period estimate can also be obtained from this distribution. The CI provides evidence for whether the period of a time series can be reliably measured. The wider the CI, the less credible it is that the time series has a measurable circadian period. Only 14-day pump records were used for this computation, to have sufficient length.
To assess the statistical significance of circadian rhythms in the data, JTK and Lomb-Scargle q values (false discovery rate–adjusted p values) were calculated using the MetaCycle R package (Wu et al., 2016), applied to 3-day windows, dropping the first 24 h of the recording and using 90-min median binning to reduce correlated high-frequency noise and outliers.
DWT peak times are the peaks in the circadian signal component of the bioluminescence obtained using the DWT. Time relative to projected lights indicates the DWT peak times in relation to the time of lights-on (0600) in the colony room where animals were housed prior to the in vivo bioluminescence experiments.
Further experimental details are provided in the Supplementary Methods.
Results
As in many previous reports (Saini et al., 2013; van der Vinne et al., 2018; Crosby et al., 2019), we were able to detect circadian rhythms of bioluminescence in vivo from mice carrying the mPer2Luc transgene (see Figure 2). Given that the reporter signal arises from multiple tissues (see below), this suggests that the tissues we are detecting express rhythms with some degree of synchrony even during housing in constant darkness.
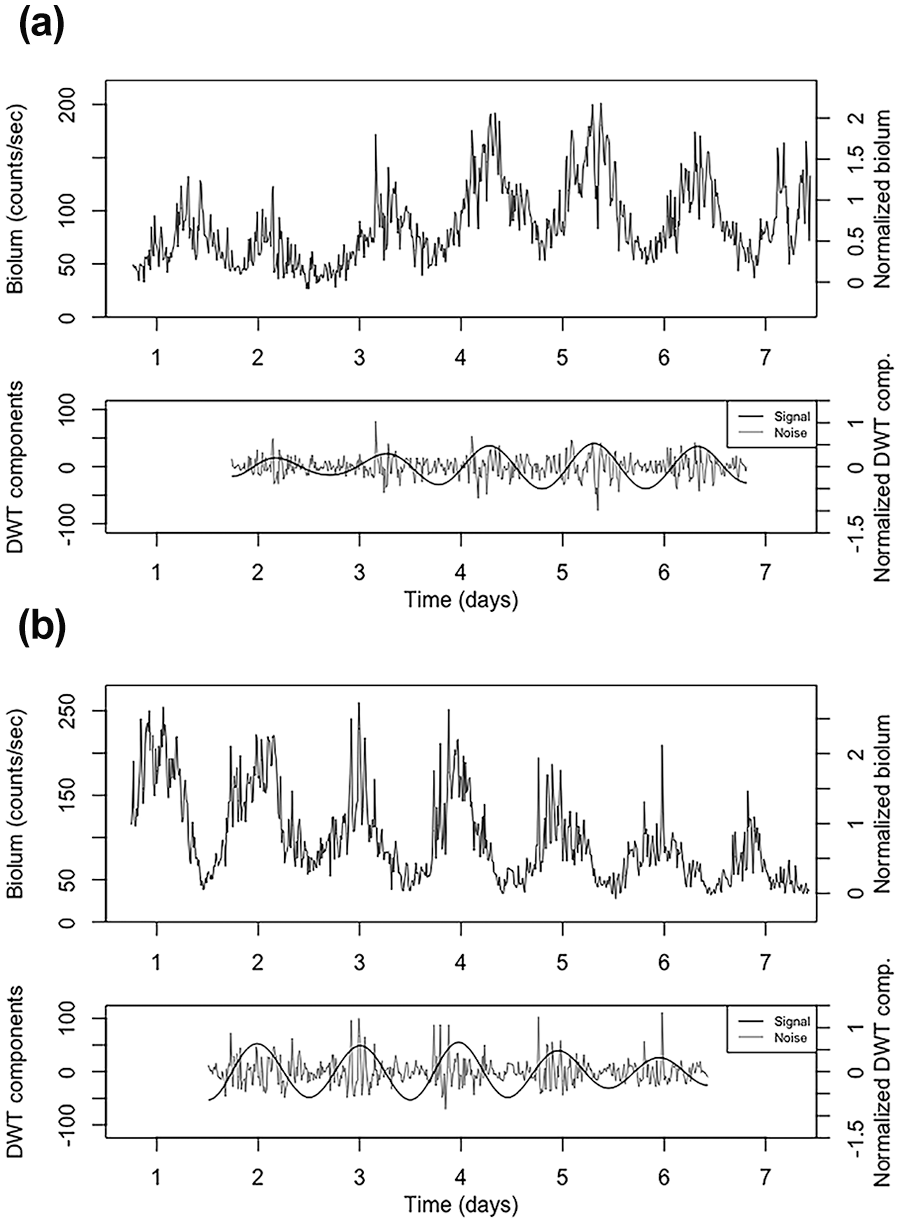
Example of bioluminescence data with (a) 14-day d-luciferin pump (0.25 uL/h of 100-mM d-luciferin; animal ID IVM82), or (b) 14-day CycLuc1 pump (0.25 uL/h of 5-mM CycLuc1; animal ID IVM93). Top graph for each example: 15-min median binned trace with counts/s scale on the left and normalized scale on the right (subtract first percentile then divide by median, so min is mapped to zero and median mapped to 1; using first percentile reduces the effect of outliers). Bottom graph for each example: For the signal-to-noise ratio analysis, the DWT-calculated circadian component D6 is treated as the signal and the summed components D1-D4 are treated as the noise. The data before the first trough and after the last trough are discarded to avoid edge effects. Raw data in counts/s from each PMT are shown for these two animals in Supplementary Figure S2. Abbreviations: DWT = discrete wavelet transform; PMT = photomultiplier tube.
We first investigated bioluminescence rhythms in mice receiving d-luciferin continuously using an osmotic minipump (Figure 2). A 14-day pump delivers a smaller volume per hour than a 7-day pump (0.25 uL/h vs 0.5 uL/h, respectively) yet both pumps are limited to a 100-uL reservoir. We asked if this reservoir, with 100-mM d-luciferin, was able to lead to a detectable rhythm in bioluminescence, in a small sample of 4 mice. This experiment also tested the impact of holding d-luciferin solution at body temperature for up to 11-12 days. Table 1 shows the results. One animal was noted to have unusually rapid fur regrowth and showed progressive signal loss (see Suppl. Fig. S4C). Both rates of d-luciferin delivery led to detectable circadian rhythms in bioluminescence.
Summary of key measures of rhythms recorded from mice with osmotic pumps delivering substrate.
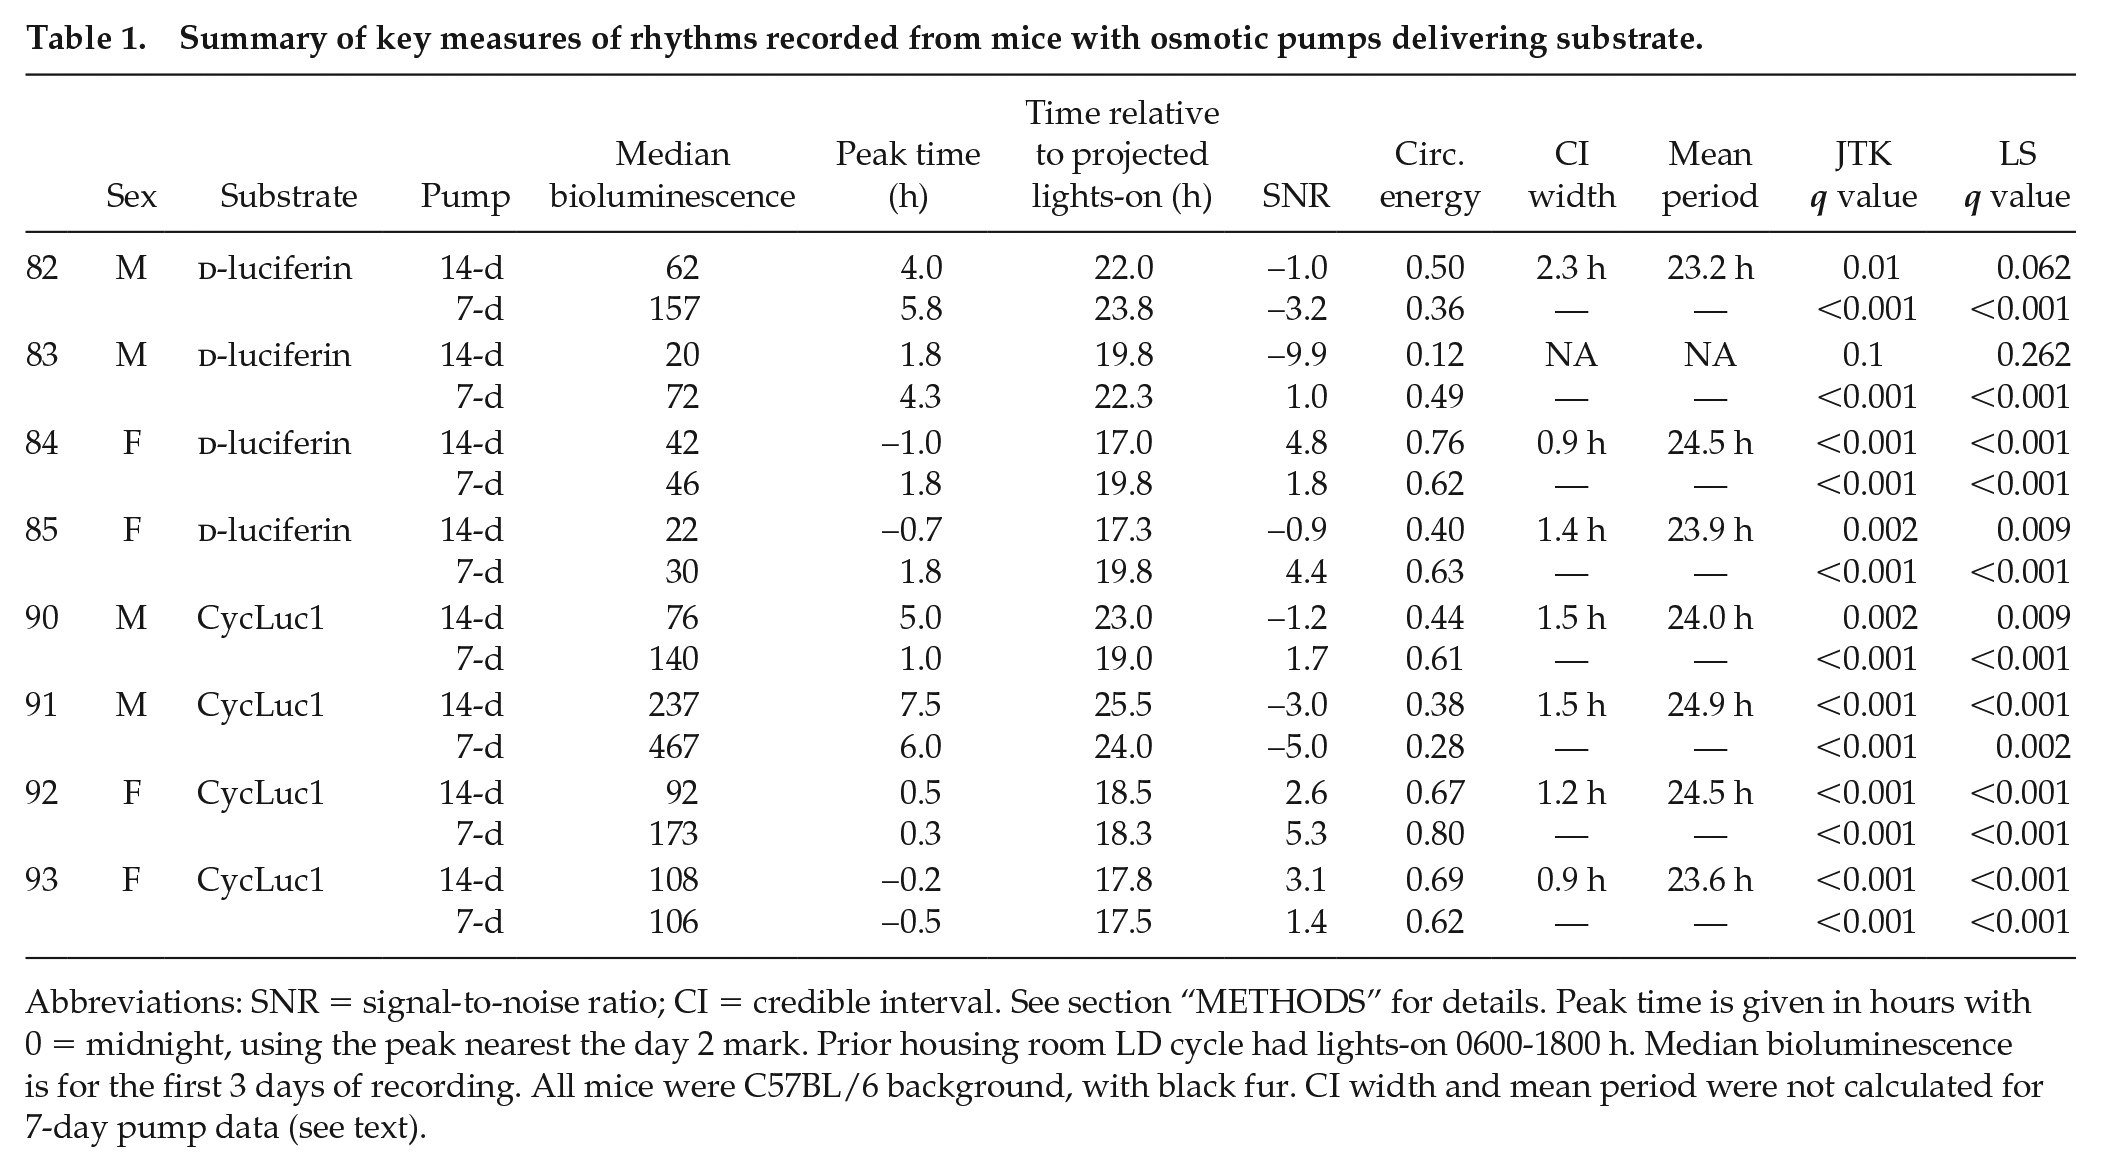
Abbreviations: SNR = signal-to-noise ratio; CI = credible interval. See section “METHODS” for details. Peak time is given in hours with 0 = midnight, using the peak nearest the day 2 mark. Prior housing room LD cycle had lights-on 0600-1800 h. Median bioluminescence is for the first 3 days of recording. All mice were C57BL/6 background, with black fur. CI width and mean period were not calculated for 7-day pump data (see text).
In addition, we asked if the synthetic luciferase substrate, CycLuc1, can be effective at concentrations lower than those of d-luciferin, as previously seen in studies with acute injection of the substrates (Evans et al., 2014). We tested 5-mM CycLuc1 in 7- and 14-day osmotic minipumps, and again we detected circadian rhythms in bioluminescence (Figure 2). Traces for all 16 recordings (7- and 14-day pumps, both substrates) are given in Supplementary Figure S4.
Table 1 provides a summary of the analysis of the osmotic minipump data. All but one animal had bioluminescence profiles that were significantly rhythmic according to both JTK and Lomb-Scargle tests. The exception is the one mouse (#83) with a 14-day d-luciferin recording mentioned above, for which hair regrowth was an issue. The Bayesian statistical analysis supports this assessment, yielding mean periods near 24 h and reasonable CI widths, given the shortness of the time series, again with the exception of the single problematic 14-day d-luciferin recording. The SNR varied, reflecting the high-amplitude noise present in many of these recordings; noise amplitude tended to increase greatly near signal peaks, as shown in Figures 2 and 3. While SNR values above 2 tend to allow greater precision in period and phase estimates, the analysis here suggests that even when noise levels are relatively high, the recordings are statistically rhythmic with measurable period and phase (though keeping in mind the uncertainty indicated by the Bayesian analysis). The circadian energy provides an alternative measure to the SNR for assessing signal strength.
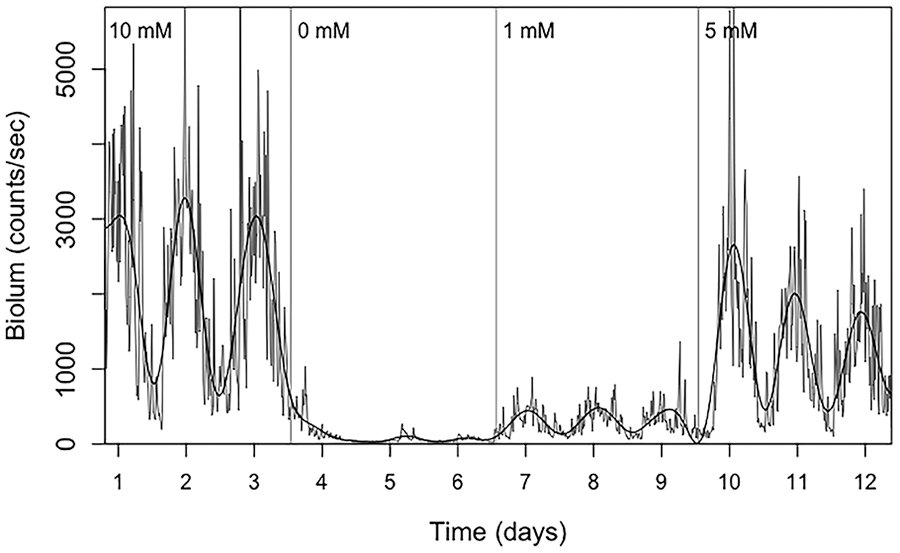
Example of bioluminescence data with d-luciferin delivered via drinking water, using a sequence of doses as indicated. Vertical lines indicate when substrate solutions were changed.
Next, we asked if we could measure rhythmic bioluminescence using delivery of substrate in the drinking water, and if the signal varied with the concentration of d-luciferin. As shown in Figure 3, we saw an increased median level of bioluminescence with increasing concentration of d-luciferin in the drinking water across the 4 mice tested, but the SNR was not reliably altered with dose. The 0-mM condition immediately following the 10-mM concentration allowed us to observe the duration of wash-out (loss of signal following substrate removal). As shown in Supplementary Figure S5, residual signal was observed for variable amounts of time after d-luciferin (10 mM) withdrawal. Notably, an additional 0-mM condition that was not immediately preceded by d-luciferin administration yielded a true baseline, with low levels of bioluminescence (with negative SNR and nonsignificant JTK and Lomb-Scargle q values). All drinking water bioluminescence recordings are shown in Supplemental Figure S5.
We then asked if delivery of the synthetic substrate CycLuc1 in the drinking water would produce robust bioluminescence signal at lower concentrations of substrate, as previously reported (Evans et al., 2014). As shown in Figure 4 and Supplemental Figure S6B, CycLuc1 treatment (0.1 mM) produced a stronger (circa 10-20×) bioluminescence signal than the same concentration of d-luciferin in each of the 4 animals. We found no consistent difference in the amount mice drank across conditions (Suppl. Fig. S6A).
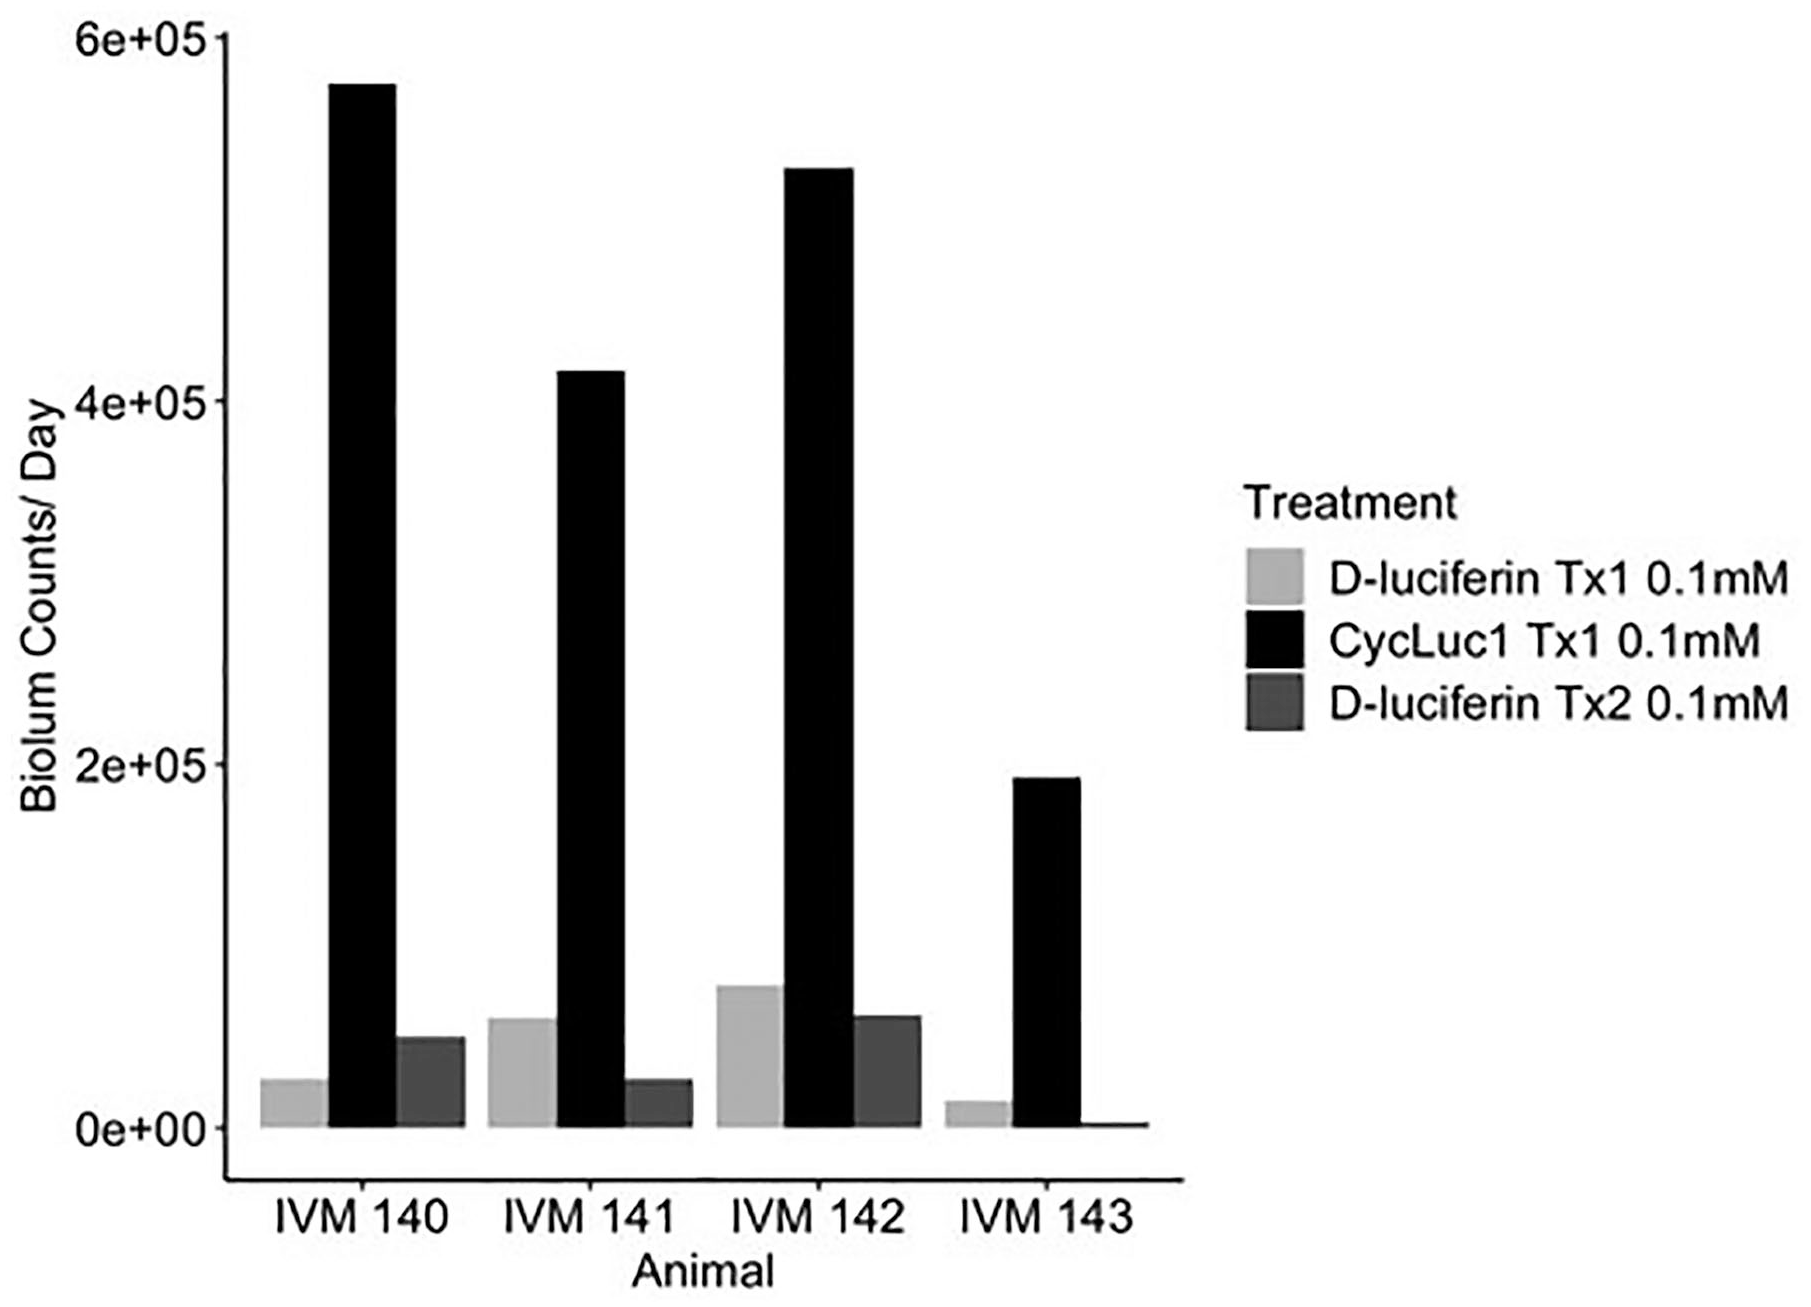
Bioluminescence counts per day were calculated for each treatment by dividing the total sum of counts by the number of days. Treatments were 0.1-mM d-luciferin, 0.1-mM CycLuc1, and 0.1-mM d-luciferin, and were 3 days in length with a day of plain water administered between treatments.
Although mice consumed both substrate solutions, when offered a choice, they displayed some preference (see Figure 5). We used a two-sided paired t test to compare consumption across the three trials. We observed no significant difference between d-luciferin and water—t(7) = 1.1, p = 0.305. There was not a significant difference between CycLuc1 and water—t(7) = 2.34, p = 0.052—but there was a trend for mice to prefer water. Mice preferred d-luciferin to CycLuc1—t(7) = 9.55, p < 0.001.
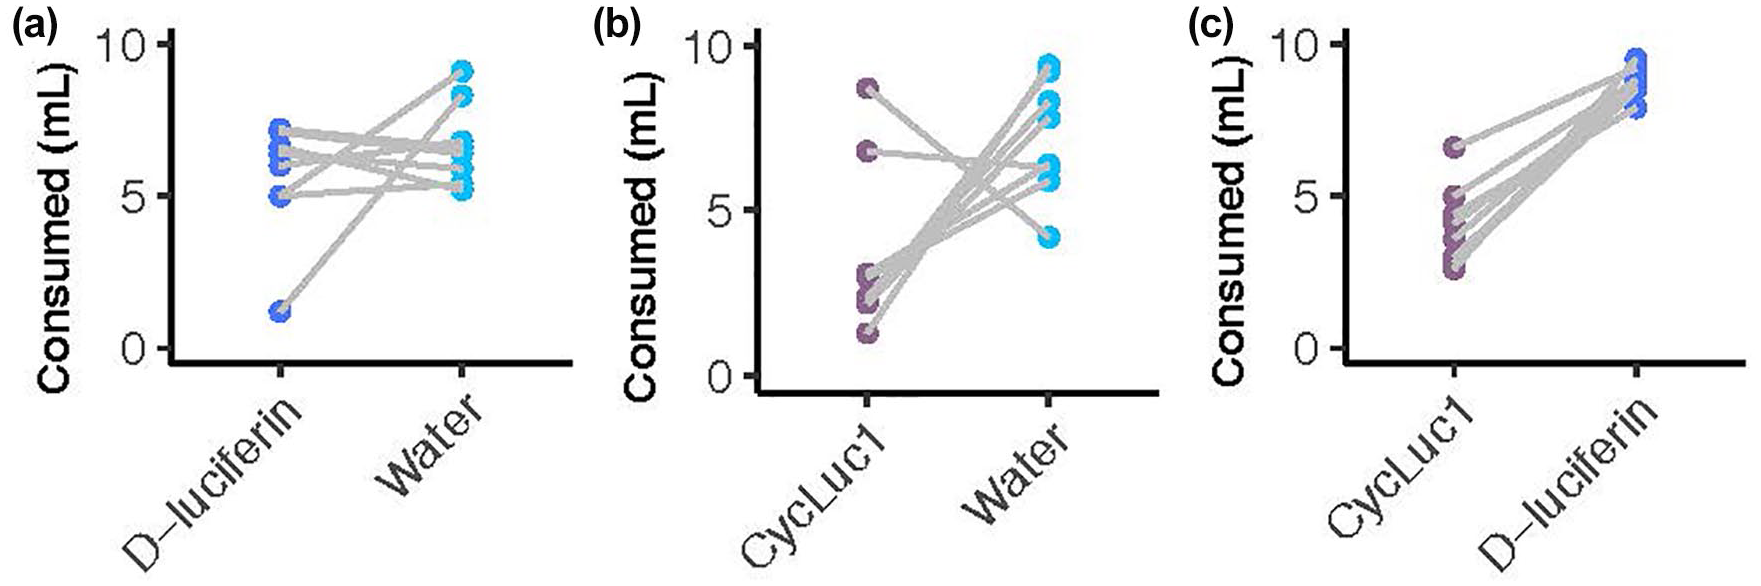
Substrate preference test. Amount consumed (ml) by mice according to substrate solution offered (d-luciferin, 5mM; CycLuc1, 0.1 mM). Each graph (a-c) displays a different experiment in which the same 8 mice were given two options of each substrate in 10 ml over 48 h. Points connected by lines represent the amount consumed by the same mouse.
Results from recordings of bioluminescence from mice housed in cages that recorded drinking events demonstrated strong correspondences between drinking events and bioluminescence spikes (see Figure 6). These results suggest that delivery of substrate via drinking water includes artifacts associated with drinking bouts.
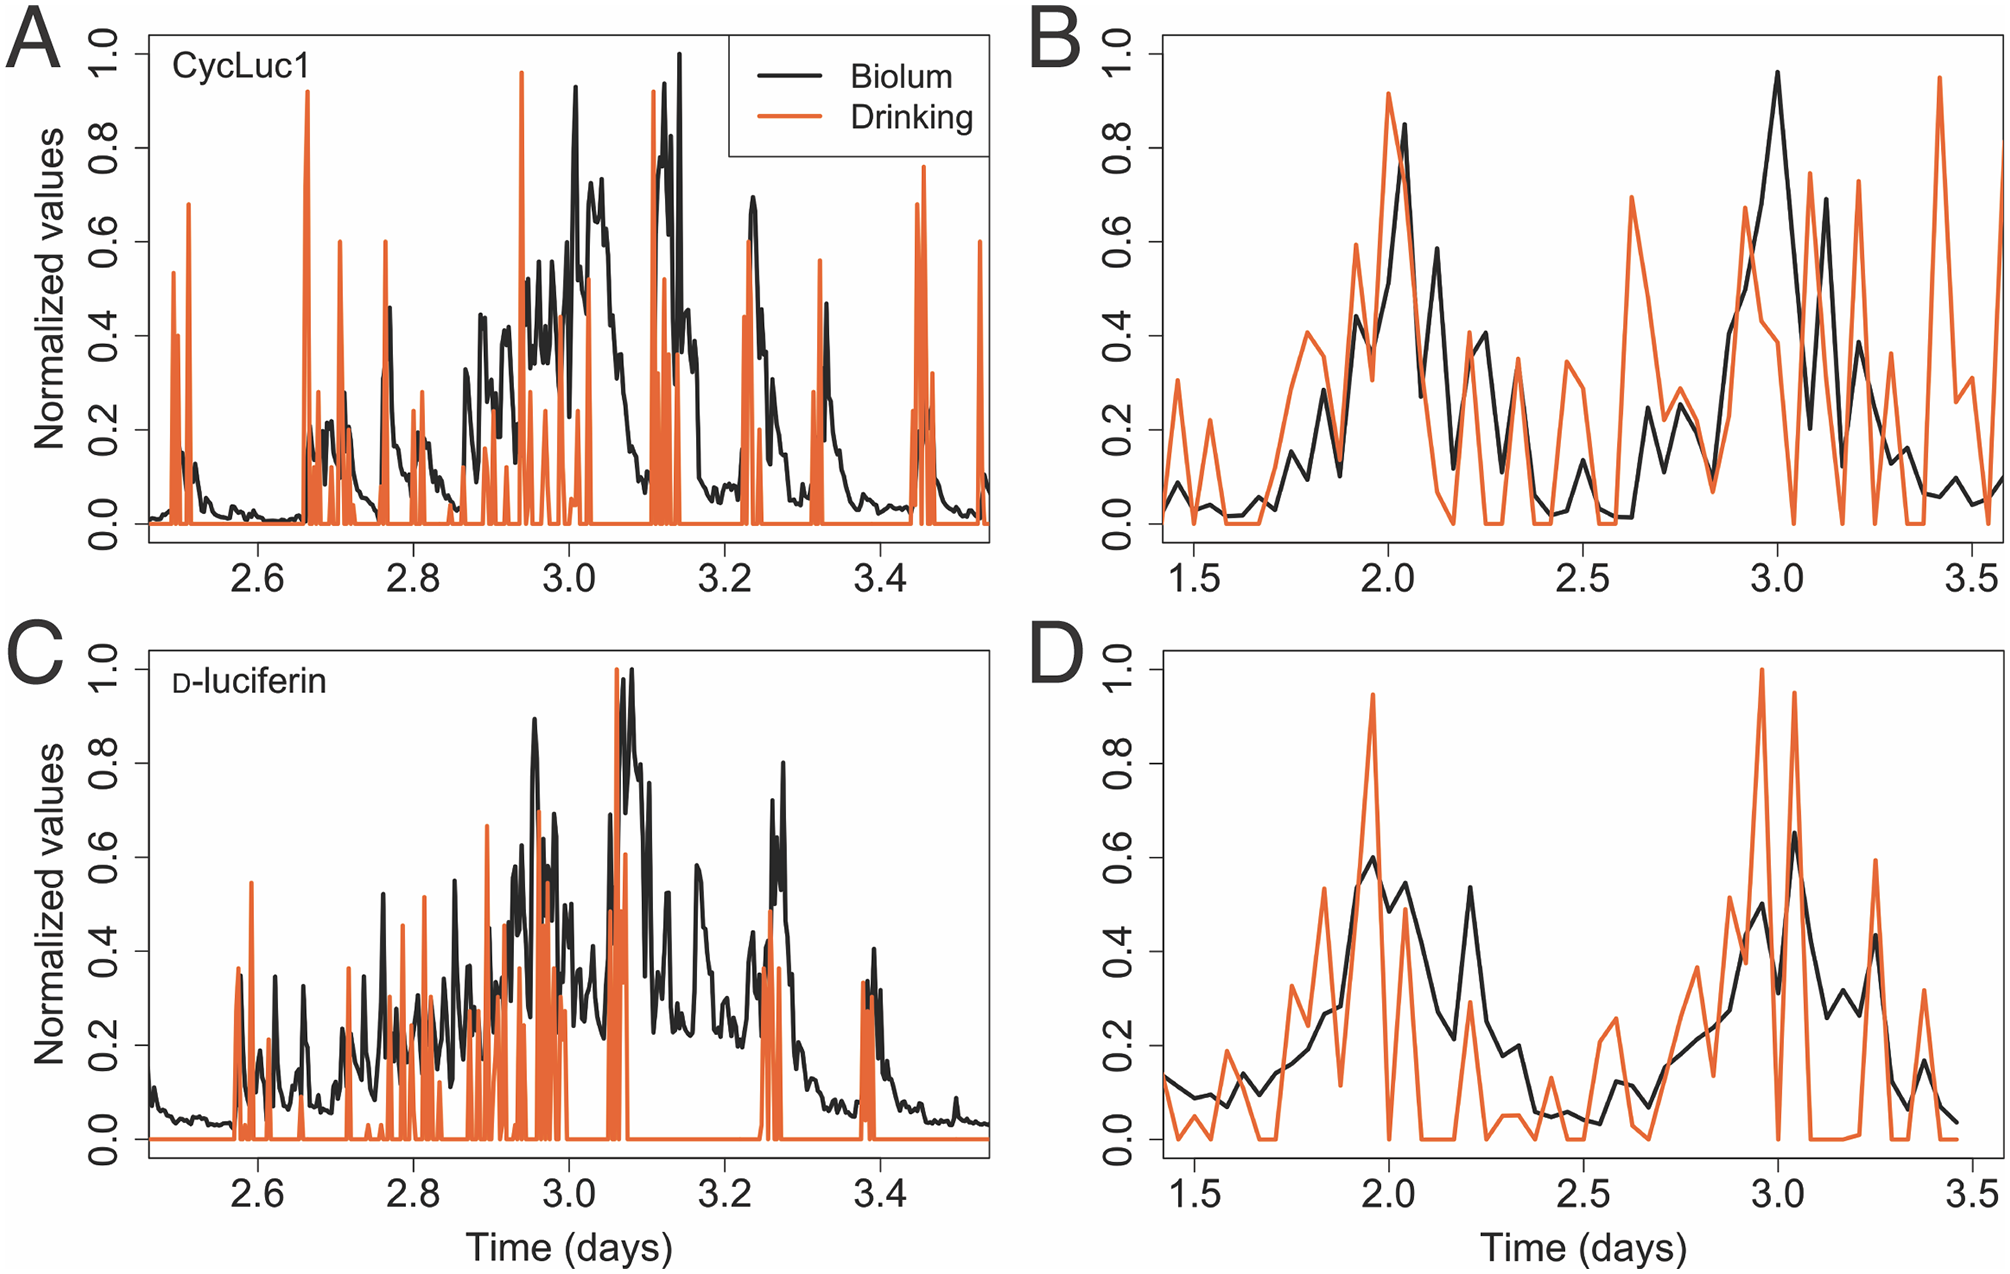
Correspondence between drinking bouts and bioluminescence. Albino mice expressing PER2::LUC showed bioluminescence that often increased following a drinking bout. Although our cages may have missed some drinking bouts, the detected drinking tube contacts (shown in orange) could be seen to temporally coincide with spikes in bioluminescence, for both substrates, CycLuc1 (a, b) or d-luciferin (c, d). This was most obvious when data were in smaller time bins (4-min bins, a, c). With larger time bins (30-min bins, b, d), the daily rhythm in drinking activity more clearly overlays that of bioluminescence.
Bioluminescent rhythm damping (as seen, e.g., in Suppl. Fig. S4G) might be attributable to fur regrowth in these black mice, and/or substrate degradation over time. We incubated aqueous solutions of d-luciferin and CycLuc1 for stability for multiple days at body temperature to determine their relative stability. Prolonged incubation of d-luciferin at 37 °C resulted in substantial oxidation of d-luciferin to dehydroluciferin as judged by Liquid chromatography / mass spectrometry (LC/MS) (see Suppl. Methods). After 14 days, ~50% of the d-luciferin had oxidized (Figure 7). Some loss of d-luciferin by racemization to l-luciferin is also likely (Nakajima et al., 2021). Dehydroluciferin is not a luminogenic substrate for firefly luciferase, and is a much more potent inhibitor than l-luciferin (da Silva and da Silva, 2011). The ~6-fold decrease in bioluminescent signal observed when using this solution for in vivo imaging may thus reflect luciferase inhibition by dehydroluciferin as well as a reduction in the d-luciferin dose. By contrast, no formation of a dehydroluciferin product was noted for CycLuc1 at 37 °C or for either substrate incubated at 4 °C, and the in vivo imaging results were comparable to a freshly prepared solution (Suppl. Fig. S7).
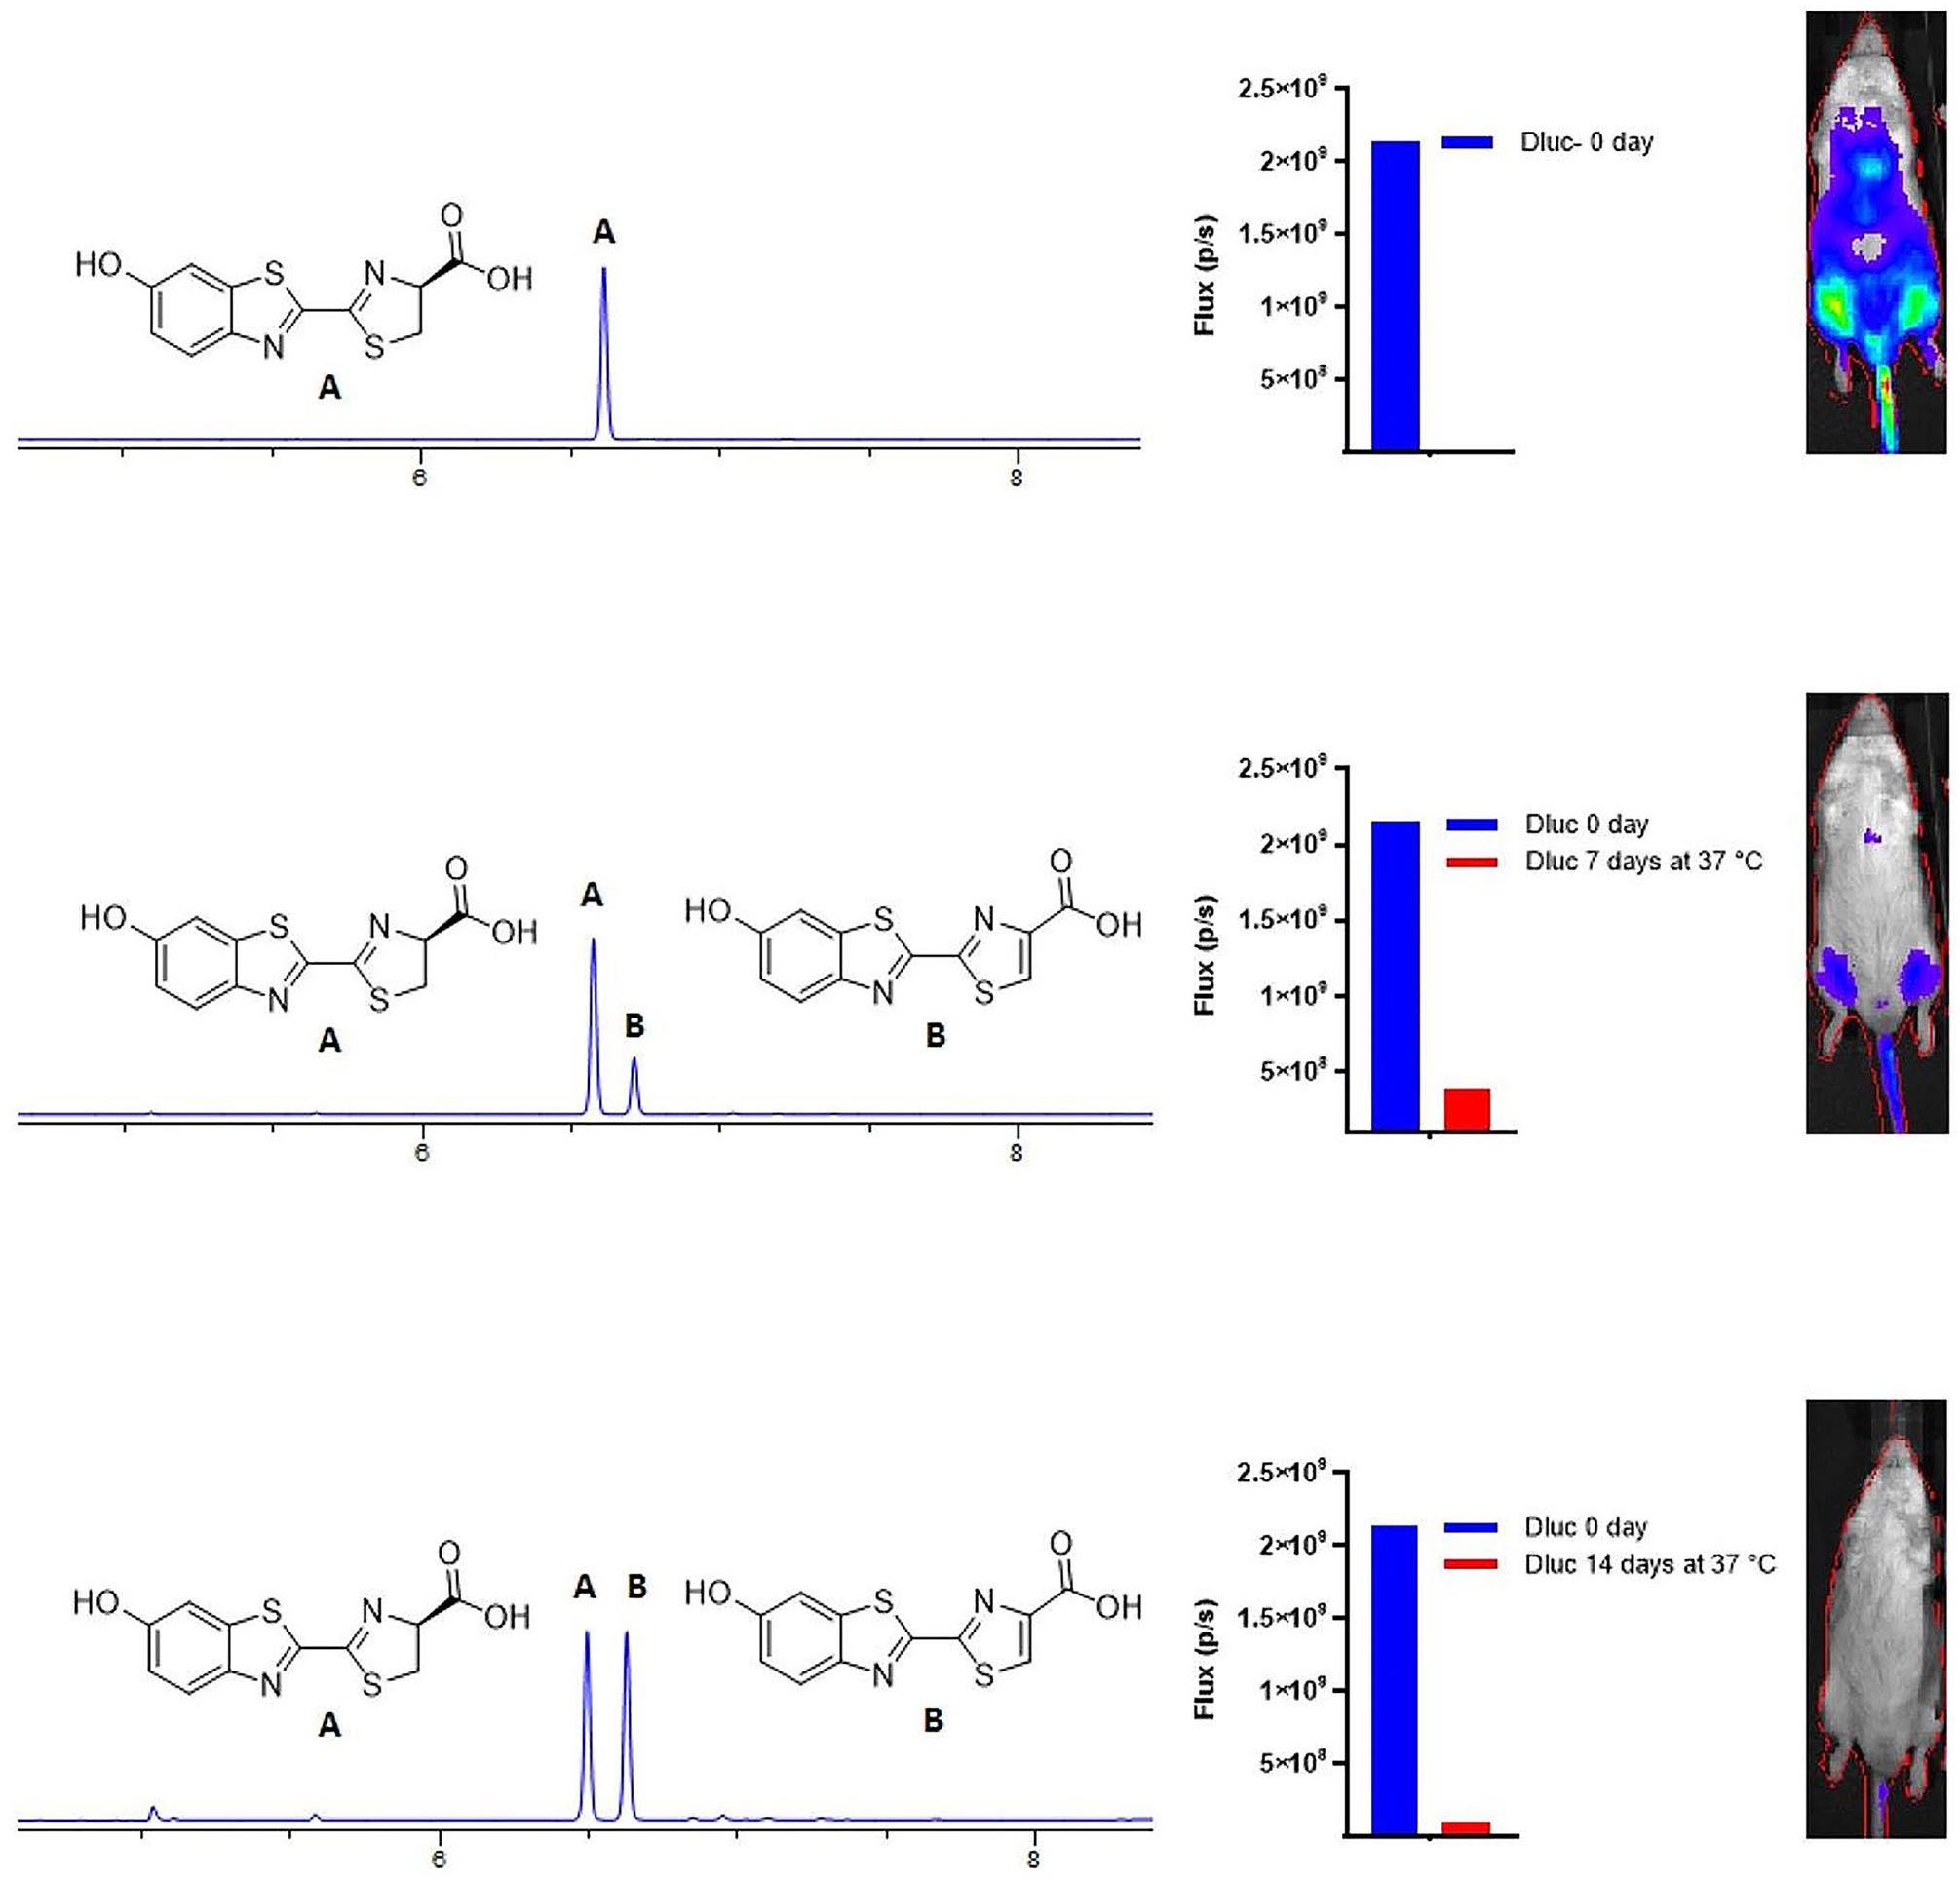
Evaluation of d-luciferin after incubation at body temperature. Liquid chromatography / mass spectrometry (LC/MS) and in vivo bioluminescence imaging with d-luciferin incubated in aqueous buffer at 37 °C for 0, 7, or 14 days. FVB/NJ mice received intravenous injection of AAV9-CMV-WTluc2 as previously described in a method that primarily transduces heart and leg muscles (Mofford et al., 2015) and images were collected 12 min postinjection (ip) of the d-luciferin solution. Images shown are from one male mouse imaged on different days, and the 0-day data from this mouse are shown for comparison with the 7- and 14-day data on the lower two histograms.
We tested 7 mice (4 males) with albino background and 14-day osmotic minipumps containing CycLuc1 (5 mM). Our recordings of bioluminescence and locomotor activity records from these mice housed in constant darkness are summarized in Table 2. In this small sample, female mice all showed earlier bioluminescence peaks than males. The signals, although being noisy, suggest a sex difference in phase, as shown in Figure 8. This demonstrates that it is possible to detect a circa 4-h separation in phase with small samples (n = 3-4).
Summary of key measures of rhythms recorded from albino mice with osmotic pumps delivering CycLuc1.
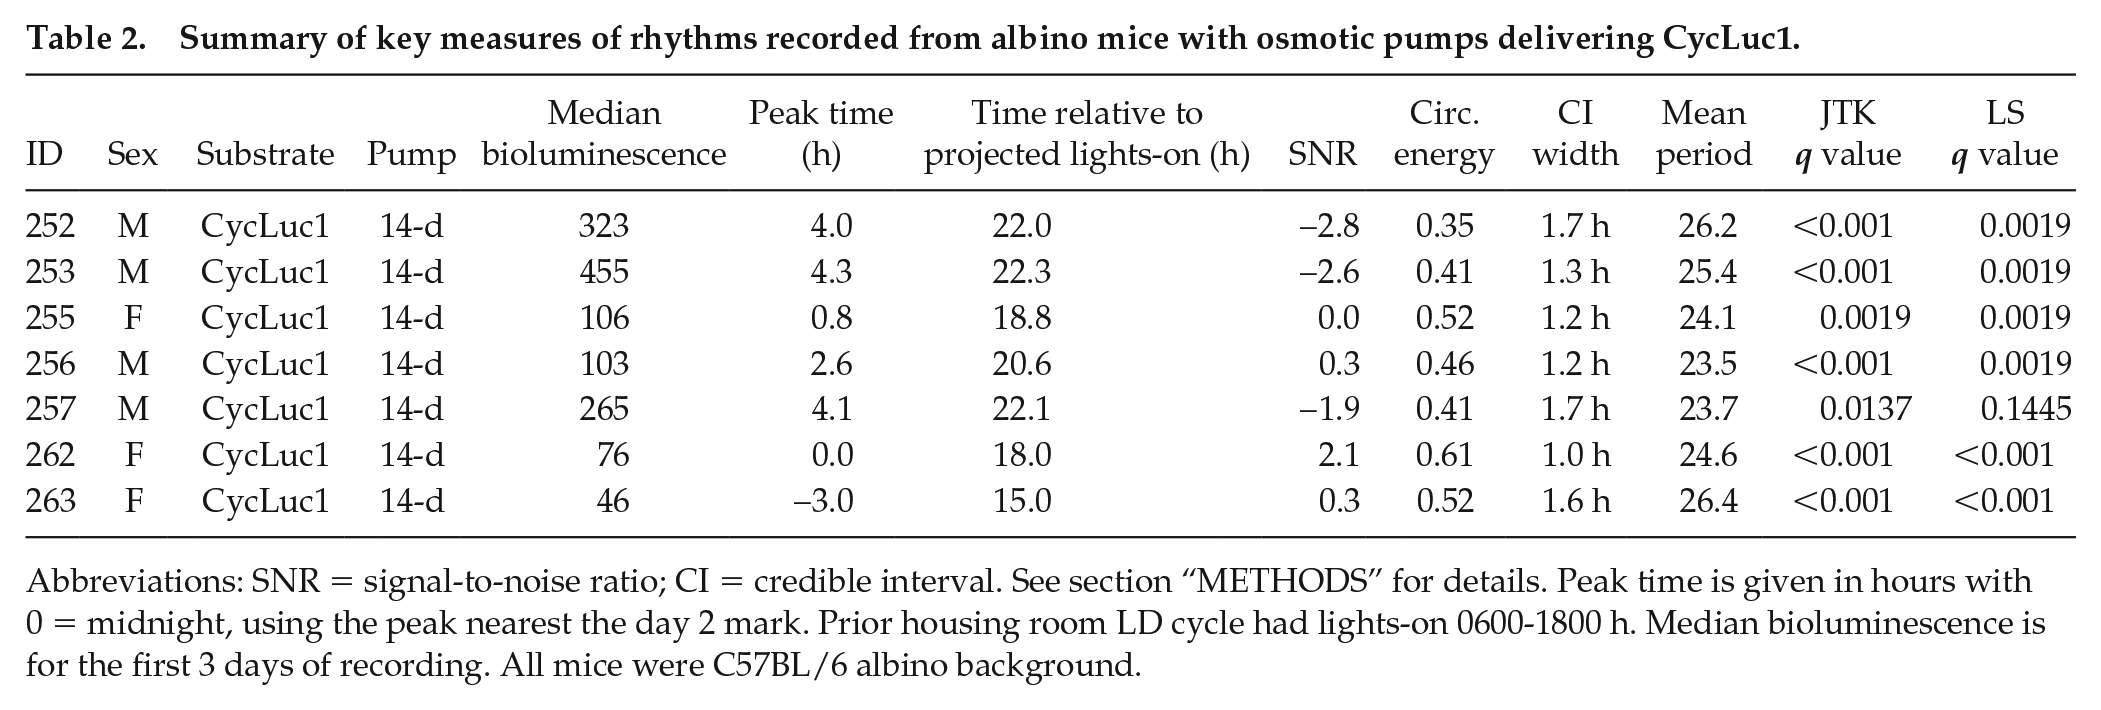
Abbreviations: SNR = signal-to-noise ratio; CI = credible interval. See section “METHODS” for details. Peak time is given in hours with 0 = midnight, using the peak nearest the day 2 mark. Prior housing room LD cycle had lights-on 0600-1800 h. Median bioluminescence is for the first 3 days of recording. All mice were C57BL/6 albino background.
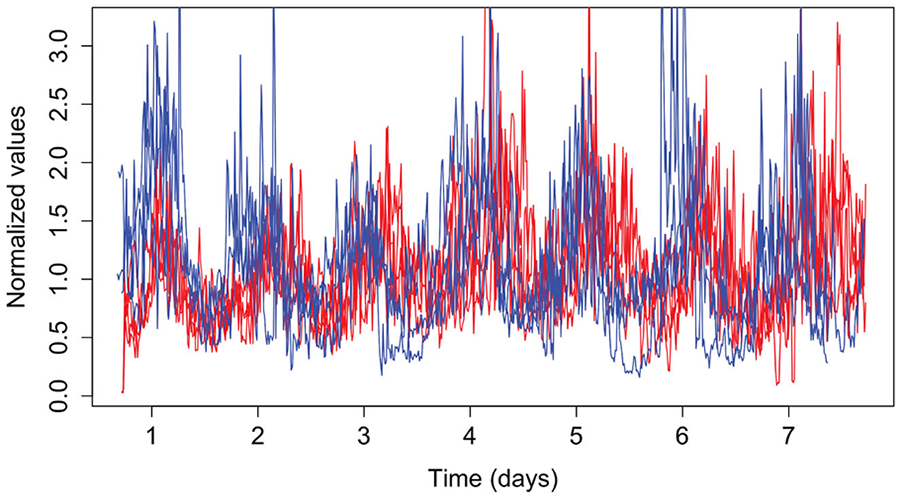
Female mice showed earlier peak times beginning on day 2 in darkness when compared to males. This is visible in the raw (normalized) data shown. Female (n=3)—blue; male (n=4)—red.
One shortcoming of assessing bioluminescence rhythms using the LumiCycle In Vivo is that this method does not provide information on the anatomical source of bioluminescence. Previous studies of PER2::LUC in mice conducted with bioluminescence imaging have identified the kidneys, liver, and submandibular gland as the primary sources of “signal” from anesthetized mice (Tahara et al., 2012). Notably, in each of these studies, the substrate was provided by intraperitoneal injection. Thus, we performed IVIS imaging studies on mice receiving luciferin substrates by drinking. We imaged both anesthetized intact mice, as well as acutely dissected mice administered ketamine/xylazine, to assess the sites of origin of bioluminescence in mPer2LucSV/+ mice receiving substrate in the drinking water. Mice drinking d-luciferin (2 or 0.1 mM) or CycLuc1 (0.1 mM) had readily detectable bioluminescence signal, located predominantly in the kidneys, followed by the liver and other abdominal structures (see Suppl. Fig. S8). The distribution following acute ip injection (d-luciferin: 0.1 ml of 10 mM) was similar to that observed in mice that had d-luciferin provided in the drinking water for multiple hours before. Signal from the upper abdomen (ventral view) or from the area on the dorsal surface corresponding to the abdomen (dorsal view) contributed over 75% of photons within the region of interest containing the entire animal. The anatomical pattern of labeling did not appear related to the treatment group. Bioluminescence (at much lower levels) was observed in a variable pattern in extra-abdominal sites, including hands, feet, mouth, throat (presumably submandibular gland), and where urine leaves the body (vulva in females, penis in males), and on the dorsal side, upper back and rump. Mice receiving d-luciferin by injection had a similar distribution, including the preponderance of labeling coming from the abdomen in both ventral and dorsal views. We compared the log of counts from either ventral or dorsal views across conditions and sex using analysis of variance (ANOVA). We found a significant effect of treatment in each view—ventral: F(3,25) = 107.21, p < 0.001; dorsal: F(3,20) = 152.2, p < 0.001. Tukey contrasts showed bioluminescence was greatest in mice receiving d-luciferin by injection (0.1 mL of 10 mM), followed by CycLuc1 (0.1 mM) and d-luciferin (2 mM) (no significant statistical difference between these) and finally by d-luciferin (0.1 mM). When considering the ventral view, we saw no significant effect of sex—F(1,25) = 0.002, p = 0.96—but for the dorsal views, we found a weak sex effect, F(1,20) = 4.59, p = 0.0446; signal trended higher in males. Images from acutely dissected mice confirmed that the kidney was the greatest source for bioluminescence in these mice (see Suppl. Fig. S9).
Discussion
These studies extend prior work that established the feasibility of recording gene expression rhythms in vivo with bioluminescence. We have chosen to conduct initial studies with the most widely used animal model for circadian bioluminescence currently available, the mPer2Luc/Luc mouse with the reporter PER2::LUC. We used mice with two copies of the reporter allele to enhance signal output. Thus, success with this animal model likely sets the mark for the most we can achieve, with less light expected from animals with bioluminescence directed to specific organs. On the other hand, PER2::LUC may offer a noisier rhythmic signal than organ-specific reporters because it is reporting from diverse sources of signal. These diverse sources must be somewhat coordinated, to detect circadian rhythms at the whole-animal level as reported here. Prior studies using measures collected in vivo indicate that the peripheral tissues of the mouse hold similar phase in Per2 mRNA rhythms. For example, using the “CircaDB” resource and the JTK analysis (http://circadb.hogeneschlab.org/), we found Per2 mRNA rhythms peak in the kidney at ZT15 (mean of 2 estimates), distal colon at ZT15.0, and liver at ZT15.4 (mean of 4 estimates). IVIS imaging experiments similarly demonstrate close correspondence in phase of rhythms of body organs under control conditions (e.g., see van der Vinne et al., 2020). This is consistent with data from reports assessing bioluminescence rhythms in anesthetized mice by IVIS imaging, in which rhythms of PER2::LUC bioluminescence were relatively synchronous across the tissues assessed (Tahara et al., 2012; van der Vinne et al., 2018). For example, in one study (van der Vinne et al., 2018), liver and kidney showed a peak phase of ZT18. Animals in our experiments showed peaks in the same range.
Our results indicate that luciferin substrates are effective for producing detectable bioluminescence rhythms when delivered either by drinking water or by osmotic minipump. The possibility that the daily drinking rhythm altered the phase and/or amplitude of the bioluminescence rhythm could not be excluded in this study. Future studies should be conducted using mice with a circadian reporter with peak expression at a phase not coincident with the major time of voluntary water intake.
All in vivo bioluminescence recordings show noise that is modulated by the time of day. There could be multiple sources of this noise and our current studies do not allow us to distinguish between them. Possibilities include orientation of the mouse body relative to the photon detectors (PMTs), position of the mouse within the cage and distance from the PMTs, variable blood levels of substrate in the mice drinking substrate solutions, variable absorption and processing of the substrate, and likely many others. Despite these sources of noise, we demonstrate analysis techniques that allow us to extract the circadian signal from these records with circadian-modulated noise.
The synthetic luciferin, CycLuc1, offers advantages in terms of signal detection and stability. CycLuc1 has a lower Km for firefly luciferase than d-luciferin, and can be used effectively at lower doses (Evans et al., 2014). The ability of this substrate to be used at lower concentrations and/or delivered at slower rates could potentially overcome some of the limitations imposed by the small volume of minipump reservoirs. Use of CycLuc1 offers the possibility for long-term experiments, with multiple days of recording providing estimates of circadian period with increased precision (Cohen et al., 2012).
Another consideration for long-term studies using implanted osmotic pumps is the aqueous stability of the luciferin substrate at body temperature. Oxidation of a luciferin to its respective dehydroluciferin reduces the luciferin concentration and also introduces a potent luciferase inhibitor. Substrate oxidation is a potential confounding variable when using d-luciferin solutions that are maintained for an extended period at room or body temperature, for example, in the drinking water or in implanted osmotic pumps. We observed greater oxidation of d-luciferin than CycLuc1 in solutions incubated in vitro for 7-14 days at 37 °C. Oxidation of d-luciferin lowered its relative performance over time. However, it is possible that access of oxygen to the solution in implanted pumps is lower than in the vials we used for the in vitro incubation experiments, limiting the extent of oxidation that occurs in vivo compared to in vitro.
We explored several different analysis methods for assessing the strength of the rhythmic signal in the in vivo bioluminescence data. The SNR can be useful for measuring improvements in reducing the high-frequency noise to create a clearer circadian signal, as can the circadian energy measure. These two measures provide evidence toward whether the period and phase can be reliably estimated, but are not direct tests of rhythmicity. Similarly, the Bayesian statistical analysis provides a measure of how reliable the period estimate is, but is not a rhythmicity test. Finding an effective rhythmicity test proved to be challenging, due to the correlated nature of the high-frequency noise which caused some tests to give spurious results. The two statistical tests that appeared to work most reliably were JTK_CYCLE and Lomb-Scargle, as implemented in MetaCycle (Wu et al., 2016), using 90-min bins to avoid the problematic effects of the high-frequency noise. The general conclusion from the various methods is that the in vivo methods are generating data with clear circadian rhythms for which period and phase can be estimated with reasonable precision, analogous to that for other data with a similar number of cycles.
Our DWT peak results from mice with pumps (Tables 1 and 2) suggested a possible sex difference in the timing of the measured rhythms, yet our sample size did not allow firm conclusions. To explore potential DWT bioluminescence peak differences between whole-body male and female mice expressing PER2::LUC, we applied our DWT analysis on a combined dataset including the osmotic minipump treatments from black C57BL/6 mice presented in this study (Table 1), and a group of controls from another recently published paper (van der Vinne et al., 2020) that studied metabolic consequences and PER2::LUC bioluminescence in mice lacking a functional central clock (Vgat-Cre+ Bmal1fl/f, experimental group). The control animals from this study (No Cre Bmal1fl/f Per2LucSV/+) are similar to the Per2LucSV/+ animals used in this study. Bioluminescence data were obtained in our lab using the same equipment and methods presented in this article, with CycLuc1 substrate delivered at a 0.25-uL/h rate in 14-day pumps. The DWT peak analysis (Figure 9) showed more variation in DWT peak times in males (Figure 9b) than females (Figure 9a). We did not apply statistical analyses since this dataset contained animals from three separate studies, but combining our studies (Tables 1 and 2) with these previously published data strongly suggests a sex difference is replicable (see Figure 9; color code indicates source dataset).
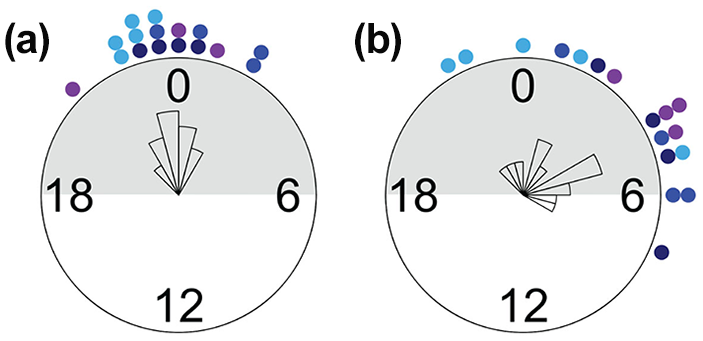
PER2::LUC rhythms recorded in vivo from female (a) and male (b) mice. Abbreviation: DWT = discrete wavelet transform. Plots show DWT peaks near day 2 mark. 0 = midnight; mice came from a colony room with lights-on 0600-1800 h. Shaded gray area indicates lights-off in the colony room. DWT peak marker times for data from mice with osmotic minipumps. Circles in darker royal blue = 7-day pump, circles in royal blue = 14-day pumps, circles in dark orchid = albino mPer2Luc/Luc mice with 14-day pumps, circles in light blue = mPer2LucSV/+ controls No Cre Bmal1fl/fl Per2LucSV/+ from our previous study (van der Vinne et al., 2020).
We were not able to find any studies describing sex differences in whole-body PER2::LUC bioluminescence. Our IVIS imaging studies indicate the kidneys are a major source of bioluminescence, and their dorsal location would presumably afford easy detection of light. The kidneys are likely a (and perhaps the) major contributor to the bioluminescence signal detected in ambulatory mice. We thus predict that the kidney might show earlier phase of PER2::LUC bioluminescence in females than in males. Some sex differences in results from in vitro bioluminescence of explant tissues have been studied. Amplitude of the PER2::LUC rhythm in the adrenal and liver is higher in male mice (Kuljis et al., 2013; Kloehn et al., 2016), and phase of liver and adrenal rhythms was phase advanced in male mice (Kuljis et al., 2013). In vitro retinal PER2::LUC oscillations show no sex-dependent effects on amplitude, period, phase, or rhythmic power (Calligaro et al., 2020). Sex differences in sleep and circadian variables may play an important role in application of circadian research on negative health impact of circadian disruption (Boivin et al., 2016; Yan and Silver, 2016; Qian et al., 2019).
Limitations
We have discovered several methodological concerns. Due to the impact of room temperature fluctuations on PMT noise (see Figure 1), our technical approach requires either carefully controlled room temperature or (ideally) a method for correction of temperature-related noise on the PMTs. The LumiCycle In Vivo (Actimetrics) solves this problem by collecting dark counts regularly and subtracting those measures.
We initially attempted to study mice with E-mitter implantable telemetry probes (Starr Life Sciences) to monitor rhythms in body temperature simultaneously with bioluminescence. Unfortunately, when implanted in a mouse housed in a LumiCycle In Vivo unit, the telemetry probes created electronic noise that appeared as additional PMT signal, especially when the mouse showed high levels of locomotor activity. We confirmed this conjecture by detecting rhythmic “bioluminescence” from a mouse with an implanted telemetry probe, but with no substrate delivered by pump or drinking water (data not shown). A different telemetry system might offer the ability to monitor body temperature and other rhythms.
While the body temperature probes could not be used as intended, their presence in animals recovering from the subsequent osmotic pump implant surgery provided insight into the prolonged effects of general anesthesia in our mice. During recovery from surgery, we noted that the circadian rhythm in body temperature was disrupted for 1-2 days. Based on these results, we allowed 3 days for colony room recovery after osmotic pump implantation surgery in the studies reported here. Alterations in the circadian rhythms in body temperature might interfere with the hypothesized role of body temperature rhythms to synchronize rhythms in gene expression in peripheral tissues (Brown et al., 2002; Buhr et al., 2010; Schibler et al., 2015). The 3-day recovery period is a significant portion of the period of pump life from the 7 day, emphasizing the need to find alternative routes of administration or substrates that can be more concentrated to accommodate the fixed minipump volume, thus allowing longer studies. Our use of drinking water to deliver d-luciferin allows us to avoid the use of anesthesia and surgery, thus avoiding these potential effects on body temperature rhythms, but may introduce another source of variability due to uneven intake of substrate over the day.
Cycles in skin pigmentation and hair regrowth after shaving of pigmented animals can interfere with bioluminescence imaging (Curtis et al., 2011) and should be considered when planning long-term data collection. At the time of shaving, we noted variations in skin color and texture. Some animals exhibited a mottled skin color on both back and abdomen, with irregular patches of dark pigmentation. These variations likely arose from the stage of hair growth the mouse was in at the time of shaving, which does not take place uniformly across the animal but rather occurs in waves (Plikus and Chuong, 2008). In some cases, hair removal itself can cause more rapid hair regrowth, or the animal may have already been in an active stage of the hair regrowth cycle (Li et al., 2017). Future studies to address this may include crossing transgenes onto an albino background as we have done here to avoid the pigmentation and avoid the need for shaving. A hairless mouse might provide optimal background (Collaco and Geusz, 2003; Izumi et al., 2017) although hairless mice might still have skin pigmentation and can show other alterations in their phenotype (Hoshino et al., 2017). Moreover, there are sex differences in the optical properties of murine skin to be considered in experimental design. Males show an increase in reflectance and scattering of the bioluminescent signal due to their generally thicker dermis (Calabro et al., 2011). Consequently, careful consideration of timing of shaving as well as hair regrowth patterns must be taken to ensure optimal bioluminescence recordings. As described, the variability of pigmentation and hair regrowth patterns might be very limiting when recording from a tissue-specific area. Both albino and hairless phenotypes arise from recessive alleles; generating reporter mice with either albino coat or hairlessness requires at least 2 generations of breeding and might preclude generating more complicated genetic combinations (Konger et al., 2016).
Our current results suggest that administration of substrate in the drinking water can offer a noninvasive and temporally unlimited method for substrate delivery, at the cost of increased and circadian-modulated noise due to the sporadic dosing. Depending on the experimental goals and the timing of reporter expression relative to the drinking behavior rhythm, this method may be more or less desirable. Pump delivery allows continuous dosing for multiple weeks, but brings questions of substrate stability, given long-term holding substrate at body temperature and introduces the constraint of limited pump volume.
Future Directions
We anticipate further developments that will continue to optimize this approach for study of the circadian system. We look forward to studies of mice with various bioluminescent reporters, other synthetic substrates, and varied delivery methods. It is key to develop tissue-specific circadian reporters, and substrates may then need to be developed with each target tissue in mind. Further innovation is possible as this method expands. We did not test other PMTs available but innovations here might allow better detection of signals. Note that although firefly luciferase emits green light at room temperature, this emission is red-shifted at 37 °C and further red-shifted by depth-dependent spectral differences in transmission through the body (Zhao et al., 2005). PMTs with increased sensitivity at long wavelengths may thus be desirable. We expect that further optimization of these methods is possible, but here we demonstrate a method that reliably detects circadian rhythms in bioluminescence from the mPer2Luc mouse.
Supplemental Material
sj-jpeg-3-jbr-10.1177_07487304211062829 – Supplemental material for Methods for Detecting PER2:LUCIFERASE Bioluminescence Rhythms in Freely Moving Mice
Supplemental material, sj-jpeg-3-jbr-10.1177_07487304211062829 for Methods for Detecting PER2:LUCIFERASE Bioluminescence Rhythms in Freely Moving Mice by Blanca Martin-Burgos, Wanqi Wang, Ivana William, Selma Tir, Innus Mohammad, Reja Javed, Stormi Smith, Yilin Cui, Jessica Arzavala, Dalilah Mora, Ciearra B. Smith, Vincent van der Vinne, Penny C. Molyneux, Stephen C. Miller, David R. Weaver, Tanya L. Leise and Mary E. Harrington in Journal of Biological Rhythms
Supplemental Material
sj-jpeg-4-jbr-10.1177_07487304211062829 – Supplemental material for Methods for Detecting PER2:LUCIFERASE Bioluminescence Rhythms in Freely Moving Mice
Supplemental material, sj-jpeg-4-jbr-10.1177_07487304211062829 for Methods for Detecting PER2:LUCIFERASE Bioluminescence Rhythms in Freely Moving Mice by Blanca Martin-Burgos, Wanqi Wang, Ivana William, Selma Tir, Innus Mohammad, Reja Javed, Stormi Smith, Yilin Cui, Jessica Arzavala, Dalilah Mora, Ciearra B. Smith, Vincent van der Vinne, Penny C. Molyneux, Stephen C. Miller, David R. Weaver, Tanya L. Leise and Mary E. Harrington in Journal of Biological Rhythms
Supplemental Material
sj-jpg-10-jbr-10.1177_07487304211062829 – Supplemental material for Methods for Detecting PER2:LUCIFERASE Bioluminescence Rhythms in Freely Moving Mice
Supplemental material, sj-jpg-10-jbr-10.1177_07487304211062829 for Methods for Detecting PER2:LUCIFERASE Bioluminescence Rhythms in Freely Moving Mice by Blanca Martin-Burgos, Wanqi Wang, Ivana William, Selma Tir, Innus Mohammad, Reja Javed, Stormi Smith, Yilin Cui, Jessica Arzavala, Dalilah Mora, Ciearra B. Smith, Vincent van der Vinne, Penny C. Molyneux, Stephen C. Miller, David R. Weaver, Tanya L. Leise and Mary E. Harrington in Journal of Biological Rhythms
Supplemental Material
sj-jpg-11-jbr-10.1177_07487304211062829 – Supplemental material for Methods for Detecting PER2:LUCIFERASE Bioluminescence Rhythms in Freely Moving Mice
Supplemental material, sj-jpg-11-jbr-10.1177_07487304211062829 for Methods for Detecting PER2:LUCIFERASE Bioluminescence Rhythms in Freely Moving Mice by Blanca Martin-Burgos, Wanqi Wang, Ivana William, Selma Tir, Innus Mohammad, Reja Javed, Stormi Smith, Yilin Cui, Jessica Arzavala, Dalilah Mora, Ciearra B. Smith, Vincent van der Vinne, Penny C. Molyneux, Stephen C. Miller, David R. Weaver, Tanya L. Leise and Mary E. Harrington in Journal of Biological Rhythms
Supplemental Material
sj-jpg-12-jbr-10.1177_07487304211062829 – Supplemental material for Methods for Detecting PER2:LUCIFERASE Bioluminescence Rhythms in Freely Moving Mice
Supplemental material, sj-jpg-12-jbr-10.1177_07487304211062829 for Methods for Detecting PER2:LUCIFERASE Bioluminescence Rhythms in Freely Moving Mice by Blanca Martin-Burgos, Wanqi Wang, Ivana William, Selma Tir, Innus Mohammad, Reja Javed, Stormi Smith, Yilin Cui, Jessica Arzavala, Dalilah Mora, Ciearra B. Smith, Vincent van der Vinne, Penny C. Molyneux, Stephen C. Miller, David R. Weaver, Tanya L. Leise and Mary E. Harrington in Journal of Biological Rhythms
Supplemental Material
sj-jpg-13-jbr-10.1177_07487304211062829 – Supplemental material for Methods for Detecting PER2:LUCIFERASE Bioluminescence Rhythms in Freely Moving Mice
Supplemental material, sj-jpg-13-jbr-10.1177_07487304211062829 for Methods for Detecting PER2:LUCIFERASE Bioluminescence Rhythms in Freely Moving Mice by Blanca Martin-Burgos, Wanqi Wang, Ivana William, Selma Tir, Innus Mohammad, Reja Javed, Stormi Smith, Yilin Cui, Jessica Arzavala, Dalilah Mora, Ciearra B. Smith, Vincent van der Vinne, Penny C. Molyneux, Stephen C. Miller, David R. Weaver, Tanya L. Leise and Mary E. Harrington in Journal of Biological Rhythms
Supplemental Material
sj-jpg-14-jbr-10.1177_07487304211062829 – Supplemental material for Methods for Detecting PER2:LUCIFERASE Bioluminescence Rhythms in Freely Moving Mice
Supplemental material, sj-jpg-14-jbr-10.1177_07487304211062829 for Methods for Detecting PER2:LUCIFERASE Bioluminescence Rhythms in Freely Moving Mice by Blanca Martin-Burgos, Wanqi Wang, Ivana William, Selma Tir, Innus Mohammad, Reja Javed, Stormi Smith, Yilin Cui, Jessica Arzavala, Dalilah Mora, Ciearra B. Smith, Vincent van der Vinne, Penny C. Molyneux, Stephen C. Miller, David R. Weaver, Tanya L. Leise and Mary E. Harrington in Journal of Biological Rhythms
Supplemental Material
sj-jpg-15-jbr-10.1177_07487304211062829 – Supplemental material for Methods for Detecting PER2:LUCIFERASE Bioluminescence Rhythms in Freely Moving Mice
Supplemental material, sj-jpg-15-jbr-10.1177_07487304211062829 for Methods for Detecting PER2:LUCIFERASE Bioluminescence Rhythms in Freely Moving Mice by Blanca Martin-Burgos, Wanqi Wang, Ivana William, Selma Tir, Innus Mohammad, Reja Javed, Stormi Smith, Yilin Cui, Jessica Arzavala, Dalilah Mora, Ciearra B. Smith, Vincent van der Vinne, Penny C. Molyneux, Stephen C. Miller, David R. Weaver, Tanya L. Leise and Mary E. Harrington in Journal of Biological Rhythms
Supplemental Material
sj-jpg-16-jbr-10.1177_07487304211062829 – Supplemental material for Methods for Detecting PER2:LUCIFERASE Bioluminescence Rhythms in Freely Moving Mice
Supplemental material, sj-jpg-16-jbr-10.1177_07487304211062829 for Methods for Detecting PER2:LUCIFERASE Bioluminescence Rhythms in Freely Moving Mice by Blanca Martin-Burgos, Wanqi Wang, Ivana William, Selma Tir, Innus Mohammad, Reja Javed, Stormi Smith, Yilin Cui, Jessica Arzavala, Dalilah Mora, Ciearra B. Smith, Vincent van der Vinne, Penny C. Molyneux, Stephen C. Miller, David R. Weaver, Tanya L. Leise and Mary E. Harrington in Journal of Biological Rhythms
Supplemental Material
sj-jpg-5-jbr-10.1177_07487304211062829 – Supplemental material for Methods for Detecting PER2:LUCIFERASE Bioluminescence Rhythms in Freely Moving Mice
Supplemental material, sj-jpg-5-jbr-10.1177_07487304211062829 for Methods for Detecting PER2:LUCIFERASE Bioluminescence Rhythms in Freely Moving Mice by Blanca Martin-Burgos, Wanqi Wang, Ivana William, Selma Tir, Innus Mohammad, Reja Javed, Stormi Smith, Yilin Cui, Jessica Arzavala, Dalilah Mora, Ciearra B. Smith, Vincent van der Vinne, Penny C. Molyneux, Stephen C. Miller, David R. Weaver, Tanya L. Leise and Mary E. Harrington in Journal of Biological Rhythms
Supplemental Material
sj-jpg-6-jbr-10.1177_07487304211062829 – Supplemental material for Methods for Detecting PER2:LUCIFERASE Bioluminescence Rhythms in Freely Moving Mice
Supplemental material, sj-jpg-6-jbr-10.1177_07487304211062829 for Methods for Detecting PER2:LUCIFERASE Bioluminescence Rhythms in Freely Moving Mice by Blanca Martin-Burgos, Wanqi Wang, Ivana William, Selma Tir, Innus Mohammad, Reja Javed, Stormi Smith, Yilin Cui, Jessica Arzavala, Dalilah Mora, Ciearra B. Smith, Vincent van der Vinne, Penny C. Molyneux, Stephen C. Miller, David R. Weaver, Tanya L. Leise and Mary E. Harrington in Journal of Biological Rhythms
Supplemental Material
sj-jpg-7-jbr-10.1177_07487304211062829 – Supplemental material for Methods for Detecting PER2:LUCIFERASE Bioluminescence Rhythms in Freely Moving Mice
Supplemental material, sj-jpg-7-jbr-10.1177_07487304211062829 for Methods for Detecting PER2:LUCIFERASE Bioluminescence Rhythms in Freely Moving Mice by Blanca Martin-Burgos, Wanqi Wang, Ivana William, Selma Tir, Innus Mohammad, Reja Javed, Stormi Smith, Yilin Cui, Jessica Arzavala, Dalilah Mora, Ciearra B. Smith, Vincent van der Vinne, Penny C. Molyneux, Stephen C. Miller, David R. Weaver, Tanya L. Leise and Mary E. Harrington in Journal of Biological Rhythms
Supplemental Material
sj-jpg-8-jbr-10.1177_07487304211062829 – Supplemental material for Methods for Detecting PER2:LUCIFERASE Bioluminescence Rhythms in Freely Moving Mice
Supplemental material, sj-jpg-8-jbr-10.1177_07487304211062829 for Methods for Detecting PER2:LUCIFERASE Bioluminescence Rhythms in Freely Moving Mice by Blanca Martin-Burgos, Wanqi Wang, Ivana William, Selma Tir, Innus Mohammad, Reja Javed, Stormi Smith, Yilin Cui, Jessica Arzavala, Dalilah Mora, Ciearra B. Smith, Vincent van der Vinne, Penny C. Molyneux, Stephen C. Miller, David R. Weaver, Tanya L. Leise and Mary E. Harrington in Journal of Biological Rhythms
Supplemental Material
sj-jpg-9-jbr-10.1177_07487304211062829 – Supplemental material for Methods for Detecting PER2:LUCIFERASE Bioluminescence Rhythms in Freely Moving Mice
Supplemental material, sj-jpg-9-jbr-10.1177_07487304211062829 for Methods for Detecting PER2:LUCIFERASE Bioluminescence Rhythms in Freely Moving Mice by Blanca Martin-Burgos, Wanqi Wang, Ivana William, Selma Tir, Innus Mohammad, Reja Javed, Stormi Smith, Yilin Cui, Jessica Arzavala, Dalilah Mora, Ciearra B. Smith, Vincent van der Vinne, Penny C. Molyneux, Stephen C. Miller, David R. Weaver, Tanya L. Leise and Mary E. Harrington in Journal of Biological Rhythms
Supplemental Material
sj-pdf-1-jbr-10.1177_07487304211062829 – Supplemental material for Methods for Detecting PER2:LUCIFERASE Bioluminescence Rhythms in Freely Moving Mice
Supplemental material, sj-pdf-1-jbr-10.1177_07487304211062829 for Methods for Detecting PER2:LUCIFERASE Bioluminescence Rhythms in Freely Moving Mice by Blanca Martin-Burgos, Wanqi Wang, Ivana William, Selma Tir, Innus Mohammad, Reja Javed, Stormi Smith, Yilin Cui, Jessica Arzavala, Dalilah Mora, Ciearra B. Smith, Vincent van der Vinne, Penny C. Molyneux, Stephen C. Miller, David R. Weaver, Tanya L. Leise and Mary E. Harrington in Journal of Biological Rhythms
Supplemental Material
sj-pdf-2-jbr-10.1177_07487304211062829 – Supplemental material for Methods for Detecting PER2:LUCIFERASE Bioluminescence Rhythms in Freely Moving Mice
Supplemental material, sj-pdf-2-jbr-10.1177_07487304211062829 for Methods for Detecting PER2:LUCIFERASE Bioluminescence Rhythms in Freely Moving Mice by Blanca Martin-Burgos, Wanqi Wang, Ivana William, Selma Tir, Innus Mohammad, Reja Javed, Stormi Smith, Yilin Cui, Jessica Arzavala, Dalilah Mora, Ciearra B. Smith, Vincent van der Vinne, Penny C. Molyneux, Stephen C. Miller, David R. Weaver, Tanya L. Leise and Mary E. Harrington in Journal of Biological Rhythms
Footnotes
Acknowledgements
This work would not have been possible without the technical assistance and innovation of Dr. David Ferster (Actimetrics). We would like to thank Eric Jensen, Donna Mosley, and Juliane Donahue Bombosch for assistance with preparation of figures. We thank Halley Lin-Jones and Melissa Chenok for helpful discussions. This research was supported in part by National Institutes of Health (NIH) R15GM126545 to M.E.H., NIH R21NS103180 to D.R.W., and R01EB013270 to S.C.M. The content is solely the responsibility of the authors and does not necessarily represent the official views of the National Institutes of Health.
Conflict of Interest Statement
The author(s) have no potential conflicts of interest with respect to the research, authorship, and/or publication of this article.
Editorial Note
Dr. William J. Schwartz, previous editor of the Journal of Biological Rhythms graciously agreed to handle the editorial process surrounding review of this article. Neither the current Editor of the Journal (M.E.H.) or the Deputy Editor (D.R.W.) had any role in the review process and will remain blind to the reviewers’ identities.
ORCID iDs
NOTE
Supplementary material is available for this article online.
References
Supplementary Material
Please find the following supplemental material available below.
For Open Access articles published under a Creative Commons License, all supplemental material carries the same license as the article it is associated with.
For non-Open Access articles published, all supplemental material carries a non-exclusive license, and permission requests for re-use of supplemental material or any part of supplemental material shall be sent directly to the copyright owner as specified in the copyright notice associated with the article.