
Abstract
Odor discrimination behavior displays circadian fluctuations in mice, indicating that mammalian olfactory function is under control of the circadian system. This is further supported by the facts that odor discrimination rhythms depend on the presence of clock genes and that olfactory tissues contain autonomous circadian clocks. However, the molecular link between circadian function and olfactory processing is still unknown. To elucidate the molecular mechanisms underlying this link, we focused on the olfactory epithelium (OE), the primary target of odors and the site of the initial events in olfactory processing. We asked whether olfactory sensory neurons (OSNs) within the OE possess an autonomous circadian clock and whether olfactory pathways are under circadian control. Employing clock gene–driven bioluminescence reporter assays and time-dependent immunohistochemistry on OE samples, we found robust circadian rhythms of core clock genes and their proteins in OSNs, suggesting that the OE indeed contains an autonomous circadian clock. Furthermore, we performed a circadian transcriptome analysis and identified several OSN-specific components that are under circadian control, including those with putative roles in circadian olfactory processing, such as KIRREL2—an established factor involved in short-term OSN activation. The spatiotemporal expression patterns of our candidate proteins suggest that they are involved in short-term anabolic processes to rhythmically prepare the cell for peak performances and to promote circadian function of OSNs.
Circadian rhythms are found in a vast number of species (Dunlap, 1999), ranging from prokaryotes to mammals, and control a multitude of physiological and behavioral functions (Maywood et al., 2007). In most cases, they appear as daily rhythms in a light-dark regimen but persist in constant conditions with a period close to 24 h. Circadian rhythmicity is generated by cellular clocks, which are composed of transcriptional-translational feedback loops consisting of interacting clock genes (Bell-Pedersen et al., 2005). Molecular oscillations translate into rhythmic outputs on the molecular, cellular, tissue, and, eventually, behavioral level. While almost all cells in the body exhibit circadian oscillations (e.g., fibroblasts, liver, lung, and olfactory bulbs) (Abraham et al., 2005; Balsalobre, 2002; Reppert and Weaver, 2002; Yoo et al., 2004), multicellular organisms usually possess one or several master pacemakers, which exhibit sustained autonomous rhythmicity and synchronize their oscillations with external time cues (e.g., the light-dark cycle; Albrecht, 2012). In mammals, this master circadian pacemaker resides in the suprachiasmatic nuclei (SCN) of the anterior hypothalamus (Moore and Eichler, 1972; Ralph et al., 1990) and orchestrates a multitude of circadian outputs. One of these outputs is rhythmic odor discrimination (Granados-Fuentes et al., 2011). Since SCN-lesioned mice still show rhythmic odor discrimination, albeit with altered, potentially free-running peak phases (Granados-Fuentes et al., 2011), we believe that the SCN-independent clock in the olfactory system (Abraham et al., 2005; Granados-Fuentes et al., 2004; Granados-Fuentes et al., 2006) accounts for circadian control of odor discrimination. This is further supported by the fact that rhythmic odor discrimination depends on clock genes (Granados-Fuentes et al., 2011) and on the hypothalamic neurotransmitter vasoactive intestinal polypeptide (VIP), which is also critical for rhythmic clock gene expression in olfactory tissues (Miller et al., 2014). On the other hand, there is evidence that odor is able to influence the clock: periodic odor administration is able to modify the circadian behavior of mice (Abraham et al., 2013) and elicits changes in clock gene expression in extra-SCN brain areas (Pantazopoulos et al., 2011)—similar to food selectively influencing circadian behavior and some peripheral clocks (Damiola et al., 2000; Mistlberger, 1994). Taken together, these findings indicate an intricate link between circadian function and odor processing. To elucidate the molecular mechanisms underlying this link, we focused on the olfactory epithelium, assuming that circadian gating of odor processing most likely occurs in a primary olfactory tissue. Specifically, we asked (1) whether the olfactory epithelium (OE) and olfactory sensory neurons (OSNs) within this tissue possess an autonomous circadian clock and (2) whether olfactory molecular pathways are under circadian control. We found that the OE, including OSNs, exhibit circadian oscillations of core clock components on the messenger RNA (mRNA) and protein levels and that these oscillations persist in vitro for many days. To identify the link between olfactory processing and the circadian clock, we performed a microarray-based transcriptome analysis of OE tissue harvested at different times of day and showed that several OSN-specific components of the olfactory pathway are under circadian control, including several candidates with putative roles in circadian olfactory processing, such as KIRREL2—an established factor involved in short-term OSN activation (Fischl et al., 2014).
Materials and Methods
Animals and Housing
Male C57Bl/6 mice from our animal facility (FEM, Berlin, Germany) at 6 to 8 weeks of age were used for tissue sampling with subsequent mRNA isolation or immunohistochemistry. Heterozygous and homozygous male and female PER2::LUCIFERASE mice (PER2::LUC; Yoo et al., 2004), bred and raised in our animal facility (FEM), were used for in vitro bioluminescence imaging. Mice were housed in pairs in macrolon cages, and food and water were provided ad libitum. Cages were placed in light-tight recording chambers with controlled ambient lighting. Procedures were authorized by and performed in accordance with guidelines and regulations of the German animal protection law (DeutschesTierschutzgesetz).
Tissue Sampling
For mRNA isolation forty-eight male C57Bl/6 mice were exposed to a 12-h/12-h light/dark (LD) cycle for at least 14 days to ensure proper entrainment of the circadian system to the ambient LD cycle. Subsequently, animals were transferred into constant darkness (DD) and killed by cervical dislocation at 4-h intervals starting 24 h after lights-off (= circadian time [CT] 12). The bilateral OEs were then explanted and shock-frozen in liquid nitrogen.
For immunohistochemistry twenty male C57Bl/6 mice were exposed to a 12-h/12-h LD cycle for at least 14 days to ensure proper entrainment of the circadian system to the ambient LD cycle. Subsequently, animals were either transferred into constant darkness (12 animals, DD) or remained in LD conditions (8 animals). Mice in DD were killed by cervical dislocation at 6-h intervals, starting 36 h after lights-off (= CT0) and the bilateral OEs were processed for transverse cryosections. Mice remaining in LD were killed by cervical dislocation at ZT0 and ZT12, and the bilateral OEs were processed for top-view preparations (Oberland and Neuhaus, 2014).
Times in LD are referred to as zeitgeber times (ZT), with ZT0 corresponding to lights-on. Times in DD are referred to as circadian times (CT), with CT0 corresponding to the beginning of the subjective day (previous lights-on in LD) and CT12 corresponding to the start of the subjective night (previous lights-off in LD).
Quantitative Real-Time Polymerase Chain Reaction
OE tissues were sampled as described for mRNA isolation. RNA extraction, complementary DNA (cDNA) synthesis, real-time quantitative polymerase chain reaction (qPCR), and data analysis were performed after (Schmittgen and Livak, 2008) with the following modifications: RNA was eluted in final volumes of 30 µL RNase-free water, and concentrations were determined by spectrophotometry (Nanodrop 2000c; Thermo Scientific, Dreieich, Germany). Results were then used to calculate the volumes containing 1 µg RNA for use in cDNA synthesis employing RevertAid Reverse Transcriptase (Fermentas; ThermoScientific). Quantitative real-time PCR with Sybr-Green detection was performed in triplicates. Data were normalized to simultaneously measured Gapdh-RNA concentrations. Relative mRNA concentrations were calculated as 2−ΔΔCt ± SEM with n = 3 to 4 per time point.
Odora Cell Culture and Reporter Cell Generation
Odora cells (undifferentiated cells, kindly provided by Prof. Stephan Frings, University of Heidelberg, Germany) were cultured in Dulbecco’s modified Eagle’s medium (DMEM; Invitrogen, Darmstadt, Germany) supplemented with 10% fetal bovine serum (FBS) at 33 °C and 7% CO2 (Murrell and Hunter, 1999). To initiate differentiation into olfactory sensory neurons, cells were cultured in DMEM, supplemented with 10% FBS, 1 µg/mL insulin (Sigma, St. Louis, MO), 20 µM dopamine (Sigma), and 100 µM ascorbic acid (Sigma) (from here on referred to as “differentiation medium”) at 39 °C and 7% CO2 for 3 days. Differentiated Odora cells were plated at a density of 200,000 cells per 35-mm well and transduced with a virus suspension of either PBL (Per2 Blasticidin Luc) or BPL (Bmal1 puromycin luc). For transduction, each culture received 2 mL of a 1:2 mixture of virus suspension and DMEM. The mixture was supplemented with 8 ng/µL protaminesulfate, 10% FBS, 1 µg/mL insulin, 20 µM dopamine, and 100 µM ascorbic acid. Cells were then incubated at 39 °C and 7% CO2 for 24 h. Virus suspension was removed, and 2 mL of differentiation medium, supplemented with either puromycin 1:1000 or blasticidin 1:1000, was added to select for transduced cells. Eventually, differentiated Odora cells carrying a luciferase-based reporter for either Per2 or Bmal1 were cultured in 35-mm dishes for subsequent procedures.
In Vitro Bioluminescence Recording
Organotypic slices
PER2::LUC mice were exposed to a 12-h/12-h LD cycle for at least 14 days to ensure proper entrainment of the circadian system to the ambient LD cycle. Subsequently, mice were killed 1 to 2 h before lights-off (ZT10/11) by cervical dislocation, their bilateral OE tissues explanted and collected in chilled Hank’s buffered saline solution. OE tissues were sectioned into 2 equally sized pieces, and each piece was cultured in a Petri dish on a Millicell membrane (Millipore, Merck, Darmstadt, Germany) as described in Abraham et al. (2010). Dishes were sealed with grease and placed under photomultiplier tubes (Hamamatsu P7360-02; Hamamatsu, Japan) at 37 °C/5% CO2. PER2-driven bioluminescence was recorded in 5-min bins for at least 8 days.
Odora cells
Differentiated Odora cells were cultured at a density of 100,000 cells/35-mm dish for 4 days in differentiation medium containing 10% FBS (see above) at 39 °C and 7% CO2. Right before bioluminescence recordings, the medium was changed to 1 mL of differentiation medium supplemented with 10% FBS and 0.1 mM beetle luciferin (BioThema, Handen, Sweden). Dishes were sealed with grease and placed under photomultiplier tubes (Hamamatsu P7360-02) at 39 °C/7% CO2. PER2-driven bioluminescence was recorded in 5- to 10-min bins for at least 8 days.
Fluorescent Immunohistochemistry
Cryosections
C57Bl/6 mice were decapitated, and skin, muscle tissue, and lower jaws were removed. Skulls were then fixed in 4% paraformaldehyde (PFA) overnight, cryoprotected in 20% sucrose solution, embedded in cryo medium (Jung; Leica Microsystems, Wetzlar, Germany), sectioned at 14 µm using a Microm HM 560 (Microm, Walldorf, Germany), and sections mounted to adhesion slides. Following washes in phosphate-buffered saline (PBS), supplemented with 0.9 mM CaCl2 and 0.48 mM MgCl2 (PBS+), sections were incubated with blocking solution (PBS+ with 0.1% Triton X-100, supplemented with 1% gelatin, 1 h at room temperature) and primary antibody (overnight at 4 °C). The following primary antibodies were used on alternate sections at a dilution of 1:200: polyclonal rabbit anti-PER2 (PER21-A; Alpha Diagnostics, San Antonio, TX), polyclonal goat anti-KIRREL2 (AF2930; R&D Systems, Minneapolis, MN), polyclonal rabbit anti-LRRC3B (sc-99553; Santa Cruz Biotechnology, Santa Cruz, CA), polyclonal rabbit anti-EPHA5 (sc-927; Santa Cruz Biotechnology), and goat anti-OMP (019-22291; Wako Chemicals, Neuss, Germany). Following incubation with primary antibodies, sections were washed in PBS+ and incubated with anti-rabbit AF488 (A311055 [Invitrogen], used against PER21-A, LRRC3B, and EPHA5), anti-goat AF488 (A11067 [Invitrogen], used against KIRREL2), or anti-goat AF594 (A21468 [Invitrogen], used against OMP) for 45 min at room temperature in the dark. Eventually, samples were embedded in Fluoromount (Southern Biotech, Birmingham, AL), sealed with cover slides, and stored at 4 °C. Anti-PER2 and anti-OMP were also used for double stainings.
Top-view preparations
Mice were decapitated and skin and lower jaws removed. Heads were then split on both sides along the sagittal midline to expose both nasal cavities. Turbinates were removed and the bilateral olfactory epithelia of the nasal septa were collected in Ringer’s solution without touching the epithelial surface. Subsequently, epithelia were carefully transferred to adhesion slides and fixed with 4% PFA in PBS+ (10 min at room temperature). After washing with PBS+, epithelia were incubated in blocking solution (1 h at room temperature) and double stained using 500 µL of an antibody mix (polyclonal goat anti-KIRREL2, AF2930 [R&D Systems], and polyclonal rabbit anti–MOR-EG [Baumgart et al., 2014], 1:200 in blocking solution) on each tissue. Samples were incubated overnight at 4 °C. Following washes in PBS+, tissues were incubated with secondary antibodies anti-goat AF568 (A11057; Invitrogen, Carlsbad, CA) and anti-rabbit AF488 (A21206; Invitrogen), diluted 1:500, for 45 min at room temperature in the dark. Eventually, samples were embedded in Fluoromount and sealed with cover slides.
Analysis of Immunohistochemical Data
Prior to immunohistochemical analysis, all stainings were visually inspected and sections with unusually high staining intensities in background areas or extensive tissue damage were excluded from the analysis.
Transverse sections
Photomicrographs were generated with a Leica TCS SPE confocal system. Sections representing comparable transverse planes were selected. Subsequently, regions to be photographed were selected based on quality of sections, angle, and good visibility of cell layers. Second, photomicrographs of selected sections of all 4 time points were taken, using the same settings for all sections of the same protein.
Top-view preparations
Using similar exposure times, photomicrographs were taken as tile images using a Leica AF 6000 LX system with the Leica filter block L5 to detect AF488 and N3 to detect AF561. Subsequently, tile images were merged to form overview images of the entire OE segment. Representative images of double-stained top-view preparations were generated with a Leica TCS SPE confocal system. Anti–MOR-EG staining was used as a quality control in top-view preparations, because it stains cilia at a particular high density, enabling us to visually identify tissue damage as represented by fragmented cilia. Damaged areas were identified and excluded from evaluation. Quantifications of anti-PER2 and anti-KIRREL2 stainings were performed with ImageJ 1.49s software (W. S. Rasband, National Institutes of Health, Bethesda, MD). For anti-PER2, 17 regions of interest (ROIs) of 10 µm diameter were evenly spaced over OSNs, support cells, and knobs with cilia and their mean gray values measured. Subsequently, all ROI values were averaged for the whole image. For anti-KIRREL2, circular ROIs with diameters of 1.5 µm (for knobs only) or larger were used to mark knobs only and knobs with cilia. ROIs were counted, and the analyzed area was measured. Eventually, the numbers of knobs with and without cilia per 100 µm2 were calculated.
Transcriptional Profiling (Microarray Analysis)
RNA samples were prepared as described previously. RNA of 4 mice per sampling time was pooled in equal amounts. Synthesis of cDNA, amplification, labeling, and hybridization were performed by the “Labor für Funktionelle Genomforschung” (LFGC, Charité, Berlin) by using GeneChip Mouse Gene 1.0 ST arrays (Affymetrix, Santa Clara, CA). Data analysis was performed with R (R Core Team, Vienna, Austria), using the packages affy (Gautier et al., 2004), topGO (Alexa and Rahnenfuhrer, 2010), and circular (Agostinelli and Lund, 2013). Genes expressed in a circadian manner were identified by using a cutoff p value of 0.05 with period length restricted to 24 h, a magnitude cutoff of ≥6 to represent expression and minimum amplitude of ≥0.2. Data for the Venn diagram of microarray comparisons were evaluated with a Bioinformatics & Research Computing public tool from Whitehead Institute for Biomedical Research (Cambridge, MA). All microarray raw data were deposited in the GEO database of the NCBI and can be accessed under accession no. GSE69853.
Identification of OSN-Specific Genes
Sammeta et al. (2007) and Nickell et al. (2012) performed genome-wide, OSN-specific transcriptome analyses by using the “OMP ± ratio.” Briefly, OE cells from transgenic mice expressing an OMP–green fluorescent protein fusion protein (OMP-GFP) were sorted by fluorescence-activated cell sorting (FACS), resulting in 2 fractions: (1) GFP+, enriched in OSNs, and (2) GFP–, enriched in all other cell types. The OMP ± ratio describes the probability of a gene being expressed in OSNs only: >1.3 yields a 0.99 probability (p < 0.0001) that the gene is exclusively expressed in OSNs (Nickell et al., 2012; Sammeta et al., 2007). OSN-specific genes from Sammeta et al. (2007) and Nickell et al. (2012) were compared with our expressed genes using a list comparison webtool (“Compare three lists”) from Bioinformatics and Research Computing, Whitehead Institute for Biomedical Research (http://jura.wi.mit.edu/bioc/tools/). Overlapping genes are considered OSN specific in our transcriptome analysis.
Analysis of Time-Series Data
Bioluminescence data were detrended by dividing through a 24-h running average and analyzed for periods and amplitudes using cosine wave fits (ChronoStar 1.0 by Stephan Lorenzen, Bernhard-Nocht-Institut, Hamburg, Germany). RNA time-series data were tested for circadian rhythmicity using CircWave Batch V3.3 (R. Hut, University of Groningen, Netherlands). Briefly, sine waves with periods in the circadian period range (18 h ≥ period ≤ 30 h) are fitted through the data, and their significances are tested against fitted horizontal lines through the overall averages. Results were corrected for multiple testing. Immunohistochemical quantifications were tested for significant differences using a Kruskal-Wallis test (Graph Pad Software, La Jolla, CA).
Results
Olfactory Sensory Neurons Possess an Autonomous Circadian Clock
To investigate whether the OE possesses an autonomous circadian clock, representative core clock genes were analyzed for rhythmic mRNA expression in OE tissue: Bmal1 as a crucial part of the positive arm of the feedback loop, mPer2 as a representative for the negative arm, and Rev-Erbα as part of a feedback on Bmal1 expression. OE tissues from mice previously entrained to 12 h of light/12 h of darkness (LD 12:12) were harvested at 4-h intervals over the course of 48 h starting 24 h after lights-off. Subsequently, RNA was extracted and mRNA expression profiles determined via qPCR. Clock genes were significantly rhythmic in the circadian range according to CircWave (Fig. 1A). Peak expressions and phase relationships of clock genes are in line with previous findings for peripheral circadian oscillators (Yamamoto et al., 2004), indicating a functional circadian clockwork in OE tissue.
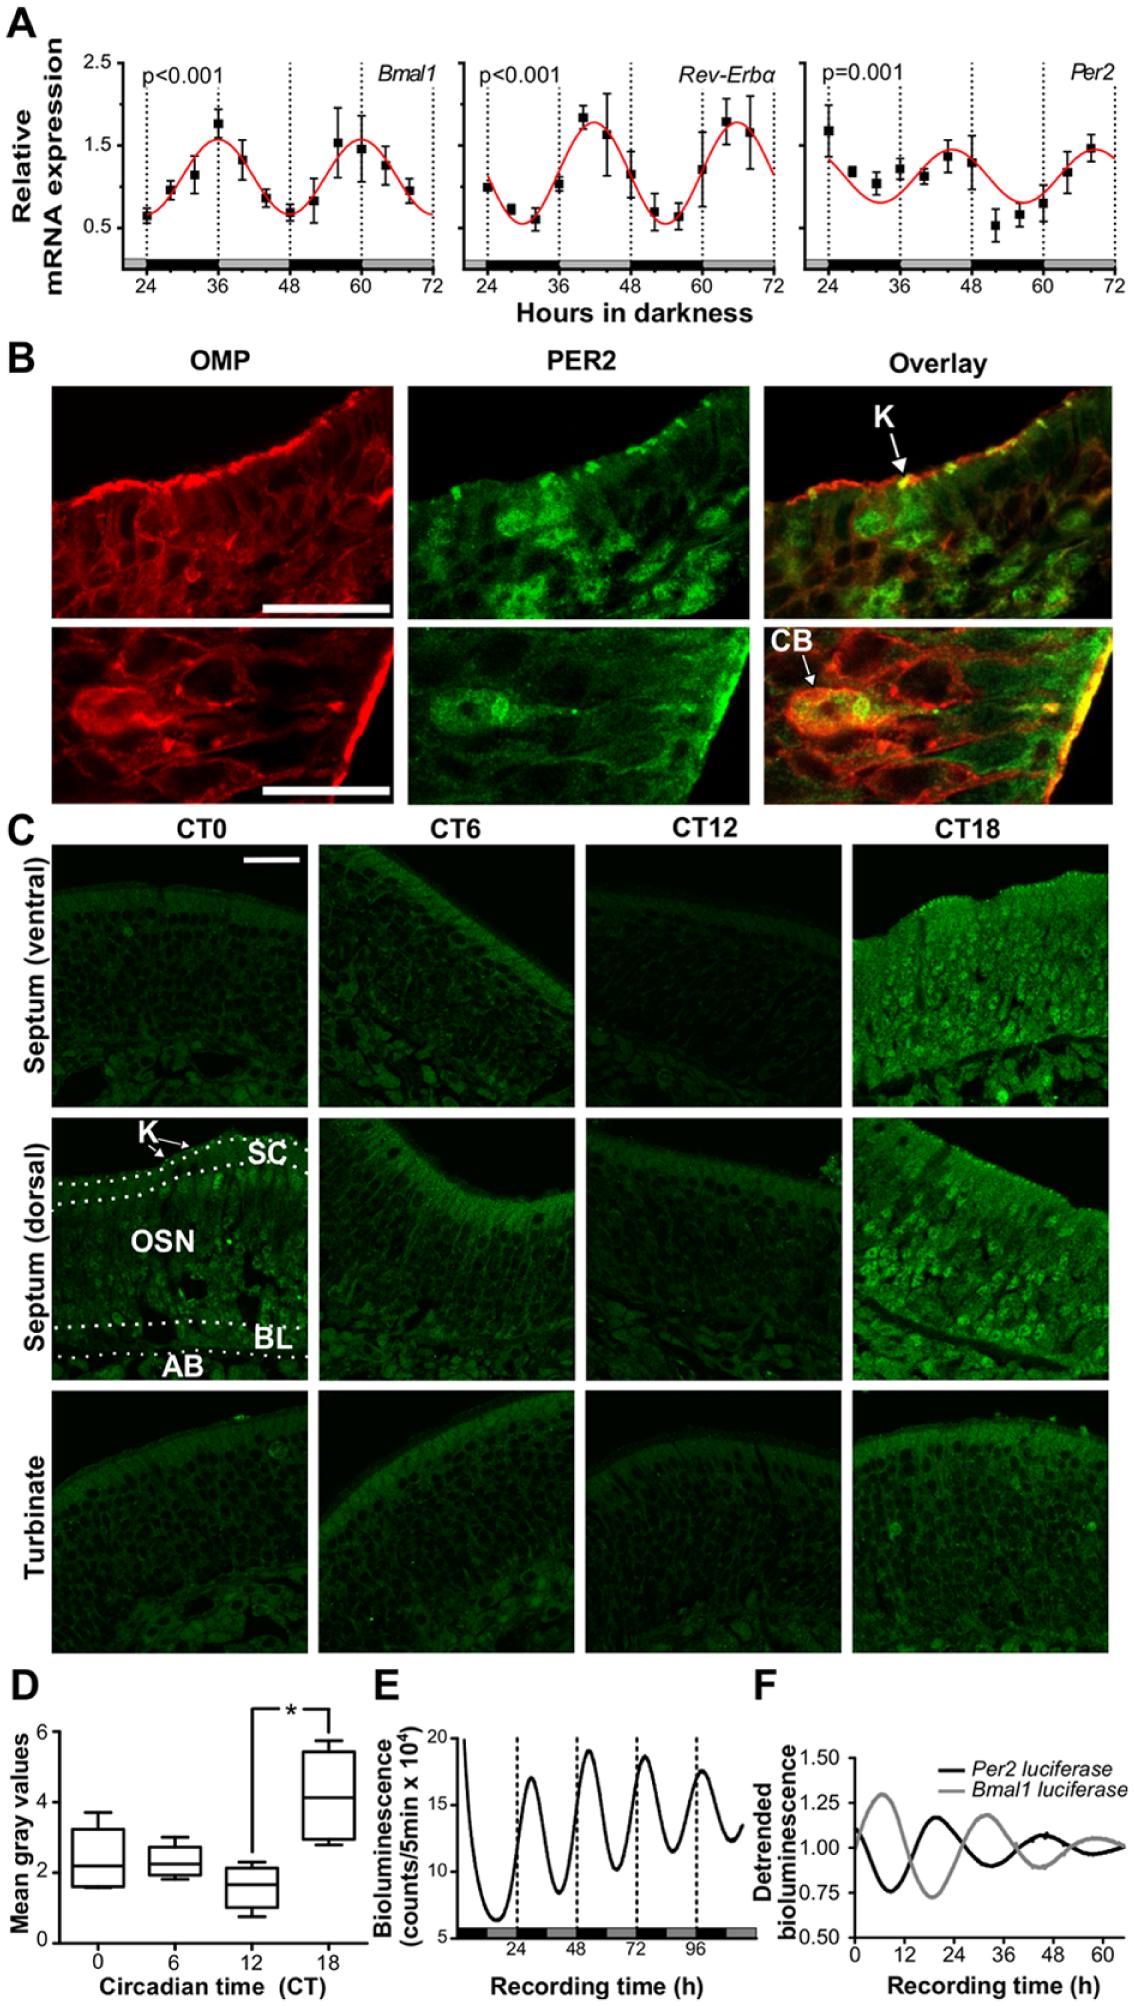
Olfactory sensory neurons contain an autonomous circadian clock. (A) Per2, Bmal1, and Rev-Erbα are expressed rhythmically in the olfactory epithelium (OE). All genes display significant circadian oscillations (18 h ≥ period ≤ 32 h). Data are depicted as means ± SEM, n = 4; red lines = sine wave fits from Circwave analysis fit. RNA was isolated from OEs harvested from entrained mice at regular intervals, and clock gene expression profiles were determined via quantitative polymerase chain reaction (PCR). Sample start was 24 h after lights-off. Horizontal gray and black bars denote the subjective day and night phases, respectively, at the time of sampling. (B) Olfactory marker protein (OMP) and PER2 co-localize in knobs and cell bodies of olfactory sensory neurons (OSNs). Close-ups of anti–OMP- (red) and anti–PER2-immunofluorescence (green) in 2 representative OE slices show co-localization (overlay = yellow) in knobs (upper panel, lateral region of OE) and cell bodies (lower panel, septal region of OE) of OSNs. K = dendritic knob; CB = OSN cell body; scale bars = 25 µm. (C) PER2 immunofluorescence shows a circadian pattern in abundance in distinct areas of the OE. Representative photomicrographs show anti-PER2 immunofluorescence (green) in selected areas of the OE—ventral septum, dorsal septum, and a turbinate—at different time points. OE tissue samples were harvested from entrained mice at regular intervals starting at 36 h after lights-off (= CT0). The tissue layers that the immunocytochemical analyses were based on are delineated by white-dotted lines (the most dorsal layer lined the nasal cavity in vivo, while the most ventral layer was attached to the nasal bone). PER2 immunofluorescence is visible in cell bodies as well as in nuclei and knobs. Staining intensity peaks at CT18 throughout all regions, but in particular within the OSN cell layer. K = cell layer containing dendritic knobs (white arrows) and cilia (not visible); SC = supporting cell layer; OSN = layer with olfactory sensory neurons; BL = basal layer; AB = axon bundles. Scale bar = 25 µm. (D) Intensity of overall PER2 immunostaining varied with time. Mean gray values (n = 4-5 slices per time point) of PER2 staining, averaged over all regions displayed in B, showed a significant circadian rhythm with a peak at CT18 and a trough at CT12 (Kruskal-Wallis test, followed by Dunn’s multiple comparison test, p < 0.05). The boxplots display median mean gray values and their upper and lower quartiles. (E) Representative example of an OE slice displaying robust circadian rhythms in PER2-driven bioluminescence in vitro. The mean circadian period of OE rhythms was 23.5 ± 0.6 h SEM (n = 8). High-amplitude oscillations persisted for at least 5 days, exhibiting a low damping rate. In vitro PER2 peak phases translate to roughly CT17. Horizontal bars show the projected light (gray)/dark (black) regime that the mice were entrained to at the time of OE extraction. (F) Representative examples of bioluminescence recorded from Odora cells lentivirally transduced with reporter constructs for Per2-luciferase (black) and Bmal1-luciferase (gray) show antiphasic circadian oscillations over the course of 3 days. The mean circadian periods were 23.9 ± 0.3 h SEM, n = 8, for Per2-luc reporter cells and 25.9 ± 0.3 h SEM, n = 10, for Bmal1-luc reporter cells.
To test whether rhythmicity of transcription translates into rhythmic protein levels, we measured the expression of PER2 protein in ex vivo OE tissues harvested at regular intervals.
To our surprise, PER2 did not only occur in cell bodies of neuronal and nonneuronal OE cells but also displayed substantial expression in knobs, which are the sensory endings of OSN dendrites and bear about 10 to 20 modified cilia, carrying the olfactory receptors (ORs) (Pavelka and Roth, 2015). Co-localizations of PER2 with the olfactory marker protein OMP that stains all parts of mature OSNs, including the knobs (Kawagishi et al., 2014), demonstrate this unusual localization (Fig. 1B). In all areas of the OE, anti-PER2 immunofluorescence was highest at CT18, suggesting higher PER2 abundance during the subjective night (Fig. 1B,C). When distinguishing between individual tissues layers, it is apparent that OSN cell bodies and knobs within the cilial layer also displayed the brightest PER2 staining at CT18 and the lowest intensities at CT12, consistent with the assumption that OE neurons contain a circadian clock (Fig. 1B). If the OE functions as a circadian oscillator, rhythms in core clock components are expected to persist in vitro. Indeed, organotypic slices of OE explanted from transgenic PER2::LUC mice (Yoo et al., 2004) displayed robust rhythms of PER2-driven bioluminescence in the circadian range (mean period = 23.5 ± 0.6 h, n = 8) for more than 5 days with in vitro peak expression at CT15.5 ± 2.0 h SEM, n = 8 (Fig. 1D).
The olfactory epithelium consists of neuronal and nonneuronal cell types. Hence, circadian rhythms in clock gene expression may be derived from either cell type. However, a close link between circadian rhythmicity and olfactory function is most likely when rhythmic clock gene expression occurs in OSNs. While Figure 1B indeed suggests that PER2 protein expression occurred in OSNs, this issue required further investigation. Since primary OSNs die after several hours in culture, we reverted to immortalized OSNs (cell line Odora), which enabled us to study rhythms and gene expression exclusively in olfactory neurons. To test whether differentiated Odora cells display circadian rhythms in clock gene expression, Per2 luciferase (Per2-luc) and Bmal1-luc reporter constructs were lentivirally introduced into Odora cells, and clock gene–driven bioluminescence was recorded for several days. Both constructs revealed circadian rhythms in bioluminescence (Fig. 1E), with the Bmal1-luc reporter peaking in antiphase to Per2-luc, which is consistent with the in vivo data (Fig. 1A). Bmal1-luc peaked about 18 h and Per2-luc about 31.5 h after medium change, which is very similar to clock gene phasing in dexamethasone-synchronized U2OS cells (Dr. Bert Maier, personal communication, 2015). Hence, our findings indicate that OSNs alone possess a local circadian clock.
Circadian Oscillations in the Expression of Olfactory Genes
Assuming that the OE, as the first level in odor recognition, is a pivotal point in possible regulation pathways, we hypothesized that the OE clock drives rhythmic olfactory processes, which, eventually, will result in rhythmic olfactory sensitivity as observed by Granados-Fuentes et al. (2011). To test this, we first investigated whether pathways involved in odor detection and/or subsequent signaling are under circadian control—that is, whether genes, previously described to be involved in key olfactory pathways, exhibit circadian expression profiles. We selected the following candidates as representatives for functional groups in the olfactory signaling cascade and characterized their time-of-day dependent mRNA expression profiles at 4-h intervals over the course of 48 h using qPCR: (1) OMP is an olfactory marker protein, specifically expressed in mature OSNs (Kawagishi et al., 2014). (2) Rtp1, Rtp2, and Reep1 represent transport proteins crucial for incorporation of ORs in the membrane of olfactory sensory neuron cilia (Saito et al., 2004). (3) Adrbk1 (GRK2) and Adrbk2 (GRK3) are representatives of G protein–coupled receptor kinases, which are implicated in receptor desensitization, a crucial step in maintaining olfactory receptor function (Arriza et al., 1992; Dawson et al., 1993). (4) Olfr124 is a multipotent olfactory receptor that represents the OR family (Grosmaitre et al., 2009). (5) Gnal is the olfactory-specific variant of the G protein alpha subunit and is expressed in all OSNs (Kerr et al., 2008). (6) Rgs2 is specifically expressed in olfactory tissue and is known to regulate olfactory signaling by interaction with Adcy3 (Sinnarajah et al., 2001). (7) Adcy3 is the adenylate cyclase involved in olfactory signal transduction. Knockouts of Adcy3 are not able to smell (Trinh and Storm, 2004).
We found that Rtp1 and OMP were significantly rhythmic (p = 0.028 and p = 0.04, respectively, n = 3-4 per time point), while expression of Rtp2 and Rgs2 appeared to fluctuate in a circadian manner, but rhythmicity did not reach significance (Fig. 2). Adcy3, Adrbk1, Adrbk2, Olfr124, Gnal, and Reep1 displayed no circadian oscillations. Consequently, our results suggest that some of the key components in olfactory processing are under circadian control.
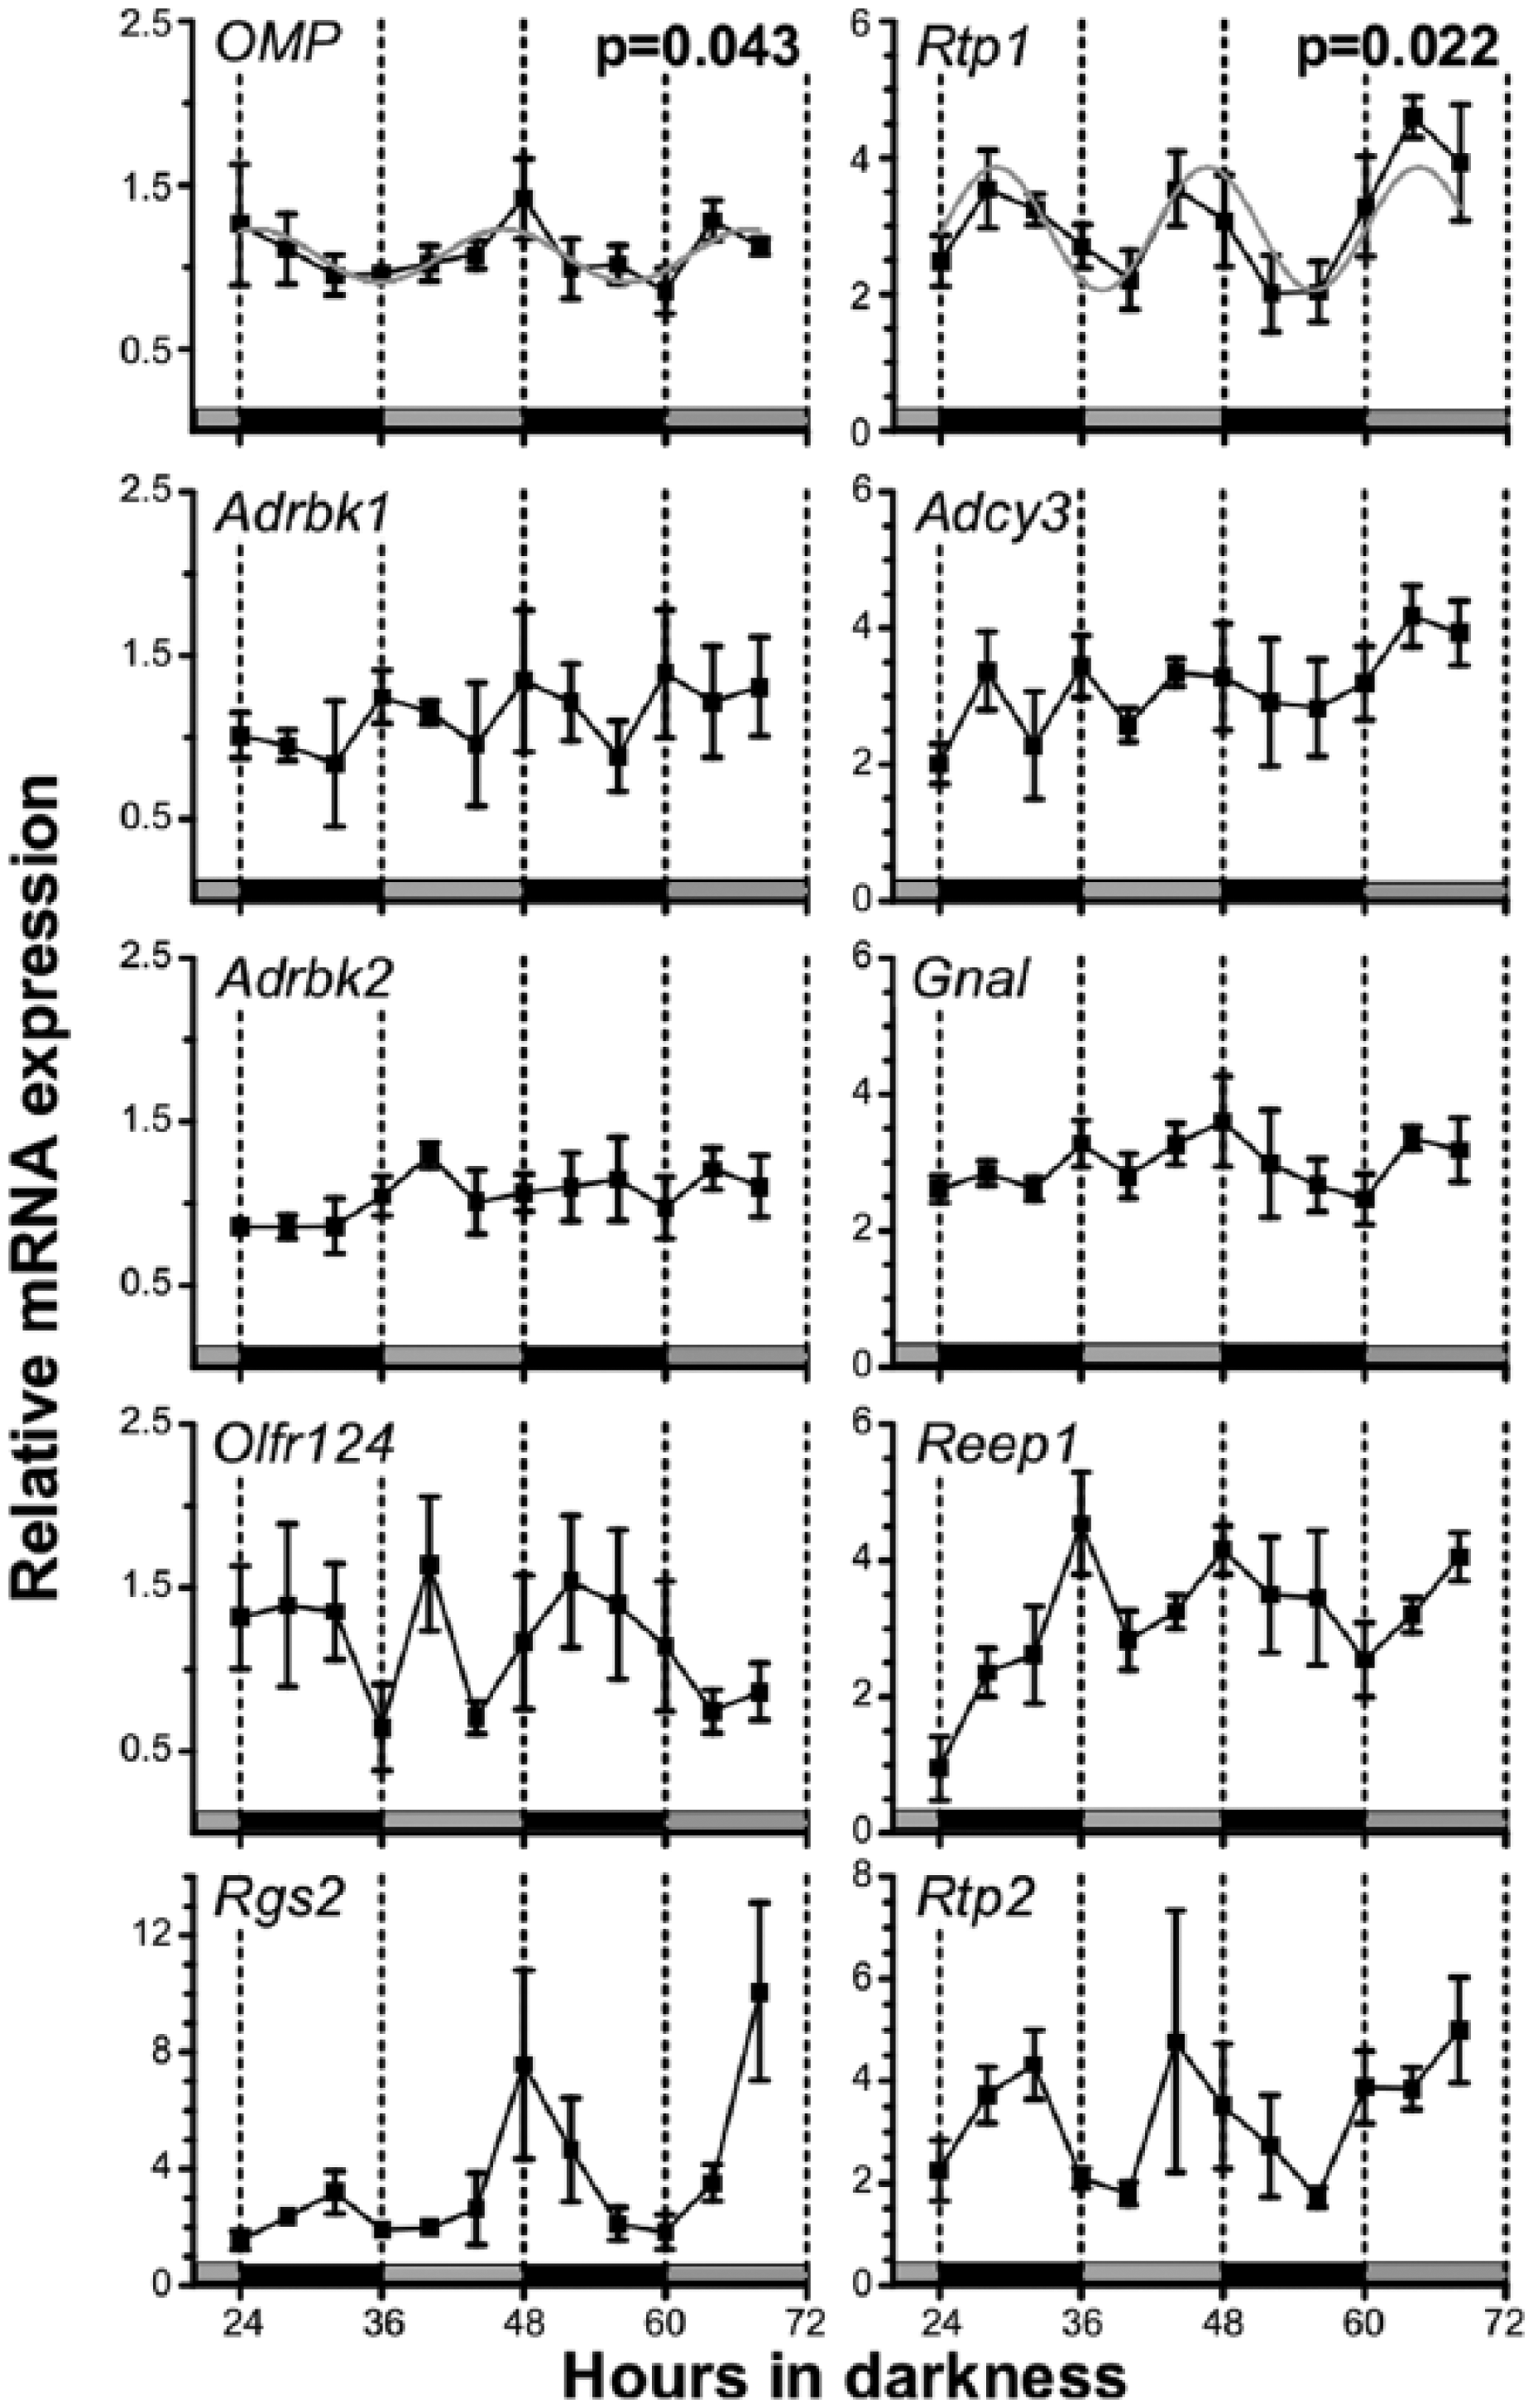
Genes involved in olfactory processing exhibit circadian oscillations in transcript levels. OMP and Rtp1 display significant oscillations in the circadian range, while Rgs2 and Rtp2 appeared to fluctuate in a circadian manner, but rhythmicity did not reach significance. Displayed are means ± SEM (n = 3-4) of transcript levels determined by quantitative polymerase chain reaction; gray lines = significant sine wave fits calculated with CircWave Batch analysis software; corresponding p values indicate the levels of significance. Olfactory epithelium (OE) sampling from entrained mice started 24 h after lights-off. Horizontal gray and black bars denote the subjective day and night phases, respectively, at the time of sampling.
Genome-Wide Gene Expression Profiles of Olfactory Genes
To get a more comprehensive view of circadian regulation in the OE, we performed a genome-wide expression study with RNA from OE tissue extracted at 4-h intervals in constant darkness from previously entrained mice. In total, 18,845 genes were expressed in the OE, 164 of which were identified as significantly rhythmic (sine wave fit, Fig. 3A), constituting about 1% of the expressed genes. Using 2 alternative methods to determine the percentage of circadian genes in the OE (JTK_CYCLE and RAIN; see supplemental material), we found 1% (JTK_CYCLE; Hughes et al., 2010) to 6% (RAIN; Thaben and Westermark, 2014) rhythmic genes. Two of these rhythmic genes are the canonical clock genes Bmal1 and Rev-Erbα. Their high-amplitude, antiphasic circadian oscillations confirm that our method is sensitive enough for the identification of circadian genes in the OE (Fig. 3B). The OE consists of neuronal and nonneuronal (support and basal) cells. The latter might contribute to rhythmic gene expression without contributing to rhythmic OE function. In order to identify rhythmically expressed OSN-specific genes, we compared expressed genes from our microarray with OSN-specific genes described by 2 other genome-wide OE studies performed by Sammeta et al. (2007) and Nickell et al. (2012) and compiled a list of genes that have a probability of 0.99 to be exclusively expressed in OSNs (Suppl. Table S1): 2240 (12%) of all genes expressed in the OE are OSN specific (Fig. 3D). Fifty-two (2%) of these OSN-specific genes were identified as circadian and were expressed in all 3 arrays (Fig. 3E) and thus form the basis for further investigations. It is noteworthy that 32% of all genes identified as circadian are OSN specific (Fig. 3F), constituting a significant overrepresentation of OSN-specific circadian genes as expected by chance (Fisher exact test, p < 0.001, odds ratio = 3.5). For validation of circadian expression, we specifically focused on those genes that have (1) a presumed role in OE function and (2) high amplitude as well as high mean expression levels, as this would enhance detectability of putative rhythms in protein expression. Based on these criteria, we selected the following genes: (1) Epha5 (ephrin type-A receptor 5) is a brain-specific ephrin receptor with kinase activity, which has putative roles in neuronal development and function (St John et al., 2000). It has also been implicated in OSN activation (McIntyre et al., 2010) and displayed a high circadian amplitude in our array. (2) Kirrel2 and Kirrel3 encode transmembrane proteins of the immunoglobulin superfamily, which are involved in the establishment of pathways from sensory organs, like the olfactory system, to the developing mouse brain and, in particular, in synapse formation (Morikawa et al., 2007; Tamura et al., 2005). They are also linked to OSN activation (Fischl et al., 2014; Serizawa et al., 2006). Kirrel2 and Kirrel3 were not only expressed at high levels, but Kirrel2 expression was also characterized by a high circadian amplitude. (3) MAK (male germ cell–associated kinase) is a serine/threonine-protein kinase that showed high levels of expression and distinct expression patterns in developing sensory epithelia, suggesting a role in sensory signaling pathways (Bladt and Birchmeier, 1993). Also, it exhibited high expression levels and robust, high-amplitude rhythmicity in our array. Finally, (4) Lrrc3b (leucine-rich repeat-containing protein 3B) was selected because it is upregulated in OSNs following odorant-evoked activity (Bladt and Birchmeier, 1993) and exhibits high expression levels and a large amplitude rhythm in our array. When comparing time-dependent mRNA expression profiles as determined by qPCR and microarray analysis, all genes exhibited circadian rhythms with peak phases that were similar for both techniques (Fig. 3D). qPCR-determined mRNA rhythms in Kirrel2, Kirrel3, and MAK were statistically significant (p < 0.05), while those of Epha5 and Lrrc3b missed the level of significance. The latter might possibly be due to the reduced amplitudes found in the qPCR validation.
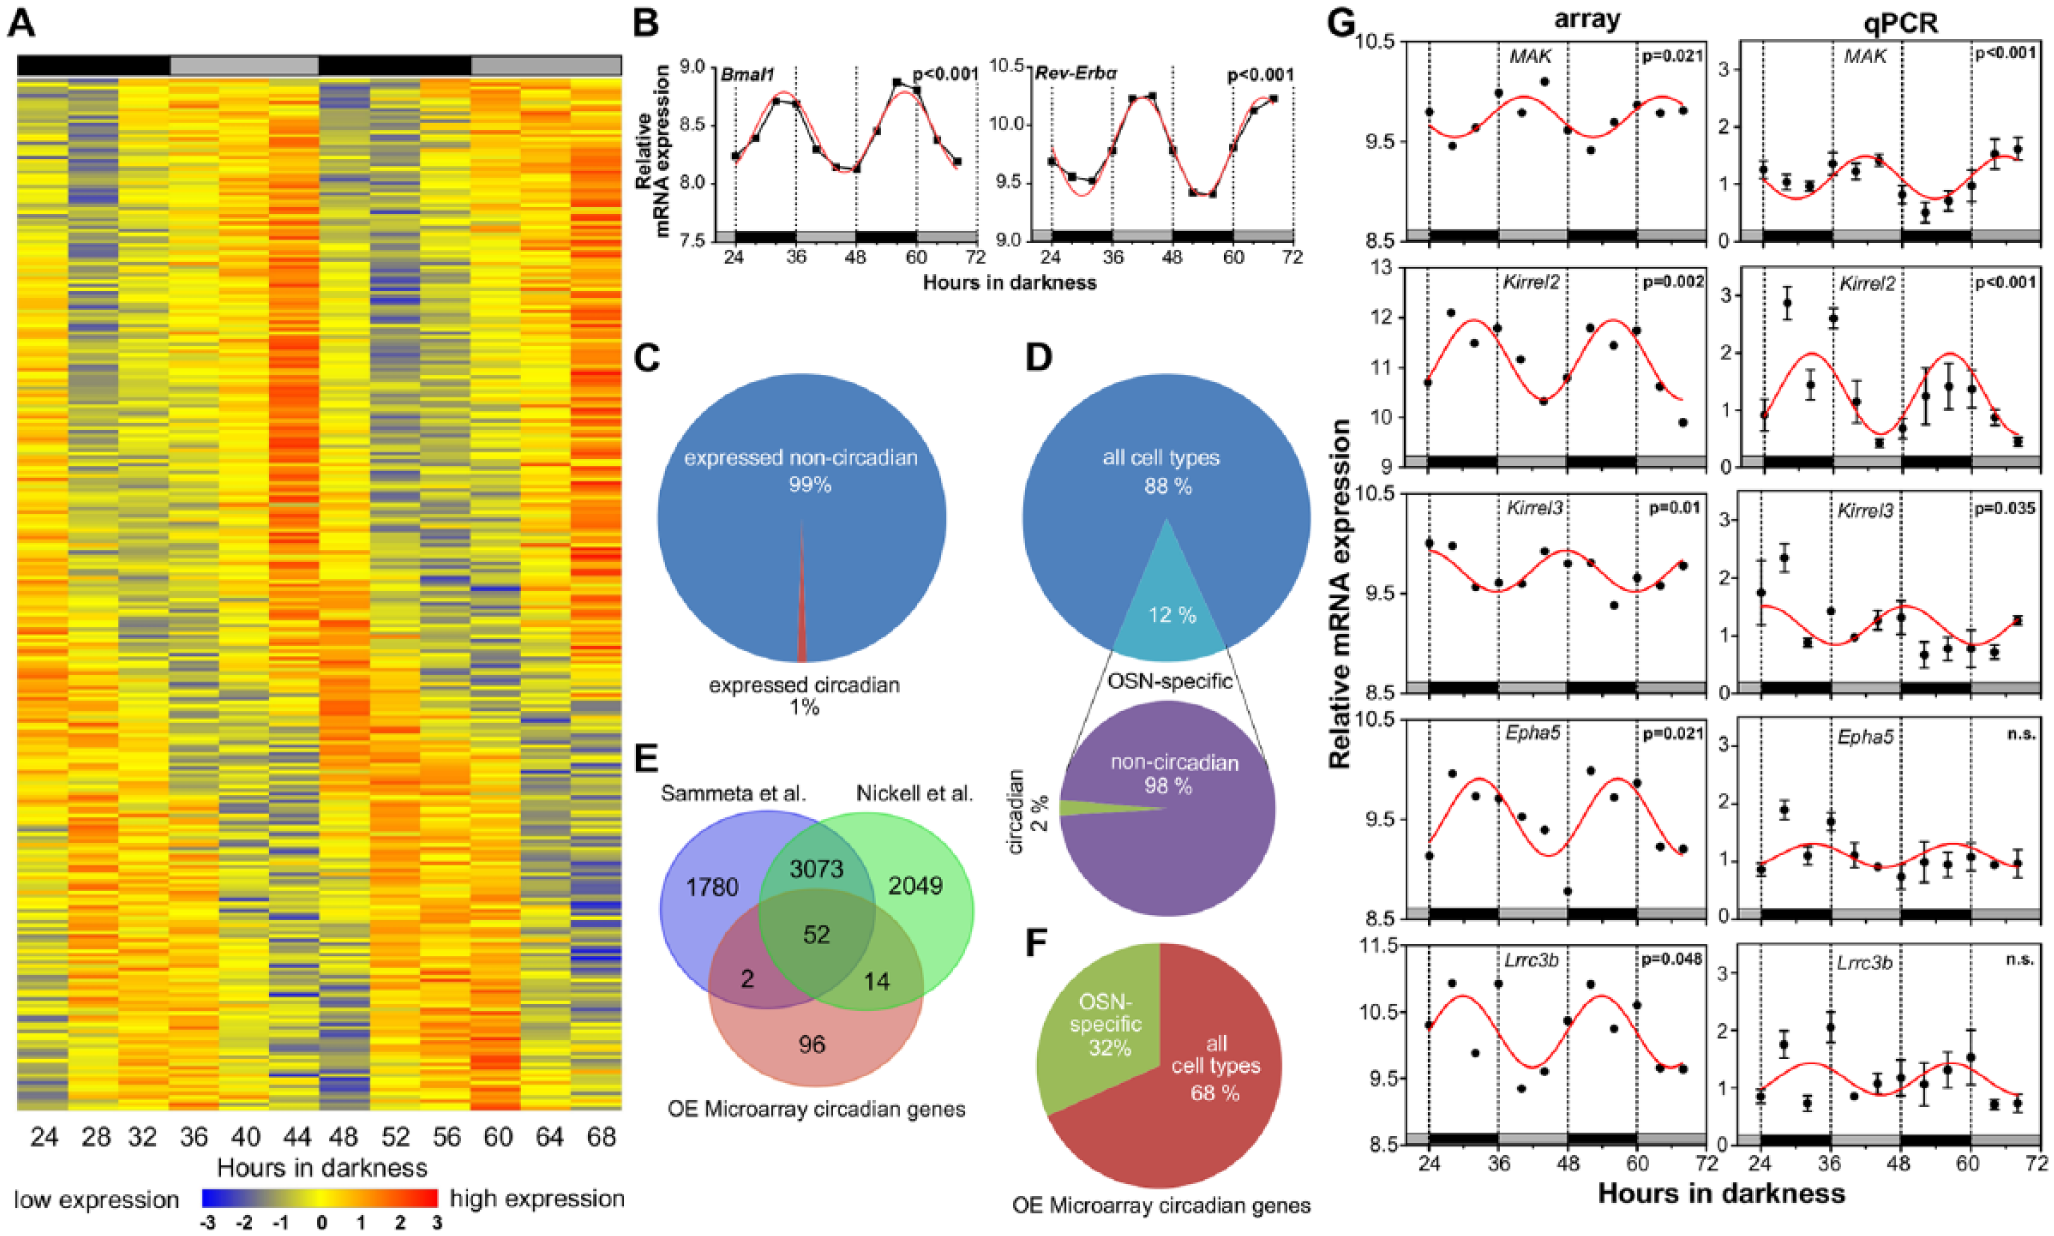
Genome-wide analysis of olfactory gene expression profiles. (A) Heatmap of gene expression profiles of olfactory epithelium (OE) tissues sampled from entrained mice at 4-h intervals over the course of 48 h in DD, starting 24 h after lights-off. OE tissues of 4 mice per time point were pooled. Blue = low expression level; red = high expression level. Data sets are sorted by time of peak expression. (B) Core clock genes show high-amplitude circadian oscillations in our OE microarray study. Relative messenger RNA (mRNA) expression (n = 1 pool per time point) of Reverbα and Bmal1 was selected from the genome-wide array data shown in A. Red lines show sine wave fits to a period of 24 h; significances of the fits are indicated by p values as determined by sine wave fit. Horizontal gray and black bars denote the subjective day and night phases, respectively, at the time of sampling. (C) The distribution of rhythmic and nonrhythmic genes in our OE transcriptome analysis as determined by sine wave fit. (D) The percentage of olfactory sensory neuron (OSN)–specific gene expression vs. expression in all OE cell types as determined by comparison with 2 OSN-specific microarray studies (see Fig. 3E). Two percent of the OSN-specific genes have been identified as circadian by sine wave fit. (E) OSN-specific expression profiles can be detected in OE samples. Fifty-two circadian genes that have a probability of 0.99 to be exclusively expressed in OSNs can be detected in OE tissues by standard microarray techniques (see overlap). Blue = number of OSN-specific genes detected by Sammeta et al. (2007); green = number of OSN-specific genes detected by Nickell et al. (2012); pink = number of circadian genes detected in our OE microarray assay. (F) Thirty-two percent of OE genes that have been identified as circadian by sine wave fit are OSN specific. (G) OSN-specific circadian rhythmicity is confirmed by quantitative polymerase chain reaction (qPCR). MAK, Kirrel2, and Kirrel3 displayed significant circadian oscillations as detected by microarray (left) and qPCR (right). Epha5 and Lrrc3b, while no longer significantly rhythmic upon qPCR validation, displayed similar phases and waveforms in both assays, albeit different amplitudes. Red lines show sine wave fits to a period of 24 h; significance of the fits is indicated by p values as determined by sine wave fit. qPCR data are depicted as means ± SEM (n = 4). Data were sampled in continuous darkness from mice previously entrained to a 12:12-h LD light cycle. Sampling started 24 h after lights-off. Horizontal gray and black bars denote the subjective day and night phases, respectively, at the time of sampling.
OSN-Specific Proteins Oscillate with Respect to Their Abundance and Cellular Localization
To investigate whether rhythmic mRNA expression translates into either rhythmic protein abundance or, perhaps, rhythmic variations in protein localization, we subjected OE slices, fixed at different circadian times, to immunohistochemical analyses. EPHA5, LRRC3B, and KIRREL2 exhibited spatiotemporal variations with highest protein levels around the middle and the end of the subjective night. Specifically, EPHA5 displayed expression in OSNs with a trough at CT6 and a peak at CT18. Peak staining at CT18 was correlated with an increase of protein abundance in knobs (Fig. 4A). In line with that, somatic LRRC3B also displayed peak levels at CT18 (Fig. 4B). LRRC3B expression rhythms exhibited a clear spatial discrimination, since somatic oscillations occurred only in the ventral turbinate, while cilial LRRC3B is only found in the lateral OE, where it oscillated with a peak at the end of the subjective night/beginning of the subjective day (CT0, Fig. 4B). In contrast to LRRC3B, KIRREL2 abundance varied in knobs and cilia only, displaying a peak at CT0 and a trough at CT12 (Fig. 4C). Since variations were apparent but could not be unambiguously quantified in transverse slices, we additionally generated top-view preparations, allowing for a more accurate counting of knobs and cilia. As the largest differences in transverse cilial stainings were detected between CT0 and CT12, top-view preparations were performed for these 2 time points only, albeit in LD conditions (ZT0 and ZT12). Confocal photomicrographs of similar OE regions revealed, as expected from conventional immunocytochemistry, a higher number of knobs with and without cilia at ZT0 compared to ZT12 (Fig. 4D). Quantifications confirmed that the number of knobs expressing KIRREL2 was considerably higher at the beginning of the day compared to the beginning of the night (Fig. 4E).
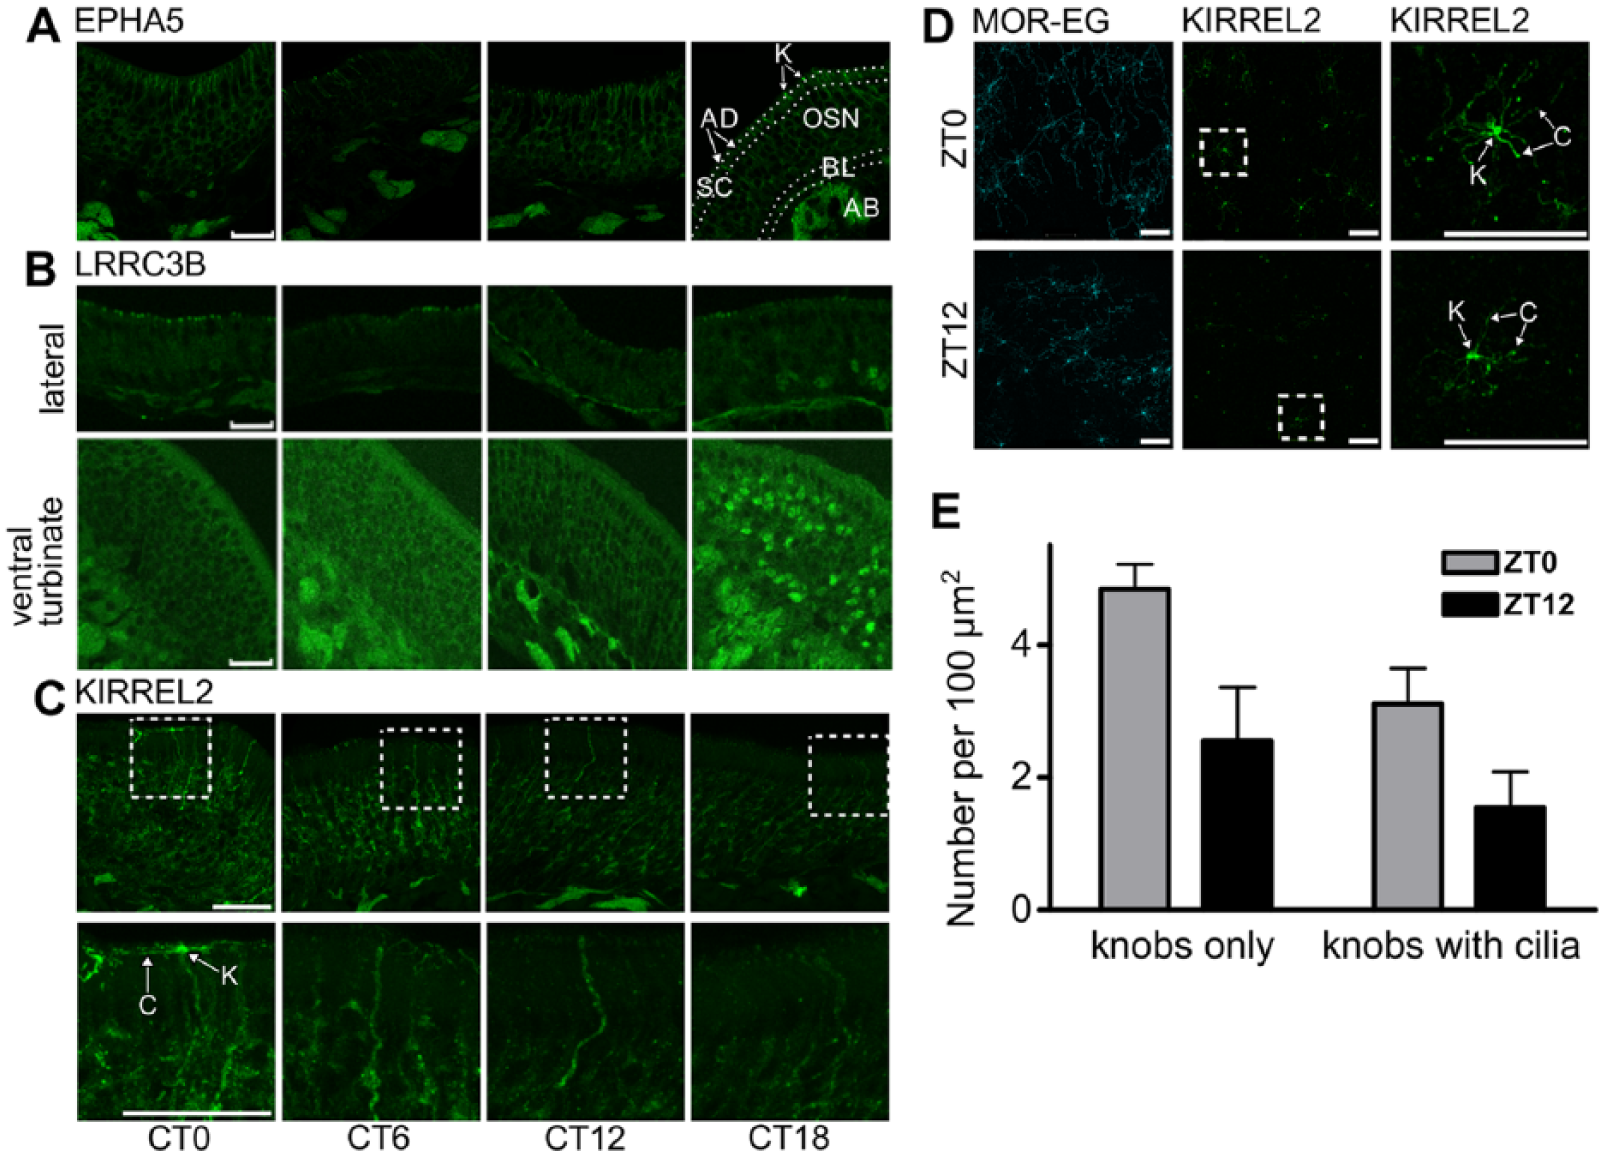
Protein expression of olfactory sensory neuron (OSN)–specific high-amplitude circadian genes reveals spatiotemporal variations. (A) Representative photomicrographs show anti-EPHA5 immunofluorescence (green) of selected areas of the olfactory epithelium (OE) at different time points. OE tissue samples were harvested from entrained mice at regular intervals starting 36 h after lights-off (= CT0). Protein expression in cell bodies and knobs was brightest at CT18 and lowest at CT6. The tissue layers that the immunohistochemical analyses were based on are delineated by white-dotted lines (see Fig. 1B). K = cell layer containing dendritic knobs (white arrows) and cilia (not visible); SC = supporting cell layer; AD = apical dendrites crossing the SC layer; OSN = layer with olfactory sensory neurons; BL = basal layer; AB = axon bundles. Scale bar = 25 µm. (B) LRRC3B displays time-of-day dependent variations in abundance and localization. Representative photomicrographs show anti-LRRC3B immunofluorescence (green) of selected areas of the OE: the lateral OE (upper row) and the ventral turbinate (lower row). OE tissue samples were harvested from entrained mice at regular intervals starting 36 h after lights-off (= CT0). In the lateral OE, the number of stained knobs varied with a peak at CT0, while staining of cell bodies showed little variances over time. In the ventral turbinate, staining of cell bodies appeared to be rather constant over time but with a clear and sudden increase of cytosolic/nuclear staining in a fraction of cells at CT18. Scale bar = 25 µm. (C) KIRREL2 is more abundant at the beginning of the day. Representative photomicrographs show anti-KIRREL2 immunofluorescence (green) in similar areas of the OE at different time points. OE tissue samples were harvested from entrained mice at regular intervals starting 36 h after lights-off (= CT0). Upper row: visibility and length of stained cilia varied over time with a peak at CT0. Lower row: details, see dotted white squares in upper row. C = cilia; K = dendritic knob. Scale bar = 25 µm. (D) Top-view preparations of KIRREL2 show time-dependent variations with a peak at the beginning of the day. Representative confocal photomicrographs show anti–MOR-EG immunofluorescence (cyan, left lane) and anti-KIRREL2 immunofluorescence (green, middle and right lanes) in top-view preparations of the OE at different zeitgeber times. OE tissue samples were harvested from entrained mice at the beginning (ZT0) and end of the light phase (ZT12). MOR-EG staining showed no time-dependent variation (used as quality control), while cilial KIRREL2 peaked at ZT0. C = cilia; K = dendritic knob. Scale bar = 25 µm. (E) Quantification of D: the number of KIRREL2-stained knobs is elevated at ZT0. Bars (mean ± SEM) show the average number of knobs with and without cilia per 100 µm2 at ZT0 (gray) and ZT12 (black); n = 3-4 mice per time point.
Discussion
Olfactory Sensory Neurons Possess an Autonomous Circadian Clock
The circadian clock influences olfactory processes, in particular olfactory sensitivity (Granados-Fuentes et al., 2006), and periodic odor presentation in turn can influence circadian behavior (Abraham et al., 2013). These findings suggest reciprocal interactions between the molecular systems. With the olfactory epithelium entailing the initial events in odor detection, we hypothesized that these interactions might occur in the OE. As a consequence, we asked whether OSNs possess an autonomous circadian clock. We show that canonical clock genes Per2, Reverbα, and Bmal1 are expressed rhythmically in OE tissue with phase relationships in line with findings in other peripheral tissues (Yamamoto et al., 2004). Additionally, online bioluminescence measurements in OE tissue explants displayed rhythmic PER2 expression patterns over several days. This is in agreement with observations in other peripheral tissues, which oscillate over the course of several days (Yoo et al., 2004) and with findings from OE explants recently reported by Miller et al. (2014). In further support of an OE clock, we demonstrated that PER2 protein is expressed rhythmically ex vivo and displays circadian variation in cell bodies and dendritic knobs of OSNs. While the expression of clock proteins in neuronal projections is indeed unusual, it is not unheard of (Tavakoli-Nezhad et al., 2007). The ex vivo protein expression in OSNs peaks at CT18 and coincides with the previously reported in vivo PER2 peak expression at CT20 in the mouse OB (Miller et al., 2014). To test whether circadian rhythmicity in OSNs requires the presence of nonneuronal OE cells, we investigated oscillations in the olfactory-derived neuronal cell line Odora (Murrell et al., 1999), which had been stably transduced with clock gene reporter constructs. Odora reporter cell lines oscillated for several days with periods within the circadian range. Furthermore, they displayed antiphasic oscillations of Per2 and Bmal1, consistent with what has been reported for these 2 clock genes before (Yamamoto et al., 2004) and in line with the presence of an autonomous circadian clock in OSNs. Hence, in association with our immunohistochemical results on PER2 rhythms in olfactory neurons, we report here for the first time that OSNs possess an autonomous circadian clock.
Genome-Wide Gene Expression Profiles of Olfactory Genes
To investigate how the circadian clock in the OE and the olfactory system interact, we identified genes in the olfactory signaling cascade that are under circadian control by analyzing the expression profiles of known regulators of olfactory signal detection (e.g., G protein–coupled kinases, transport proteins, and olfactory receptors). Since only 2 of 10 genes exhibited significant rhythms in the circadian range, we expanded our scope and performed a genome-wide microarray expression study with RNA from whole OE sampled at different circadian times. We found 1% (sine wave fit, JTK_CYCLE) to 6% (RAIN) rhythmic genes, which is close to recent results displaying 3% to 4% of genes detected as rhythmic in neuronal tissues (Zhang et al., 2014). Considering that it is the choice of the statistical analysis that determines the detected percentage of rhythmic genes in a given tissue, rather than the original data (Wu et al., 2014), our findings are in the expected range of variation. When restricted to OSN-specific genes, the percentage of circadian genes increases to 2%, which hints toward the fact that circadian function is more relevant in OSNs than in other cells of OE, supporting tissue-specific clock function (Zhang et al., 2014). This becomes even more likely considering that circadian genes in the OE are enriched for OSN specificity: 32% of the genes that we identified as circadian are OSN specific, while the expression of OSN-specific genes amounts to only 12% in the OE. We selected Kirrel2, Epha5, and Lrrc3b from our list of OSN-specific, circadian genes to investigate their expression profiles on the protein level and to establish possible links between the circadian system and olfactory processing. Insect studies showed that olfactory sensitivity is rhythmically regulated by G protein–coupled kinases, olfactory receptor abundance, and localization via transport proteins (Tanoue et al., 2004; Tanoue et al., 2008). However, rhythmic mammalian olfactory genes—as determined by the present study—are mostly implicated in anabolic processes, like the OR-dependent, odorant-evoked OSN activation (Bennett et al., 2010; Fischl et al., 2014; Serizawa et al., 2006), and in the establishment of pathways from sensory organs to the brain and OSN activation (Morikawa et al., 2007; Tamura et al., 2005). This suggests that the mechanisms regulating mammalian circadian olfactory function may be different compared to those in insects.
OSN-Specific Proteins Oscillate with Respect to Their Abundance and Cellular Localization
The peak in olfactory sensitivity in mice occurs at CT16 (Granados-Fuentes et al., 2011), which is highly similar to the protein expression peaks of EPHA5 and LRRC3B in different parts of the OSNs, suggesting that high abundances of EPHA5 and LRRC3B correlate with a peak in olfactory sensitivity. Since LRRC3B and KIRREL2 abundances in OSN cilia peak a few hours after peak olfactory performance, we hypothesize that high levels of KIRREL2 and LRRC3B in cilia may be required to prepare the OSNs for the consecutive peak in olfactory performance. While this assumption appears reasonable given that Kirrel2 and Lrrc3b are primarily implicated in neuronal development and axon outgrowth—all rather long-term processes that usually occur in the range of days and weeks—it also raises the question whether an involvement in such comparatively short-term daily variations, like in circadian olfactory sensitivity, is possible at all. The answer is yes: Kirrel2 and Lrrc3b have been implicated in receptor-mediated OSN activation (Bennett et al., 2010; Serizawa et al., 2006) and respond as fast as 30 min following the start of odor presentation (Fischl et al., 2014), indicating that circadian effects of our candidate genes are indeed possible. The fact that circadian variations in candidate protein expression predominantly occurred in knobs and cilia, the primary targets of odors and sites of olfactory transduction (Buck, 2000) and substantial PER2 expression (Fig. 1B), further supports a role in circadian control of olfactory processes.
In summary, we have demonstrated that OSNs within the OE possess an autonomous circadian clock that is likely to control gene expression of OSN-specific genes. We identified and further characterized 3 genes involved in neuron outgrowth and OSN activation and found that their peak protein expression can be reconciled with the reported peak in olfactory sensitivity. Our results suggest that the mechanism of circadian control of olfactory processes may be distinct from the reported mechanisms in insects in that it rather involves short-term anabolic neuronal processes as opposed to receptor trafficking in insects.
Footnotes
Acknowledgements
The present study was supported by the Federal Ministry of Education and Research (grant number 01GQ1001C) and by a Rahel-Hirsch-Stipend to U.A. from the Charité, Berlin. Work in A.K.’s laboratory is further supported by the German Science Foundation (DFG). E.M.N. and S.O. were supported by NeuroCure (grant Exc257, DFG).
Conflict of Interest Statement
The author(s) have no potential conflicts of interest with respect to the research, authorship, and/or publication of this article.
Notes
References
Supplementary Material
Please find the following supplemental material available below.
For Open Access articles published under a Creative Commons License, all supplemental material carries the same license as the article it is associated with.
For non-Open Access articles published, all supplemental material carries a non-exclusive license, and permission requests for re-use of supplemental material or any part of supplemental material shall be sent directly to the copyright owner as specified in the copyright notice associated with the article.