
Abstract
Circadian rhythms are endogenously generated physiological and molecular rhythms with a cycle length of about 24 h. Bioluminescent reporters have been exceptionally useful for studying circadian rhythms in numerous species. Here, we report development of a reporter mouse generated by modification of a widely expressed and highly rhythmic gene encoding D-site albumin promoter binding protein (Dbp). In this line of mice, firefly luciferase is expressed from the Dbp locus in a Cre recombinase-dependent manner, allowing assessment of bioluminescence rhythms in specific cellular populations. A mouse line in which luciferase expression was Cre-independent was also generated. The Dbp reporter alleles do not alter Dbp gene expression rhythms in liver or circadian locomotor activity rhythms. In vivo and ex vivo studies show the utility of the reporter alleles for monitoring rhythmicity. Our studies reveal cell-type-specific characteristics of rhythms among neuronal populations within the suprachiasmatic nuclei ex vivo. In vivo studies show Dbp-driven bioluminescence rhythms in the liver of Albumin-Cre;Dbp KI/+ “liver reporter” mice. After a shift of the lighting schedule, locomotor activity achieved the proper phase relationship with the new lighting cycle more rapidly than hepatic bioluminescence did. As previously shown, restricting food access to the daytime altered the phase of hepatic rhythmicity. Our model allowed assessment of the rate of recovery from misalignment once animals were provided with food ad libitum. These studies confirm the previously demonstrated circadian misalignment following environmental perturbations and reveal the utility of this model for minimally invasive, longitudinal monitoring of rhythmicity from specific mouse tissues.
Keywords
Circadian rhythms are endogenous rhythms with a cycle length of ~24 h. The mammalian circadian system is hierarchical, with the hypothalamic suprachiasmatic nuclei (SCN) serving as the pacemaker (Mohawk et al., 2012; Herzog et al., 2017). The SCN are synchronized by environmental cues, of which the light-dark cycle is the most influential. The SCN are not unique in their capacity for rhythmicity, however. The transcriptional-translational feedback loop regulating molecular oscillations in the SCN is also present in individual cells throughout the body (Mohawk et al., 2012). SCN-driven neural, behavioral, and hormonal rhythms synchronize these cell-autonomous oscillators, leading to rhythmicity with predictable phase relationships among tissues, genes, and physiological processes (Mohawk et al., 2012; Patke et al., 2020; R. Zhang et al., 2014). Repeated disruption of this internal temporal order by inappropriately timed light exposure or food intake leads to adverse health consequences in shift-working humans and in animal models (J. A. Evans and Davidson, 2013; Patke et al., 2020). Progress in identifying the mechanisms by which chronic circadian disruption leads to adverse health consequences will require long-term monitoring of central and peripheral rhythms (Roenneberg and Merrow, 2016).
Rhythmically expressed reporter genes have been extremely important for demonstrating cell-autonomous circadian clocks and monitoring rhythmicity in several organisms, including plants (Millar et al., 1992), Neurospora (Morgan et al., 2003), cyanobacteria (Kondo et al., 1993), Drosophila (Brandes et al., 1996), zebrafish (Weger et al., 2013), cultured cells (Nagoshi et al., 2004; Hirota et al., 2010; Welsh et al., 2004; E. E. Zhang et al., 2009), rodent tissue explants (Abe et al., 2002; Maywood et al., 2013; Yamazaki et al., 2000; Yoo et al., 2004, 2005), and rodent tissues in vivo (Saini et al., 2013; Tahara et al., 2012). Circadian reporter genes have been instrumental in screens to identify clock genes and modifiers in many of these systems (Cesbron et al., 2013; Chen et al., 2012; Hirota et al., 2010; Kondo et al., 1993; Millar et al., 1995; Muñoz-Guzmán et al., 2021; Stanewsky et al., 1998; E. E. Zhang et al., 2009). Circadian reporters have also been used to assess rhythmicity in peripheral tissues and the impact of alterations in experimental or environmental conditions (food availability, lighting cycles, glucocorticoid treatment) on peripheral oscillators, conducted by measuring bioluminescence rhythms in tissue explants monitored ex vivo (Davidson et al., 2008, 2009; Nakamura et al., 2005; Pezuk et al., 2012; Sellix et al., 2012; Stokkan et al., 2001; Yamanaka et al., 2008; Yamazaki et al., 2000). These studies complement work done by assessing population rhythms in gene expression in tissue samples indicating altered rhythm amplitude and phase, and altered phase relationships in and between SCN and peripheral oscillators following resetting (Balsalobre et al., 2000; Damiola et al., 2000; Destici et al., 2013; Nagano et al., 2003; Reddy et al., 2002; Y. Yamaguchi et al., 2013; for review see Nicholls et al., 2019). Several groups have developed methods for in vivo assessment of reporter gene activity from brain regions, including the SCN, using implanted optical fibers and freely moving (but tethered) rodents (Hamada et al., 2016; Mei et al., 2018; Nakamura et al., 2008; Ono et al., 2015; S. Yamaguchi et al., 2001; Y. Yamaguchi et al., 2016). Other studies have localized the source of bioluminescence from widely expressed reporter genes in specific peripheral tissues based on photomultiplier tube placement on the body surface (Hamada et al., 2016; Sawai et al., 2019). Peripheral organ reporter gene activity has been assessed by in vivo imaging in anesthetized mice (Saini et al., 2013; Tahara et al., 2012) and more recently in ambulatory mice (Martin-Burgos et al., 2022; Saini et al., 2013; Sinturel et al., 2021). In some cases, viral vectors that afford anatomical specificity (through their site of injection, tropism, and/or by their design) have been used to direct reporter expression to specific tissues (Mei et al., 2018; Saini et al., 2013; Sinturel et al., 2021). All these approaches are hampered by the need to develop specific reagents or approaches for each tissue being examined, and many of these approaches are invasive. In view of the large number of mouse lines with tissue-specific expression of Cre recombinase, the field would benefit considerably from a binary (Cre-lox) reporter system in which bioluminescence from a rhythmically expressed gene can be switched on in tissues expressing Cre recombinase, simply by crossing mice of the appropriate genotypes together.
Here, we report a new transgenic mouse line in which firefly luciferase is expressed from the mouse Dbp locus in a Cre recombinase-dependent manner. Dbp is widely and rhythmically expressed (Fonjallaz et al., 1996; Punia et al., 2012; R. Zhang et al., 2014), allowing detection of circadian bioluminescence rhythms in numerous tissues, in vivo and ex vivo. Cre-dependent bioluminescence rhythms were recorded ex vivo from specific SCN neuronal populations. Furthermore, we observed transient misalignment between behavioral and hepatic bioluminescence rhythms in freely moving mice subjected to a shift of the light-dark cycle or following restricted food access.
While this work was being prepared for publication, Shan et al. (2020) reported development of a Color-Switch Per2 reporter mouse. In this reporter, Cre recombinase expression changes the reporter fused to mPER2 from red to green luciferase.
Materials and Methods
Animals and Housing Conditions
All animal procedures were reviewed and approved by the Institutional Animal Care and Use Committees of the University of Massachusetts Chan Medical School, Morehouse School of Medicine, the University of Warwick, and/or Smith College.
Unless otherwise noted, animals were maintained in a 12 h light: 12 h dark (LD) lighting cycle with access to food (Prolab Isopro RMH3000; LabDiet) and water available ad libitum. Zeitgeber time (ZT) refers to time relative to the lighting cycle. ZT 0-12 h is the light phase and ZT 12-24 h is the dark phase.
Cre recombinase-expressing lines were crossed to mice bearing the conditional (Dbp KI ) reporter allele to generate mice expressing luciferase in specific cells or tissues. Albumin-Cre (B6.Cg-Speer6-ps1 Tg(Alb-Cre)21Mgn /J; JAX stock number 003574), Ksp1.3-Cre (B6.Cg-Tg{Cdh16-cre}91Igr/J, JAX 012237), AVP-IRES2-Cre (B6.Cg-Avp tm1.1(Cre)Hze /J; JAX 023530), and NMS-Cre mice (Tg(Nms-iCre)20Ywa, JAX 027205) were obtained from the Jackson Labs (Bar Harbor, ME). These lines direct Cre recombinase expression to hepatocytes (Postic et al., 1999), renal tubules and genito-urinary epithelia (Shao et al., 2002), neurons expressing arginine vasopressin (AVP; Harris et al., 2014), and neurons expressing Neuromedin S (NMS; Lee et al., 2015), respectively. A Prrx1-Cre female (B6.Cg-Tg(Prrx1-Cre1Cjt/J), JAX 005584; Logan et al., 2002) was used for germline deletion of the conditional allele (see below).
Founder Per2 LucSV/+ mice with an in-frame fusion of firefly luciferase to PER2 and an SV40 polyadenylation signal (Welsh et al., 2004; Yoo et al., 2017) were generously provided by Dr. Joseph Takahashi, University of Texas Southwestern Medical School, Dallas. All Per2 LucSV reporter mice used for experiments here were heterozygous (e.g., Per2 LucSV/+ ). For clarity when referring to literature describing the more widely used PER2::LUCIFERASE fusion reporter line in which the endogenous Per2 3′ UTR is downstream of the luciferase coding sequence (Yoo et al., 2004), we will refer to this line as Per2 Luciferase .
Mouse lines were maintained by backcrossing to the C57BL/6J (JAX 000664) background.
We also generated albino reporter mice by backcrossing to albino C57BL/6J mice with a mutation in tyrosinase (tyr/tyr; B6(Cg)-Tyr c-2J /J, JAX stock number 000058). Tyrosinase, like Dbp, is located on mouse chromosome 7. Crossing these lines eventually generated a recombinant (Dbp KI/+ ; tyr/tyr) in which both mutant alleles were on the same chromatid. Subsequent crossing to albino mice expressing Cre recombinase allowed production of albino reporter mice. Albino Dbp KI/+ mice on the B6(Cg)-Tyr c-2 J/J background are being deposited in the Jackson Labs repository (Bar Harbor, ME) as stock number 036997.
Note, caution is needed with the Ksp1.3-Cre line reported here, as it has a high frequency of germline recombination (excision of the floxed region of the conditional allele in the germline, leading to nonconditional luciferase expression) when Ksp1.3-Cre is present in the same parent as Dbp KI/+ . Recombination also frequently occurs when Ksp1.3-Cre females are crossed with Dbp KI males. When using the Cre/lox system, genotying strategies should be designed to detect all possible alleles. Even when the Ksp1.3-Cre; Dbp KI/+ genotype is generated without germline excision of Green Fluorescent Protein (GFP), the sex difference in Cre expression leads to markedly different bioluminescence patterns in males and females (see Results).
Targeting the Dbp Locus
The mutant allele was generated by Clustered Regularly Interspaced Short Palindromic Repeats (CRISPR)/Cas9-mediated engineering of the Dbp locus. The targeting construct (Figure 1) consisted of a 5′ homology arm terminating just 5′ of the Dbp stop codon followed by in-frame sequences encoding a T2A linker (to separate DBP protein from the reporter polypeptides; Kim et al., 2011), loxP, GFP with the bovine growth hormone polyadenylation signal, loxP, and Luc2 followed by the 3′-UTR of Dbp (3′ homology arm). In the presence of Cre recombinase, two loxP sites oriented in the same direction will recombine, leading to deletion of the sequence between them (GFP in this case).
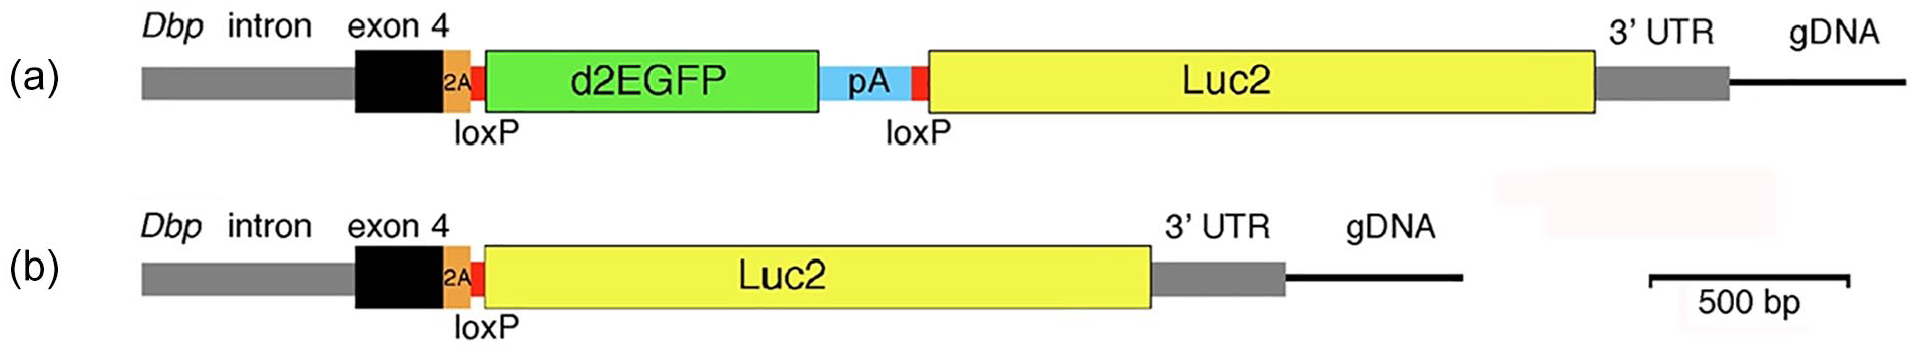
Generation of a bifunctional reporter from the mouse Dbp locus. (a) The mouse Dbp locus was modified by insertion of the donor construct shown. The construct contained homology arms from the Dbp locus (gray and black) and inserted the reporter sequences with a T2A-encoding sequence (orange) between DBP and the reporter. Destabilized EGFP (d2EGFP) with a bovine growth hormone polyadenylation site was flanked by loxP sites (red). Downstream of GFP is a luciferase (Luc2) reporter gene. Without recombination, Dbp and GFP are expressed as a single transcript from the conditional (Dbp KI allele). (b) With Cre-mediated recombination, GFP-encoding sequences are excised and Dbp and luciferase are expressed as a single transcript. The T2A sequence generates separate proteins from these bifunctional transcripts. Cre-mediated germline recombination led to mice expressing luciferase nonconditionally from the DbpLuc allele. Abbreviations: DBP = D-site albumin promoter binding protein; EGFP = enhanced Green Fluorescent Protein.
In the successful set of microinjections, 34 blastocysts were injected with 40 ng/µl guide RNA MmDBPki_gR49f, 50 ng/µl Cas9 mRNA (synthesized from a Cas9 polymerase chain reaction (PCR) product using mMessage mMachine T7 Ultra Kit from Life Technologies), and 20 ng/µl CAS9 protein (IDT). Two putative founders were identified using a primer pair internal to the construct (primer pair C; Suppl. Table S1). Additional primer pairs consisting of a primer in flanking DNA (external to the construct) and a primer within the construct were used to determine whether these animals had the desired targeting event (primer pairs F and H, which spanned the 5′ and 3′ ends, respectively). These studies led to identifying one mouse as having the correct insertion and recognizing that the other putative founder had random insertion of the construct rather than homologous recombination into the Dbp locus; the mouse with random insertion was not studied further. Genomic DNA from the founder with insertion into the Dbp locus was amplified using a primer pair flanking the entire construct. Sequencing the product confirmed the construct was inserted properly, in vivo. Primer sets used for verification of the proper insertion of the construct are listed in Supplementary Table S1.
The founder carrying the targeted (knock-in or Dbp KI ) allele and its offspring were backcrossed to C57BL/6J mice (JAX 000664) for three generations before any intercrossing to reduce the chance of a potential off-target mutations becoming established in the reporter line.
To generate mice with germline deletion of GFP (and thus leading to expression of luciferase throughout the body), a male Dbp KI/+ was bred to a Prrx1-Cre female, which we had on hand and which, in our experience, produces germline deletion of floxed alleles at high frequency when Cre is introduced from the female. Several mice bearing the newly generated Dbp Luc allele were identified and backcrossed to C57BL/6J mice, selecting against Prrx1-Cre.
Genotyping
Genotyping was performed by PCR amplification of DNA extracted from ear punches. Amplification products were separated by agarose gel electrophoresis. Genotyping protocols for Per2 LucSV and Cre recombinase have been published previously and are listed in Supplemental Table S1 (van der Vinne et al., 2018; Weaver et al., 2018, respectively). A mixture of four primers (primer set “4A”) capable of detecting all possible Dbp allele combinations was used for colony genotyping; the three possible alleles (Dbp KI , Dbp Luc , Dbp + ) generate amplicons of 399, 490, and 299 bp, respectively, with this primer set. Primer set 4A consists of a common forward primer in exon 4 (5′-TGCTGTGCTTTCACGCTACCAGG-3′) and allele-specific reverse primers in GFP (to detect the Dbp KI allele; 5′-AGTCGTGCTGCTTCATGTGGTCG-3′), in Luc2 (to detect the Dbp Luc allele; 5′-TCGTTGTAGATGTCGTTAGCTGG-3′), and in the Dbp 3′ UTR (to detect the unmodified Dbp allele; 5′-TTCAGGATTGTGTTGATGGAGGC-3′).
Generation of Digoxigenin (DIG) DNA Probes and Northern Blot Assay
DIG-labeled DNA probes were generated by PCR in reactions containing 28 µM of DIG-labeled UTP. Primer sets are listed in Supplementary Table S1.
Male mice of five genotypes (WT, Dbp KI/+ , Dbp KI/KI , Dbp Luc/+ , and Dbp Luc/Luc ) were euthanized by Euthasol injection for collection of liver tissue at 4-h intervals (ZT 2, 6, 10, 14, 18, 22). RNA was isolated from the liver tissue by Trizol extraction (Ambion). RNA was quantitated by Nanodrop. Five micrograms per lane were separated by electrophoresis on 1.2% formaldehyde gels. RNA was transferred to nylon membranes and cross-linked by UV exposure. Blots were prehybridized, probed and detected following the manufacturer’s protocol (Roche), and bagged and exposed to X-ray film.
Film images of the blots were analyzed by determining the optical density of the Dbp and Actin bands within each lane and taking the Dbp/Actin ratio. The Dbp/Actin ratios were converted to percentage of maximum Dbp/Actin for each transcript type within each blot. Due to the difference in band location of the three Dbp alleles, heterozygous animals contributed a set of values for both the wild-type (WT) transcript and the reporter transcript on each blot. Friedman’s one-way analysis of variance (ANOVA) and Dunn’s test were used for nonparametric assessment of differences between time-points for each transcript.
Locomotor Activity Rhythms
Male and female mice of five genotypes (WT, Dbp KI/+ , Dbp KI/KI , Dbp Luc/+ , and Dbp Luc/Luc ) were transferred to the experimental room and single-housed with a running wheel. Animals had access to food and water ad libitum. Running-wheel activity was monitored and analyzed using ClockLab collection software (Actimetrics). Mice were entrained to a 12 h light/12 h dark cycle for 18 days, and then were placed into constant darkness (dim red light) for 15 days. The free-running period in constant darkness (DD) was determined for each animal on DD days 4-15 by periodogram analysis (ClockLab).
Bioluminescence Recordings From Tissue Explants
Tissue explants were prepared late in the afternoon from Per2
LucSV/+
and Dbp
Luc/+
mice housed on a 12 h light/12 h dark lighting cycle. Tissues from the two genotypes were studied together in each run. Mice were deeply anesthetized with Euthasol and decapitated. Tissues were dissected and immediately placed in ice-cold 1X HBSS (Gibco). Pituitary gland was subdivided into 4 sections (~2 mm3) with a scalpel and each piece was cultured separately. Lung explants were placed three per dish. Up to three replicate dishes were studied per tissue per animal. Explants were placed on sterile 35-mm Millicell culture plate inserts (Millipore) in a sealed Petri dish containing air-buffered bioluminescence medium (Yamazaki and Takahashi, 2005) plus
Bioluminescence records were analyzed using Microsoft Excel to determine period and peak time. The first 12 h were discarded to exclude acute responses to explant preparation. Photon counts were smoothed to a 3-h running average and baseline subtracted using a 24-h running average. Circadian period was determined from the average of the period between each peak, trough, upward crossing, and downward crossing between 24 and 88 h of recording for each record. Peak time was calculated as the clock time of the first peak in the background-subtracted data and is expressed relative to ZT of the extrapolated lighting cycle.
Imaging of Bioluminescence Rhythms In Vivo
In vivo imaging was performed in the UMass Chan Medical School Small Animal Imaging Core Facility using an In Vivo Imaging System (IVIS-100, Caliper, now Perkin Elmer) as previously described (van der Vinne et al., 2018, 2020). Alb-Cre
+
, Dbp
KI/+
(liver reporter), Dbp
Luc/+
, and Per2
LucSV/+
mice were anesthetized with 2% isoflurane (Zoetis Inc.) and skin covering the liver, kidneys, and submandibular glands was shaved. Mice were injected with
Whole-body reporters (Dbp
Luc/+
) and liver reporters (Alb-Cre+;Dbp
KI/+
) were also used to assess the distribution of bioluminescence by IVIS imaging. Mice were anesthetized with isoflurane, shaved, and injected with
Liver and kidney reporter mice were anesthetized, dissected, and imaged to confirm that bioluminescence originated exclusively from the liver. In additional animals, animals were euthanized before image collection.
Bioluminescence Imaging of SCN Explants
Coronal sections containing SCN from adult NMS-Cre;Dbp
KI/+
, AVP-IRES-CRE;Dbp
KI/+
, and Dbp
Luc/+
mice were dissected, cultured, and imaged as previously described (J. A. Evans et al., 2011, 2013). Briefly, sections containing SCN (150 μm) were cultured on a Millicell membrane in air-buffered media containing 100-µM
Rhythmic parameters of luciferase expression were calculated for each slice and for cell-like ROIs within each slice using computational analyses in MATLAB (R2018a, MathWorks) as described previously (J. A. Evans et al., 2013; Leise and Harrington, 2011). Briefly, to locate and extract data from cell-like ROIs, we employed an iterative process identifying clusters of at least 20 bright pixels after background and local noise subtraction (through application of a 2D wavelet transform using Wavelab 850, (https://statweb.stanford.edu/~wavelab/) of a slice image summed across 24 h of bioluminescence. To extract time series for the ROIs, each image in the sequence was smoothed via convolution with a Gaussian kernel applied to 12 × 12-pixel regions and reduced from 512 × 640 resolution to 256 × 320. A discrete wavelet transform (DWT) was applied to each time series to remove the trend and to extract the circadian and noise components using the wmtsa toolbox for MATLAB (https://atmos.uw.edu/~wmtsa/). The criteria for circadian rhythmicity in the ROI time series were a peak autocorrelation coefficient of at least 0.2, a circadian component peak-to-peak time between 18 and 30 h, an amplitude above baseline noise (standard deviation of noise component), and a cross-correlation coefficient of at least 0.4 with an aligned sine wave over a 48-h window. Peaks of the DWT circadian component were used to estimate peak time of each ROI.
Rhythmicity index (RI) is the peak in the autocorrelation of the DWT-detrended time series, corresponding to a lag between 16 and 36 h, as previously described (Leise et al., 2013; Leise, 2017). The time of peak bioluminescence, RI, and the scatter of peak times within each slice for each ROI was assessed on the first day ex vivo. Period of rhythmicity in each ROI was determined as the average peak-to-peak interval in the second and third cycles. These measures were compared between genotypes by a general linear model, with slice ID included as a random variable to account for multiple cells being measured on each slice. Where applicable, post hoc comparisons were performed using Tukey honestly significant difference (HSD) pairwise comparisons. Data available at https://osf.io/4fndx/.
Data Collection and Analysis of Bioluminescence Rhythms in Ambulatory Liver Reporter Mice
Bioluminescence was measured in freely moving Alb-Cre + ; Dbp KI/+ reporter mice with the “Lumicycle In Vivo” system (Actimetrics, Wilmette, IL) using methods as recently described (Martin-Burgos et al., 2022). Animals were checked daily at varied times using an infrared viewer (Carson OPMOD DNV 1.0), or goggles (Pulsar Edge Night Vision Goggles PL75095).
Each LumiCycle In Vivo unit contained two photomultiplier tubes (PMT’s; Hamamatsu H8259-01) and programmable light emitting diode (LED) lights. A programmable shutter blocked the PMTs during periods of light exposure and to measure “dark counts.” Each 1-min dark-count value was subtracted from the counts recorded during the subsequent 14 min to obtain the background-corrected count values, to compensate for the effect of temperature fluctuations on PMT signal.
Ambulatory bioluminescence data were analyzed using RStudio. A DWT was applied to each time series to detrend and to calculate the time of peaks using the wmtsa R package (https://cran.r-project.org/web/packages/wmtsa/index.html), as described (Leise and Harrington, 2011; Leise et al., 2013; Leise, 2017). The S12 filter was applied on 15-min median binned data; medians were used (instead of means) to reduce the effect of large outliers. Data before the first trough and after the last trough were discarded to avoid edge effects.
Locomotor activity was recorded using passive infrared motion sensors (Visonic, K940) and ClockLab software (RRID:SCR_014309). The midpoint of locomotor activity was determined by wavelet analysis on each day of recording. Midpoints were used because the onset of locomotor activity is poorly defined using motion sensors (relative to running wheel onsets).
Assessing Routes of Administration of Luciferin
To determine whether rhythmic substrate intake influences the pattern of bioluminescence, we compared the time of peak bioluminescence between animals receiving continuous administration of substrate (from a subcutaneous osmotic minipump) with trials in which mice received
Liver reporter mice previously housed in 12L:12D were entrained to a skeleton photoperiod (SPP) consisting of four 1-h light pulses. An SPP provides additional periods of darkness in which to record bioluminescence. The use of a 4-pulse SPP (rather than the more typical 2-pulse SPP) was based on preliminary studies indicating a 4-pulse SPP could more consistently cause phase advances of locomotor activity following an advance shift of the lighting cycle. In this 4-pulse SPP, illumination occurred in four 1-h blocks within the light phase in the preceding lighting cycle (e.g., lights were on from ZT 0-1, 2-3, 9-10, and 11-12, so the first and last hours of light in SPP coincided with the first and last hours of illumination in the full photocycle; with lights-on ZT0-12 and lights-off ZT12-24/0).
On the seventh day of SPP entrainment, mice were given analgesics (0.05-mg/kg buprenorphine and 2.0-mg/kg meloxicam), anesthetized with 3% isoflurane, shaved from hips to shoulders, and a primed osmotic minipump (Alzet Model #1002, 0.25 µl per hour, 14 day) containing
Reentrainment Following a Phase Shift of the SPP
Liver reporter mice (Albumin-Cre; Dbp
KI/+
) previously entrained to LD were transferred to the SPP for several days. Mice were anesthetized with isoflurane and shaved 2.5 days prior to placement in the LumiCycle In Vivo units.
The circadian time of peak bioluminescence and the midpoint of locomotor activity were determined by wavelet analysis on each day of recording. We used the midpoint of locomotor activity because activity onset was not easily defined using motion sensors. The timing of bioluminescence and locomotor activity rhythms was normalized to the timing of these rhythms on Day 2 (e.g., the last day before shifting the lighting cycle in the shifted group) for each animal. Data are expressed as mean ± standard error of the mean (SEM) for each lighting condition and endpoint on each day. Data from each lighting group were analyzed separately using a general linear model with Animal ID as a random variable (allowing comparison of the two rhythms within individuals) and the main effects of the endpoint measure (locomotor activity or bioluminescence) and Day number, and the 2-way interaction Measure*Day. In animals not undergoing a phase shift, potential changes in the timing of the locomotor or bioluminescence rhythm were assessed separately for either measure by testing the influence of Day number.
Food Restriction Followed by Bioluminescence Recording
Liver reporter mice (Albumin-Cre; Dbp
KI/+
) were fed pellets (300 mg, Dustless Precision Pellets, Rodent, Grain-Based, F0170, BioServ, Flemington, NJ) through the Actimetrics timed feeding apparatus designed by Phenome Technologies, Skokie, IL. Pellets were spaced by a minimum of 10 min to prevent hoarding behavior (Acosta-Rodriguez et al., 2017). Liver reporter animals were randomly assigned to treatment groups and recording boxes. Three groups were studied: those with ad libitum access to food, those with feeding restricted to the light phase of the LD cycle (daytime feeding), and mice with access to food restricted to the dark phase of the LD cycle (nighttime feeding). Mice were weighed regularly to ensure body weight did not decrease below 95% of the initial weight. All mice were kept on a 12L:12D lighting schedule during the period of food manipulation, and then were released into constant darkness with
Experimental groups and controls ran in parallel over five cohorts lasting 3 months; 24 h prior to placement in the recording boxes, mice were shaved from hips to shoulders on their front and back under 3% isoflurane and returned to their cages. Mice were provided with
The center of gravity (COG) of food intake was calculated for each animal for the last 5 days in LD (e.g., the last 5 days of the feeding regimen). Food intake patterns were also independently assessed qualitatively by four observers. These assessments led to identification of three cohorts of mice, based on food intake patterns. Three mice were identified as clear outliers compared with these three cohorts based on visual inspection of the food intake timing. In line with this qualitative assessment, the feeding COG of each of these three animals was >2 h removed from the other animals in their cohort. These three animals were excluded from cohort-based assessments. Peak of bioluminescence on each day was calculated by DWT analysis as above. Missing data resulted from inability to define a time of peak bioluminescence on some days. Hair regrowth contributed to loss of signal and loss of rhythm amplitude, and thus to missing data in some cases.
Data and materials availability
Requests for research materials should be directed to Dr. David Weaver. Underlying data are available from Dr. Weaver on request.
Results
Generation of a Bifunctional Reporter Mouse
CRISPR/Cas9 genome editing was used to introduce a bifunctional reporter into the mouse Dbp locus (Figure 1). The reporter consists of a T2A sequence (to allow expression of separate proteins from a single transcript), a destabilized, enhanced GFP (d2EGFP, hereafter GFP) sequence flanked by loxP sites, and a codon-optimized synthetic firefly luciferase (Luc2 from Photinus pyralis, hereafter Luc). In the absence of Cre expression, DBP and GFP are expressed as separate proteins. After Cre-mediated recombination, the floxed sequences encoding GFP is removed, and separate DBP and luciferase proteins are expressed from the Dbp locus. Sequencing of genomic DNA confirmed successful generation of the Dbp KI conditional reporter allele.
A nonconditional reporter allele was generated by breeding to combine the conditional Dbp KI allele with Cre recombinase expressed in the germline (of a female Prrx1-Cre mouse), leading to germline excision of sequences encoding GFP. We refer to this nonconditional allele, which expresses luciferase wherever Dbp is expressed, as Dbp Luc .
Molecular and Behavioral Rhythms in Mice With Dbp Reporter Alleles
To confirm that the introduction of the reporter construct into the Dbp locus did not alter circadian clock function, molecular and behavioral rhythms were assessed. Mice used for these analyses had either one or two copies of the GFP-containing conditional allele (Dbp KI/+ and Dbp KI/KI , respectively), one or two copies of the luciferase-expressing allele (Dbp Luc/+ and Dbp Luc/Luc , respectively), or were WT littermate controls.
RNA was isolated from male livers collected at 4-h intervals over 24 h in a 12L:12D (LD) lighting cycle. Northern blots were prepared and probed for Dbp and Actin (loading control). As expected, the transcripts from Dbp KI and Dbp Luc alleles migrated more slowly than the WT transcript (Figure 2a), due to inclusion of GFP and luciferase coding sequence in these transcripts, respectively, as verified by probing for reporter sequences in a separate blot. Peak levels of Dbp expression in liver occurred at ZT10 in all genotypes (Figure 2b and 2c), as expected based on previous studies (Fonjallaz et al., 1996; Punia et al., 2012; R. Zhang et al., 2014). For each transcript type, the Dbp/Actin ratios were ranked within each series of 6 time-points. These ranks differed significantly among the time-points for each transcript (Friedman’s one-way ANOVA, p < 0.002), and post hoc testing indicated significantly higher rankings at ZT10 than at ZT2, ZT18, and ZT22 (Dunn’s test, p < 0.05; Figure 2d-2f). These data indicate that the temporal profile of transcript expression from the Dbp locus was unaffected by the inclusion of reporter sequences.
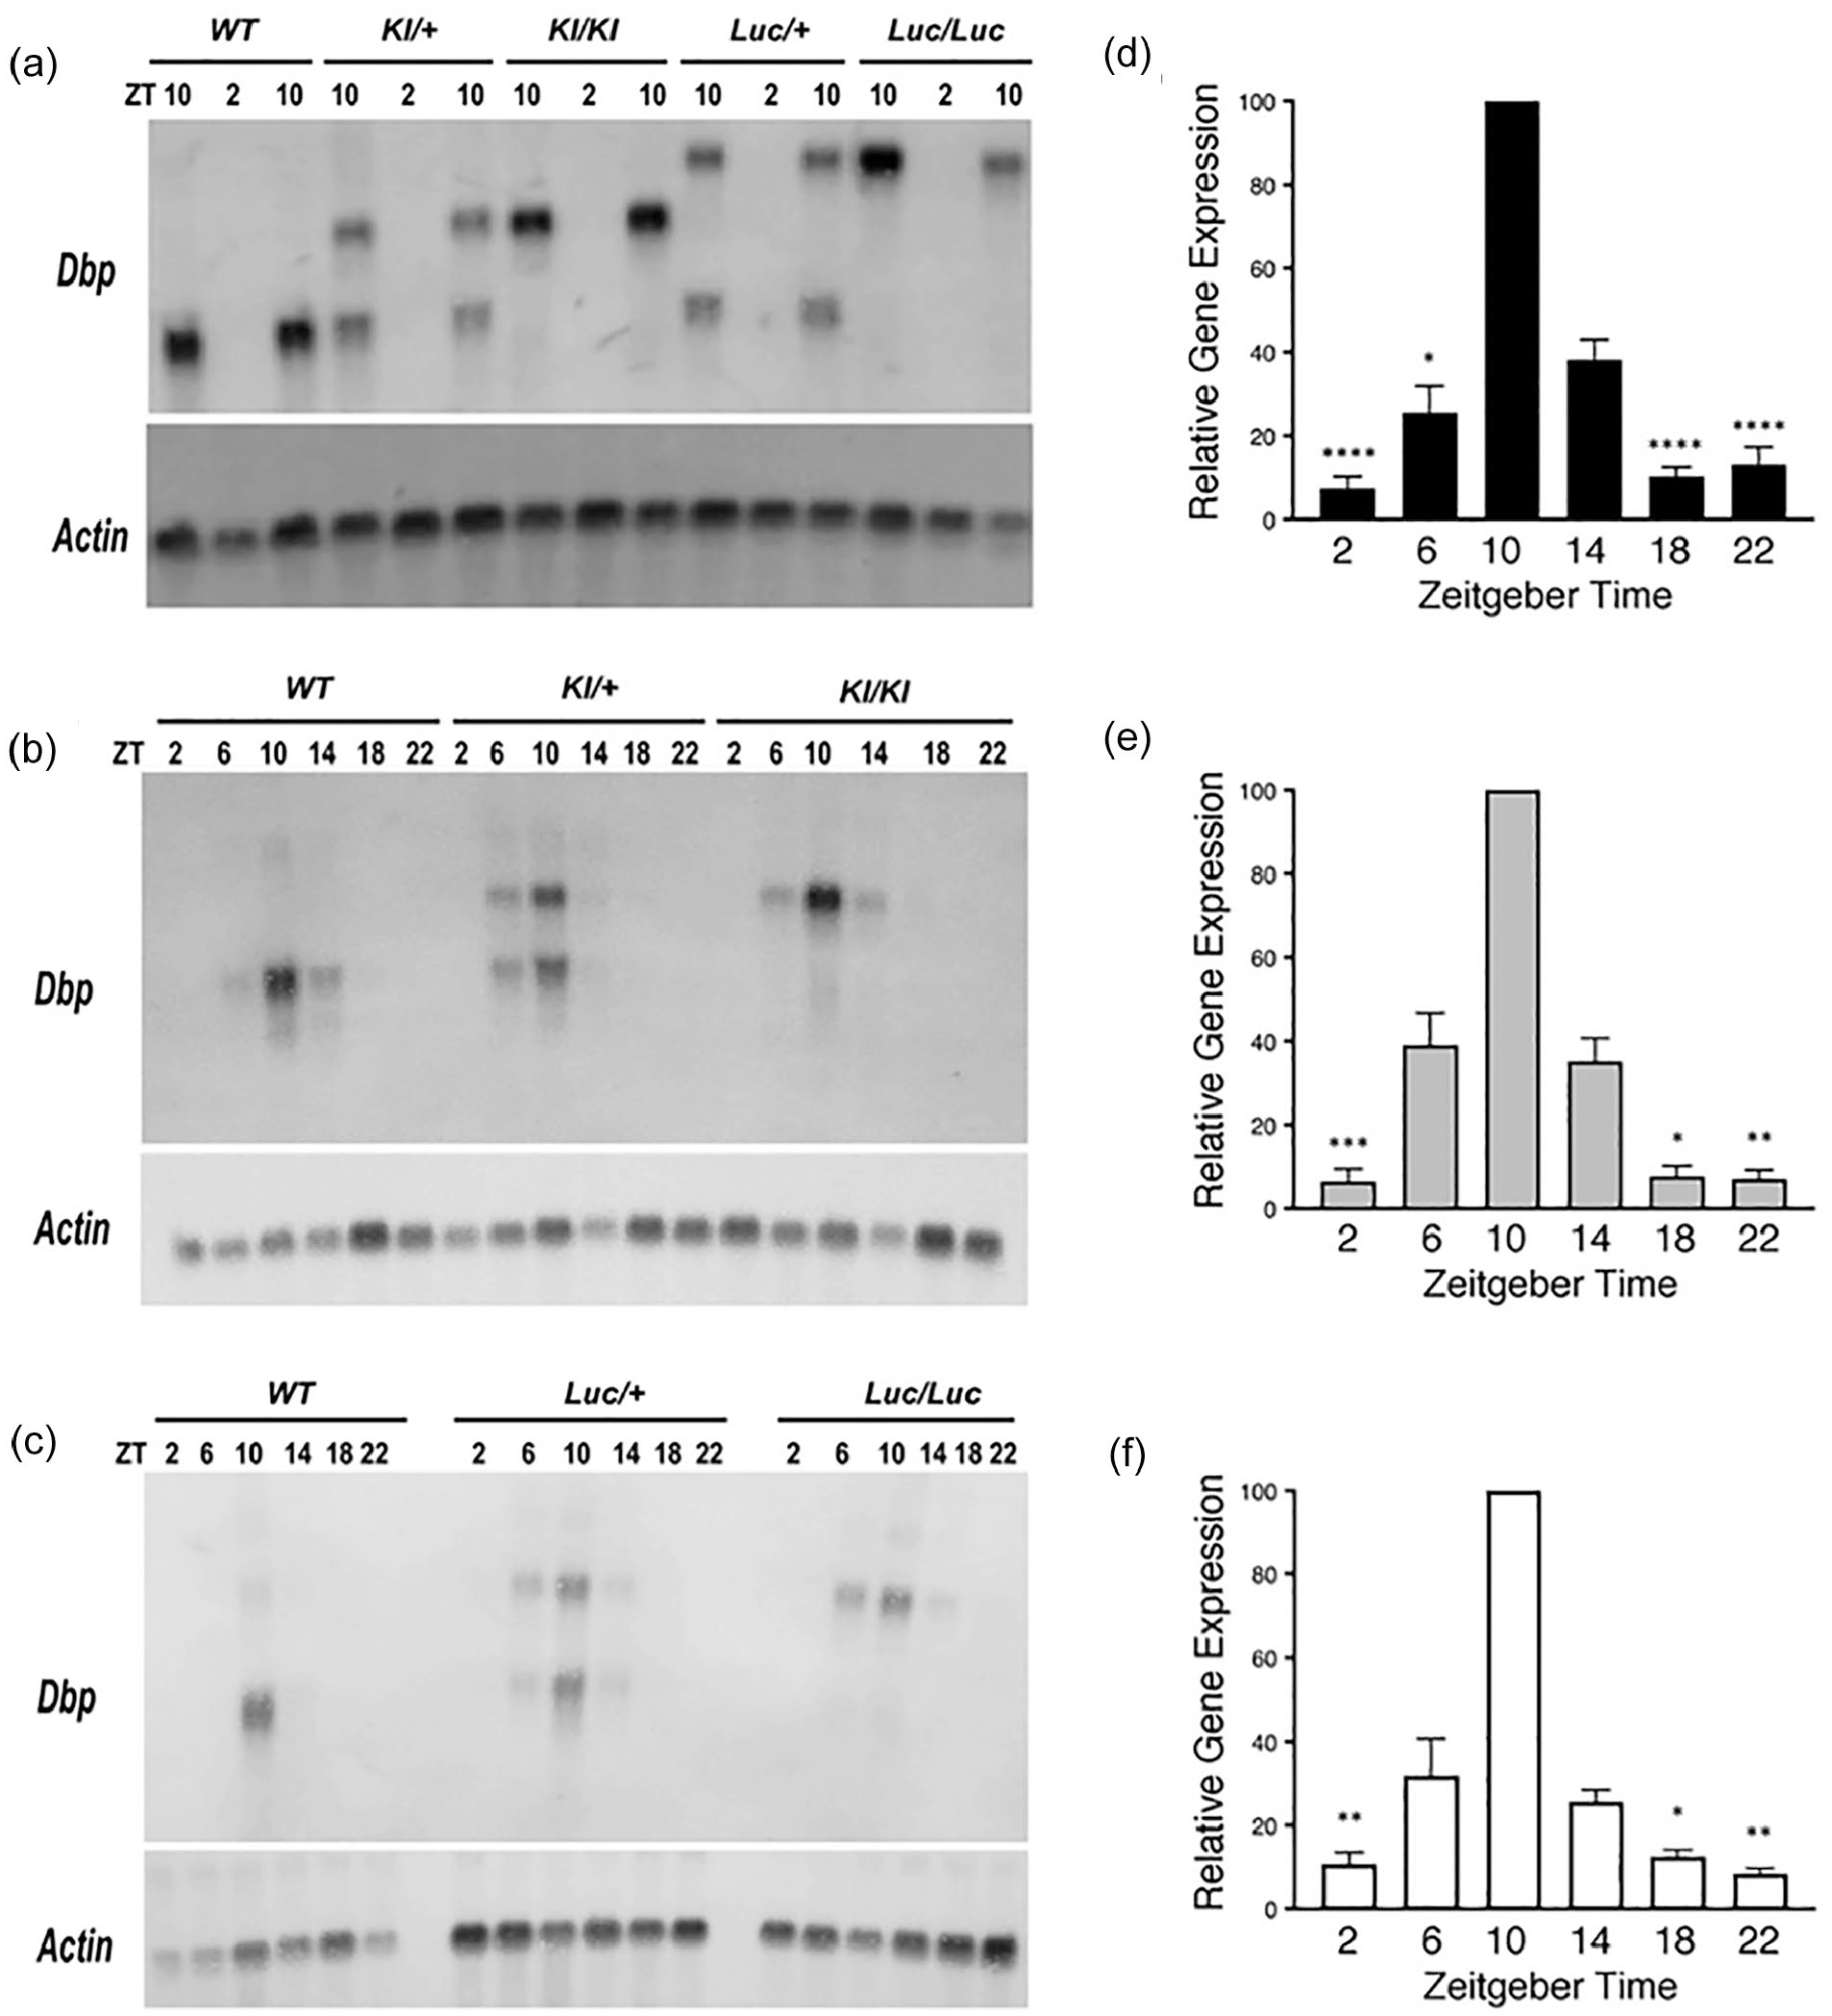
Dbp mRNA rhythms are not altered in reporter mice. (a-c) Representative Northern blots probed to detect Dbp and Actin mRNA. (a) From each of the five genotypes, RNA samples were extracted from livers collected at ZT2 and 10. For each genotype, there are two samples at ZT10 and one sample at ZT2 on this blot. (b) and (c) Representative Northern blots of RNA samples collected from WT and reporter mouse livers at each of the six ZT. (d-f) Quantification of Dbp mRNA rhythms for each allele in time series experiments (6 time-points each). Results are expressed as mean (±SEM) percent of the peak Dbp/Actin ratio, which occurred at ZT10 on every blot. (d) WT Dbp transcript (n = 12 sample sets). (e) Dbp
KI
transcript (n = 6). (f) Dbp
Luc
transcript (n = 6). For each transcript, there was a significant rhythm (Friedman’s one-way ANOVA, Q > 19, p < 0.002). Asterisks indicate time-points that differed significantly from ZT10 (Dunn’s test, *p < 0.05. **p < 0.01. ***p < 0.001. ****p
Heterozygous mice expressed both Dbp and Dbp-plus-reporter transcripts. The two transcript types did not differ in abundance: optical density over film background of the Dbp KI transcript was 100.5 ± 5.3% of the Dbp + transcript in Dbp KI/+ mice (t = 0.084, df = 7, p = 0.94, one-sample t test vs 100%), while the Dbp Luc transcript was 102.3 ± 5.0% of Dbp + transcript in Dbp Luc/+ mice (t = 0.446, df = 7, p = 0.669). The equivalent expression level of the two transcript types in heterozygous animals strongly suggests that transcript regulation and stability were not altered by inclusion of reporter-encoding sequences.
Locomotor activity rhythms were assessed in constant darkness in mice of both sexes in the same five genotypes (Table 1; Suppl. Fig. S1). We found a significant sex-by-genotype interaction (F4,102 = 2.904, p = 0.0254). Post hoc tests indicated an unexpected sex difference in the Dbp Luc/Luc mice. Indeed, when this genotype was excluded from the analysis, no significant sex-by-genotype interaction was observed (F3,88 = 1.349; p = 0.2636) and one-way ANOVA did not find a significant main effect of genotype (F3,91 = 1.174; p = 0.3242). One-way ANOVA within each sex with all five genotypes included revealed no genotype effect in males (F4,50 = 1.299, p = 0.283). While there was a significant genotype effect in females (F4,52 = 2.716, p = 0.040), Tukey HSD post hoc tests did not find a significant result among any of the pairwise genotype comparisons (all p values >0.05). Similarly, an alternative post hoc analysis revealed that none of the other female genotypes differed from WT females in their free-running period in constant darkness (Dunnett’s test, p > 0.5 in each case). To further examine the effect of sex on free-running period, males and females of each genotype were compared directly. In both DbpLuc/Luc and Dbp KI/KI mice, males had significantly longer periods than females (p < 0.01), while there was no sex difference in WTs or heterozygous reporters (p > 0.46).
Period length of locomotor activity rhythms in constant darkness, by sex and genotype.
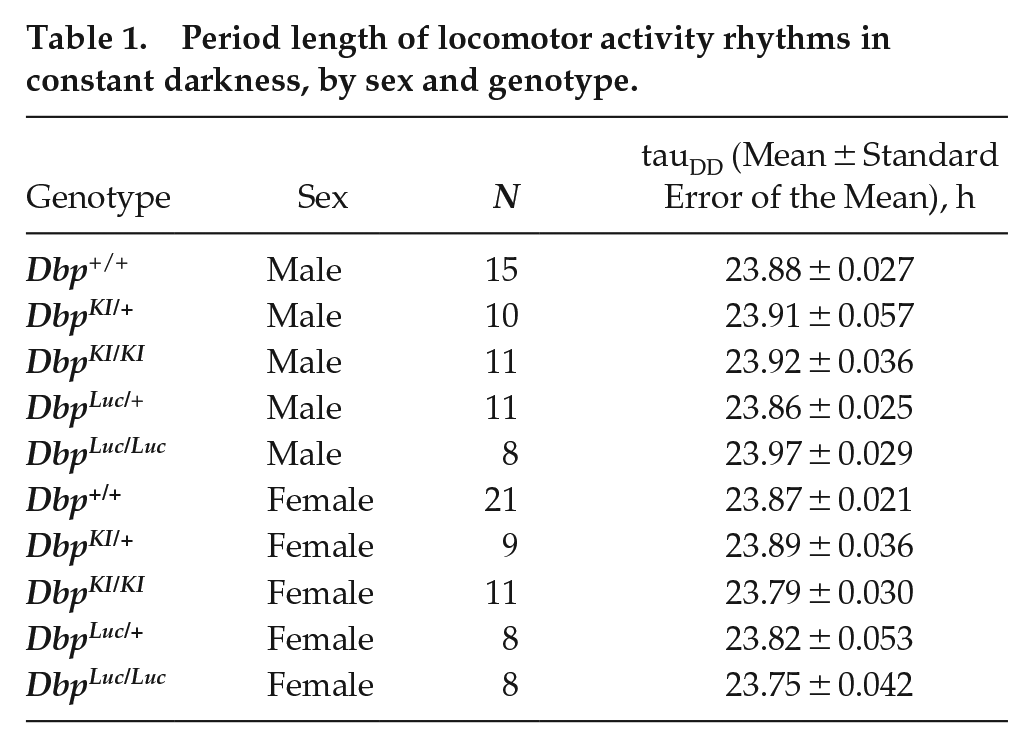
Together, these assessments of molecular and behavioral rhythms indicate that the reporter alleles do not change Dbp expression or appreciably alter circadian function.
GFP Expression From the Dbp KI Allele
To examine expression of GFP from the conditional allele, Dbp KI/+ mice (n = 5-6 mice per time-point) were anesthetized and perfused with fixative at 4-h intervals over 24 h (Suppl. Fig. S2). Liver sections from Dbp KI/+ and control (WT) mice were examined by confocal microscopy. Fluorescence signal intensity did not differ between time-points (ANOVA F5,26 = 1.279, p = 0.7560). GFP signal from Dbp KI/+ liver sections was 5-10× higher than from WT sections, but absolute levels were quite low. The low level of GFP expression may be due to the use of destabilized GFP with a 2-h half-life, intended to more accurately track changes on a circadian time-scale. The relatively low level and lack of detectable rhythmicity in GFP expression was unexpected, especially considering that the liver is the tissue with the highest levels of Dbp expression (Fonjallaz et al., 1996) and thus may represent a “best-case” scenario. As the primary objective of this project was to generate a mouse model with Cre-dependent expression of bioluminescence from the Dbp locus, however, the absence of robust GFP-driven fluorescence rhythms in Cre-negative cells did not preclude achieving this objective. GFP is effectively serving as a “floxed stop” to make luciferase expression from the Dbp locus exclusively Cre-dependent.
Nonconditional Luciferase Expression From the Dbp Luc Allele
The Dbp
Luc
allele produces widespread, rhythmic luciferase expression, both in vivo and ex vivo. More specifically, explants of lung and anterior pituitary gland from Dbp
Luc/+
mice incubated with
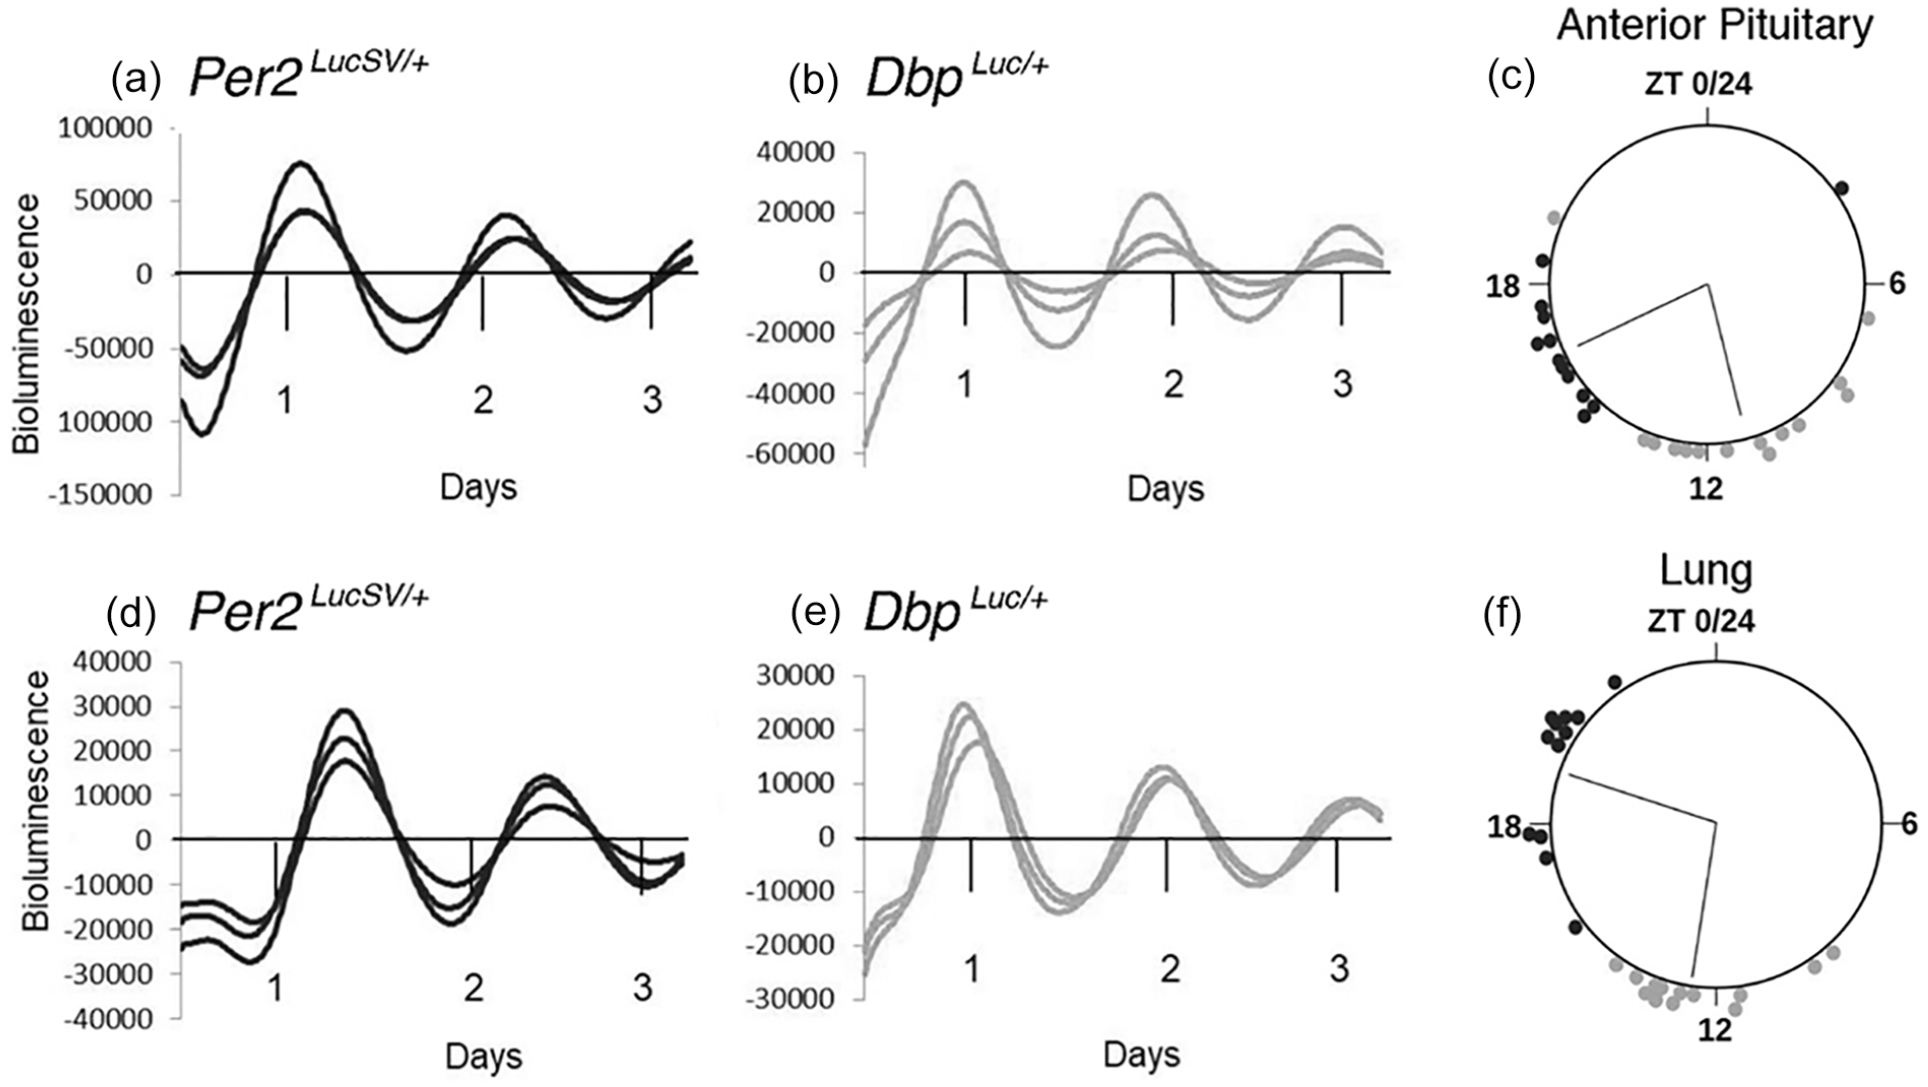
Ex vivo bioluminescence rhythms from Per2 LucSV/+ and Dbp Luc/+ tissue explants. (a-c) Anterior pituitary gland. (d-f) Lung. (a, b, d, e) Representative bioluminescence rhythms from triplicate tissue explants from Per2 LucSV/+ (a, d) and Dbp Luc/+ mice (b, e). “Days” refers to time in culture, not projected ZT. Values are 24-h background-subtracted and 3-h smoothed. (c, f) Time of peak bioluminescence ex vivo. The large circles represent a 24-h day for each organ. ZTs refer to the lighting cycle to which the mice were exposed prior to sample collection, with ZT0-12 being the light phase. Circles at the perimeter of the large circle indicate the timing of peak bioluminescence of individual Per2 LucSV/+ (black) or Dbp Luc/+ (gray) tissue explants (n = 12-14 mice). Within each tissue/genotype combination, there was significant clustering of times of peak bioluminescence. Radial lines represent the mean peak time, which differed significantly between genotypes for each tissue (Watson-Williams test, p < 0.001).
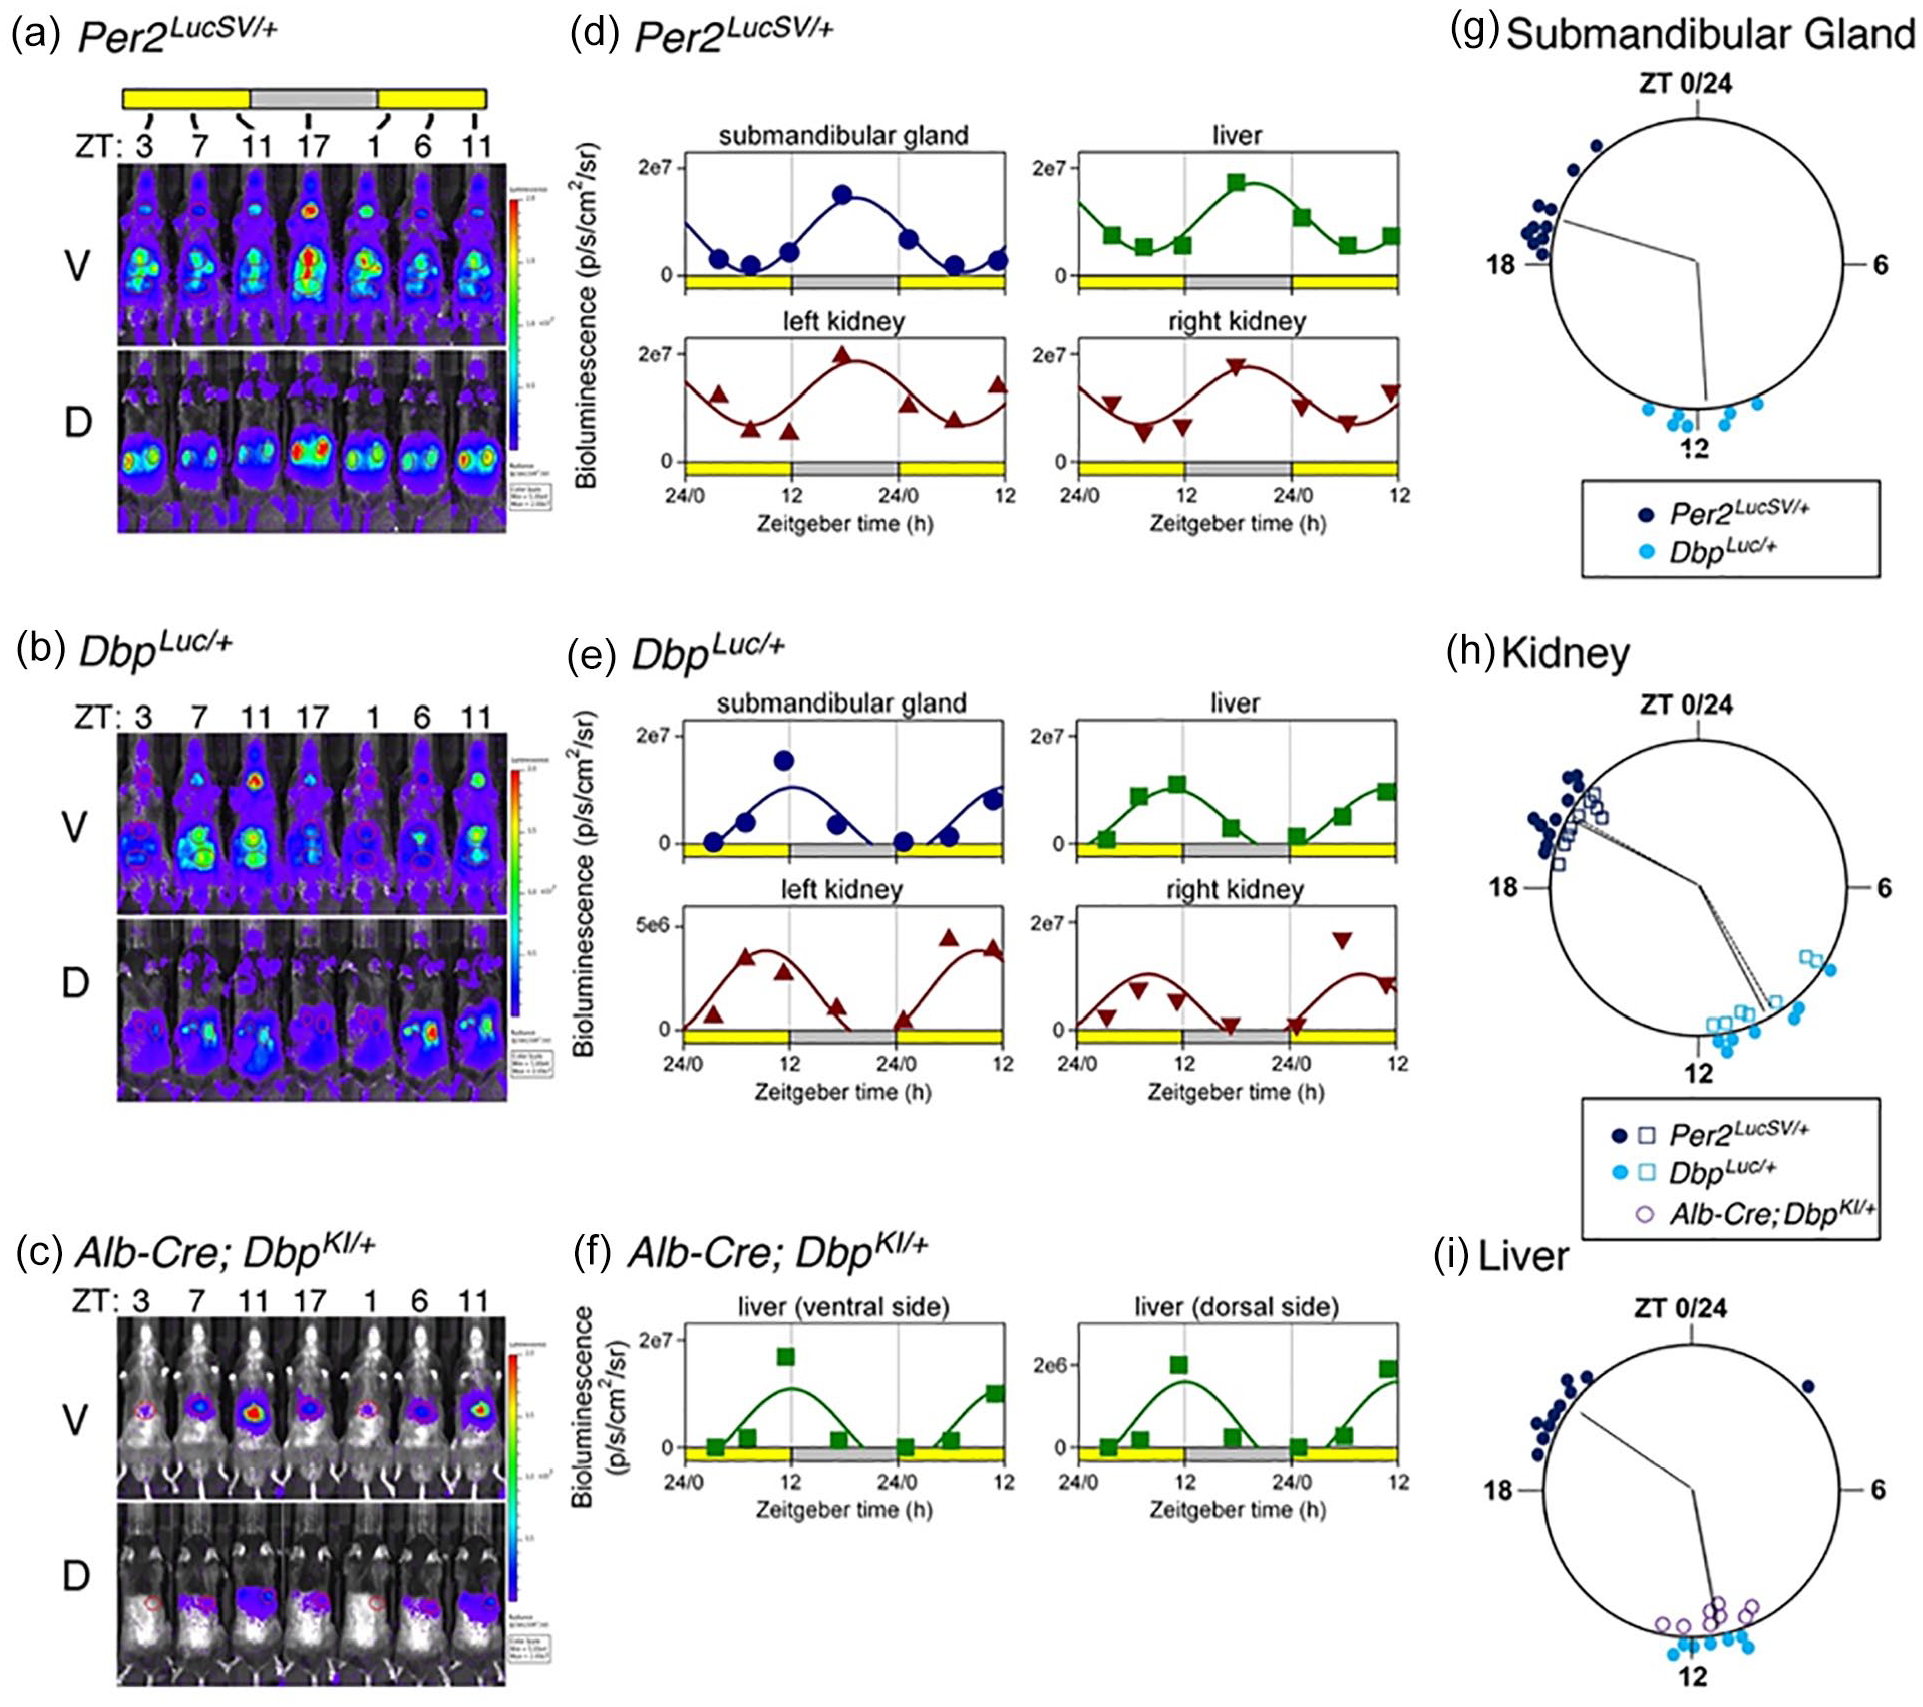
Bioluminescence rhythms measured in vivo. (a-c) Bioluminescence images captured at 4- to 6-h intervals from a representative mouse of each genotype. (a) Per2 LucSV/+ , (b) Dbp Luc/+ , (c) Alb-Cre+; Dbp KI/+ . V and D views are shown for each mouse. All images for each mouse are set to the same luminescence scale. (d-f) Cosinor-fitting of bioluminescence signal over time for the animals shown in Panels (a-c) to determine peak time. Bioluminescence rhythms were assessed in submandibular gland, liver, and kidneys of (d) Per2 LucSV/+ and (e) DbpLuc/+ reporter mice, and from liver of Alb-Cre+; Dbp KI/+ mice (f). (g-i) Time of peak bioluminescence in vivo. (g) Submandibular gland, (h) kidneys, and (i) liver. Data plotted as in Figure 3. Per2 LucSV/+ tissues (n = 10, dark blue), Dbp Luc/+ tissues (n = 7, teal). In Panel (h), open squares and filled circles represent the right and left kidneys, respectively. In Panel (i), purple circles represent livers from Alb-Cre+; Dbp KI/+ mice (n = 8). Radial lines represent the mean peak time for each genotype and tissue. Radial lines from the two kidneys of a genotype are nearly overlapping. For liver, radial lines for the two Dbp reporter lines are overlapping and appear as a single line. Within each organ examined, time of peak differed significantly in Per2 LucSV/+ explants compared with Dbp Luc/+ and Alb-Cre+; Dbp KI/+ explants (p = 0.002, Watson-Williams test). There was no significant difference in peak time between Dbp Luc/+ and Alb-Cre+; Dbp KI/+ liver tissues (p > 0.05). Abbreviations: V = ventral; D = dorsal.
Previous reports have shown that in a number of tissues, Dbp RNA levels peak earlier than Per2 RNA levels (Punia et al., 2012; R. Zhang et al., 2014). Consistent with this literature, the time of peak of bioluminescence rhythms from Dbp Luc/+ tissues preceded the time of peak of bioluminescence rhythms from Per2 LucSV/+ tissues by ~6 h in explants (Figure 3c and 3f) and by ~9 h in vivo (Figure 4g-4i). Bioluminescence rhythms from Per2 LucSV/+ tissue explants had significantly longer period than explants from Dbp Luc/+ mice (lung: 25.29 ± 0.13 vs 23.93 ± 0.11 h; F1,27.7 = 95.55, p < 0.0001; anterior pituitary: 25.27 ± 0.08 vs 23.73 ± 0.112 h; F1,24.53 = 66.12, p < 0.0001).
Cre-Dependent Luciferase Expression in Liver
The main use we envision for the Dbp reporter alleles involves Cre recombinase-mediated excision of GFP, leading to expression of luciferase in cells expressing Cre. The effectiveness of this approach was first assessed in hepatocytes using an Albumin-Cre-driver line. In vivo bioluminescence imaging of intact Albumin-Cre + ; Dbp KI/+ “liver reporter” mice at the time of expected maximal bioluminescence revealed that 96.6 ± 0.48% of light originated in the “liver” ROI (relative to total ventral-view bioluminescence; p < 0.0001 vs 46.6 ± 3.0% in Dbp Luc mice, U test, U = 0, n = 19 and 17, respectively). Notably, postmortem imaging after dissection confirmed that bioluminescence originated exclusively from the liver in these mice (97.4% of light from liver; n = 12).
In a separate cohort of liver reporter mice, bioluminescence was assessed around the clock by IVIS imaging. The cosinor-fitted time of peak of Dbp-driven bioluminescence rhythms from the liver “region of interest” of these mice (ZT11) was indistinguishable from the peak time of the liver ROI analyzed in whole-body Dbp Luc mice (Figure 4i).
Cre-Dependent Luciferase Expression in Kidney
Viral introduction of rhythmic luciferase reporters to the liver has been used previously (Saini et al., 2013, Sinturel et al., 2021), so our success with detecting bioluminescence rhythms specifically from the liver in Albumin-Cre + ; Dbp KI/+ “liver reporter” mice was reassuring, but not surprising. With reporter genes expressing from multiple tissues (e.g., Dbp Luc and Per2 Luc ), the contribution made by surrounding organs may be unclear. To extend our demonstration of tissue-specific luciferase expression from the conditional Dbp KI allele, we examined bioluminescence from anesthetized Ksp1.3-Cre; Dbp KI/+ “kidney reporter” mice. The Ksp1.3-Cre driver leads to recombination in the developing kidney and urogenital tissues, and in renal tubules of adult mice. In male kidney reporter mice, IVIS imaging of anesthetized, dissected living mice revealed bioluminescence from the kidney and seminal vesicles in situ (Suppl. Figs. S3 and S4). In females, bioluminescence originated from the kidney and proximal ureter (Suppl. Fig. S5). We thus used female mice to assess rhythmicity. Clear diurnal rhythmicity in bioluminescence was apparent from the kidney (Friedman’s one-way ANOVA (Fr = 32.71, k = 5, n = 9, p < 0.0001, see Suppl. Fig. S6) with a peak at ZT8. Dunn’s test revealed that ZT8 time-point differed significantly from ZT0 and ZT18 but not from ZT4 and ZT14 (multiplicity-corrected, two-tailed Dunn’s test; see Suppl. Fig. S6).
Cell-Type-Specific Bioluminescence Rhythms in SCN Slices
The heterogeneity of SCN neurons has important functional implications for our understanding of the central circadian clock (Herzog et al., 2017). NMS is expressed in ~40% of SCN cells, while AVP is expressed in ~10% of SCN neurons and is contained within the NMS-expressing population (Lee et al., 2015). The utility of our conditional reporter line was demonstrated by monitoring bioluminescence rhythms within specific subpopulations of SCN neurons (Figure 5). NMS-iCre; Dbp KI/+ mice and AVP-IRES2-Cre; Dbp KI/+ mice were generated, and single-cell bioluminescence rhythms were compared with those from nonconditional Dbp Luc/+ mice in SCN slices ex vivo. For the conditional mice, bioluminescence was apparent in subsets of cells within the SCN (Figure 5a). The anatomical pattern of bioluminescence in the SCN differed based on the Cre line used, consistent with the expected distribution for each neuronal subtype. In each slice, rhythmic ROIs were readily apparent (Figure 5b).
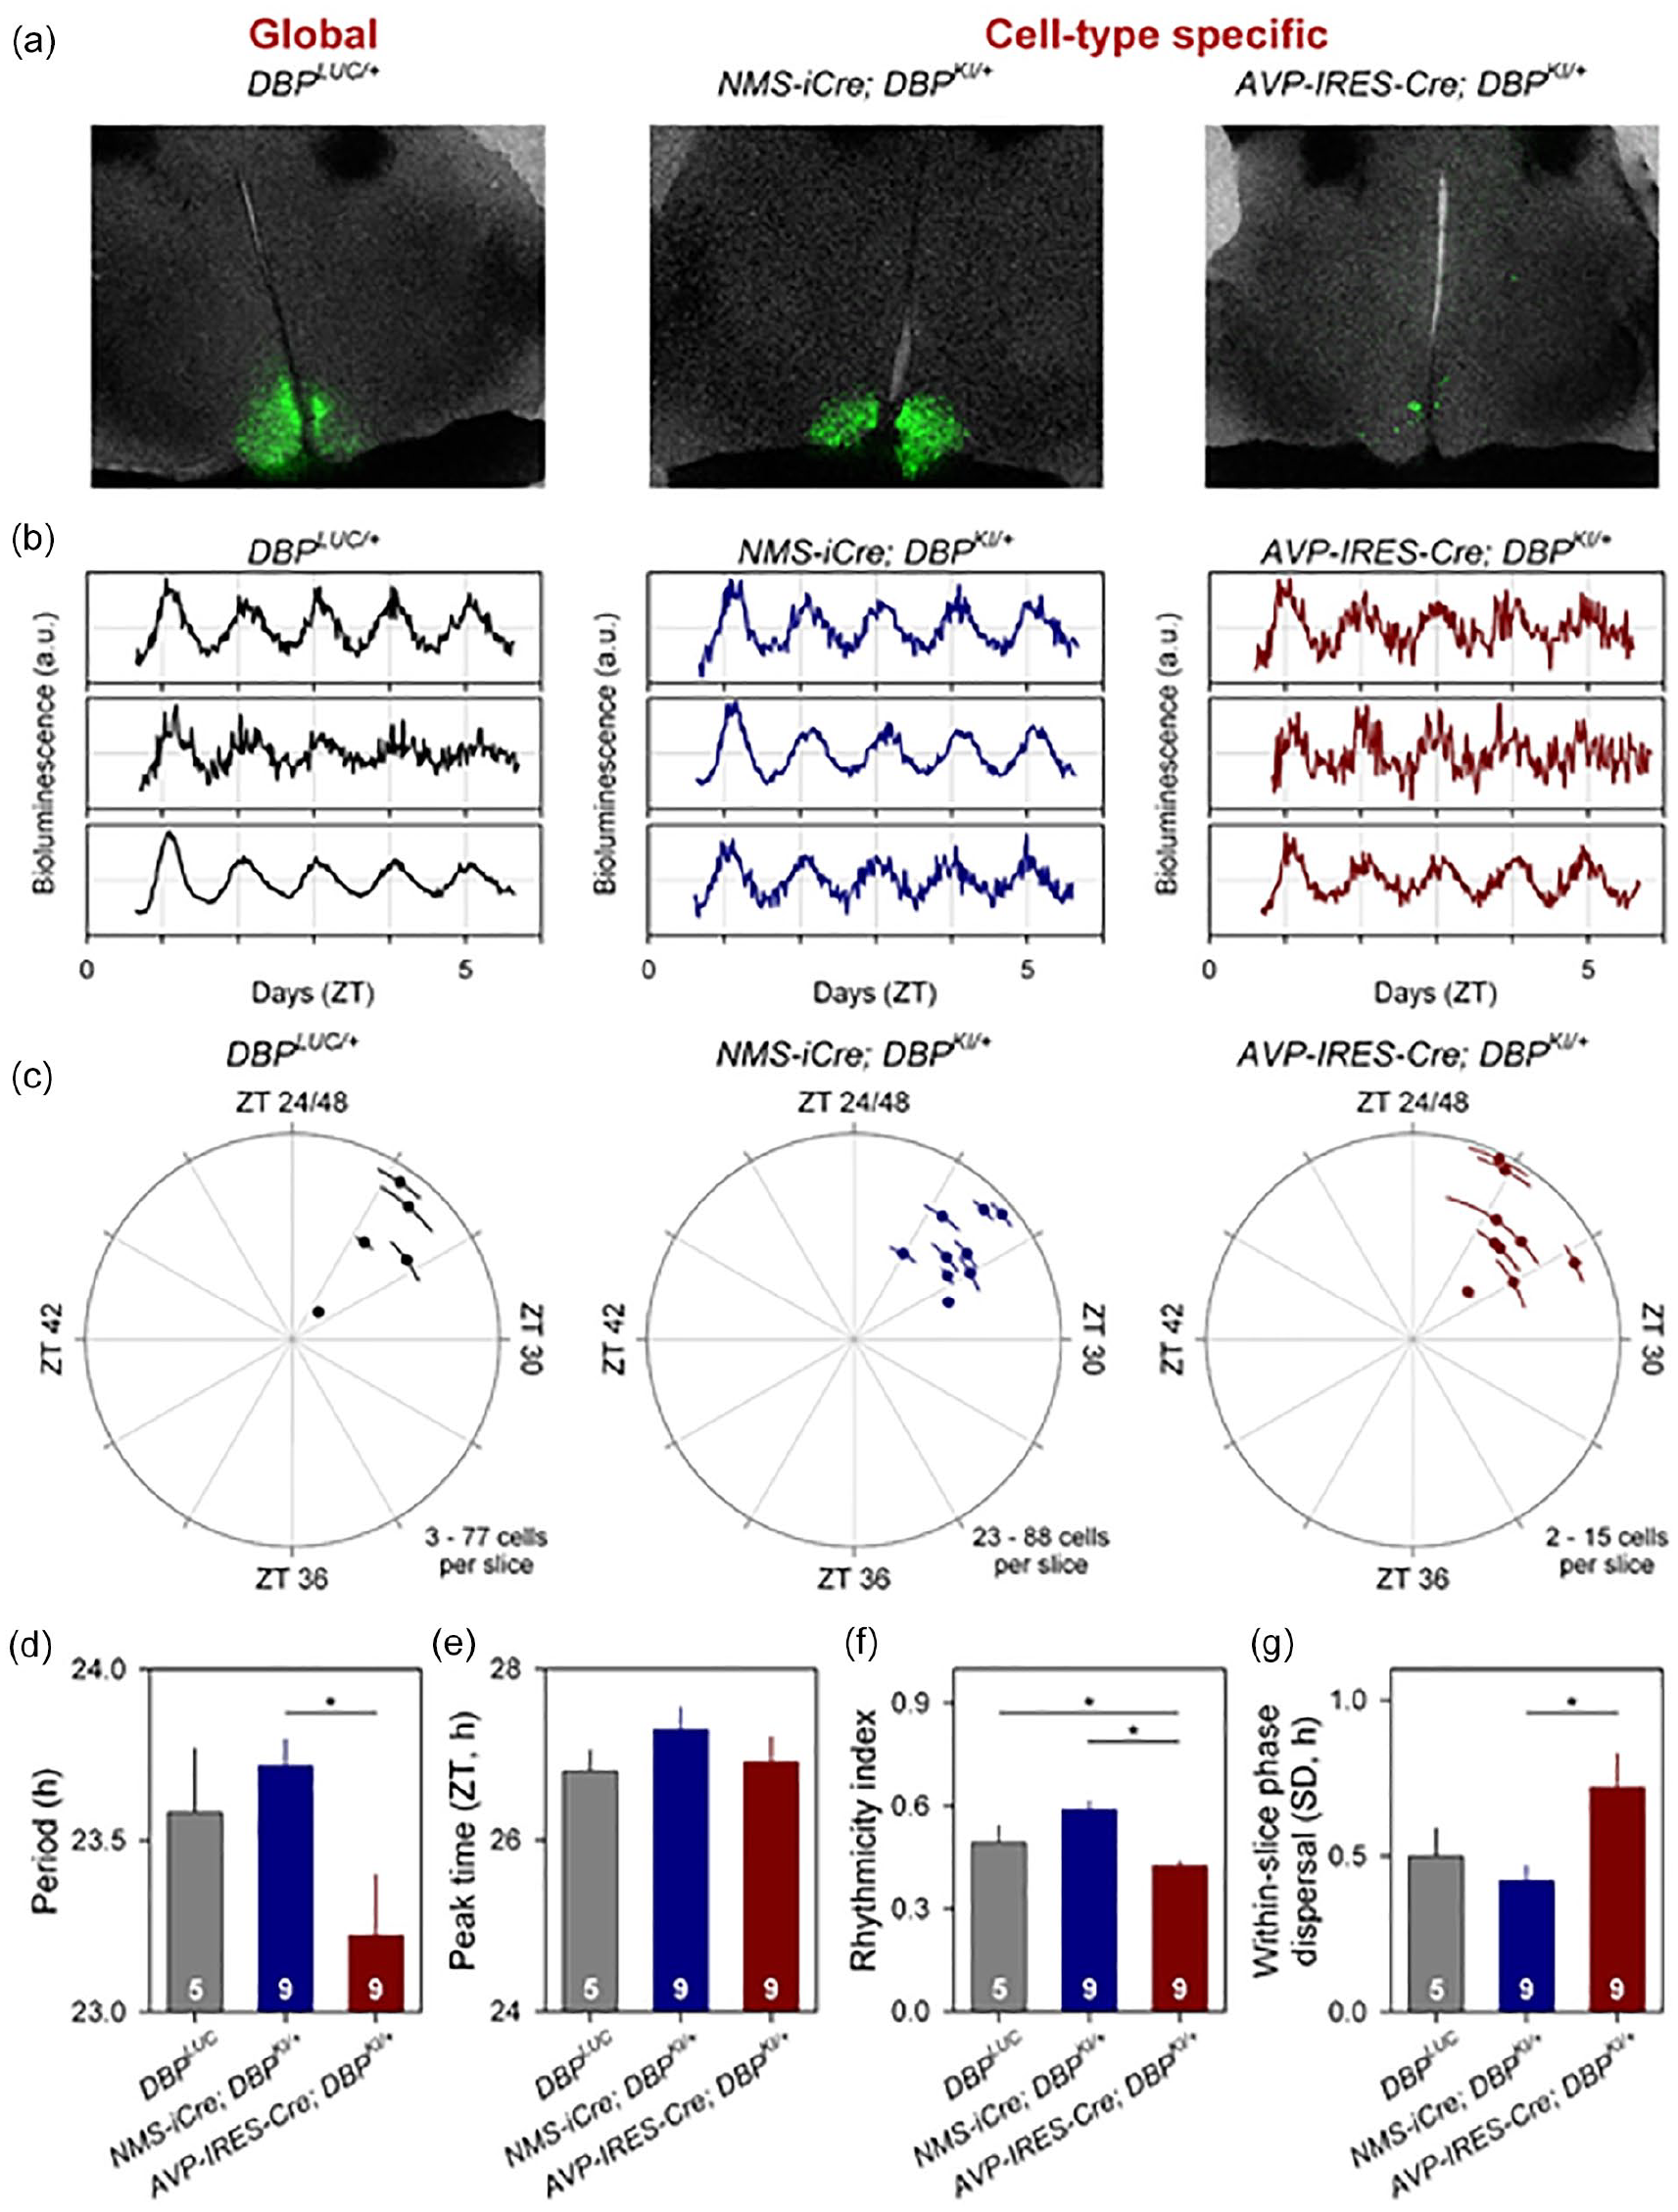
Cell-type-specific imaging of luciferase expression in SCN slices. (a) 24-h summed bioluminescence overlaid onto bright field images of a section through the SCN from Dbp Luc/+ (global reporter expression, left), and in mice expressing luciferase from specific subsets of SCN neurons (NMS + cells, center; AVP + cells, right). (b) Representative bioluminescence traces from single neuron-like ROIs in slices from each genotype. (c) Circular plots indicate the peak time of bioluminescence rhythms from each genotype. Time is expressed relative to the light-dark cycle the mice were housed in prior to sacrifice; numbers >24 are used to indicate that these measures are recorded on the first day in culture and are plotted relative to the previous lighting conditions. Each slice is represented by a small dot. Placement of the dot relative to outer circle indicates average peak time (±SD), while the distance from the center corresponds to the number of cells incorporated in the average (√ cell#). (d-g) Rhythm parameters by genotype. The number of slices per genotype is indicated at the base of each bar. (d). Mean period (±SEM). (e) Circular mean peak time (±SEM). (f) Mean rhythmicity index score (±SEM). (g) Mean peak time dispersal (quantified by circular SD of peak times within each slice). Abbreviations: SCN = suprachiasmatic nuclei; NMS = Neuromedin S; AVP = arginine vasopressin; ROI = region of interest; SEM = standard error of the mean; DBP = D-site albumin promoter binding protein.
The cell-type specificity of bioluminescence signals from the different genotypes enabled the assessment of rhythm quality in the different neural populations. This assessment revealed a significantly shorter period in AVP+ cells compared with NMS+ cells (Figure 5c and 5d; F2,14.64 = 4.259, p = 0.0345). The time of peak of Dbp-driven bioluminescence did not differ significantly between the different cellular populations examined (Figure 5e; F2,18.31 = 0.6570, p = 0.5302), while a reduction in rhythm robustness was observed in AVP+ neurons compared with rhythms of NMS+ neurons as well as compared with all cells (Figure 5f; F2,18.11 = 14.34, p = 0.0002). The distribution of peak times was also more dispersed in AVP+ cells compared with NMS+ cells (Figure 5g).
These results complement the recent report from Shan et al. (2020) using a Cre-dependent Color-Switch PER2::LUC reporter mouse demonstrating period and phase differences among subpopulations of SCN neurons. Our Dbp KI mice and the recently reported Color-Switch PER2::LUC mouse line (Shan et al., 2020) will be important additions to our molecular-genetic armamentarium for unraveling the complicated relationships among the cellular components of the SCN circadian pacemaker.
Route of Substrate Administration
Monitoring peripheral organ circadian phase following disruptive environmental, surgical or genetic conditions will require long-term monitoring of peripheral rhythms in ambulatory mice. Studies using substrate delivery by mini-osmotic pump or infusion pump allow constant substrate administration but require surgery and, in the case of mini-osmotic pumps, are limited by the pump volume. Therefore, administration of luciferase substrate in the drinking water would be preferable. Thus, we examined the potential impact of route of substrate administration on rhythm phase using the LumiCycle In Vivo system (Actimetrics, Wilmette IL) in Albumin-Cre; Dbp
KI/+
(“liver reporter”) mice. Mice were entrained to LD followed by an SPP consisting of four 1-h pulses of light every 24 h (1L:1D:1L:6D:1L:1D:1L:12D) with the 12-h dark phase coinciding with 12-h dark phase of the preceding LD cycle. An SPP was used because detection of bioluminescence requires the absence of ambient light, while studies of light-induced phase shifting obviously require light; an SPP is a compromise between these conflicting constraints. After 7 days in the SPP, mice were anesthetized for subcutaneous implantation of a primed osmotic minipump (Alzet, Model #1002 [0.25 µl per hour]) containing either
Circadian Misalignment Following a Phase Shift of the Lighting Cycle
The approach described above provides an unparalleled system for assessing the timing of rhythmicity in a specific tissue over long periods of time. Next, hepatic bioluminescence rhythms were monitored in Albumin-Cre; DbpKI/+ (liver reporter) mice before and after a 6-h phase advance of the skeleton lighting cycle. Mice that remained in the original (nonshifted) skeleton lighting regimen had a stable phase of hepatic bioluminescence (Figure 6c). In contrast, mice exposed to a phase advance of the SPP displayed a gradual phase advance in both locomotor activity and hepatic bioluminescence rhythms (Figure 6a and 6b). Notably, locomotor rhythms shifted more rapidly than hepatic bioluminescence (Figure 6b). To compare the reentrainment of bioluminescence and locomotor activity rhythms, peak time for each rhythm each day was normalized to the time of peak on the last day before shifting the lighting cycle in the shifted group (e.g., Day 2 in Figure 6) for each animal. Data from each lighting group were analyzed separately using a general linear model with Animal ID as a random variable (allowing comparison of the two rhythms within individuals) and the main effects were endpoint (locomotor activity or bioluminescence) and Day number. In animals not undergoing a phase shift, the phase relationship of these endpoints was unchanged over time (F < 1.1, p > 0.39). In contrast, in animals exposed to a 6-h phase advance, the phase relationship of the locomotor activity and bioluminescence rhythms differed significantly (Measure*Day interaction, F9,54.98 = 3.358, p = 0.0024). Post hoc testing revealed a significant difference in phase between the two measures on Day 9 (Tukey HSD, p < 0.05). A separate analysis to compare phase (relative to Day 2 baseline) between bioluminescence and locomotor activity rhythms revealed significant differences between the two measures on Days 5, 6, 7, 8, 9, and 10 (t tests on each day, p < 0.05). Thus, both locomotor activity and hepatic bioluminescence rhythms shifted following a phase shift of the lighting cycle, but the rhythms differ in their kinetics of readjustment: liver lagged behind. These data provide clear evidence for misalignment of SCN-driven behavioral rhythms and hepatic rhythmicity.
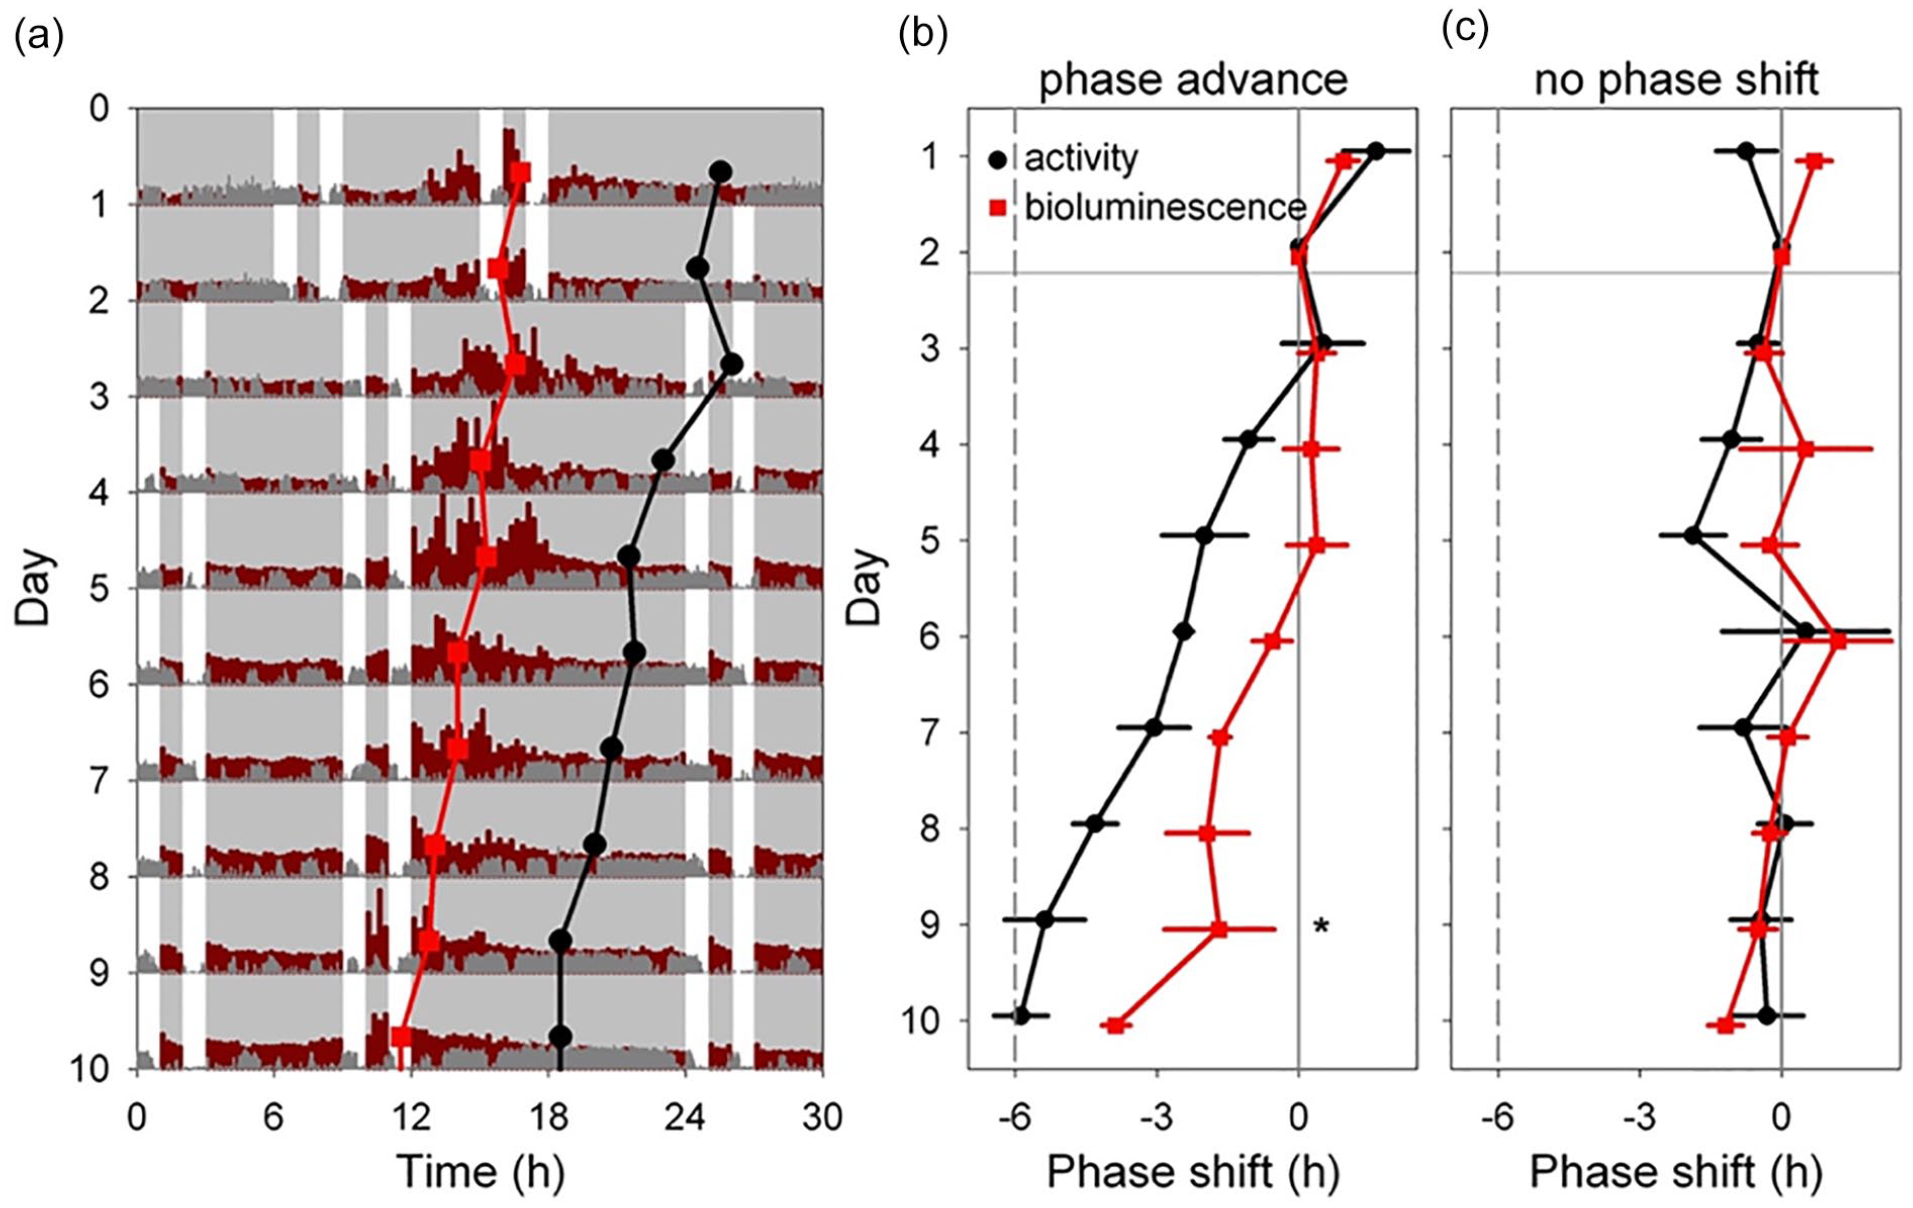
Light-induced resetting produces misalignment between rhythms in liver bioluminescence and locomotor activity. (a) Representative double-plotted actogram showing locomotor activity (dark gray) and bioluminescence (dark red) of an Alb-Cre; Dbp KI/+ liver reporter mouse before and after a 6-h advance of the skeleton photoperiod consisting of four 1-h periods of light per 24-h day, as indicated by white. The skeleton photoperiod was advanced by 6 h by shortening the dark phase after the last light pulse on Day 2. Red squares represent the peak of the bioluminescence rhythm, while black circles represent the midpoint of locomotor activity each day, determined by discrete wavelet transform analysis. Six hours of each cycle are double-plotted to aid visualization. Light and dark are indicated by white and gray backgrounds, respectively. (b) Mean (±SEM) midpoint of locomotor activity (black) and peak of liver bioluminescence (red) rhythms are shown, relative to their initial value, in a group of four mice exposed to a 6-h phase advance of the skeleton photoperiod. The locomotor activity rhythm resets more rapidly than the bioluminescence rhythm within animal (Significant Measure × Day interaction, and significant phase difference between the rhythms on Day 9; Tukey HSD, p < 0.05). (c) Mean (±SEM) time of midpoint of locomotor activity (black) and peak liver bioluminescence (red) rhythms are shown, relative to their initial phase, in a group of four mice not subjected to a phase shift of the skeleton photoperiod. Abbreviation: SEM = standard error of the mean; HSD = honestly significant difference.
Recovery From Circadian Misalignment Induced by Temporally Restricted Feeding
We next conducted a study to examine misalignment induced by restricted feeding. Previous studies have shown that food availability limited to daytime significantly alters phase of peripheral oscillators (Damiola et al., 2000; Hara et al., 2001; Stokkan et al., 2001; Saini et al., 2013). Due to our desire to study bioluminescence rhythms without interference from the LD cycle, we administered different feeding regimens in an LD cycle and then assessed the hepatic bioluminescence rhythm after release to DD with ad libitum food. This allowed us to determine the time of peak bioluminescence of the liver after restricted feeding, and the opportunity to continuously observe its return toward a normal phase relationship with SCN-driven behavioral rhythms over time.
Alb-Cre;DbpKI/+ liver reporter mice were exposed to one of the three feeding regimes (ad libitum, nighttime, or daytime food availability; Figure 7a) for 10 days in LD before recording bioluminescence in DD with ad libitum food availability. A previously described automated feeder system (Acosta-Rodriguez et al., 2017) was used to restrict food availability. This system limits total daily consumption (to prevent hoarding) and restricted food pellet delivery for day-fed mice to 0600-1800 h (ZT0-ZT12), and for night-fed mice to 1800-0600 h (ZT12-ZT24/0). With the setting used, the system restored daily food allotments to ad libitum fed and night-fed mice daily at 0000 h (ZT18), resulting in unusual temporal profiles of food intake in ad libitum and night-fed mice. Nevertheless, ad libitum and nighttime food access both resulted in food intake being concentrated in the night, while daytime food availability resulted in the midpoint of food intake occurring during the first half of the light phase (Figures 7a-7c). Within-group variability in the timing of food intake was low except for three clear outliers (Figure 7c) that were excluded from subsequent analyses.
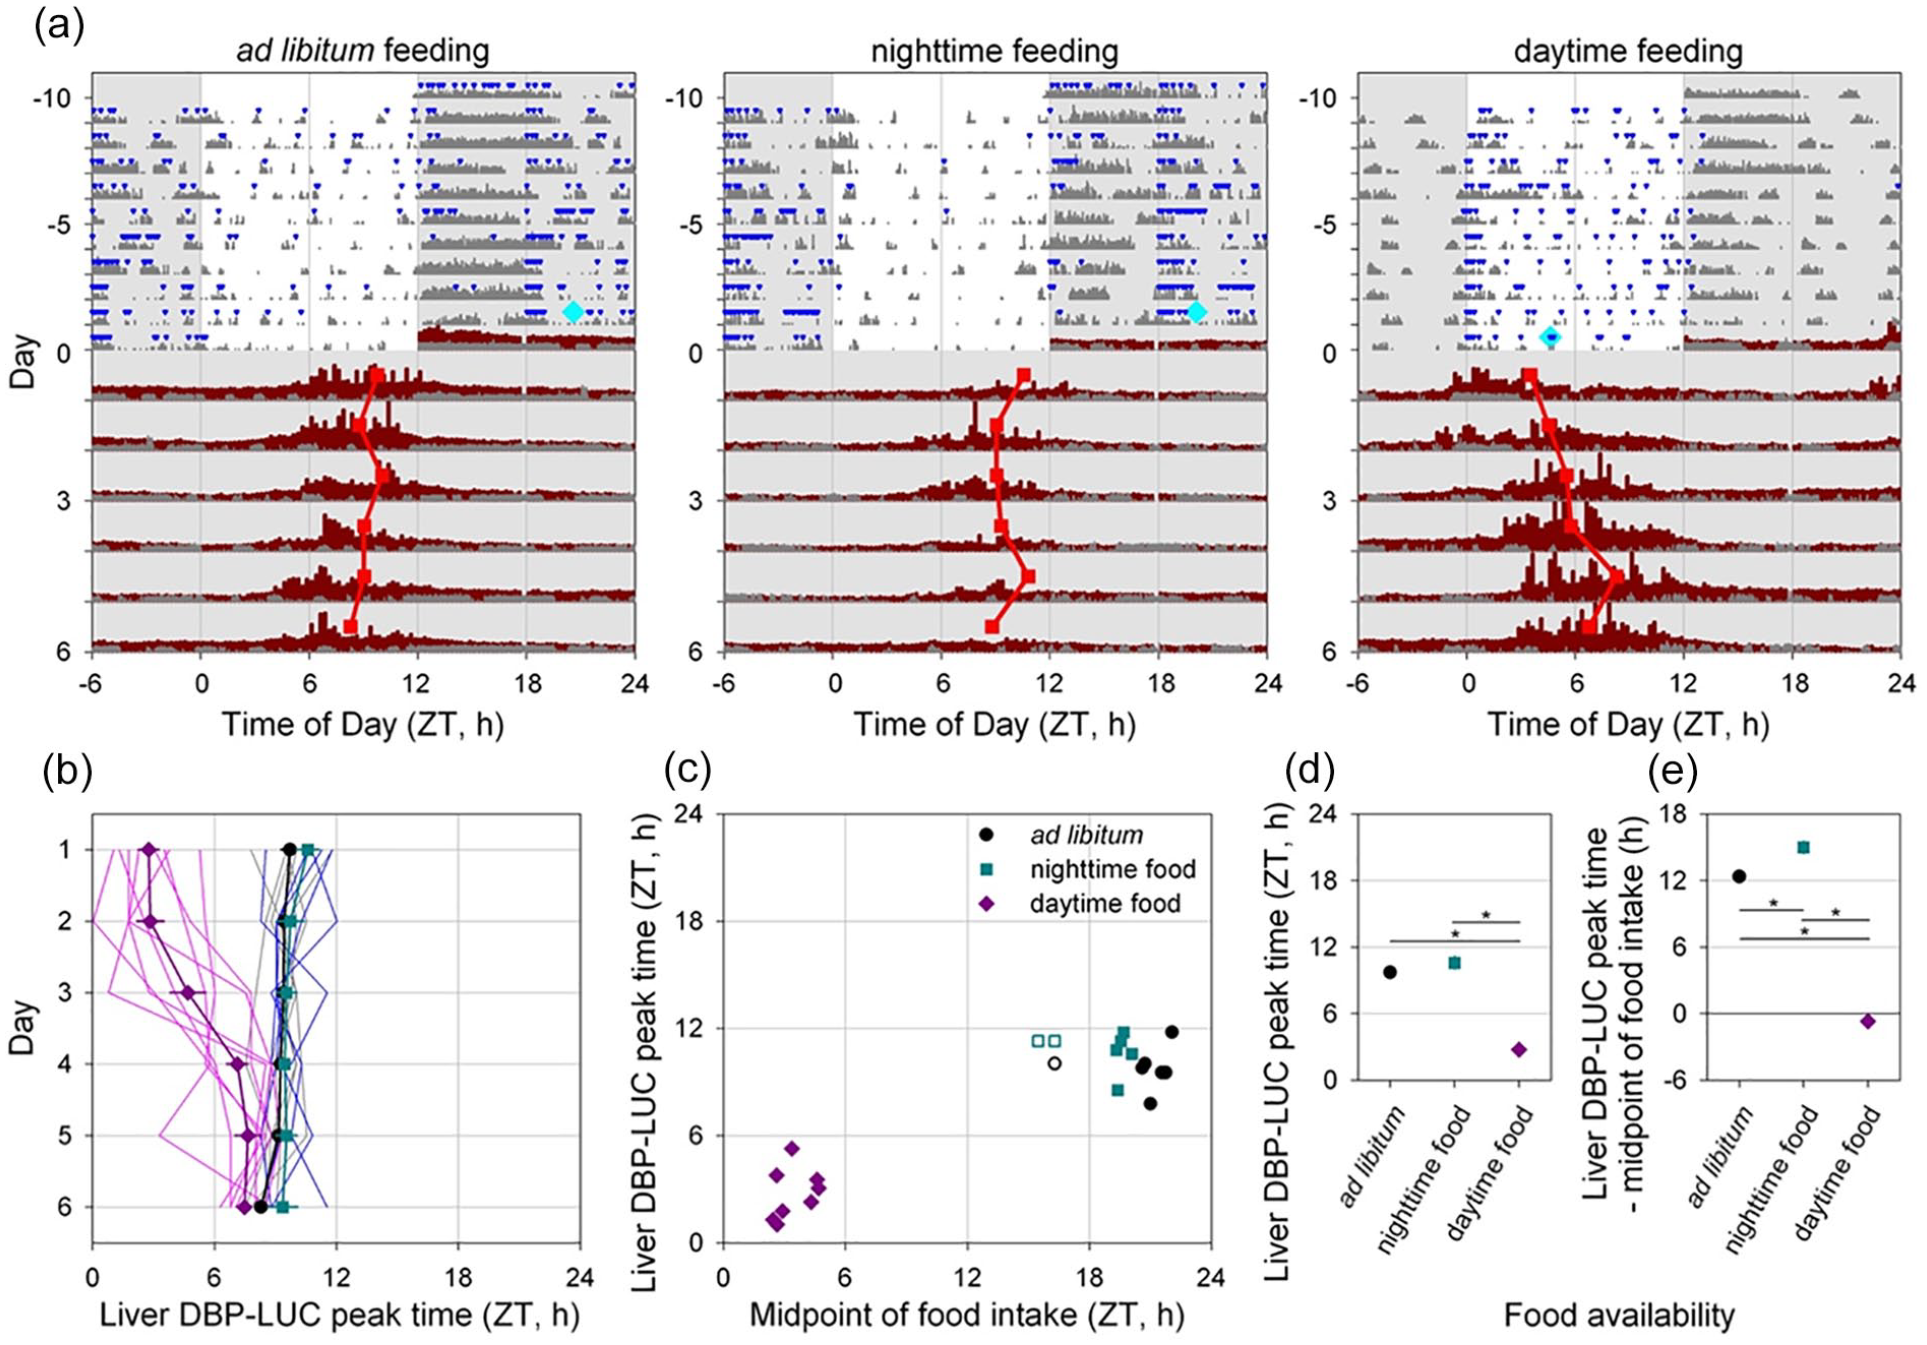
Time-restricted feeding alters the timing of liver bioluminescence rhythms. (a) Representative actograms of three Alb-Cre; Dbp KI/+ liver reporter mice exposed to the different feeding regimes as indicated above each panel. Mice were housed in 12L:12D lighting and exposed to the specified feeding regime for 10 days (−10 to 0) before bioluminescence recording. Food intake (blue triangles) and general locomotor activity (dark gray) were recorded continuously. The midpoint of food intake from Days −5 to 0 is indicated by a cyan diamond on Day 0. Mice were transferred to the bioluminescence recording setup at the start of the dark phase and housed in constant darkness with ad libitum food access. Liver bioluminescence levels are depicted in dark red. Red squares represent the time of peak of the bioluminescence rhythm, determined by DWT. Six hours of each cycle are double-plotted and the y-axis has been stretched during the last 6 days to aid visualization. Light and dark are indicated by white and gray backgrounds, respectively. (b) Individual and mean (±SEM) phase of liver bioluminescence rhythms relative to clock time for three feeding groups. Mice previously exposed to ad libitum, nighttime and daytime feeding are plotted in gray/black, blue/cyan and magenta, respectively (key in Panel c). Prior to recording bioluminescence, mice were entrained to a 12L:12D lighting cycle with lights on at 0600 h. Mice previously exposed to daytime feeding show an advanced peak phase of liver bioluminescence that reverts over time in constant darkness with ad libitum food. (c) Relationship between preceding feeding phase and peak liver bioluminescence phase for individual animals on the first day under constant conditions. Ad libitum and night-fed groups had similar midpoint of food intake; three “outliers” with respect to midpoint of food intake (shown by open symbols) were not included in further analyses (Panels b, d, and e). (d). Mean (±SEM) peak liver bioluminescence phase on the first day under constant conditions, relative to clock time for the three feeding regimens. Error bars were nearly or completely contained within the symbols. (e) Mean (±SEM) peak liver bioluminescence phase on the first day under constant conditions, relative to the midpoint of preceding food intake for the three feeding regimens. Error bars were nearly or completely contained within the symbols. Abbreviations: DWT = discrete wavelet transform; SEM = standard error of the mean; DBP = D-site albumin promoter binding protein.
Ad libitum fed mice showed consistently phased rhythms in bioluminescence after transfer to DD from LD, as did night-fed animals (Figure 7a and 7d). In contrast, mice fed only during the light period for 10 days prior to housing in DD with ad libitum food had an earlier peak time of the hepatic bioluminescence rhythm. Daytime feeding resulted in a significantly advanced peak time compared with both night-fed and ad libitum fed mice, while these latter groups were statistically indistinguishable (F2,259.6 = 76.66, p < 0.0001; Figure 7d). Subsequent exposure to DD with ad libitum feeding allowed the hepatic clock of day-fed mice to return toward the appropriate phase relationship with the locomotor activity rhythm.
Although daytime feeding resulted in an advanced time of peak bioluminescence, the timing of the liver bioluminescence rhythm was not solely controlled by the timing of food intake. First, no significant correlations between the timing of food intake and time of peak bioluminescence were observed within any of the three feeding regimes (F < 1.13, p > 0.32; Figure 7c). Second, the relationship between the timing of liver bioluminescence rhythms relative to the midpoint of food intake was significantly different between the different groups (F2,17 = 313.2, p < 0.0001; Figure 7e). While Dbp-driven hepatic bioluminescence rhythms were roughly in anti-phase with the midpoint of feeding in ad libitum and night-fed mice, daytime feeding resulted in near synchrony between these rhythms (Figure 7e). Furthermore, although the average midpoint of feeding was significantly earlier in night-fed compared with ad libitum fed mice (t10 = 6.21, p < 0.0001; Figure 7c), no significant difference was observed in bioluminescence phase relative to the preceding light-dark cycle (Figure 7d), with the timing of liver bioluminescence rhythms relative to the midpoint of food intake being significantly delayed in night-fed compared with ad libitum fed mice (Figure 7e). Overall, these results demonstrate that although the timing of food intake strongly influences liver rhythms, the timing of bioluminescence rhythmicity in liver reporter mice is not solely driven by the timing of food intake (with food intake regulated for this duration and in this way).
Discussion
Numerous studies have made use of rhythmically expressed bioluminescent reporter genes to monitor circadian rhythms. The Per2 Luiferase mouse and other reporters with bioluminescence under the control of a clock gene have been especially useful as they generate robust bioluminescence rhythms from numerous tissues recorded ex vivo (Abe et al., 2002; Maywood et al., 2013; Yamazaki et al., 2000; Yamazaki and Takahashi, 2005; Yoo et al., 2004, 2005). The widespread expression of PER2::LUCIFERASE (and other “non-conditional” bioluminescence reporters) comes at a cost, however, as it is not possible to assess rhythmicity in specific cell populations within a larger tissue without dissection. Tissue explant preparation can cause phase-resetting, however, especially after exposure to phase-shifting stimuli (Noguchi et al., 2020; Leise et al., 2020). Furthermore, ex vivo culturing of tissues does not allow assessment of rhythmicity in the context of the hierarchical circadian system or dynamic changes during environmentally induced resetting.
Addressing issues of internal desynchrony and misalignment of oscillators requires monitoring the dynamics of tissue resetting over time after a phase-shifting stimulus. The use of in vivo bioluminescence imaging for repeated assessments of organ-level ROIs over multiple days is feasible but requires several potentially disruptive anesthesia sessions (Poulsen et al., 2018) per circadian cycle. As a result, in vivo bioluminescence imaging has generally been relegated to assessing phase of reporter gene oscillations on relatively few occasions after a shifting stimulus, with rare exception (van der Vinne et al., 2020). Other methods for monitoring bioluminescence and fluorescence rhythms in ambulatory mice have been developed (Hamada et al., 2016; Mei et al., 2018; Nakamura et al., 2008; Ono et al., 2015; Saini et al., 2013; Sawai et al., 2019; Yamaguchi et al., 2001; Yamaguchi et al., 2016), but a less invasive approach for assessing rhythms in a variety of specific tissues is desirable. Notably, several abdominal organs emit significant amounts of bioluminescence in “whole-body” reporter mice, including liver, kidney, and intestines. These tissues likely overshadow (or, more accurately, out-glow) surrounding tissues. Bioluminescence from even larger organs like liver and kidney is likely “contaminated” by light from adjacent structures. Indeed, the size and shape of the “liver” ROI seen by IVIS imaging (Figure 4) differs between Dbp liver reporter mice and whole-body reporter Dbp Luc mice. These considerations underline the benefits of generating a Cre-conditional reporter mouse in which recombination leading to bioluminescence can be directed to specific tissues and cell types.
We chose to modify the Dbp gene to generate a conditional reporter for several reasons. Dbp is widely and rhythmically expressed at readily detectable levels (Fonjallaz et al., 1996; Punia et al., 2012; R. Zhang et al., 2014). This feature ensures that the reporter mouse would be useful for detecting rhythmicity in numerous tissues. In addition, individual clock genes are responsive to different signaling pathways. This differential regulation can lead to circadian misalignment within the circadian clock (Reddy et al., 2002; Nicholls et al., 2019). As an output gene controlled by the CLOCK:BMAL1 transcriptional activator complex (Ripperger et al., 2000; Ripperger and Schibler, 2006; Stratmann et al., 2012), Dbp rhythmicity is likely a good proxy for the integrated output of the molecular clockwork. Additional cis-acting elements regulating Dbp expression have been identified, however. Binding of hnRNP K to a poly-(C) motif in the proximal promoter has been implicated in high-amplitude expression of Dbp (Kwon et al., 2019, 2020). Interestingly, Dbp appears to be insensitive to acute regulation by activation of signal transduction pathways. Unlike Per1 and Per2, Dbp gene expression is not increased in the mouse SCN following exposure to light at night (Yan et al., 2000). Furthermore, Dbp expression is not acutely increased by horse serum or stimulation of the cAMP/PKA pathway by forskolin, which rapidly induce Per1 (Yagita and Okamura, 2000) and resynchronize molecular rhythms. Thus, Dbp expression and the Dbp-based reporter are likely to represent the status of the molecular clock without interference by other influences. Finally, concern that the targeting event could disrupt function of the modified gene led us to steer away from core clock genes. Mice homozygous for a targeted allele of Dbp have only a modest circadian phenotype (Lopez-Molina et al., 1997). Homozygotes of both the Per2 LucSV and Per2 Luciferase lines have altered circadian rhythms (Ralph et al., 2021; Yoo et al., 2017; see below). The GFP-expressing Dbp transcript lacks the native 3′ UTR and uses an exogenous polyadenylation sequence, which could affect Dbp gene expression and regulation. Notably, however, our Northern blot analysis suggests little or no alteration in expression level or dynamics of the Dbp reporter transcripts.
Yoo et al. (2017) reported that homozygous Per2 LucSV/LucSV mice (in which a SV40 polyadenylation site is used instead of the endogenous Per2 3′ UTR) have a longer period length of locomotor activity rhythms in DD and explant bioluminescence rhythms ex vivo than the more widely used Per2 Luciferase reporter. The potential impact of a single Per2 LucSV allele (as used in our studies) on period length has not been reported, but this could contribute to the longer period of Per2 LucSV/+ explants, relative to Dbp Luc/+ explants. Interestingly, Ralph et al. (2021) recently reported that the Per2 Luciferase reporter that uses the endogenous Per2 3′UTR (Yoo et al., 2004) also has longer period in DD and other circadian phenotypes. Tosini and colleagues have also recently reported retinal degeneration and alterations in classical photoreception in aged male Per2 Luciferase/Luciferase mice (Goyal et al., 2021).
Shan et al. (2020) recently reported development of a Color-Switch PER2::LUC line which was used to demonstrate the utility of a Cre-dependent reporter approach for interrogating SCN circuitry. The Color-Switch PER2::Luc line has the advantage of reporting on both Cre-positive and Cre-negative cells in different colors. Detection of bioluminescence from the Color-Switch PER2::LUC reporter requires segmentation of the bioluminescence signal between wavelengths. Our “simpler” approach of only inducing a bioluminescence signal in Cre-positive cells of Dbp KI/+ mice enables recording of bioluminescence rhythms without the need for wavelength segmentation. In addition, the Dbp reporter can easily be used in Per2 mutant mice. Like the Color-Switch PER2::LUC line, our Dbp conditional reporter line is useful for ex vivo studies, allowing specific cellular populations to be monitored by crossing to the appropriate Cre-expressing lines.
As with the Color-Switch PER2::LUC line, we also intended to generate a bifunctional reporter. The inability to readily detect a GFP fluorescence rhythm in Dbp KI/+ mouse SCN or liver was unexpected. It is important to emphasize that there was detectable fluorescence above baseline, but rhythmicity was not detected. This could nevertheless be due in part to low signal-to-noise ratio. It is possible that the short half-life of destabilized GFP, combined with the waveform of Dbp gene expression (being less sinusoidal than the rhythms of Per1 and Per2, for example), contributed to a short period of production and rapid degradation of the GFP. Notably, a transgenic mouse in which a similarly destabilized GFP is driven by the Per1 promoter generates nice SCN fluorescence rhythms (Kuhlman et al., 2000). Similarly, destabilized versions of VENUS (a yellow fluorescent protein) and DsRED inserted at the start codon of PER1 and PER2, respectively, in bacterial artificial chromosomes have been useful for monitoring rhythmic gene expression in SCN of transgenic mice (Cheng et al., 2009). Assessing immunoreactive GFP (rather than native fluorescence from GFP) in the Dbp KI/+ or Dbp KI/KI mice may improve signal detection (but at the cost of real-time reporting).
It is possible that a different design of the reporter construct would have led to better success. Addition of a nuclear localization signal (NLS), (as done by Cheng et al., 2009) would reduce the volume in which GFP is distributed, making signal intensity greater (but we note that Kuhlman et al. (2000) did not incorporate an NLS into their reporter sequence). Alternatively, generating nondestabilized GFP as a fusion protein with DBP might have been more successful; in this scenario, the stability of DBP would regulate the stability of GFP. This fusion strategy has been used successfully with fluorescent reporters of PER2 and BMAL1 (Smyllie et al., 2016; Yang et al., 2020). Another potential variation is to use fluorescent proteins other than GFP. Other fluorescent proteins may be brighter and thus more amenable to this type of study.
Our studies reveal subtle differences among the population of oscillators defined by AVP-Cre, NMS-Cre, and the entire SCN cohort. More specifically, AVP cells had a shorter period, reduced RI, and larger within-slice dispersal of peak times than the NMS cell population with which it overlaps. Our results suggest that AVP cells are coordinated less well and are less robust than other populations in the SCN. This suggestion is in contrast to the typical view of AVP cells as high-amplitude “output” neurons that also contribute to determination of period and rhythm amplitude (Herzog et al., 2017; Mieda et al., 2015, 2016). One possible explanation for this is that AVP is dysregulated in the Avp-Cre line (Cheng et al., 2019), which may influence the function of the SCN as a whole in the AVP-IRES-Cre; Dbp KI/+ genotype used here. Using an Avp-IRES-Cre line which does not reduce AVP expression, Shan et al. (2020) reported that AVP-expressing SCN neurons have shorter period bioluminescence rhythms, compared with the non-AVP cells. This contrasts directly with our finding of longer period in AVP cells reporting luciferase from the Dbp locus. The AVP neuronal population is contained entirely within the NMS-expressing population in the SCN. There is no evidence that the Nms-Cre line alters circadian timekeeping on its own (Lee et al., 2015). The Nms-Cre line and the Avp-IRES-Cre line used by Shan et al. (2020) appear to be preferable models to the AVP-IRES-Cre line (JAX 023530) used here. Of note for circadian researchers, a Vip-IRES-Cre line also influences neuropeptide expression and circadian function (Cheng et al., 2019; Joye et al., 2020).
We envision this line will be very useful for monitoring additional neuronal subpopulations in the SCN in WT and mutant animals. Additional technical development may allow in vivo detection of bioluminescence rhythms from neuronal populations in awake behaving mice. Approaches to optimize the signal detected from brain include use of highly efficient and cell- and brain-penetrant substrates (M. S. Evans et al., 2014; Iwano et al., 2018), cranial windows (Miller et al., 2014), and hairless or albino mice (Burgos et al., 2022; Iwano et al., 2018). (Note, the tyrosinase mutation leading to albinism in C57BL/6J mice is linked to Dbp on mouse Chromosome 7; we have nevertheless generated recombinants and produced albino reporters, including the kidney reporter mice in Suppl. Fig. S3). These approaches may allow interrogation of the SCN circuit in vivo, extending the elegant studies being performed with SCN slices ex vivo. Bioluminescence rhythms can also be examined in neuronal populations outside the SCN, by using an appropriate Cre driver and/or viral delivery of Cre recombinase.
Cre-mediated recombination of the Dbp KI allele in liver enabled us to perform continuous, in vivo bioluminescence monitoring of liver in freely moving mice. These studies demonstrate transient misalignment between the liver oscillator and SCN-regulated behavioral rhythms. Our design is complementary to that used by Saini et al. (2013), who continuously monitored reporter gene bioluminescence as hepatic rhythms were shifted by an inverted feeding regimen.
Repeated misalignment among oscillators is thought to contribute to adverse metabolic and health consequences of chronic circadian disruption (for reviews, see J. A. Evans and Davidson, 2013; Roenneberg and Merrow, 2016; Patke et al., 2020; West and Bechtold, 2015). Up until now, technical and practical limitations have restricted our ability to monitor the behavior of circadian rhythms in different peripheral tissues during and following environmental disruption of circadian homeostasis. Our Cre-conditional reporter line and the approaches described recently (Martin-Burgos et al., 2022; Tam et al., 2021), and extended here for longitudinal and tissue-specific assessment of bioluminescence rhythms in vivo will allow characterization of misalignment and recovery after a variety of circadian-disruptive lighting and food availability paradigms. These approaches will allow more extensive examination of the consequences of repeated misalignment of peripheral clocks.
The data in Figure 6 show clear misalignment between the rhythms in locomotor activity and hepatic bioluminescence. Rather remarkably, the average phase of peak bioluminescence did not shift at all for 3-4 days after the shift of the lighting cycle. This is consistent with previous work by others: even with a more robust signal that directly impacts peripheral oscillators (reversal of the time of food availability), shifting of the liver clock occurs slowly (Damiola et al., 2000; Saini et al., 2013). We did not track food intake in this experiment, so do not know the rate at which the food intake pattern was reset following the shift of the lighting cycle. The timing of food intake is typically controlled by the SCN, however, and thus would likely track locomotor activity. The food intake and locomotor activity rhythms shift to the new phase more rapidly than the hepatic oscillator, resulting in misalignment.
Previous studies have shown misalignment between central and peripheral clocks induced by altering the time of food access to daytime, by assessing oscillator phase at various time-points after a phase shift of the lighting cycle, or by exposure to non-24-h light-dark schedules. The vast majority of these studies monitored bioluminescence rhythms ex vivo or assessed transcript levels following tissue collection at various times after a shift (Balsalobre et al., 2000; Damiola et al., 2000; Davidson et al., 2008, 2009; Nakamura et al., 2005; Nicholls et al., 2019; Pezuk et al., 2012; Sellix et al., 2012; Stokkan et al., 2001; Yamanaka et al., 2008). Notably, ex vivo bioluminescence rhythm timing may be affected by prior lighting conditions (Noguchi et al., 2020; Leise et al., 2020; Tahara et al., 2012). Few studies have followed bioluminescence rhythms in vivo over time after a light-induced phase shift or after a food manipulation that phase-shifts peripheral oscillators (but see Saini et al., 2013; van der Vinne et al., 2020). Our current data leverage the ability to noninvasively monitor rhythmicity from a single peripheral oscillator in individual animals over many days to show the time course of internal misalignment and recovery after a phase shift. Other studies with minimally invasive monitoring of bioluminescence rhythms have relied upon viral introduction of the reporter into liver, and thus cannot easily be extended to other tissues (Saini et al., 2013; Sinturel et al., 2021). Notably, the viral reporter appears not strictly limited to liver in this model (see Saini et al., 2013, their Suppl. Fig. S2). Moreover, efficient expression of virally delivered reporter constructs is limited by the promoter size and specificity, so the level and anatomical pattern of expression often do not match that of the gene whose promoter was used. Future studies of additional tissues in Cre-conditional reporter mice will enable elucidation of how other tissues within the hierarchical, multioscillatory circadian system respond to disruptive stimuli. Several studies suggest that organs differ in their response to resetting stimuli. For example, the Dbp mRNA rhythm in liver is more fully reset than the rhythm in heart and kidneys 3 days after restricting food availability to daytime (Damiola et al., 2000), and several studies indicate the SCN (and the locomotor rhythms it regulates) resets more rapidly than peripheral tissues (Davidson et al., 2008, 2009; Damiola et al., 2000; Hamada et al., 2016; Saini et al., 2013; Sellix et al., 2012; van der Vinne et al., 2020; Yamanaka et al., 2008; Yamazaki et al., 2000; see Nicholls et al., 2019 for review).
A recent study used a feeding device similar to the one used here (Acosta-Rodriguez et al., 2017) to recapitulate “naturalistic” food intake patterns in mice with restricted food access (Xie et al., 2020). In this study, the food restriction was not the severe “all or none” patterns typically used in studies with time-restricted access to food. The authors found that peripheral oscillators of Per2 Luciferase mice were not effectively entrained by restricted feeding using the imposed “natural” feeding patterns (Xie et al., 2020). Similarly, our study (shown in Figure 7) revealed that daytime restricted food access produced a smaller and more variable phase shift of the hepatic circadian clock (as indicated by the initial time of peak of Dbp-driven bioluminescence) than expected based on published results using presence/absence food availability cycles (Damiola et al., 2000; Hara et al., 2001; Saini et al., 2013; Stokkan et al., 2001).
Both day-to-day variation in phase of peak bioluminescence within animals as well as variation in peak phase between animals is larger in the day-fed mice than in the night-fed and ad lib groups. These latter two groups did not need to change the time of food intake greatly, while the daytime-fed group was eating at an abnormal phase. Our imposing temporal restriction on feeding for only 10 days before release to DD and ad lib feeding may not have been sufficient to synchronize liver clocks to a new phase, as suggested by the partial reversal of the phase of hepatic bioluminescence. In addition, food intake patterns derived from presence/absence cycles of food appear much more effective at synchronizing the liver than more naturalistic food intake patterns (our data and Xie et al., 2020 compared with, for example, Saini et al., 2013; Damiola et al., 2000). The night-fed and ad lib groups have relatively more intense, consolidated feeding in the early part of the night, which may provide a stronger stimulus to peripheral oscillators, including liver. Food access for 12 h during the daytime may be less concentrated and more variable in time, providing a less effective synchronizing cue to peripheral oscillators. This may lead to higher levels of within-organ desynchrony among cells and thus lower amplitude rhythmicity, secondarily leading to greater variability in determining the time of peak bioluminescence on subsequent days. We also cannot rule out the possibility that the time of food intake differed between individuals and between the groups, even during ad lib feeding, and this could influence hepatic rhythms. Future studies using a shorter duration of food access per day and monitoring bioluminescence rhythms both during the acclimation to daytime feeding as well as during release to ad lib conditions, coupled with monitoring food intake patterns throughout the study, should allow more dynamic assessment of the entrainment and subsequent free-running rhythms of peripheral oscillators in vivo. In addition, use of a variety of different Cre drivers will allow assessment of whether different peripheral organs respond similarly to food restriction paradigms. In addition, tissue-specific reporter models will be very useful in assessing how more naturalistic food ingestion paradigms influence peripheral circadian clocks in several tissues.
In summary, we have demonstrated the utility of a new, Cre-conditional reporter mouse that enables tissue-specific monitoring of circadian molecular rhythms in vivo and ex vivo. This reporter mouse provides a major advance in our capabilities for monitoring rhythms in a variety of tissues under normal and disruptive conditions, which is a key step in the identification of mechanisms underlying the adverse consequences of circadian disruption inherent to life in modern 24/7 societies.
Supplemental Material
sj-pdf-1-jbr-10.1177_07487304211069452 – Supplemental material for Cell-Type-Specific Circadian Bioluminescence Rhythms in Dbp Reporter Mice
Supplemental material, sj-pdf-1-jbr-10.1177_07487304211069452 for Cell-Type-Specific Circadian Bioluminescence Rhythms in Dbp Reporter Mice by Ciearra B. Smith, Vincent van der Vinne, Eleanor McCartney, Adam C. Stowie, Tanya L. Leise, Blanca Martin-Burgos, Penny C. Molyneux, Lauren A. Garbutt, Michael H. Brodsky, Alec J. Davidson, Mary E. Harrington, Robert Dallmann and David R. Weaver in Journal of Biological Rhythms
Footnotes
Acknowledgements
We thank Christopher Lambert and Jamie Black for technical assistance, and Steven A. Brown (University of Zurich) for discussions during the development of this project. UMass Chan Medical School core facilities (Mutagenesis Core, Mouse Modeling Core, and Small Animal Imaging Core) are gratefully acknowledged. Research reported in this publication was supported by the National Institute for Neurological Diseases and Stroke and the National Institute of General Medical Sciences of the National Institutes of Health (NIH) under award numbers R21NS103180 (D.R.W.), SC1GM112567 (A.J.D.), and NIGMS R15GM126545 (M.E.H.), the Hartmann Müller Stiftung (R.D.), MRC MC_PC_15070 (R.D.), and BSN (R.D. and L.A.G.). C.B.S. was a participant in the UMass Chan Medical School Initiative for Maximizing Student Development, supported by NIH grant R25GM113686. The funders had no role in study design, data collection and analysis, decision to publish, or preparation of the article. The content is solely the responsibility of the authors and does not necessarily represent the official views of the NIH or the other funding agencies.
Authors’ Note
Present address for C.B. Smith: American Society for Biochemistry and Molecular Biology, Rockville, MD. Present address for B. Martin-Burgos: University of California San Diego, La Jolla, CA.
Author Contributions
R.D and D.R.W. conceived the project. C.B.S., V.v.d.V., E.M., M.H.B., A.J.D., M.E.H., R.D., and D.R.W. designed research. C.B.S., V.v.d.V., E.M., A.C.S., B.M.-B., P.C.M., L.A.G., R.D., and D.R.W. performed research. C.B.S., V.v.d.V., E.M., T.L.L., B.M.-B., M.E.H., R.D., and D.R.W. analyzed data. C.B.S., V.v.d.V., and D.R.W. wrote the article. All authors have approved this version of the article.
Conflict of Interest Statement
The author(s) have no potential conflicts of interest with respect to the research, authorship, and/or publication of this article.
Editorial Note
Dr. William J. Schwartz, previous Editor of the Journal of Biological Rhythms graciously agreed to handle the editorial process surrounding review of this article. Neither the current Editor of the Journal (M.E.H.) or the Deputy Editor (D.R.W.) had any role in the review process and will remain blind to the reviewers’ identities.
ORCID iDs
Note
Supplementary material is available for this article online.
References
Supplementary Material
Please find the following supplemental material available below.
For Open Access articles published under a Creative Commons License, all supplemental material carries the same license as the article it is associated with.
For non-Open Access articles published, all supplemental material carries a non-exclusive license, and permission requests for re-use of supplemental material or any part of supplemental material shall be sent directly to the copyright owner as specified in the copyright notice associated with the article.