
Abstract
In adipose tissue, the expression of hundreds of genes exhibits circadian oscillation, which may or may not be affected by circulating melatonin levels. Using control and pinealectomized rats, we investigated the daily expression profile of Actb, Hprt-1, B2m, and Rpl37a, genes that are commonly used as reference genes for reverse transcription quantitative polymerase chain reaction (RT-qPCR), in epididymal (EP), retroperitoneal (RP), and subcutaneous (SC) adipose tissues. In control rats, Actb expression presented a daily oscillation in all adipose tissues investigated, Hprt-1 showed 24-h fluctuations in only RP and SC depots, B2m was stable over 24 h for EP and RP but oscillated over 24 h in SC adipose tissue, and Rpl37a presented a daily oscillation in only RP fat. In the absence of melatonin, the rhythmicity of Actb in all adipose depots was abolished, the daily rhythmicity of Hprt-1 and B2m was disrupted in SC fat, the peak expression of Rpl37a and Hprt-1 was delayed, and the amplitude of Rpl37a was reduced in RP adipose tissue. Collectively, our results demonstrate that the expression of putative reference genes displays a daily rhythm influenced by melatonin levels in a manner specific to the adipose depot. Thus, the proper standardization and daily profile expression of reference genes should be performed carefully in temporal studies using RT-qPCR analysis.
Keywords
Reverse transcription quantitative polymerase chain reaction (RT-qPCR) is widely used to quantify changes in transcript levels based on the activity of reverse transcriptase and polymerase enzymes (Kuang et al., 2018). Despite its practicality, there are several concerns regarding the poor standardization of this method (Huggett et al., 2005; Dussault and Pouliot, 2006), resulting in a well-documented, substantial number of publications with inadequate and conflicting results (Bustin et al., 2009).
The normalization of data obtained from target gene expression with the results obtained from the expression of reference genes, also called housekeeping or internal control genes, is the most common approach in RT-qPCR studies. Conceptually, a reference gene is a gene that is constitutively expressed in all nucleated cell types belonging to the target tissue that exerts function in the basal metabolism or survival of the cell (Durrenberger et al., 2012) and exhibits a constant and stable expression in each sample tested, regardless of the experimental conditions (Kozera and Rapacz, 2013). In addition, the transcript levels of the reference gene can vary according to tissue (Barber et al., 2005; Gong et al., 2016), treatment (Tanic et al., 2007; Coelho et al., 2015), sex (Verma and Shapiro, 2006), time of day (Kamphuis et al., 2005; Cleal et al., 2014), and other factors. Moreover, different territories of the same tissue or distinct experimental protocols may require different reference genes, as observed for adipose (Zhang et al., 2016; Almeida-Oliveira et al., 2017) and cerebral tissues (Tanic et al., 2007). In this sense, a previous study showed that the selection of inadequate reference genes for RT-qPCR normalization of Leptin and Ucp-1 expression in distinct adipose tissues of obese rats led to contrasting data (Zhang et al., 2016). Thus, the choice of an unsuitable reference gene directly affects the final results, leading to highly discrepant and unreliable data (Ferguson et al., 2010; Kosir et al., 2010; Cai et al., 2019; White et al., 2020).
Software such as Genorm (Vandesompele et al., 2002) ranks reference gene candidates based on the value of gene expression stability (M), which is calculated as the average pairwise variation of a particular gene, with all other control genes. For this analysis, the use of the geometric mean of at least 3 reference genes for normalization is proposed. Although this software indicates the most stable genes among the candidates, this does not necessarily ensure that their geometric mean cannot vary, especially when considering temporal studies, which implies the need to always certify their stability. However, studies rarely perform this type of statistical analysis using one-way analysis of variance (Garaulet et al., 2011).
In addition, about 43% of protein-coding genes present a circadian pattern in transcription in an organ-specific manner (Zhang et al., 2014b). To identify biological rhythms, which, by definition, are events that recur within a given period, analyzing at least 2 complete cycles of determined data is recommended to observe both the pattern of peak and trough (Hughes et al., 2017). In this sense, in studies seeking to evaluate the temporal variation in target gene expression, reference gene candidates should meet previous requirements as housekeeping genes and moreover be stable over 24 h or longer. Unfortunately, only few studies have investigated the temporal profile of reference gene expression in the chronobiology field (Cleal et al., 2014; Figueredo et al., 2018), which could lead to inconsistent data between studies and, consequently, to the wrong interpretation of the results.
In adipose tissue in particular, the gene expression and activity of several key enzymes involved in lipid metabolism (Shostak et al., 2013; de Farias Tda et al., 2015), as well as adipokines secreted by the adipose tissue (Garaulet et al., 2011) display a circadian oscillation partially regulated by melatonin (Alonso-Vale et al., 2008). Previous studies have shown that the absence of melatonin in rats alters the metabolic pathways of lipolysis, lipogenesis (Borges-Silva et al., 2005; de Farias Tda et al., 2015), and glucose metabolism in adipocytes (Lima et al., 1998), as well as the daily hormonal pattern, and they show increased glucocorticoid levels and less responsiveness to insulin (Alonso-Vale et al., 2004).
Classically, the effects generated by melatonin may result from actions mediated and/or nonmediated by nuclear, cytosolic, and membrane receptors (Amaral and Cipolla-Neto, 2018). The direct actions of melatonin on G protein–coupled receptors were described in rat and human adipocytes (Brydon et al., 2001; Zalatan et al., 2001). Moreover, metabolic changes in adipose tissue of pinealectomized animals are partly due to a reduction in GLUT4 mRNA and protein content (Zanquetta et al., 2003).
Considering the important role of melatonin in adipose tissue physiology and the importance of validating the choice of the best reference genes for each experimental protocol, including all variable factors such as treatment, age, and time of day, the present study aimed to investigate the daily profile expression of beta-actin (Actb), hypoxanthine phosphoribosyltransferase (Hprt-1), beta-2-microglobulin (B2m), and ribosomal protein L37a (Rpl37a), genes commonly used as reference genes, in epididymal (EP), retroperitoneal (RP), and subcutaneous (SC) adipose tissues of rats and the influence of melatonin levels on their temporal patterns.
Materials and Methods
Animals
Eighty male Wistar rats were obtained from the Central Animal Breeding House of the Institute of Biomedical Sciences, University of Sao Paulo (Sao Paulo, Brazil). The animals were maintained on a 12-h light/12-h dark cycle (light phase: lights-on at 0600 h = zeitgeber time ZT0; dark phase: red filter Kodak 1A, 0.5-1 lux) in a temperature-controlled room (25 ± 2 °C) and had access to food (Nuvital S/A, Colombo, PR) and water ad libitum. All experimental procedures were conducted according to the standards established by the National Council for Control of Animals and were approved by the local Committee for Animal Experimentation (03/10/2011, No. 129, book 2). The animals used in this research were the same as used in the study by de Farias Tda et al. (2015).
Experimental Design
At 10 weeks of age, the animals were anesthetized with an intraperitoneal injection of Xilazin 1.7 mL (Anazedan Vetbrands, Laranjal Paulista, SP, Brazil) and ketamine 5.0 mL (Dopalen Vetbrands, Laranjal Paulista, SP, Brazil; 0.15 mL/100 g body weight) and divided into pinealectomized (PINX) and sham-operated (CONTROL) groups. Pinealectomy was performed as previously described (Hoffman and Reiter, 1965). The pineal gland was carefully removed from PINX animals while it was kept intact in the CONTROL group. The skull was closed by returning the disk-shaped bone, and the scalp was sutured with cotton thread.
Four weeks after surgery (14 weeks old), the animals were euthanized by decapitation under sodium thiopental anesthesia (20 mg/kg body weight) every 4 h over a 24-h period, and the white adipose tissue from the EP, RP, and SC tissues was dissected and stored at −80 °C. The effectiveness of the treatment was confirmed by the serum levels of melatonin (de Farias Tda et al., 2015). Appropriate measures were taken to reduce the pain and discomfort of the experimental animals.
Total RNA Extraction
Total RNA was extracted from 100 mg of EP, RP, and SC white adipose tissues using the TRIzol Plus RNA Purification Kit, according to the manufacturer’s instructions. The samples were quantified by spectrophotometer reading (Epoch Microplate Spectrophotometer, Biotek, Winooski, VT) coupled to a Take3 Multi-Volume Plate (BioTek) and using Gen 5.0 software. RNA purity was estimated by a 260 nm/280 nm ratio (1.6-2.0).
DNAse Treatment and RT-qPCR Assay
Two micrograms of total RNA from each sample was treated with DNase I Amplification Grade (1 U/µL; Invitrogen, ThermoFisher Scientific, Waltham, MA) in a mix containing 1.68 µL of MgCl2 and RNAse-free water in a final volume of 20 µL. The samples were incubated at 37 °C for 30 min followed by 75 °C for 10 min, according to the DNase protocol.
Afterward, the samples were submitted to RT reaction by the addition of 0.5 µL of the reverse transcriptase enzyme (Superscript III Reverse Transcriptase; Invitrogen), 10 µL of RT buffer (5X), 0.1 mM DTT, 3.9 µg of Random Primer, 3.2 µL of RNAse-free water, and 2.5 mM of dNTP in a final volume of 50 µL. The samples were incubated at 25 °C for 10 min, 55 °C for 50 min, and 70 °C for 15 min. The reverse transcription product (about 40 ng/µL) was stored at −20 °C.
RT-qPCR was performed using 1 µL of reverse transcription product, 0.5 µL of hydrolysis probes type TaqMan 20X specific for each gene (Applied Biosystems, Foster City, CA; Supplemental Table S1), 5 µL of Master Mix 2X (Applied Biosystems, TaqMan), and 3.5 µL of RNAse-free water. The RT-qPCR reactions were performed using the StepOnePlus Real Time PCR System (Applied Biosystems) under the following conditions: 50 °C for 2 min, 95 °C for 10 min, 95 °C for 15 s, and 60 °C for 1 min.
Validation of Assay Efficiency
The reverse transcription products were diluted in RNAse-free water to assess and guarantee that the RT-qPCR would be performed with the greatest efficiency and slope values for each gene (Dussault and Pouliot, 2006). The serial dilutions tested were 1.0, 0.1, 0.01, and 0.001 for all genes, except for Hrpt-1 in EP adipose tissue, in which the dilutions were 0.1, 0.05, 0.01, and 0.001, spanning at least 2 log orders (Dussault and Pouliot, 2006; Nolan et al., 2006). The reactions were carried out in duplicate in each case. The linear regression curve was obtained by the mean of the threshold cycle (CT) values for each serial dilution plotted as a dependent factor (y-axis) of the logarithm of the reverse transcription product dilution (independent factor) on the x-axis. The efficiency (E) was calculated using the slope values obtained in the linear regression for each gene/depot using the equation below, and the optimal values for the slope and efficiency were −3.322 and 1, respectively (Dussault and Pouliot, 2006):
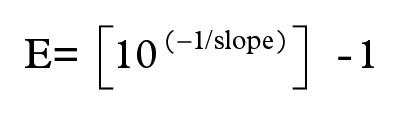
The range of linear dynamics was determined by the standard curve, and a correlation coefficient (R2) ≥0.98 was considered satisfactory, as previously reported (Nolan et al., 2006).
Analysis of the Relative Expression of Constitutive Genes
The CT values of Actb, Hprt-1, Rpl37a, and B2m were obtained using RT-qPCR of EP, RP, and SC adipose deposit samples of the CONTROL and PINX animals. Afterward, the quantification of the relative expression of the genes was calculated using the 2∆CT method, considering the ZT0 of CONTROL group as a reference (ZT0 = 1) to reduce the decimal places on the graphs (Livak and Schmittgen, 2001).
Statistical Analysis
Parameters were submitted to the D’Agostino-Pearson omnibus test for normality and the Bartlett test for homoscedasticity. One-way analysis of variance (ANOVA) or Kruskal-Wallis test was performed to evaluate the influence of time in each group according to the normality distribution results. Two-way ANOVA followed by Bonferroni’s post hoc analysis was employed to verify the influence of time, treatment, and interactions and for pairwise comparisons using GraphPad Prism v7 (GraphPad Software, Inc., San Diego, CA).
The presence of a daily 24-h rhythm was assessed by a theoretical cosine curve fit (cosinor method) using the least-squares calculation to each temporal series that presented statistical differences in ANOVA tests (Nelson et al., 1979). Mesor, amplitude, and acrophase were calculated for each gene/group (Cornelissen et al., 1980; Cornelissen, 2014) and compared by Student t test. Results and periodic fit were considered significant when p < 0.05 and were expressed as means ± SEM.
Results
Treatment Effectiveness
The treatment effectiveness was previously validated by measuring the serum melatonin concentration of a pool of CONTROL and PINX samples obtained during the light and dark phases (de Farias Tda et al., 2015). The serum levels of melatonin were detectable only in the samples collected from CONTROL animals during the dark phase, confirming that the pinealectomy was effective.
Optimization and Dilution Selection for Putative Reference Genes
The slope, efficiency, and linear dynamics range (R2) values obtained for each gene/adipose depot are shown in Table 1. The efficiency curves for Actb (A), Hprt-1 (B), B2m (C), and Rpl37a (D) of EP, RP, and SC adipose depots are presented as supplementary material (Suppl. Figs. S1, S2, and S3, respectively). According to the efficiency results (Table 1), the best dilution was 0.1 for all genes, except for Rpl37a in RP fat, which was 1.0 (concentrated samples).
Slope values, efficiencies, correlation coefficients (R2), and dilutions used for each gene and fat deposit evaluated.
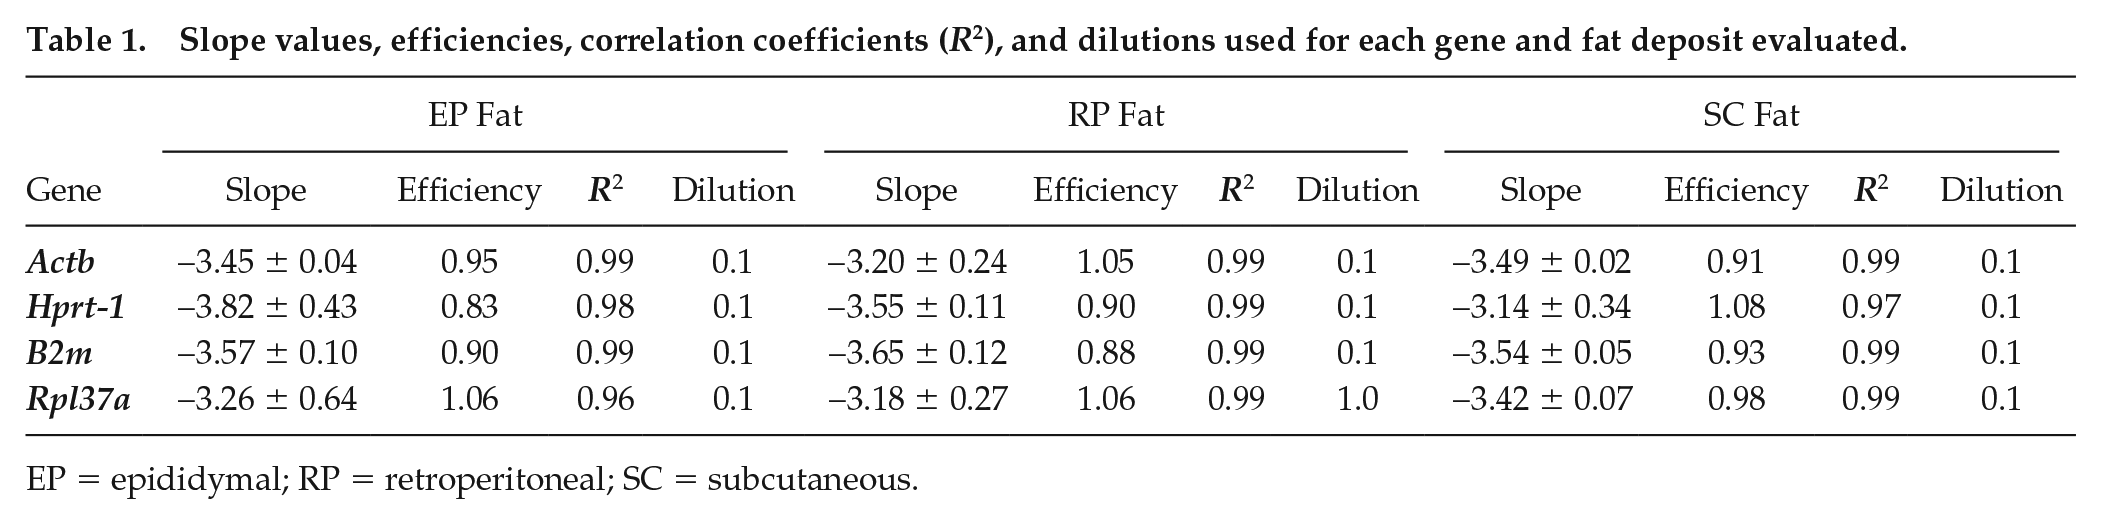
EP = epididymal; RP = retroperitoneal; SC = subcutaneous.
Expression of Putative Reference Genes Presents a Daily and Specific-depot Variation in Control Animals
In the EP adipose tissue of CONTROL rats, the expression of Actb, Hprt-1, and B2m (Fig. 1A-C, respectively) showed a significant variation over 24 h (Table 2); however, a daily rhythm pattern was observed only for the expression of Actb (Table 2; Fig. 1Aii), with an acrophase at about ZT4. The Actb values of mesor, amplitude, and acrophase are described in Table 2. The Rpl37a expression in the EP adipose tissue of CONTROL rats did not show significant oscillation over 24 h (Fig. 1D).
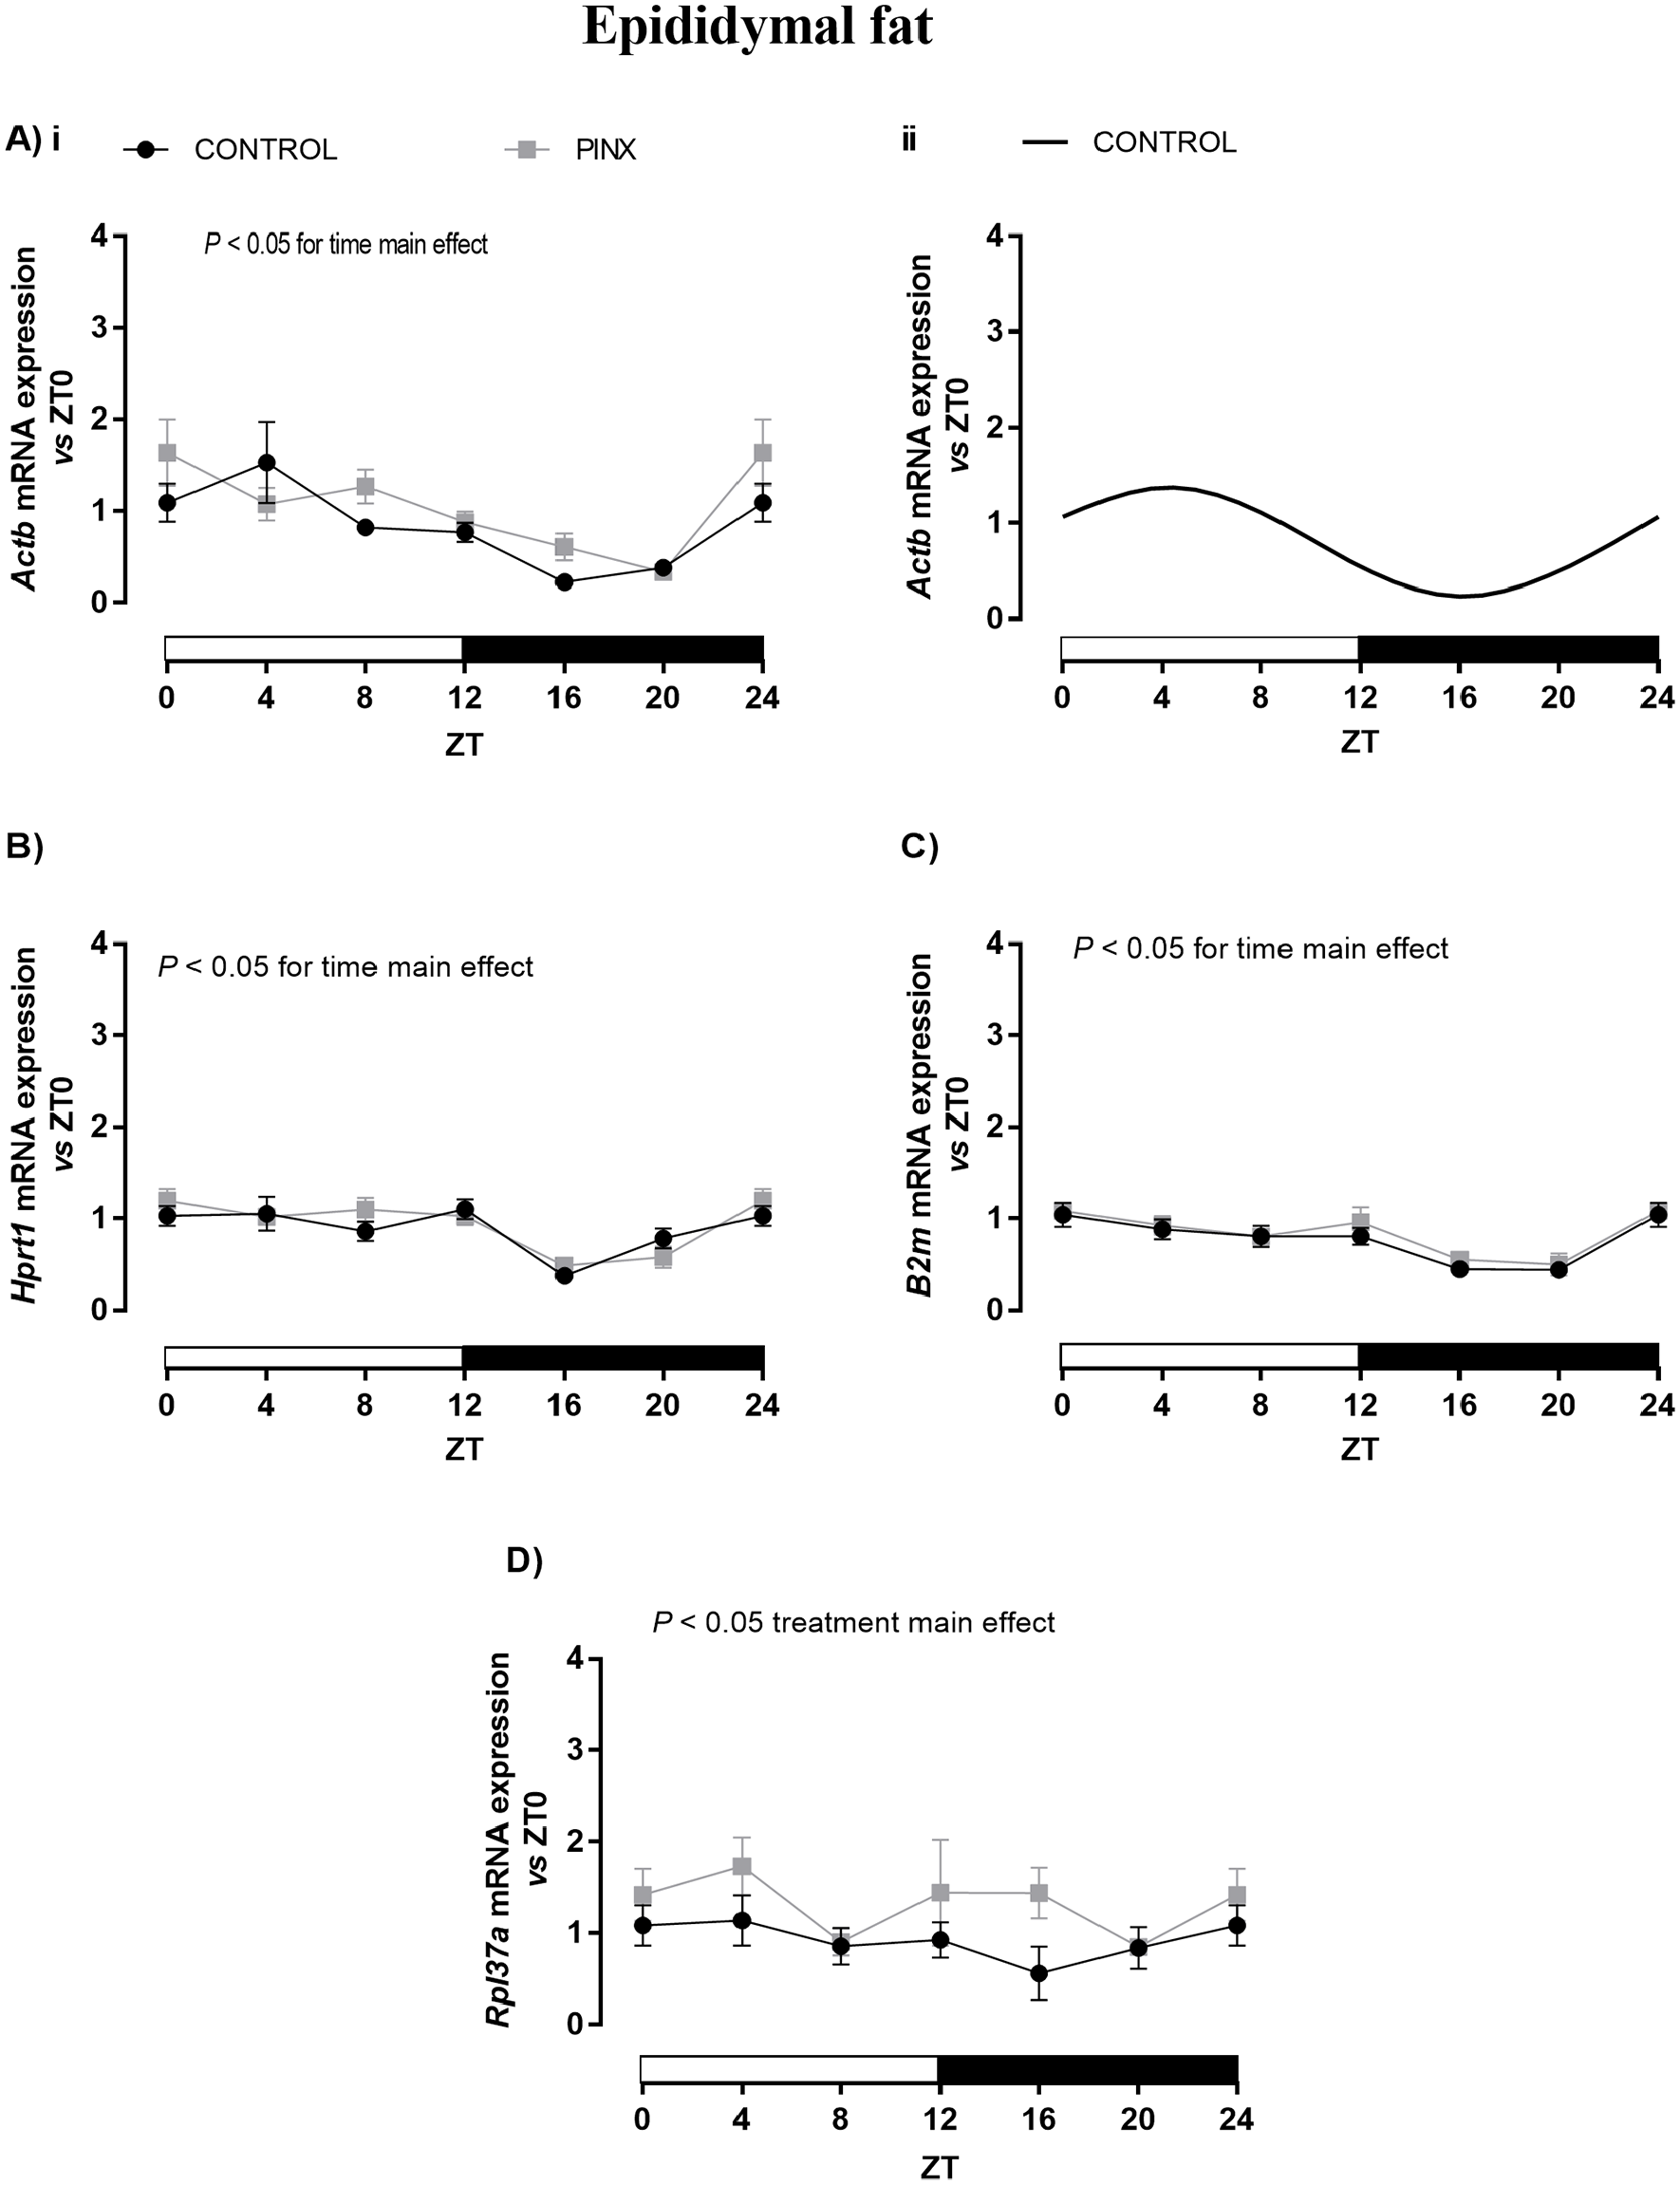
Daily profile of Actb (A), Hprt-1 (B), B2m (C), and Rpl37a (D) expression in the epididymal (EP) adipose tissue of sham-operated (CONTROL: black lines) and pinealectomized (PINX: gray line) rats. The results were evaluated versus ZT0 into each group by reverse transcription quantitative polymerase chain reaction and presented as means ± SEM. (Ai; B-D) Two-way analysis of variance, p < 0.05 for time or treatment (PINX) main effects. No statistical differences were observed for pairwise comparisons versus respective ZTs using Bonferroni’s post hoc test. (Aii) Cosinor rhythmic analysis of Actb in CONTROL (black line). Hprt-1, B2m, and Rpl37a presented no circadian rhythmicity for CONTROL and PINX animals. The ZT0 and ZT24 points are double-plotted and represent the same samples. n = 6/ZT/group, except for ZT12 and ZT16 of Rpl37a and ZT16 of Hprt-1, in which n = 5. ZT = zeitgeber time.
One-way ANOVA and cosinor analysis of CONTROL and pinealectomized (PINX) animals in the epididymal fat. a
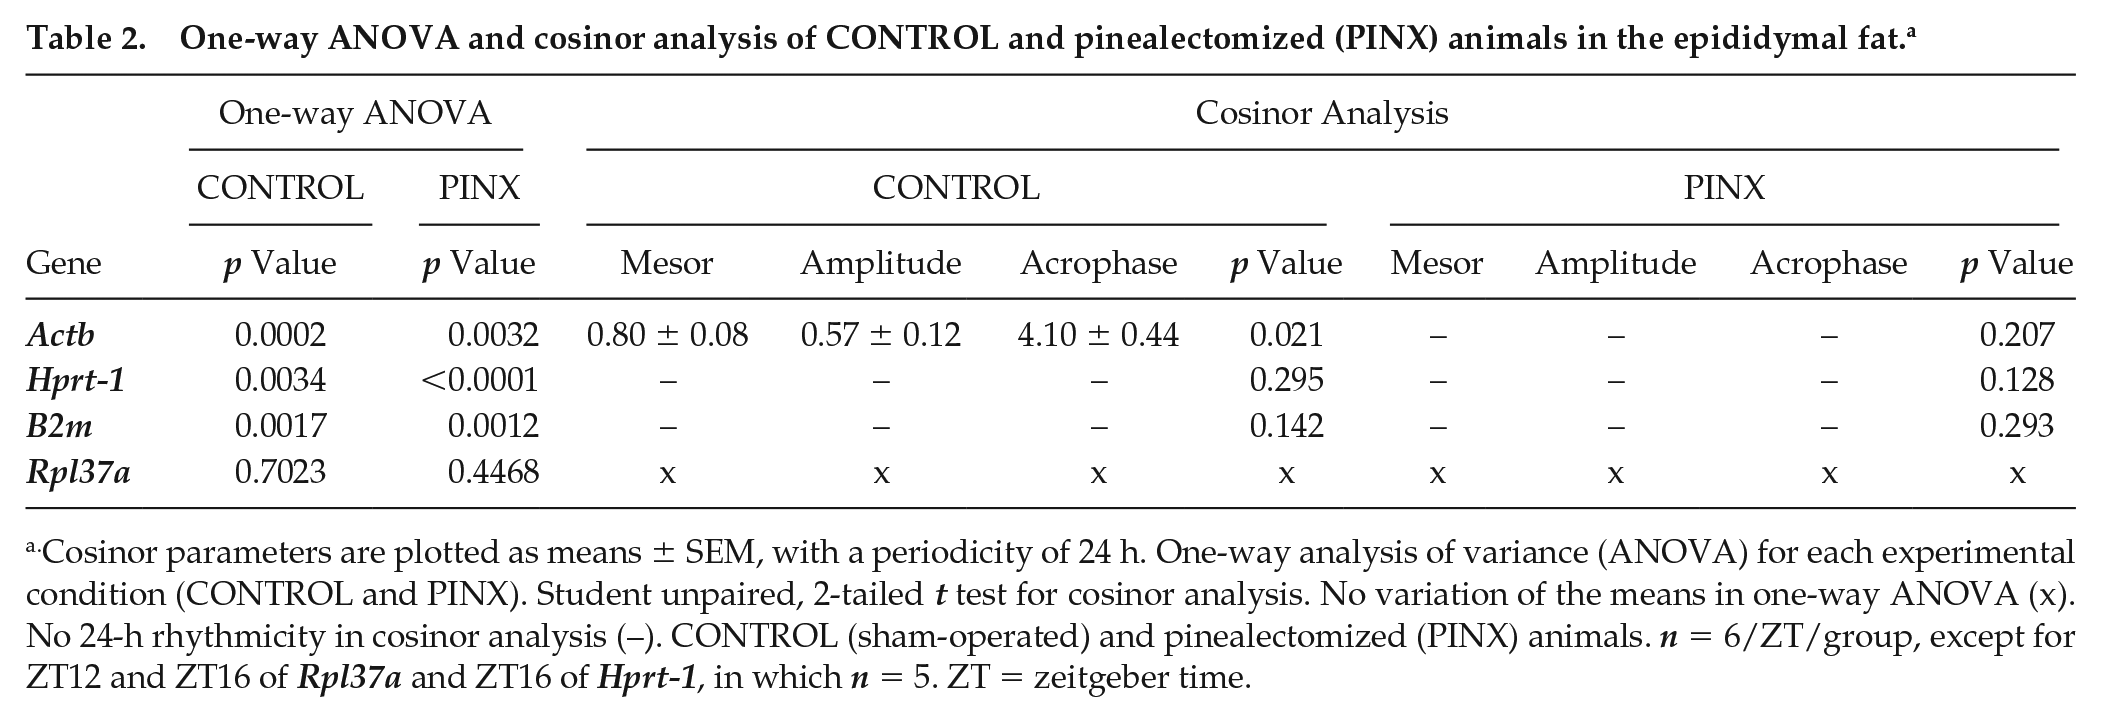
Cosinor parameters are plotted as means ± SEM, with a periodicity of 24 h. One-way analysis of variance (ANOVA) for each experimental condition (CONTROL and PINX). Student unpaired, 2-tailed t test for cosinor analysis. No variation of the means in one-way ANOVA (x). No 24-h rhythmicity in cosinor analysis (–). CONTROL (sham-operated) and pinealectomized (PINX) animals. n = 6/ZT/group, except for ZT12 and ZT16 of Rpl37a and ZT16 of Hprt-1, in which n = 5. ZT = zeitgeber time.
In the RP adipose tissue of CONTROL animals, the expression of Actb (Fig. 2A), Hprt-1 (Fig. 2B), and Rpl37a (Fig. 2D) was markedly altered over the 24-h period, whereas no alteration was observed for B2m mRNA content (Fig. 2C; Table 3). The Actb, Hprt-1, and Rpl37a expression in the RP tissue of CONTROL rats showed a daily rhythm pattern (black lines in Fig. 2Aii, Bii, and Dii, respectively), and the acrophase was observed between ZT16 and 17 for these genes (Table 3).
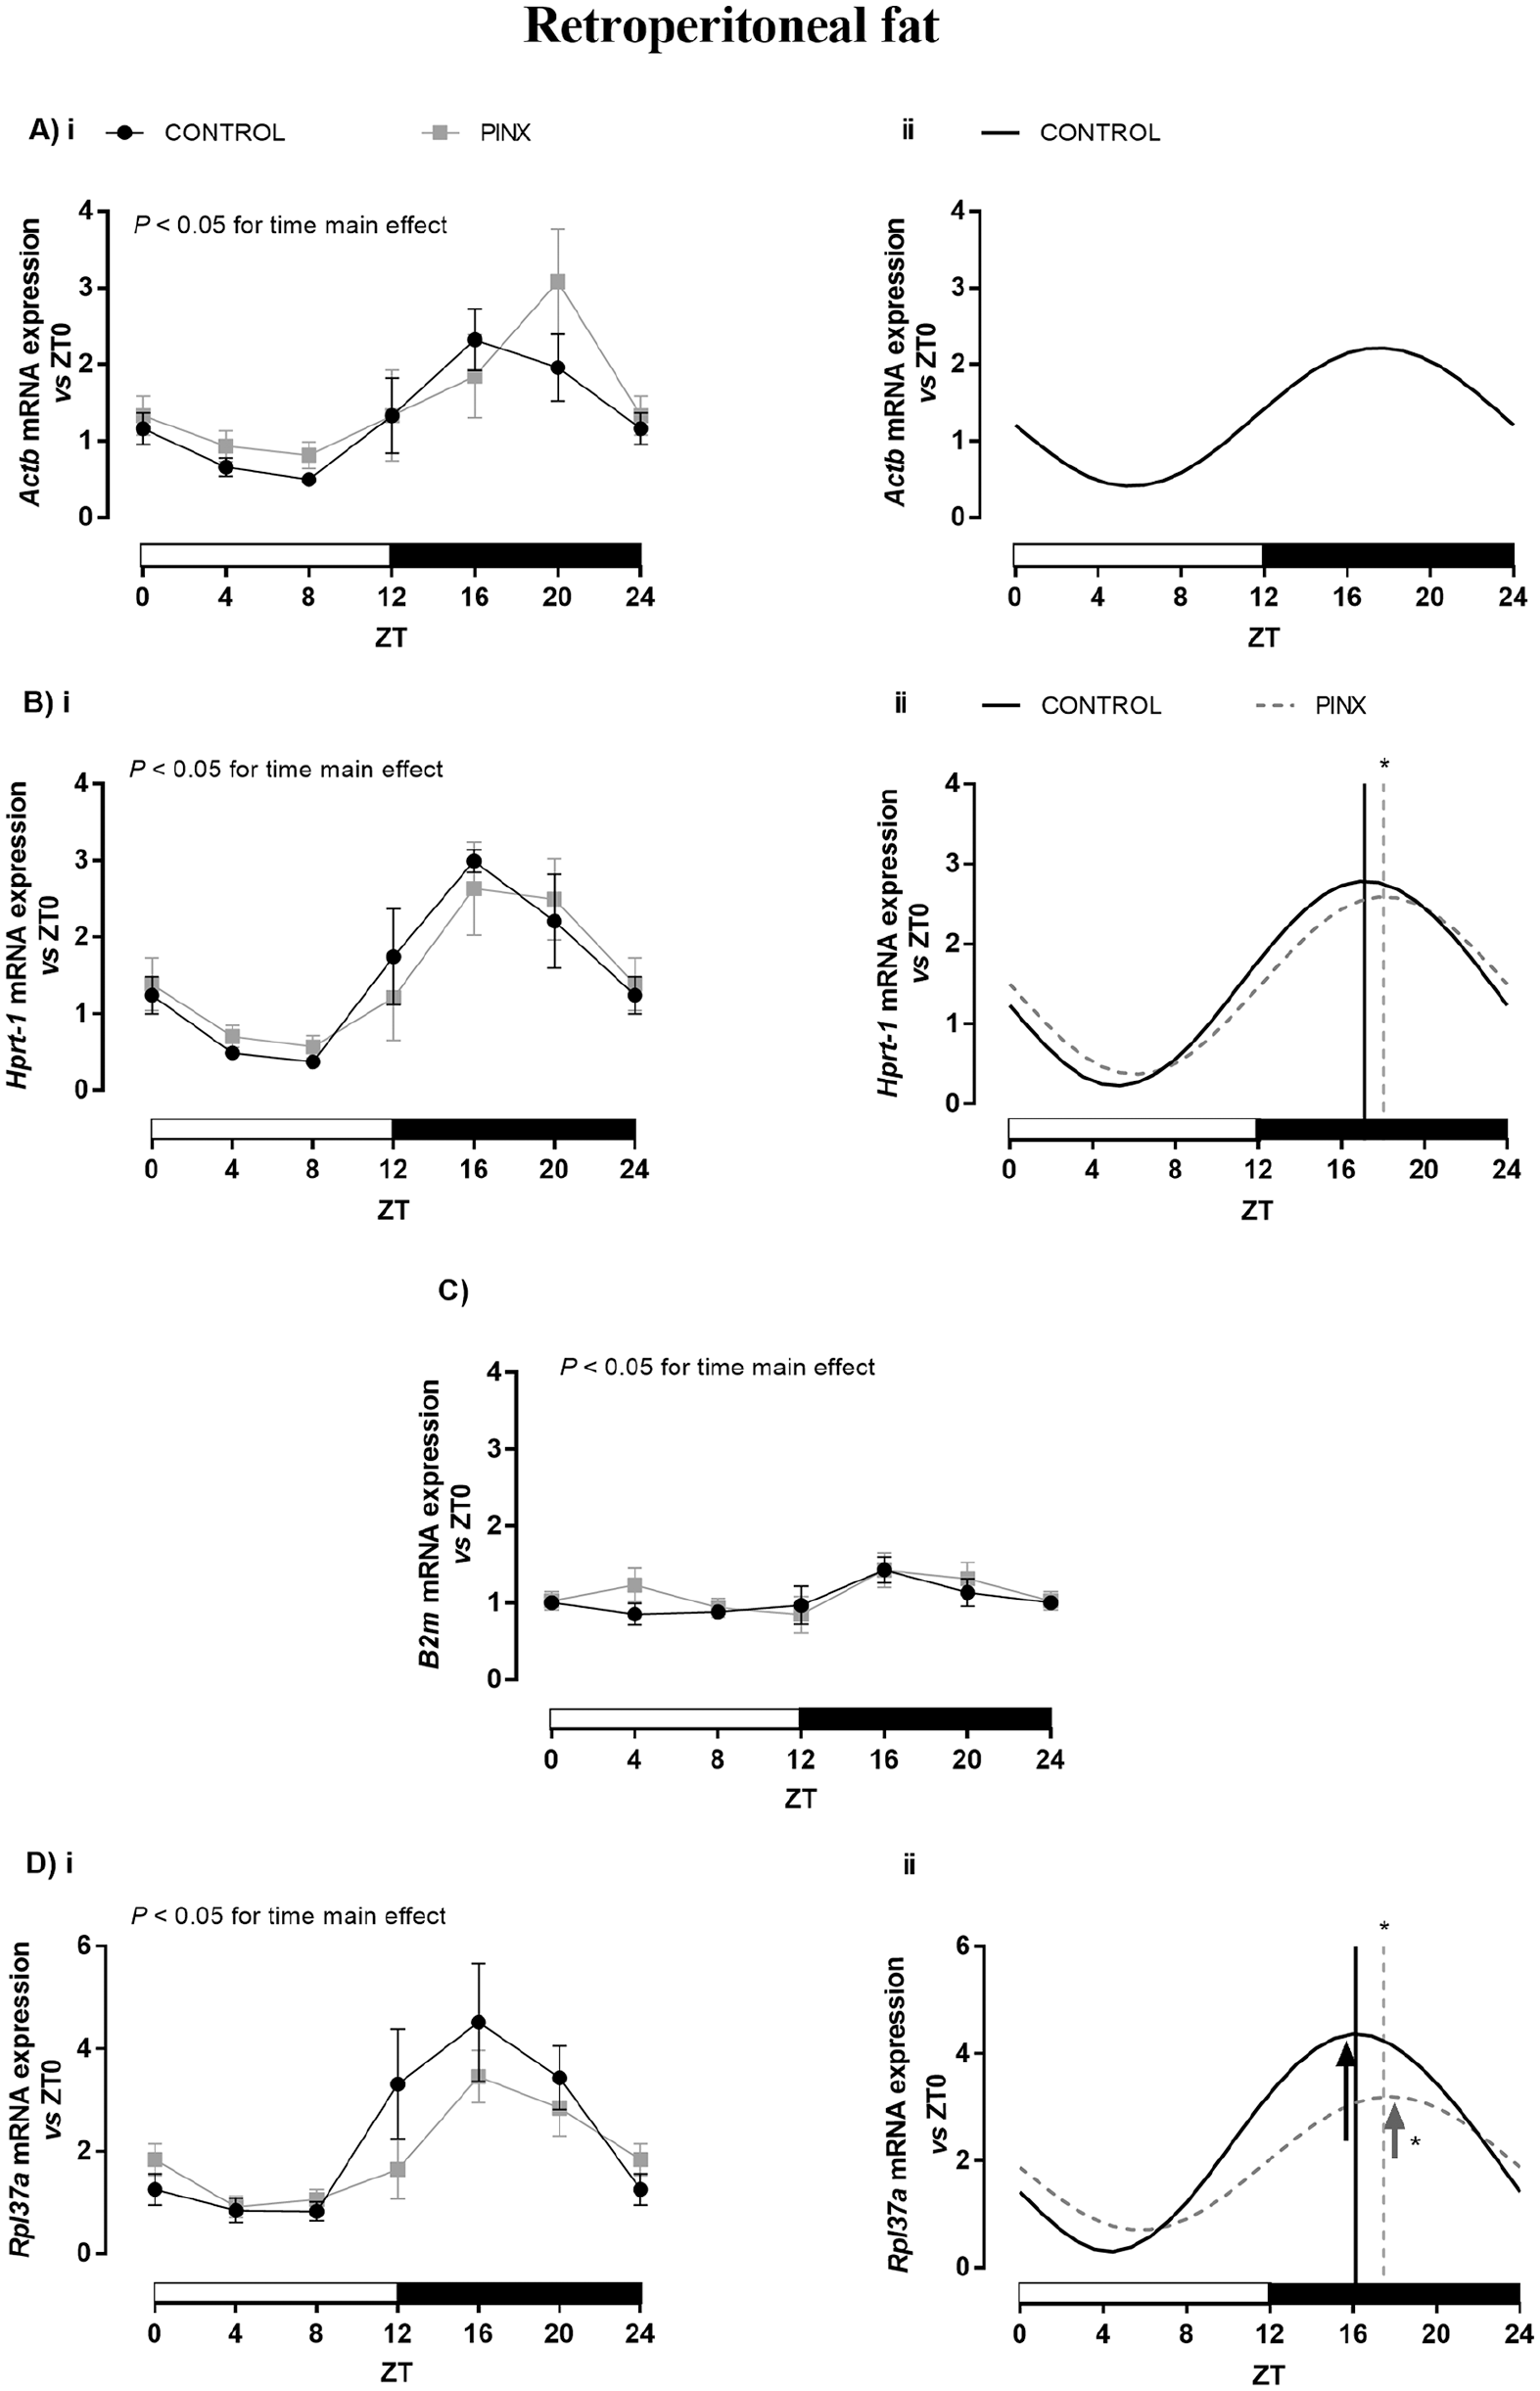
Daily profile of Actb (A), Hprt-1 (B), B2m (C), and Rpl37a (D) expression in the retroperitoneal (RP) adipose tissue of sham-operated (CONTROL: black lines) and pinealectomized (PINX: gray line) rats. The results were evaluated versus ZT0 into each group by reverse transcription quantitative polymerase chain reaction and presented as means ± SEM. (Ai, Bi, C, and Di) Two-way analysis of variance, p < 0.05 for the main effect of time. No statistical differences were observed for pairwise comparisons versus respective ZTs using Bonferroni’s post hoc test. (Aii, Bii, and Dii) Cosinor rhythmic analysis of CONTROL (black line) and PINX (gray dashed line) of Actb, Hprt-1, and Rpl37a, respectively. Differences in amplitude (arrows) and acrophase (vertical line) were analyzed using Student t test, *p < 0.05 versus CONTROL. B2m (CONTROL and PINX) and Actb (PINX) presented no circadian rhythmicity. The ZT0 and ZT24 points are double plotted and represent the same samples. n = 7/ZT/group, except for ZT12 and ZT20, in which n = 6. ZT = zeitgeber time.
One-way ANOVA and cosinor analysis of CONTROL and pinealectomized (PINX) animals in retroperitoneal fat. a
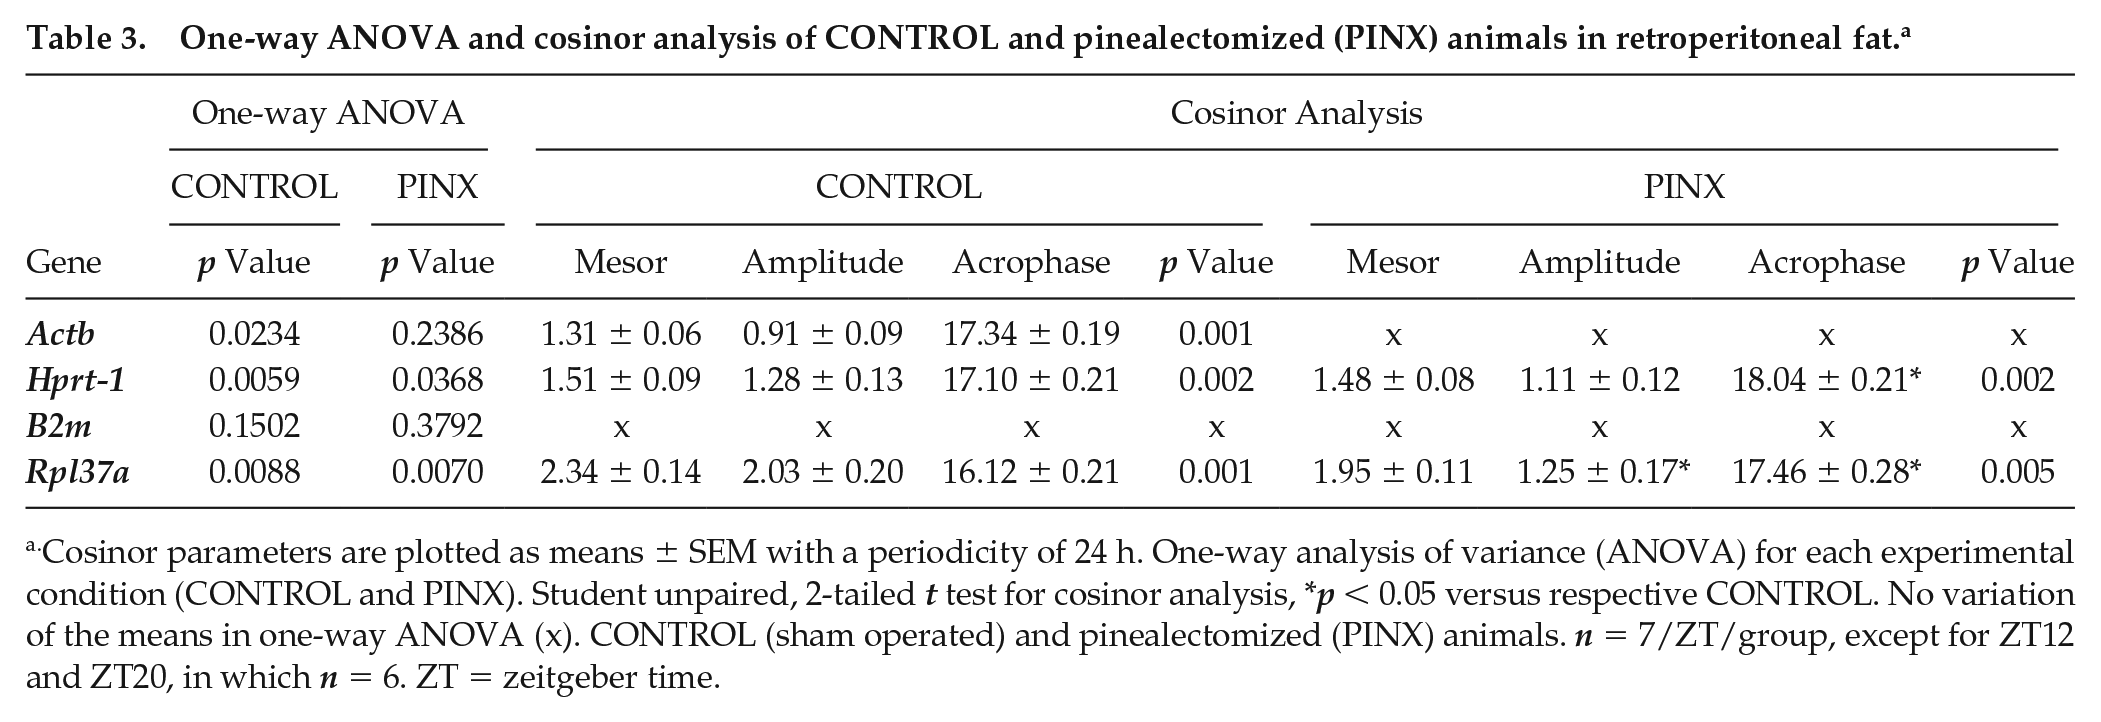
Cosinor parameters are plotted as means ± SEM with a periodicity of 24 h. One-way analysis of variance (ANOVA) for each experimental condition (CONTROL and PINX). Student unpaired, 2-tailed t test for cosinor analysis, *p < 0.05 versus respective CONTROL. No variation of the means in one-way ANOVA (x). CONTROL (sham operated) and pinealectomized (PINX) animals. n = 7/ZT/group, except for ZT12 and ZT20, in which n = 6. ZT = zeitgeber time.
The mRNA content of all genes evaluated in the SC adipose tissue showed a fluctuation over the 24-h period in CONTROL animals, whereas a daily rhythm was observed for Actb, Hprt-1, and B2m expression (Table 4; black lines in Fig. 3Aii, Bii, and Cii, respectively). Their acrophases were observed during the light phase of the environmental cycle at about ZT2 to 3 (Table 4).
One-way ANOVA and cosinor analysis of CONTROL and pinealectomized (PINX) animals in subcutaneous fat. a
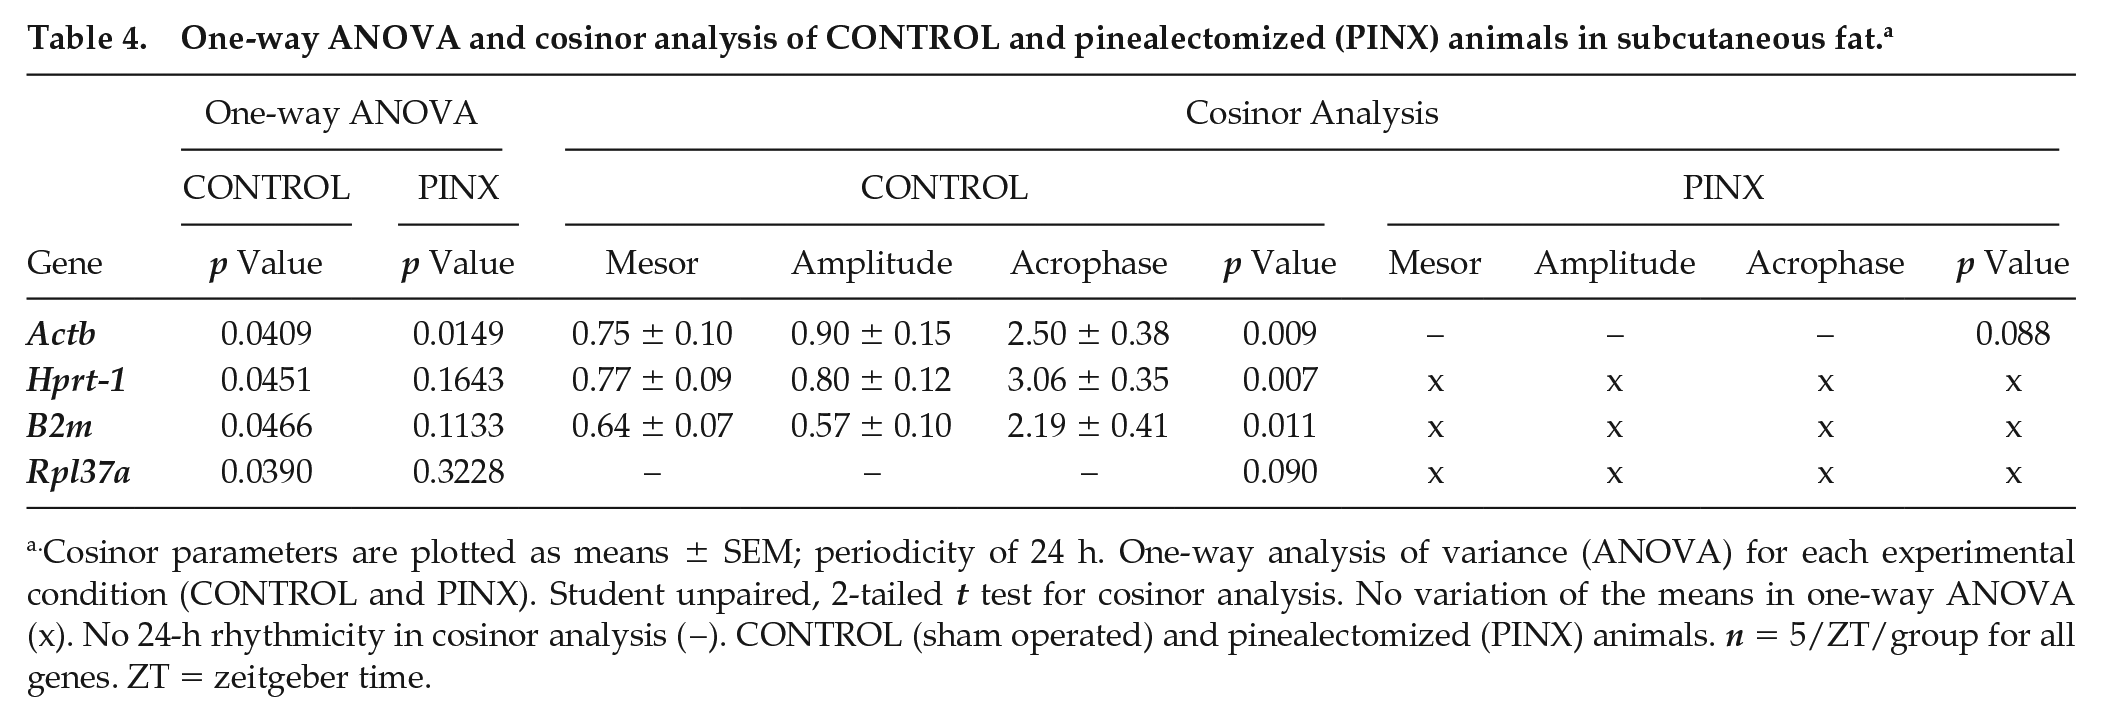
Cosinor parameters are plotted as means ± SEM; periodicity of 24 h. One-way analysis of variance (ANOVA) for each experimental condition (CONTROL and PINX). Student unpaired, 2-tailed t test for cosinor analysis. No variation of the means in one-way ANOVA (x). No 24-h rhythmicity in cosinor analysis (−). CONTROL (sham operated) and pinealectomized (PINX) animals. n = 5/ZT/group for all genes. ZT = zeitgeber time.
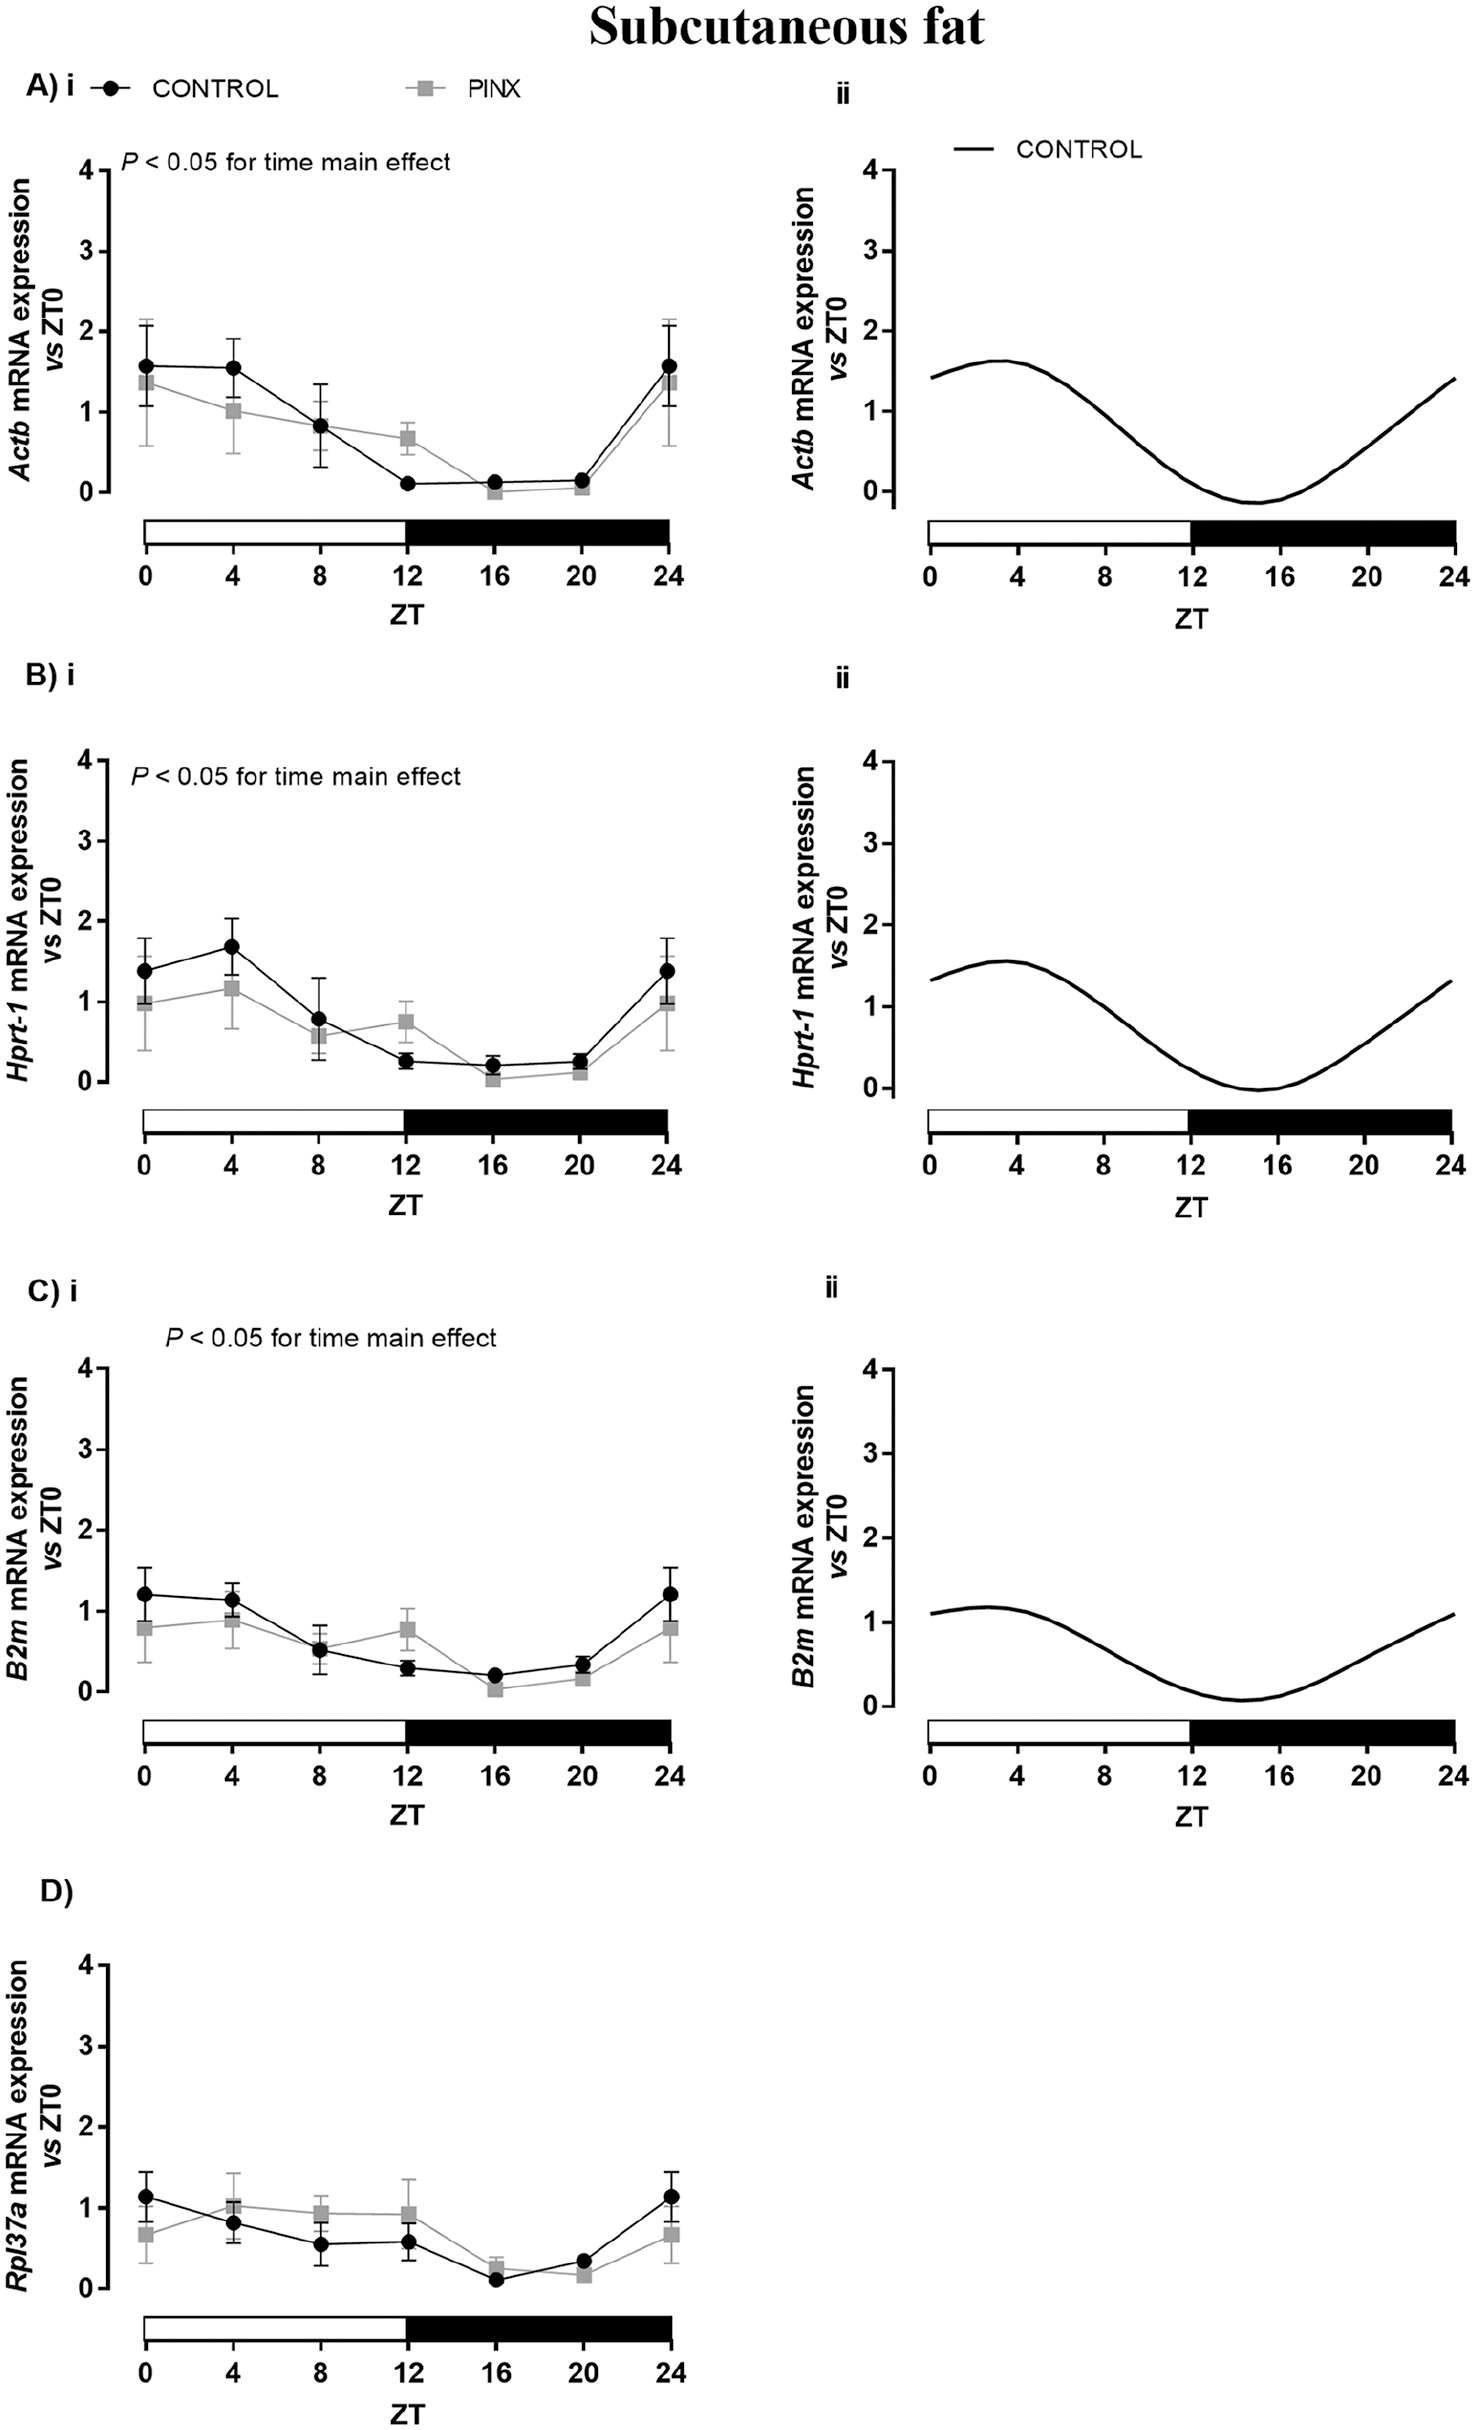
Daily profile of Actb (A), Hprt-1 (B), B2m (C), and Rpl37a (D) expression in the subcutaneous (SC) adipose tissue of sham-operated (CONTROL: black lines) and pinealectomized (PINX: gray line) rats. The results were evaluated versus ZT0 in each group by reverse transcription quantitative polymerase chain reaction and presented as means ± SEM. (Ai, Bi, Ci, and D) Two-way analysis of variance, p < 0.05 for main effect of time. No statistical differences were observed for pairwise comparisons versus respective ZTs using Bonferroni’s post hoc test. (Aii, Bii, and Cii) Cosinor rhythmic analysis of CONTROL (black line) of Actb, Hprt-1, and B2m, respectively. Actb, Hprt-1, and B2m (PINX) and Rpl37a (CONTROL and PINX) presented no circadian rhythmicity. The ZT0 and ZT24 points are double plotted and represent the same samples. n = 5/ZT/group for all genes. ZT = zeitgeber time.
Melatonin Regulates the Expression of Putative Reference Genes in EP, RP, and SC Adipose Tissues
The Actb, Hprt-1, B2m, and Rpl37a transcript expression over 24 h in EP, RP, and SC adipose tissues was also evaluated in PINX animals in comparison with CONTROL rats (Figs. 1-3). The Actb, Hprt-1, and B2m gene expression in CONTROL and PINX rats showed statistically significant alterations only for the time main effect in all adipose tissues investigated, while Rpl37a expression presented a significant treatment main effect in EP and time main effect in RP. No significant alteration was observed in the comparison between CONTROL and PINX rats for the Rpl37a expression in SC adipose tissue.
The daily rhythmicity of Actb expression was disrupted in all adipose tissues of PINX animals (Tables 2-4; Figs. 1–3). The Hprt-1 daily rhythm expression was abolished in SC adipose tissue of PINX rats (Fig. 3Bii), whereas a significant delay in the acrophase was observed in the RP fat of this group (gray dashed lines in Fig. 2Bii; Table 3). The daily oscillation expression of Rpl37a observed only in RP adipose tissue was also altered by the absence of melatonin, showing a reduction in amplitude and acrophase parameters (gray arrow and dashed line, respectively; Fig. 2Dii). The rhythmometric values obtained from cosinor analyses are described in Tables 2 through 4.
Discussion
In this study, the influence of melatonin on the daily variation in the expression of putative reference genes was investigated in the white adipose depots of rats. The EP adipose tissue displayed the most stable daily expression of putative reference genes, in which a daily oscillation was observed only in the Actb expression of CONTROL rats, even though a time or treatment (Rpl37a) main effect was observed for the other genes. In contrast, the expression of most genes investigated in the RP and SC adipose tissues presented a daily rhythmicity. The Actb expression displayed a daily oscillation in all adipose tissues, the Hprt-1 mRNA content showed 24-h oscillations in only the RP and SC depots, and the expression of B2m and Rpl37a displayed a daily rhythmicity in only the SC and RP adipose tissues, respectively. Interestingly, the acrophase of reference genes in EP (Actb) and SC (Actb, Hprt-1, and B2m) occurred at the light phase, whereas for RP adipose tissue, the peak of expression of Actb, Hprt-1, and Rpl37a was observed at the dark period of the day. Moreover, the absence of melatonin disrupted the daily oscillation of all putative reference genes investigated in SC adipose tissue and of Actb in EP depot, as well as, altered the cosinor-based rhythmometry parameters of Hprt-1 and Rpl37a in RP adipose fat.
For a reliable RT-qPCR assay, the normalization of target genes by reference gene expression is the most common and essential step for correcting possible technical variations that could occur over several protocol phases. In addition, mRNA levels may also exhibit intratissue variations even under the same experimental protocol, as observed for different adipose depots (Zhang et al., 2016) and brain regions (Tanic et al., 2007). For these reasons, caution is required in selecting the best reference gene according to the experimental model, target tissue (Barber et al., 2005; Gong et al., 2016), and intervention studied (Tanic et al., 2007).
First, it is important to highlight that all steps performed in the current study, from RNA extraction to RT-qPCR data analysis, were performed with strict methodological care. Particularly in the RT-qPCR methodology, the slope, efficiency, and correlation coefficient (R2) parameters obtained from a standard curve were evaluated to obtain reliable RT-qPCR results, as previously described (Bustin et al., 2009). The efficiency of RT-qPCR is determined by the number of DNA strands amplified after every reaction cycle, meaning that in perfect conditions (1.00 or 100% efficiency), each double DNA strand is duplicated (Lalam, 2006). After performing RT-qPCR from the serial dilutions of the template, the standard curve is constructed from a measure of CT values in the y-axis against the logarithm of the template concentrations (x-axis). The slope for a 10-fold dilution series is expected to be about −3.322 when the efficiency is close to 1.0 (Dussault and Pouliot, 2006). Another critical factor in the evaluation of RT-qPCR performance is the linear dynamics range, for which the correlation coefficient (R2) should be ≥0.98 (Nolan et al., 2006), which is indicative of a stable and reliable assay. Herein, we found mean slope values between −3.14 and −3.82, efficiency values of about 0.83 up to 1.08, and R2 values close to 1.0. Thus, the slope, efficiency, and correlation coefficient (R2) parameters for all genes were close to the optimal values, ensuring that the RT-qPCR results are reliable and that the possible variations to be found using this technique are due only to biological variations per se.
When choosing candidates as reference genes for RT-qPCR analysis, most studies, mainly those outside the chronobiology field, consider only the intervention variable (e.g., treatment) and neglect the influence of time on gene expression. However, in the laboratory, many techniques and procedures require several hours to be fully executed, and sometimes the precise start and end times of the experiments and repetitions receive little attention. Herein, we demonstrated that the expression of 4 genes commonly used as reference genes in RT-qPCR analysis varies over a 24-h period in the 3 adipose tissues evaluated. It is worth mentioning that these 4 genes were chosen based on previous studies of gene expression using RT-qPCR of adipose tissue, adipocytes, or adipose-derived stem cells (Zhang et al., 2014a; van der Spek et al., 2018; Kolodziej et al., 2019).
The expression of Actb for all fat depots investigated, Hprt-1 in RP and SC fat, B2m in SC fat, and Rpl37a in RP fat exhibited a daily rhythm profile in CONTROL animals. In addition, the Actb transcript expression displayed a clear tissue-specific pattern, in contrast to the peak phase between the EP/SC and RP depots. Higher levels of Actb mRNA in EP and SC fat were observed in the middle of the light phase (ZT4-8), while in RP adipose tissue, the Actb acrophase was detected in the dark phase (ZT12-20). Similar findings were described in the suprachiasmatic nucleus of hypothalamus of mice, showing that the expression of some genes considered as reference genes vary throughout the light-dark period (Cleal et al., 2014).
Taking into account the findings observed in the CONTROL (sham-operated) animals and the important role of melatonin in modulating the metabolism and physiology of adipose tissue, we hypothesized that the daily rhythmicity of putative reference gene expression could be influenced by melatonin. To test this hypothesis, we assessed the expression of Actb, Hprt-1, B2m, and Rpl37a in PINX animals.
Supporting our hypothesis, the daily rhythm in Actb expression was abolished in all adipose tissues as was the 24-h oscillation of Hprt-1 and B2m in the SC fat in the absence of melatonin. Furthermore, the acrophase of Hprt-1 in RP fat was delayed 1 h, and the amplitude and acrophase of Rpl37a were reduced and delayed, respectively, in the RP fat of PINX rats compared with CONTROL animals. Together, these data show that melatonin is, at least partially, involved in the regulation of the daily rhythmicity of Actb, Hprt-1, B2m, and Rpl37a in different white adipose tissues, which expands the effects of this hormone to genes commonly considered and used as reference genes.
It is noteworthy that our data do not allow us to precisely define the direct influence of melatonin on the expression of these reference genes from the indirect effects of melatonin on adipocyte clock genes, which could in turn alter the reference gene expression. In this sense, because of the lack of melatonin and/or circadian clock disruption, we also cannot infer whether these changes in reference gene expression are consequences of alterations in the hormonal milieu (such as insulin and corticosterone) or in body temperature. More studies are required to define the precise mechanism involved in the circadian melatonin-mediated regulation of Actb, Hprt-1, B2m, and Rpl37a expression in different tissues.
Based on our data from adipose tissues, we suggest that the geometric mean of Hprt-1 and B2m should be used for the analysis of RT-qPCR of the EP depot, because when analyzed individually, the 4 genes showed time or treatment main effects by two-way ANOVA (de Farias Tda et al., 2015). For the RP adipose tissue, none of the genes could be used as reference genes because they presented a significant main effect of time on two-way ANOVA. The Rpl37a would be the best choice for daily evaluation of gene expression of CONTROL and PINX experiments in SC adipose tissue, since neither time nor treatment main effects were statistically significant in this depot by two-way ANOVA. However, the Rpl37a expression in the SC of the CONTROL group showed a significant difference over 24 h, as evidenced by one-way ANOVA. Thus, although Rpl37a was the most stable between the 4 reference genes tested, it is still not the perfect candidate. Based on the transcript expression of human adipose tissue, the expression of peptidylprolyl isomerase A (Ppia) mRNA could be a possible reference gene candidate for adipose tissue (Neville et al., 2011).
Hence, our results are a clear example that genes usually considered as reference genes can vary according to time, treatment, and different depots of the same tissue, and proper rigor in RT-qPCR analysis is mandatory for obtaining reliable data. It is of great importance to also highlight that the same rigor must occur in rhythmicity analysis. Although there are many free tools available to examine the rhythmicity of a large data set, chronobiologists have not reached a consensus on the best methodologies/algorithms for rhythmometric analysis (Hughes et al., 2017). Although our data do not comprise a large data set, as is recommended for this analysis, but rather we evaluated only 4 genes in 3 adipose depots using relative RT-qPCR, we performed additional analysis of the data using ARSER, JTK_Cycle, and Lomb-Scargle methods (data not shown). According to (1) ARSER, Rpl37a (p = 0.007; false-discovery rate [FDR] = 0.165) of RP adipose tissue and Actb (p = 0.034; FDR = 0.205), Hprt-1 (p = 0.028; FDR = 0.205), and B2m (p = 0.028; FDR = 0.205) in the SC depot of CONTROL animals display a circadian rhythmicity; (2) JTK_cycle: only Actb mRNA content shows a daily oscillation in RP adipose tissue (p = 0.028; FDR = 0.291) of PINX rats; and (c) Lomb-Scargle: none exhibit daily oscillation (data not shown). Together, these results exemplify that special attention should also be paid in the choice of the proper statistical methodology, based on the sampling and hypothesis. The single-component cosinor method used to analyze our data in the present study is historically the most commonly used method for analysis in which the period is synchronized to the environment in a 24-h light-dark cycle (Cornelissen, 2014).
In summary, studies involving RT-qPCR analysis must (1) adequately validate each putative reference gene, according to the specific experimental condition of each study; (2) consider that reference gene expression may vary in a manner specific to the depot/tissue and that each tissue should therefore be viewed as unique, even in the same treatment or experimental protocols; (3) evaluate all variable factors in the experimental design, including the effect of time even in nontemporal/circadian studies, as well as standardize and clearly mention the start time and the duration of the experimental protocol, with an attempt to shorten the duration of the experiment as much as possible or to evaluate the reference gene expression over the entire period of the experimental protocol. All of this information can help to guide future studies to select the best reference gene and avoid unreliable RT-qPCR results, minimizing the possibility of contradictory results, time, and financial resources spent on standardizing trials.
Supplemental Material
Supplementary_material_JBR – Supplemental material for The Influence of Melatonin on the Daily 24-h Rhythm of Putative Reference Gene Expression in White Adipose Tissues
Supplemental material, Supplementary_material_JBR for The Influence of Melatonin on the Daily 24-h Rhythm of Putative Reference Gene Expression in White Adipose Tissues by Tatienne Neder Figueira da Costa, Sandra Andreotti, Talita da Silva Mendes de Farias, Fábio Bessa Lima and Paula Bargi-Souza in Journal of Biological Rhythms
Footnotes
Acknowledgements
This study was supported by the São Paulo Research Foundation (FAPESP 2016/25129-4). T.N.F.C. was the recipient of the Conselho Nacional de Desenvolvimento Científico e Tecnológico–Brasil (CNPq; No. 140181/2017-2). P.B.-S. was the recipient of São Paulo Research Foundation fellowships (FAPESP Nos. 2014/25888-7 and 2016/24941-7). The authors would like to thank Professor Dr. André Gustavo de Oliveira for support of the statistical analysis.
Author Contributions
Study design: TSMF, SA, and FBL. Conduct of the experiments: TSMF, TNFC, SA, and PB-S. Data analysis and interpretation: TNFC and PB-S. Drafting of the article: TNFC and PB-S. Critical revision of the article: FBL and PB-S. All authors read and agreed with the final version of the article.
Conflict of Interest Statement
The authors have no potential conflicts of interest with respect to the research, authorship, and/or publication of this article.
Note
Supplementary material is available for this article online.
References
Supplementary Material
Please find the following supplemental material available below.
For Open Access articles published under a Creative Commons License, all supplemental material carries the same license as the article it is associated with.
For non-Open Access articles published, all supplemental material carries a non-exclusive license, and permission requests for re-use of supplemental material or any part of supplemental material shall be sent directly to the copyright owner as specified in the copyright notice associated with the article.