
Abstract
The circadian master pacemaker in the suprachiasmatic nucleus (SCN) orchestrates peripheral clocks in various organs and synchronizes them with external time, including those in adipose tissue, which displays circadian oscillations in various metabolic and endocrine outputs. Because our knowledge about the instructive role of the SCN clock on peripheral tissue function is based mainly on SCN lesion studies, we here used an alternative strategy employing the Cre/loxP system to functionally delete the SCN clock in mice. We performed whole-genome microarray hybridizations of murine epididymal white adipose tissue (eWAT) RNA preparations to characterize the role of the SCN clock in eWAT circadian transcriptome regulation. Most of the rhythmic transcripts in control animals were not rhythmic in SCN mutants, but a significant number of transcripts were rhythmic only in mutant eWAT. Core clock genes were rhythmic in both groups, but as was reported before for other tissues, rhythms were dampened and phase advanced in mutant animals. In SCN-mutant mice, eWAT lost the rhythm of metabolic pathway–related transcripts, while transcripts gaining rhythms in SCN-mutant mice were associated with various immune functions. These data reveal a complex interaction of SCN-derived and local circadian signals in the regulation of adipose transcriptome programs.
Keywords
Most life on earth is exposed to the 24-h rhythm of day and night. Endogenous timekeeping mechanisms, so-called circadian clocks, enable organisms to adapt physiological processes and behavior to the ensuing, thus predictable, daily changes in the environment. In mammals, molecular circadian clocks oscillate in most, if not all, cells of central and peripheral tissues. To orchestrate circadian physiological entrainment and to provide internal synchrony at the organismal level, the mammalian clock system has a hierarchical organization. A master circadian pacemaker resides in the hypothalamic suprachiasmatic nucleus (SCN). The SCN clock is reset by the external light-dark cycle via the retinohypothalamic tract and relays time cues to the periphery through neuronal, humoral, and behavioral signals (Mohawk et al., 2012; Barclay et al., 2012; Albrecht, 2012; Brown and Azzi, 2013).
At the molecular level, circadian clocks are comprised of a set of interlocked transcriptional-translational feedback loops. In the core loop, the 2 transcription factors brain and muscle ARNT-like protein 1 (BMAL1) and circadian locomotor output cycles kaput (CLOCK) bind to E-box elements of period (Per1-3) and cryptochrome (Cry1-2) genes to activate their transcription during the day. PER and CRY proteins accumulate in the cytoplasm and in the beginning of the night translocate back into the nucleus, where they repress the activity of BMAL1/CLOCK, thereby inhibiting their own transcription. Toward the next morning, nuclear PER/CRY levels fall below a certain threshold, releasing BMAL1/CLOCK-driven transcription (Ko and Takahashi, 2006; Buhr and Takahashi, 2013). Additional transcription factors interact and stabilize this core loop, setting the rhythm at a period of around 24 h (Ueda et al., 2005; Baggs et al., 2009). The clock gene machinery further regulates the activity of numerous tissue-specific output genes that translate time-of-day information into physiologically relevant signals (Storch et al., 2002; Panda et al., 2002; Zhang et al., 2014).
The ubiquitous distribution and complex interaction of different circadian clocks throughout the body make it challenging to dissect the roles of local and systemic circadian factors in the regulation of tissue function (Welsh et al., 2010; Bass and Takahashi, 2010). In particular, the role of the SCN clock is difficult to assess in this context because the coordination of peripheral clocks depends on functional SCN outputs and the relay of external light information through the SCN as a neuronal structure (Husse et al., 2015). To address this issue, we have recently developed a mouse line with genetic deletion of circadian clock function in the SCN, ablating molecular pacemaker function while leaving the SCN neuronal structure intact (Husse et al., 2011; Husse et al., 2014). These mice retain rhythmicity of peripheral clocks under light-dark (LD) and during the first days upon release into constant darkness (DD) conditions, thus serving as a valuable model for studying the contribution of SCN and peripheral clocks to peripheral tissue circadian function (Husse et al., 2015).
White adipose tissue (WAT) is a complex tissue comprising adipocytes, connective tissue, and varying amounts of immune cells (Weisberg et al., 2003). It has a key role in energy homeostasis due to its ability to store large amounts of triglycerides and to release them as fatty acids and glycerol, sustaining the energy demands of other organs. Different WAT depots exhibit rhythmic clock gene expression and circadian release of free fatty acids in vivo and in fat pad explant cultures (Shostak et al., 2013). WAT also acts as an endocrine organ, releasing peptides such as leptin and adiponectin to provide feedback about the body’s metabolic state to the brain and adapt energy intake and expenditure (McGown et al., 2014; Lee and Shao, 2014).
Previous results revealed a complex interaction between the external light regimen, the SCN clock, and peripheral clock rhythms in a tissue-dependent manner (Husse et al., 2014). To assess the impact of SCN clock function on the circadian regulation of WAT on a whole-genome scale, we analyzed circadian transcriptome in epididymal WAT of control mice and mice with SCN clock ablation during the second day in DD by microarray hybridization.
Methods
Animals
All animal experiments were performed in compliance with the German Law on Animal Welfare and were ethically approved and licensed by the Office for Consumer Protection and Food Safety of the State of Lower Saxony. Mutant animals (SCN-KO; genotype Syt10Cre/Cre × Bmal1fl/–) on a C57BL/6J background were obtained by crossing Syt10Cre/Cre × Bmal1fl/+ females to Syt10Cre/Cre with Bmal1fl/– males (Husse et al., 2011). Control animals (Con) were littermates with Syt10Cre/Cre × Bmal1+/– genotype. Male mice of 2 to 6 months of age were used for all experiments.
Tissue Collection and RNA Extraction
Animals were entrained to a 12-h light/12-h dark cycle (LD) for 2 weeks before being released into constant darkness (DD). Three animals of each genotype were euthanized by cervical dislocation every 6 h over the course of 24 h on the second day of DD, starting at 37 h after lights-off. Epididymal white adipose tissue (eWAT) was dissected, snap-frozen in liquid nitrogen, and stored at −80 °C. Total RNA of each animal was isolated from TRizol homogenized tissue (Invitrogen, Carlsbad, CA).
Microarray Hybridization
Synthesis and labeling of cRNA were performed at the microarray core facility of the University of Göttingen according to standard protocols. cRNA was hybridized to GeneChip Mouse Gene 2.x ST Arrays (Affymetrix, Santa Clara, CA), and raw fluorescent intensity values were normalized using the MAS5 algorithm and Affymetrix Expression Console software. Microarray data are deposited in the GEO database (accession no. GSE81532).
Data Analysis and Statistics
Data are shown as means ± SEM. One-to-one comparisons were done by Student t test. P values less than 0.05 were considered significant. Circadian rhythm analysis of gene expression was performed using CircWave (Oster et al., 2006). Only genes with a p value lower than 0.05 and a circadian variation higher than 25% were considered as rhythmic. To determine peak times of specific genes, 24-h sine wave regressions were fitted to normalized data using GraphPad Prism (GraphPad, La Jolla, CA). Peak times were calculated from the curve fitting and binned into 3-h intervals. Rayleigh uniformity tests were used to assess the phase shift distribution (Oriana, Kovach Computing, Pentraeth, UK). Gene set enrichment analysis of regulated genes was performed with WebGestalt (Zhang et al., 2005) against the whole-array gene set using hypergeometric analysis with Benjamini-Hochberg correction for multiple testing (p < 0.05; n ≥ 2). Only gene ontology (GO) categories containing fewer than 500 genes in total were considered.
Results
Deletion of SCN Clock Function Leads to a Strong Reduction in Transcript Rhythmicity in eWAT
SCN-KO and Con littermate mice were entrained to LD, released into DD, and sacrificed in groups of 3 every 6 h on the second day in DD. RNA was isolated from individual eWAT samples and hybridized to Affymetrix microarrays. Testing for rhythmicity with CircWave revealed that in the absence of a functional SCN clock, the number of rhythmic transcripts in eWAT was reduced from 5.7% in Con to 1.9% in SCN-KO mice (668 of 1955 transcripts; Fig. 1A). At the same time, 504 new transcripts became rhythmic in the mutants. Some 31,931 transcripts did not qualify as being rhythmically expressed in either Con or SCN-KO eWAT. A bimodal distribution of expression in rhythmic eWAT transcripts was seen in Con animals with a peak in the middle of the subjective day (43 h after lights-off) and in the middle of the subjective night (55 h after lights-off; Fig. 1B). This distribution was lost in SCN clock–deficient mice, in which only 1 broadened peak was observed with a maximum 55 h after lights-off. Fold change distribution of rhythmic transcripts was assessed for both genotypes, revealing a largely similar distribution of rhythm amplitudes between Con and SCN-KO eWAT. In both groups, most transcripts showed a circadian fold-change close to the cut-off value of 25%, with gradually decreasing numbers and comparable decay rates (Con = 0.33, SCN-KO = 0.25; p = 0.21) toward higher amplitudes (Fig. 1C).
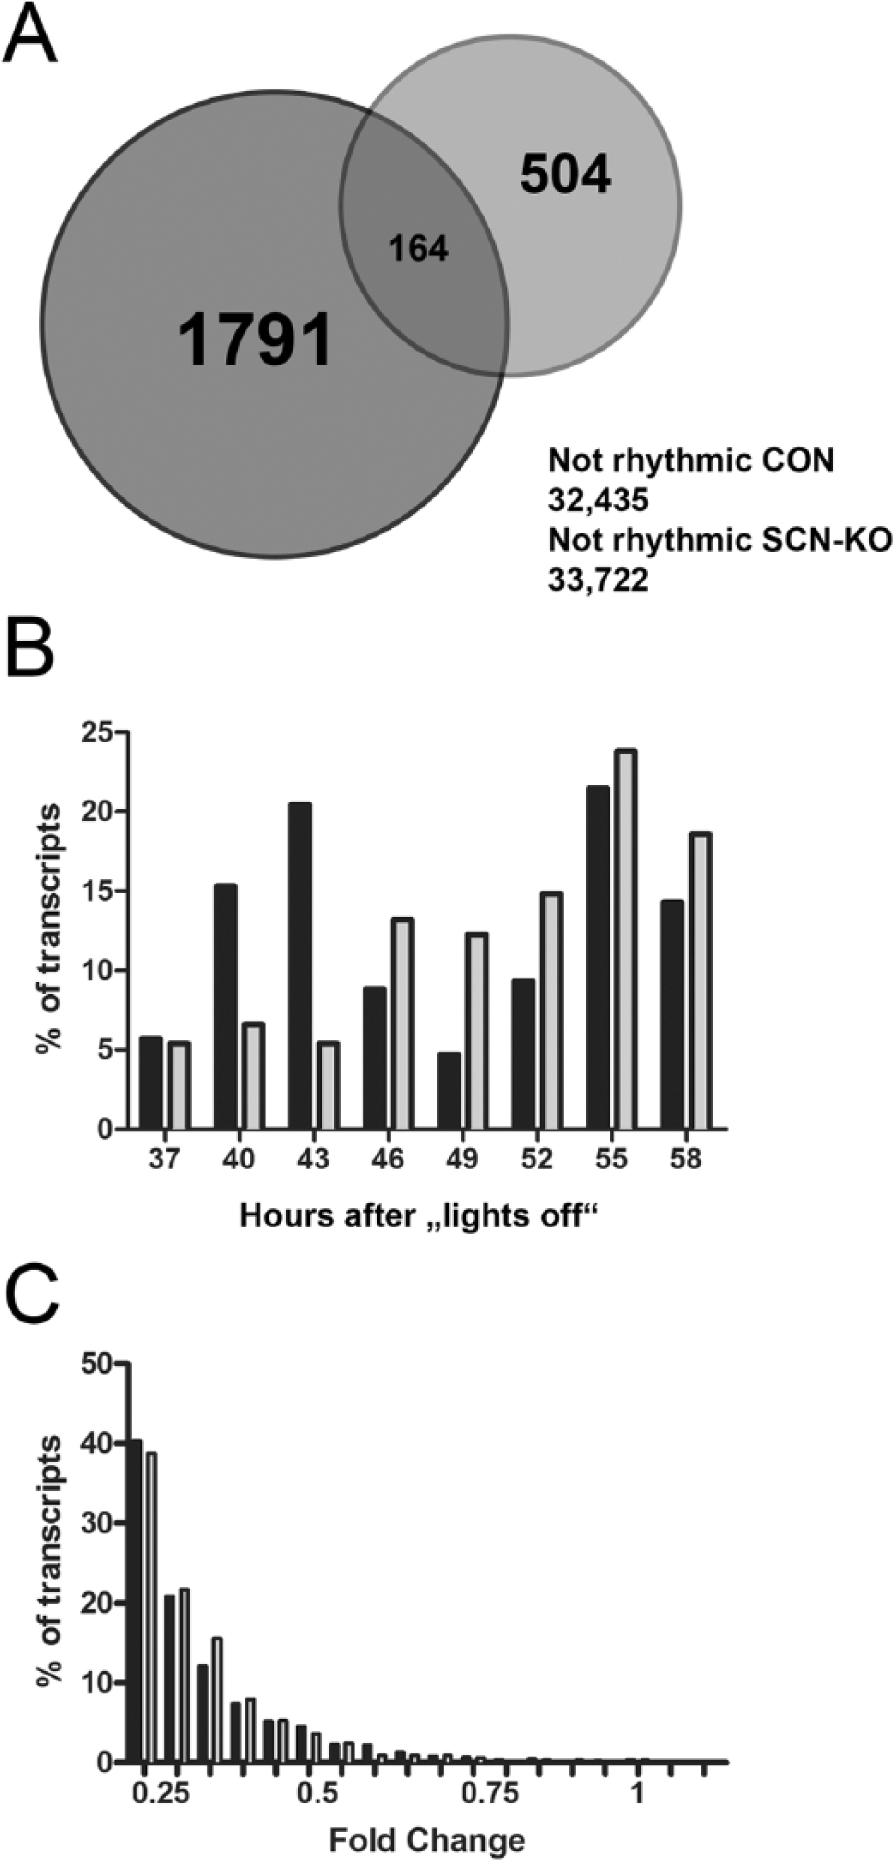
The rhythmic transcriptome of epididymal white adipose tissue in SCN-KO and Con mice. (A) Venn diagram of rhythmic transcripts in eWAT of Con (dark gray; 2327 in total) and SCN-KO animals (light gray; 893 in total). (B) Peak time distribution in Con (black) and SCN-KO animals (gray) calculated over 24 h and represented in 3-h bins. (C) Percentage of rhythmic transcripts sorted according to their circadian fold change in Con (black) and SCN-KO mice (gray).
eWAT Clock Gene Rhythms Are Dampened and Phase-advanced in SCN Clock–deficient Mice
We had previously shown that in SCN Bmal1–deficient mice, clock gene expression in peripheral tissues such as adrenal, liver, kidney, and heart is sustained upon release into DD (Husse et al., 2014). To see whether this situation was preserved in eWAT, we analyzed core clock gene expression in our array data. Clock genes comprising members of the positive (Clock, Bmal1) and negative arms of the clock core (Per1-3, Cry1) and accessory feedback loops (Dbp, Reverba/b) showed significant rhythms in mRNA levels in both Con and SCN-KO eWAT (Fig. 2A). For Per2, Reverba/b, and Dbp, transcription amplitudes were significantly lower in SCN-KO (+ symbol in Fig. 2). For all clock genes, with the exception of Clock, circadian profiles were significantly phase advanced (# symbol in Fig. 2) in SCN-KO eWAT, similar to what has been observed for other peripheral tissues (Husse et al., 2014). Statistical comparison of the normalized amplitude of clock genes (N = 10; Npas2 and those plotted in Fig. 2A) revealed an overall 30% reduction in amplitude (Fig. 2B) and a mean phase advance of 4.8 h in SCN-KO eWAT (Fig. 2C).
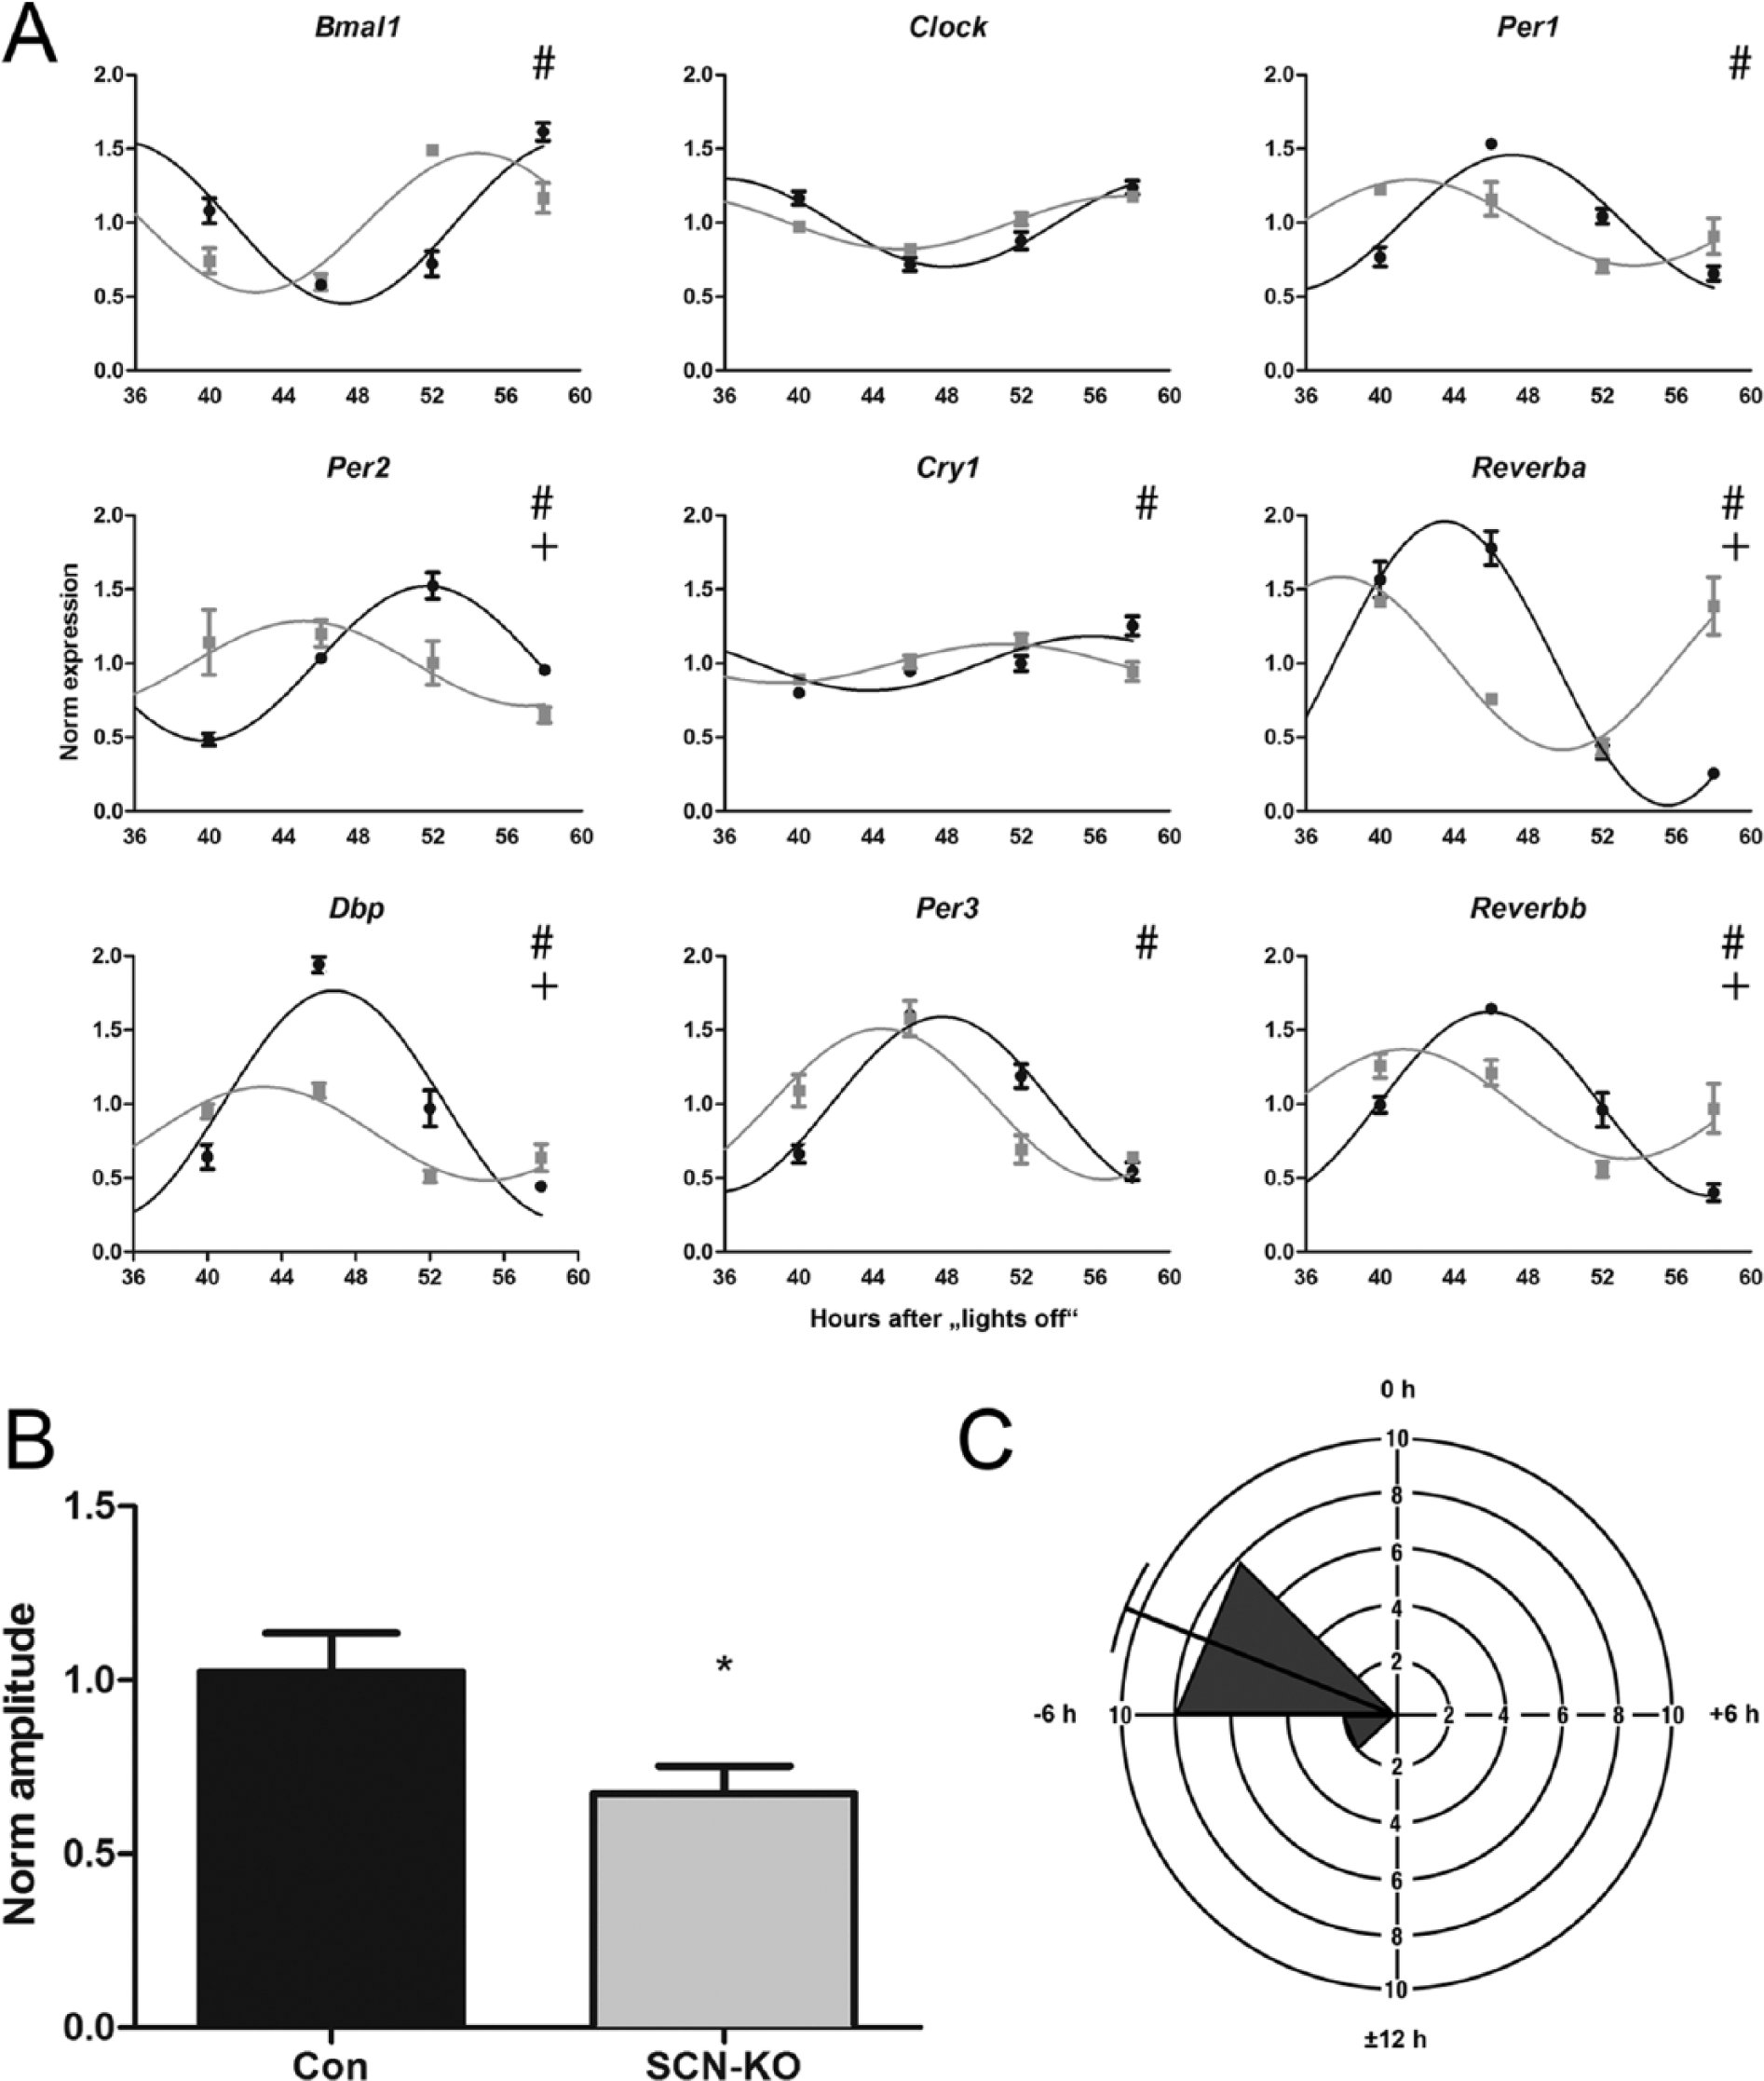
Clock gene rhythms persist in SCN-KO mice in DD with dampened amplitude and phase shifts. (A) mRNA expression profiles of clock genes in Con (black) and SCN-KO animals (gray). 24-h sine wave fittings were compared between genotypes (n = 3 per genotype and time point). #p < 0.05 for phase shift; +p < 0.05 for amplitude difference; extra-sum-of-squares F test. (B) Normalized amplitudes of clock genes in Con (black) and SCN-KO animals (gray); N = 10; *p < 0.05, t test. (C) Rose plot of SCN-KO phase shifts. Transcript peak times of SCN-KO animals were compared with the original Con phases (0 h represents the Con peak time). Longitudes represent the number of transcripts and angles represent the phase difference in 3-h bins.
Comparing the genes that were rhythmic in both genotypes, we found a bimodal peak phase distribution in Con animals, with a first peak in the middle of the subjective day (43 h after lights-off) and the second peak in the middle of the subjective night (55 h after lights-off; Fig. 3A). This bimodality was weakened and shifted toward the subjective night for SCN-KO transcripts, with a smaller peak at 43 h and the main peak at 55 h. The amplitudes of the transcripts that were rhythmic in both CON and SCN-KO eWAT (N = 164, Fig. 1A) were reduced by about 20% on average in SCN-KO mice (Fig. 3B). Peak phases were advanced by an average of 2.0 h (Fig. 3C). Gene enrichment analysis revealed a strong overrepresentation of “circadian rhythm” associated genes, including 8 of the 9 clock genes depicted in Figure 2. This group was followed by more unspecific categories such as “rhythmic process” (10 of 175 genes), “organic anion transport” (9 of 237 genes), and “anion transport” (10 of 353 genes). Overall, circadian clock gene expression was retained in SCN-mutant mice, associated with stable rhythmicity in a relatively small fraction of other transcripts.
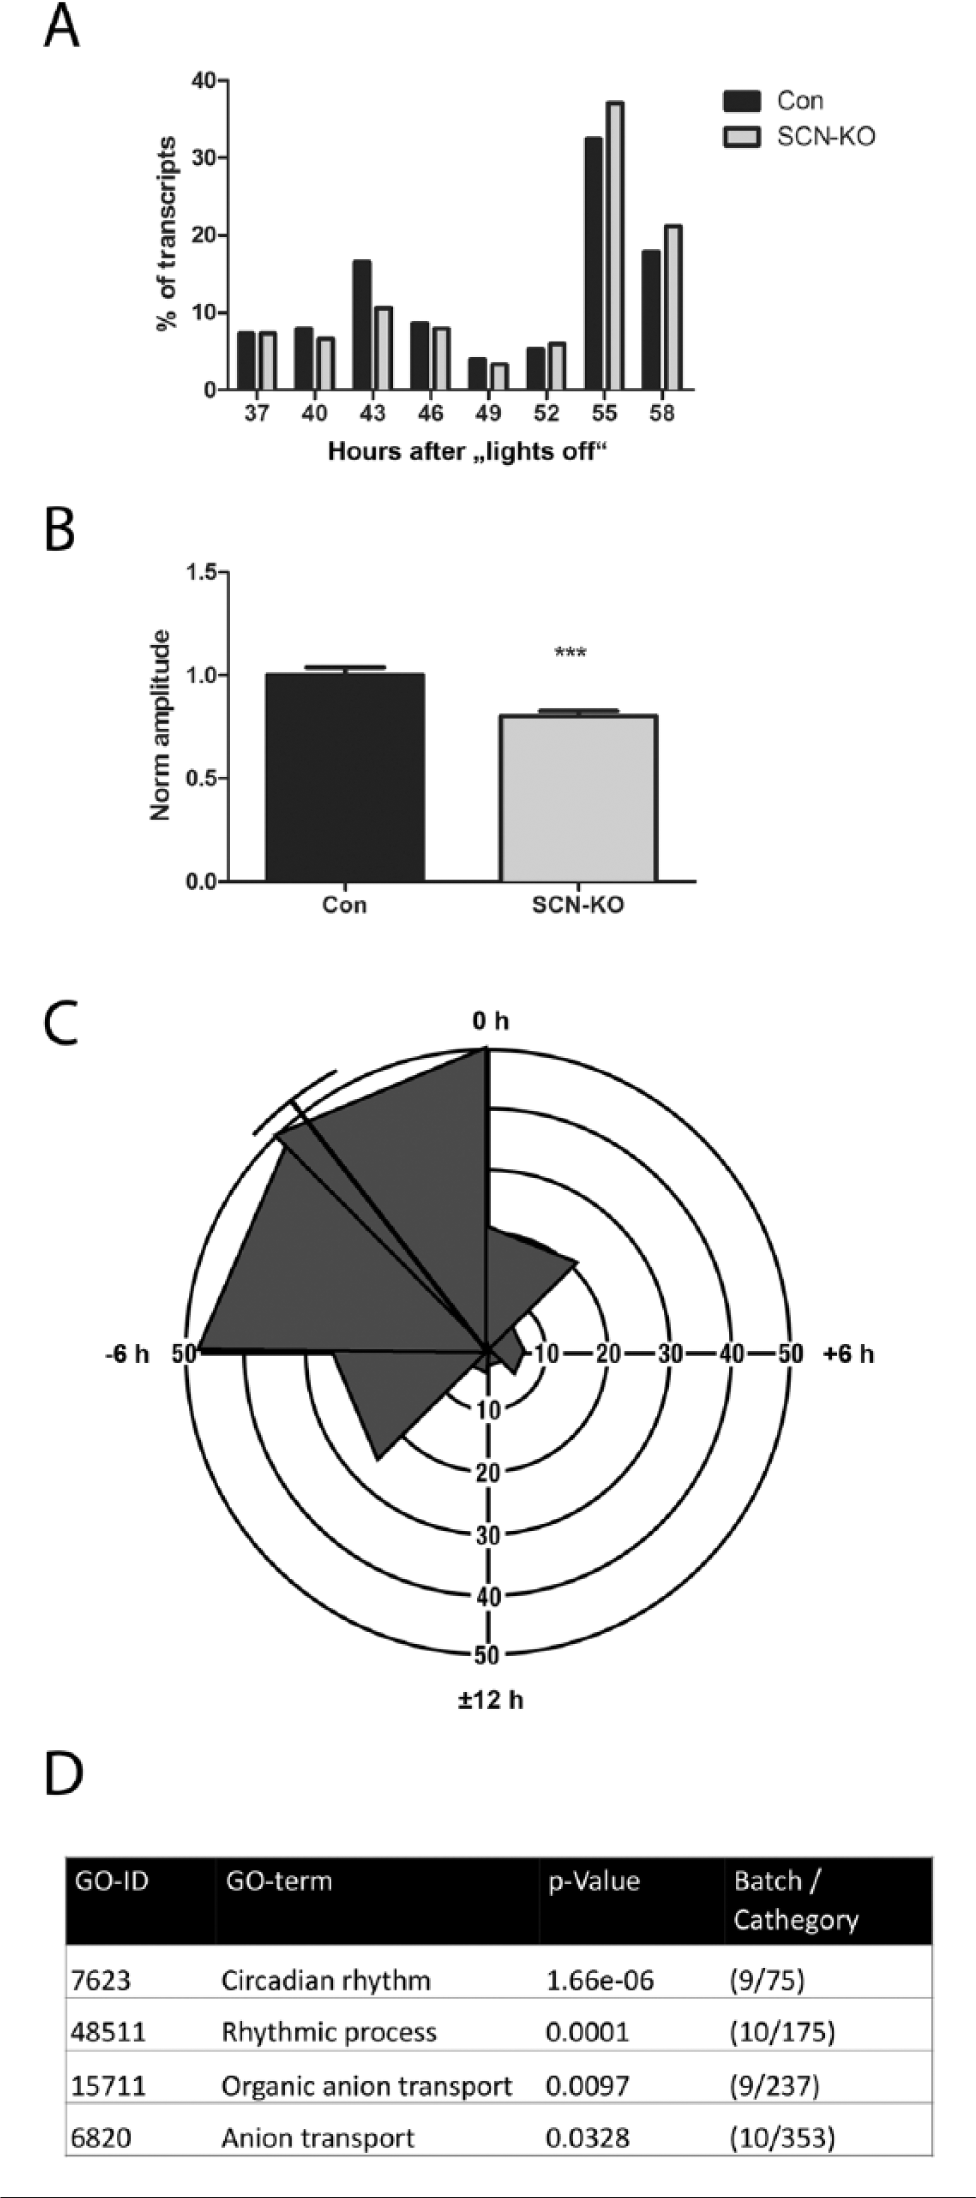
Stably rhythmic genes are dampened and phase shifted in SCN-KO mice. (A) Peak time distribution of stably rhythmic transcripts in Con (black) and SCN-KO animals (gray) calculated over 24 h and represented in 3-h bins. (B) Normalized circadian amplitudes of rhythmic genes in Con (black) and SCN-KO animals (gray); N = 164; ***p < 0.001, t test. (C) Rose plot of SCN-KO phase shifts. Transcript peak times of SCN-KO animals compared with the original Con phases (0 h represents the original Con peak time). Longitudes represent the number of transcripts and angles represent the phase difference in 3-h bins. (D) GO enrichment analysis for rhythmic transcripts in Con and SCN-KO mice.
Metabolism-associated Transcripts Lose Rhythmicity in eWAT of SCN Clock–deficient Animals
For those eWAT transcripts that lost rhythmicity in the absence of a functional SCN pacemaker, a bimodal distribution of rhythm phases in Con was observed, with maxima at 43 h and 55 h after lights-off (Fig. 4A). Gene enrichment analysis revealed a strong overrepresentation of genes associated with energy metabolism in this group (Fig. 4C). The 10 GO categories showing the strongest significance in enrichment were all associated with lipid or carbohydrate metabolism (Fig. 4B). The most overrepresented was the GO category “cholesterol biosynthetic process,” with more than 36% of genes (13 of 36) in this category losing rhythmicity in SCN-mutant mice. Cholesterol biosynthesis is predominantly active in the liver but also in adipocytes and various steroidogenic tissues (Panini et al., 1986; Heikkila et al., 1989). The main substrate is acetyl-CoA, which, in a rate-limiting step, is converted into HMG-CoA by HMG-CoA synthetase (encoded by Hmgcs1) and further modified via a multienzymatic process into cholesterol (Fig. 4C). In eWAT of Con mice, most of the cholesterol biosynthesis regulatory genes peaked toward the end of the subjective night (58 h after lights-off; Fig. 4D), with the exception of the negative regulator Prkaa1 and Por, peaking at 46 h. In SCN mutants, such rhythmicity and phase coherence were largely lost (Fig. 4E). In summary, a large group of rhythmic eWAT genes depend on a functional SCN clock. These genes were associated with metabolic processes, correlating with the previously observed loss in locomotor activity and food intake rhythms in these mice (Husse et al., 2014).
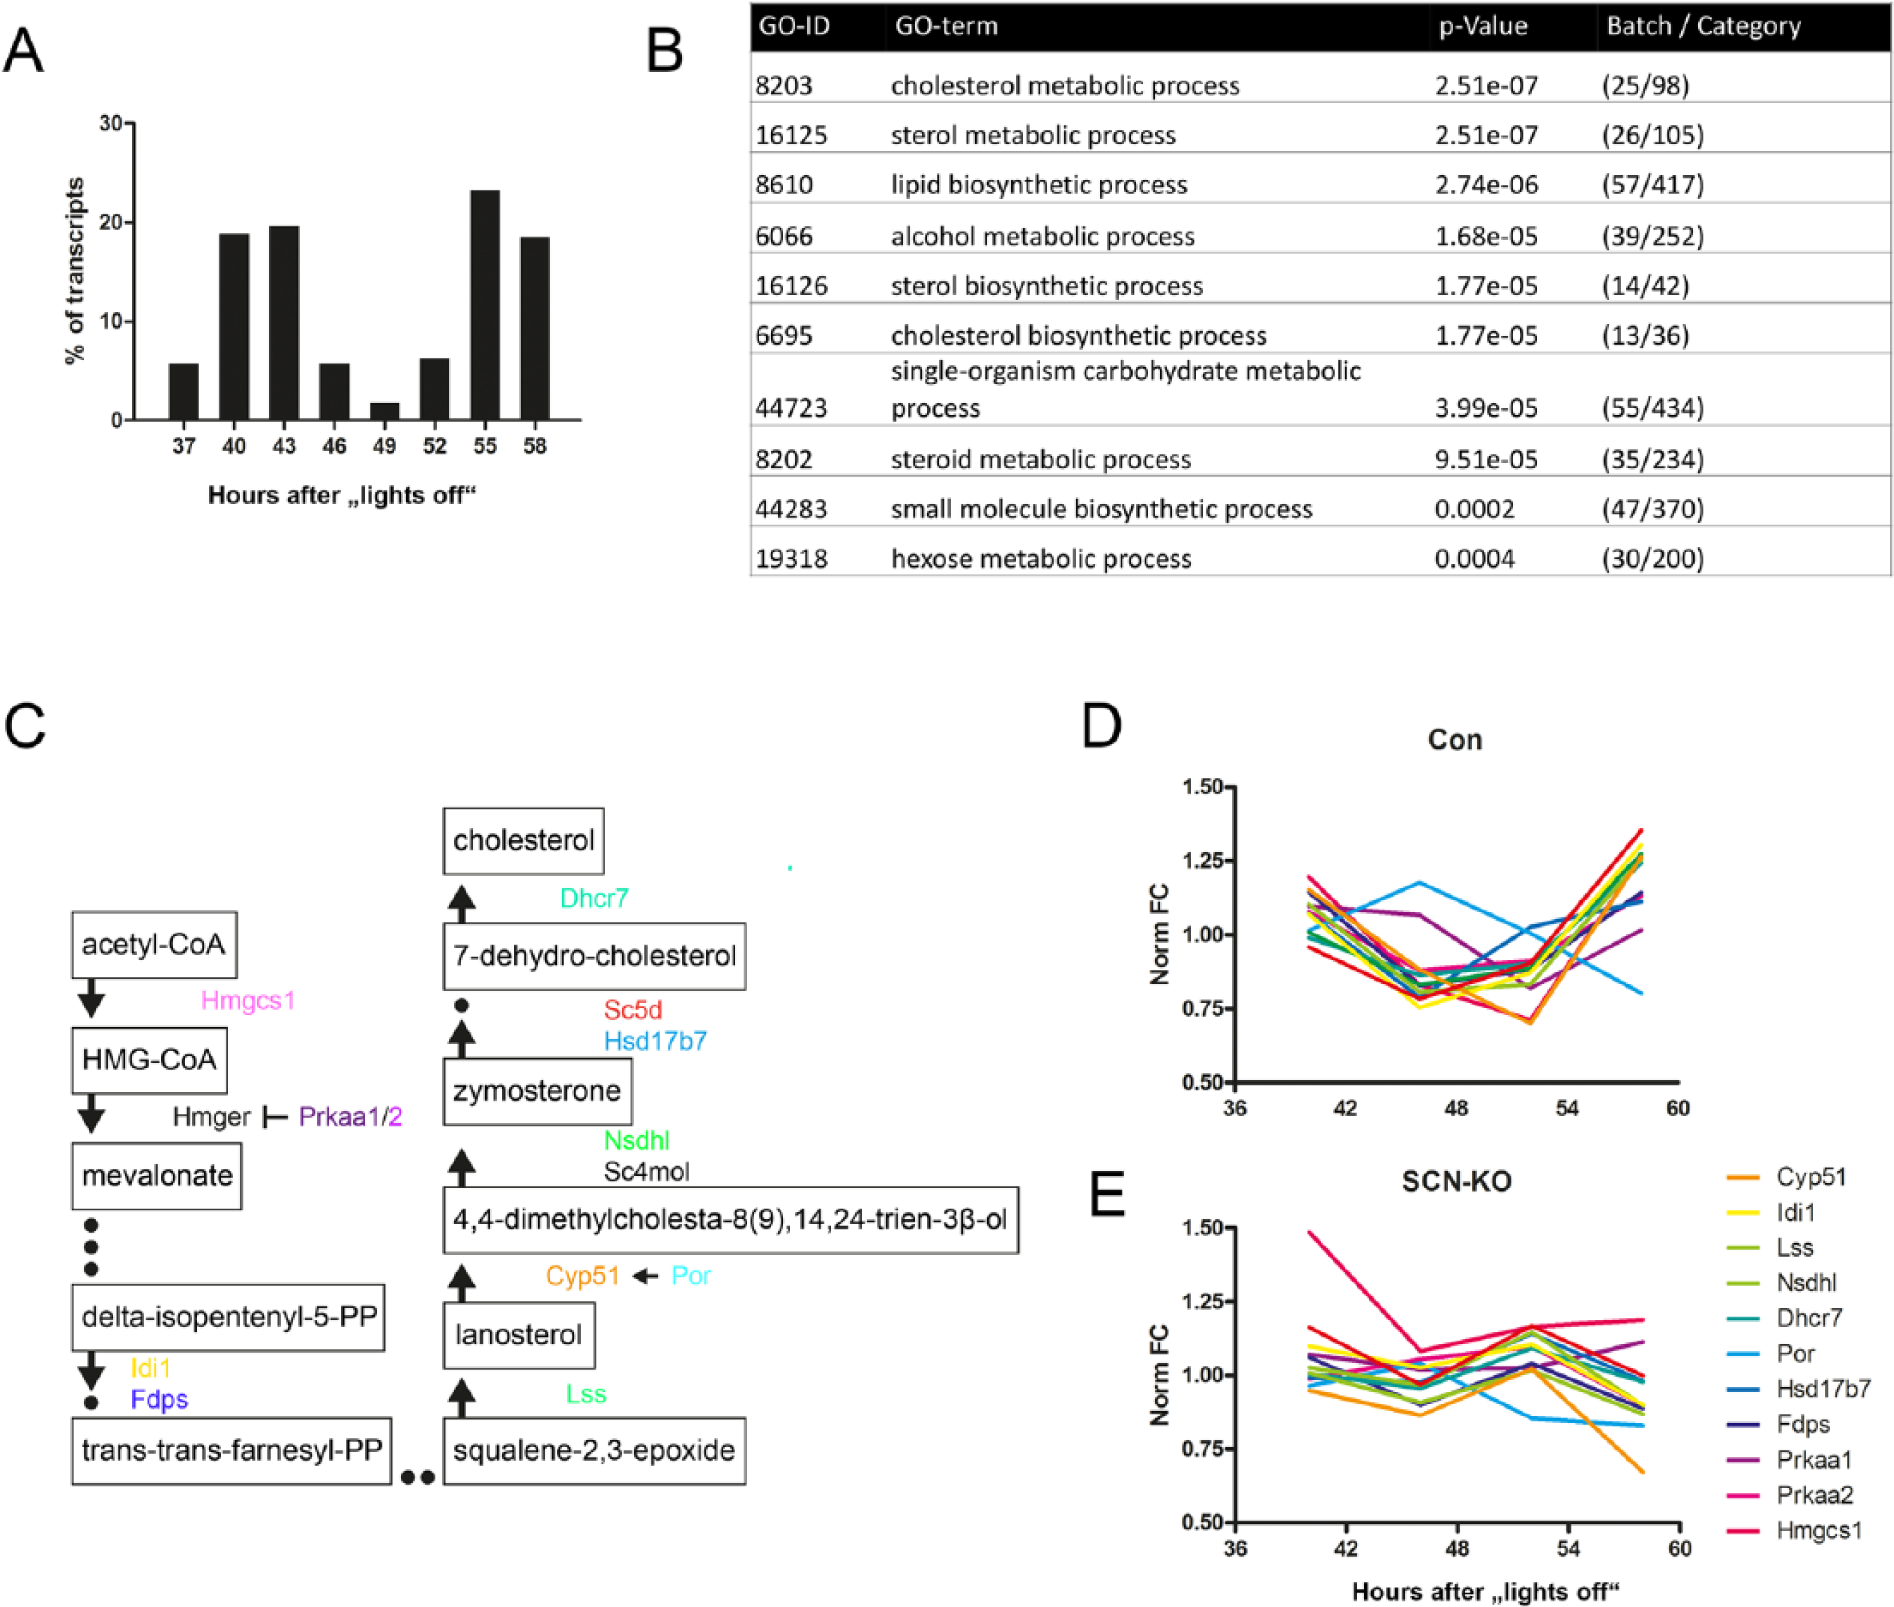
Transcripts that lose rhythmicity in SCN-KO mice are involved in metabolic function. (A) Peak time distribution of eWAT transcripts that are rhythmic only in Con animals, calculated over 24 h and represented in 3-h bins. (B) GO enrichment analysis for eWAT transcripts rhythmic only in Con mice. (C) Flow chart of the cholesterol biosynthesis pathway depicting rhythmic transcripts. (D) Normalized circadian profiles (fold change, FC) of rhythmic transcripts of cholesterol biosynthesis in Con (D) and SCN-KO mice (E).
Immunity-associated eWAT Transcripts Gain Rhythmicity in the Absence of a Functional SCN
To our surprise, and despite an overall reduction in transcriptional rhythmicity, a relatively large number (n = 504) of eWAT transcripts gained rhythmicity upon genetic ablation of SCN pacemaker function (Fig. 1). The phase distribution of these transcripts showed elevated values toward the subjective night with a maximum at 55 h after lights-off (Fig. 5A). GO enrichment analysis revealed an overrepresentation of genes involved in innate immunity function such as immune cell trafficking (Fig. 5B). For the GO category “neutrophil chemotaxis,” 6 of 50 genes gained rhythmic expression in the absence of SCN function. These genes (Fig. 5C) are involved in regulating neutrophil migration, such as complement component 3a receptor 1 (C3ar1), integrin beta-2 (Itgb2), integrin alpha-M (Itgam), and high-affinity immunoglobulin epsilon receptor subunit gamma (Fcer1g), as well as one gene involved in neutrophil adhesion (NCK-associated protein 1-like [Nckap1l]). In Con eWAT, these transcripts showed subtle (and nonsignificant) rhythmicity peaking at the early subjective night (52 h; Fig. 5D) and increased rhythmicity with retained peak phase in SCN-KO eWAT (Fig. 5E). In contrast, the neutrophil adhesion–associated chemoattractant gene chemokine (C-C-motif) ligand 1S (Ccl19) was phase-shifted toward subjective midday (46 h) in SCN mutants.
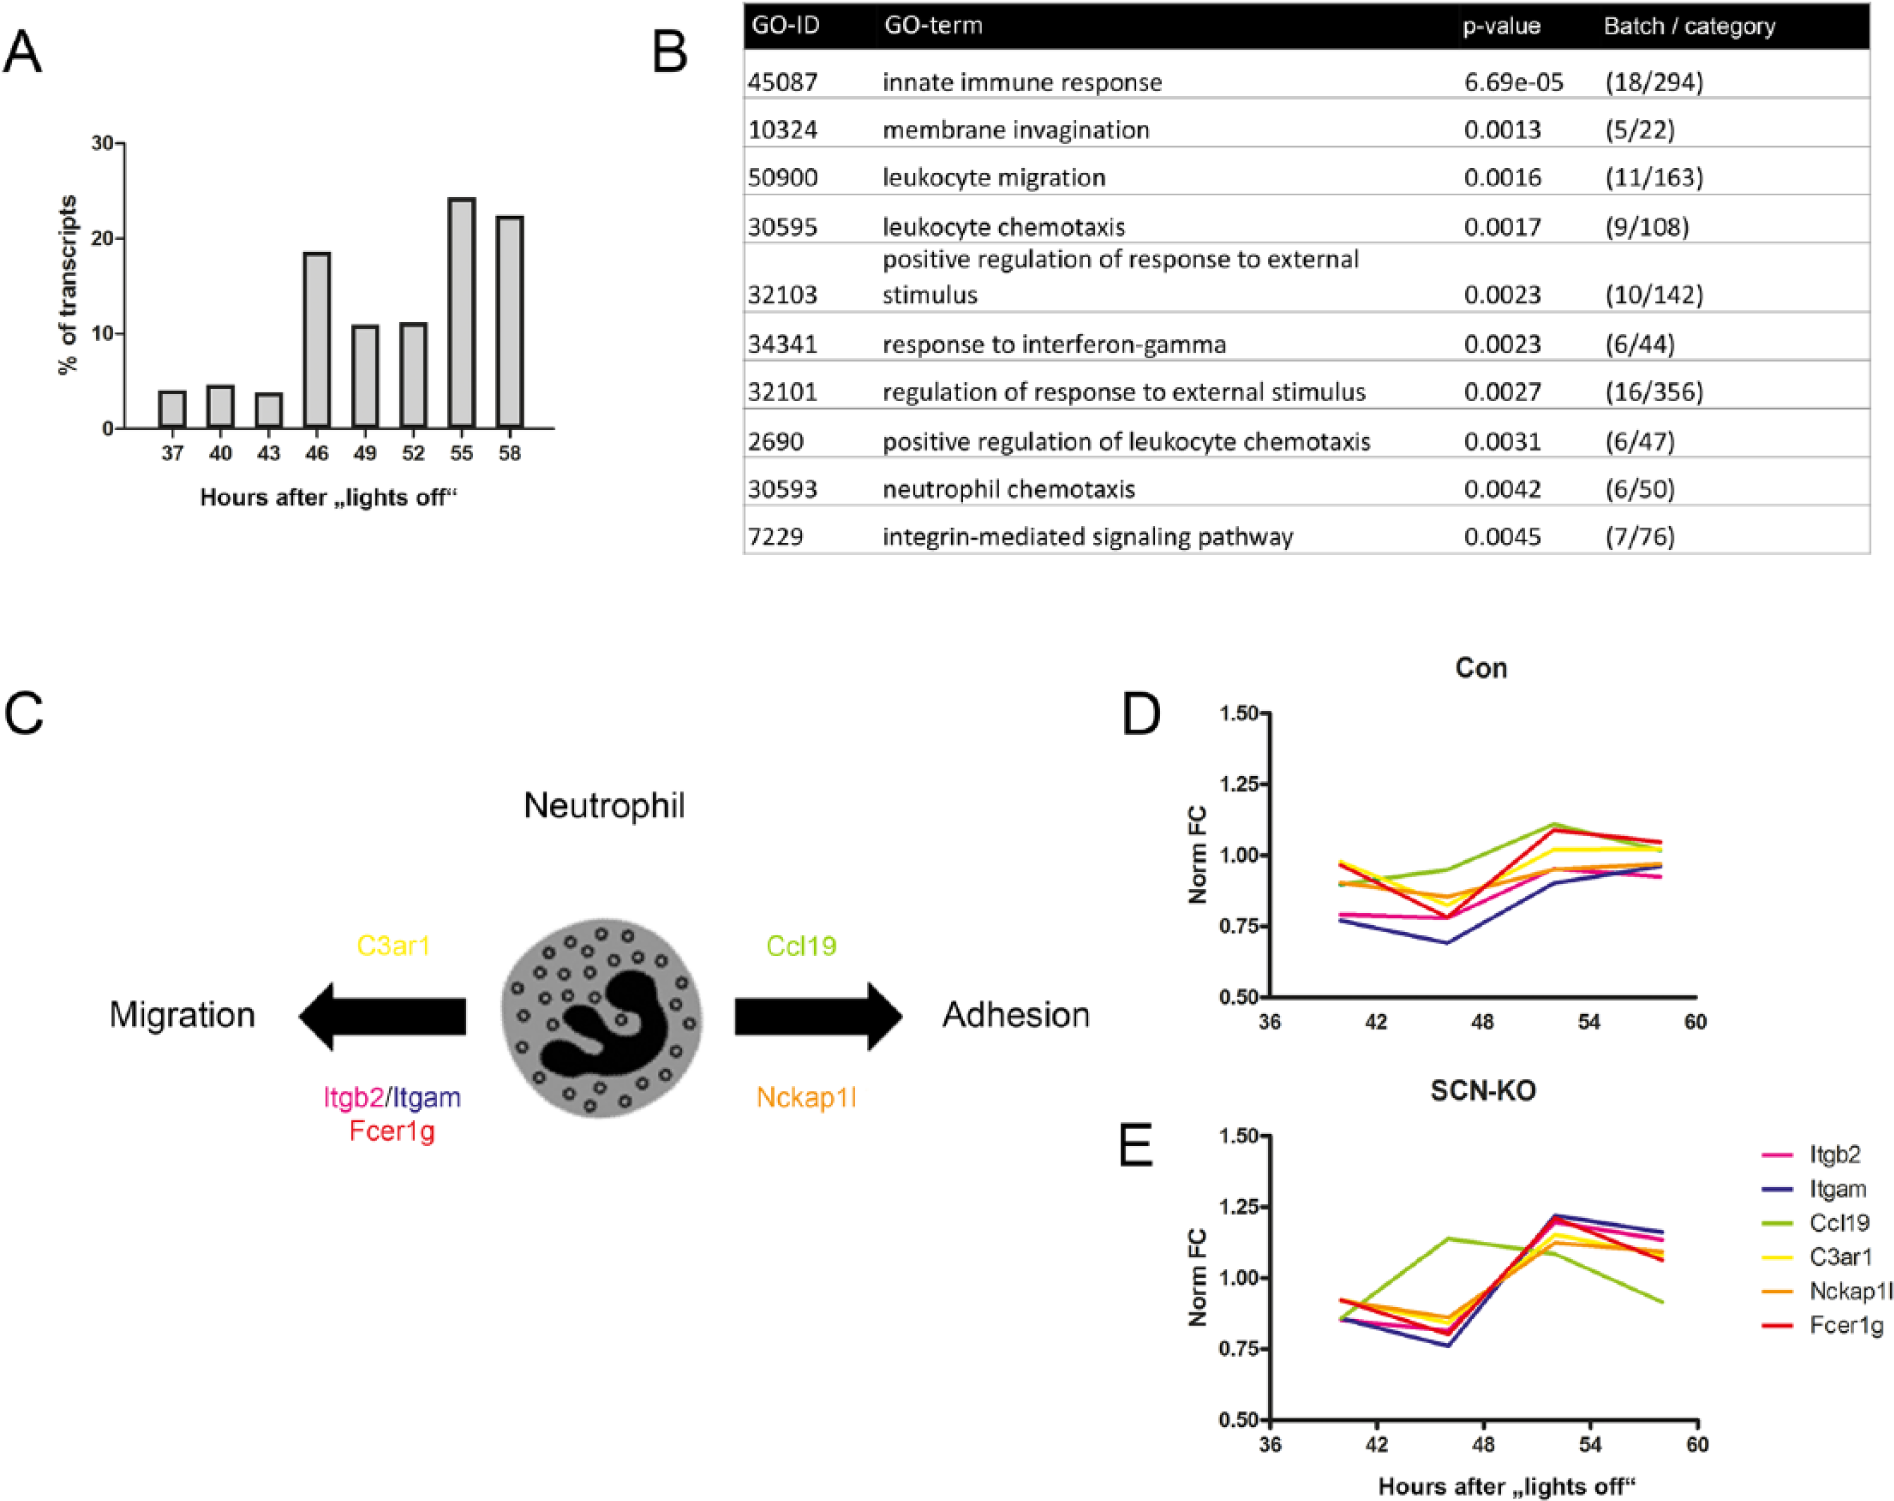
Transcripts gaining rhythmicity in SCN-KO mice are involved in immune function. (A) Peak time distribution of eWAT transcripts that are rhythmic only in SCN-KO animals, calculated over 24 h and represented in 3-h bins. (B) GO enrichment analysis for eWAT transcripts rhythmic only in SCN-KO mice. (C) Scheme of transcripts involved in neutrophil chemotaxis, migration (C3ar1, Itgh2, Itgam, Fcer1g) or adhesion (Ccl19, Nckap1). (D) Normalized circadian profiles (fold change, FC) of rhythmic transcripts of neutrophil chemotaxis (C3ar1, Itgh2, Itgam, Fcer1g, Ccl19, Nckap1) in Con (D) and SCN-KO mice (E).
In summary, we found a large number of genes involved in immune cell regulation for which eWAT expression rhythms became stronger in the absence of a functional SCN clock.
Discussion
Our data reveal a strong influence of SCN clock function on the circadian regulation of the eWAT transcriptome. In control animals, we found that around 6% of all eWAT transcripts were regulated in a circadian fashion, most of which lost rhythmicity when the SCN clock was ablated. While a small subset of genes—including the core clock machinery—retained rhythmicity, albeit dampened and phase-advanced, in SCN clock mutants, a significant proportion of new transcripts became rhythmic under these conditions, revealing a complex interaction of central and peripheral circadian clocks in the regulation of the adipose transcriptome.
Large-scale Loss of Circadian Transcriptome Rhythms in SCN-mutant eWAT
In control animals, around 6% of transcripts qualified as rhythmic in our data set. While this number is comparable to findings of several studies in other tissues using related detection algorithms (Oster et al., 2006; Panda et al. 2002; Kornmann et al. 2007), significantly more rhythmic transcripts were detected in newer studies (Zhang et al., 2014). This difference likely arises from 2 factors. First, we used a relatively long sampling interval (6 h in our study vs. 1 h in Zhang et al., 2014). Second, in an attempt to focus on physiologically relevant oscillations, we used a conservative circadian amplitude cut-off of 25%. Nevertheless, a 6-h sampling interval and 24-h sampling window represent a limitation of our study.
Peak times of rhythmic transcripts displayed a bimodal distribution over 24 h (Fig. 1B). Similar distributions have been shown before in peripheral tissues, when transcription peak times were clustered into groups peaking during the day or the night (Akhtar et al., 2002, Archer et al., 2014). During rest or sleep, the transcriptome in peripheral organs shifts to state-dependent transcripts, which are less expressed during the active phase (Anafi et al., 2013), so it is possible that peak phase clusters in our rhythmic control mice may also represent a consequence of a state switch. The second peak appears toward the end of the activity-feeding phase (Fig. 1B), and thus food intake may be a strong entrainment signal for adipose tissue (Zvonic et al., 2006). In Syt10Cre/Cre × Bmal1fl/– mice, food consumption and locomotor activity rhythms are lost immediately upon release into DD (Husse et al., 2014), correlating with the observed loss of rhythmic expression in most control rhythmic eWAT transcripts (Fig. 1A). In line with this, previous studies have shown similar food rhythm-dependent transcriptome oscillations in liver (Vollmers et al., 2009).
We found that cholesterol biosynthesis–related genes were among the overrepresented pathways in this group (Fig. 4C). WAT is the major storage organ for cholesterol (Kovanen and Nikkila, 1976) and is also involved in the maintenance of cholesterol plasma levels (Kovanen and Nikkila, 1976). Although the majority of cholesterol de novo synthesis takes place in the liver (Back et al., 1969; Gupta et al., 1989), low plasma concentrations can stimulate cholesterol production in adipose tissue as well (Lakshamanan et al., 1977). Most cholesterol biosynthesis–associated rhythmic transcripts peaked in the subjective night in control animals (Fig. 4D), similar to what has been reported in the rat liver (Jurevics et al., 2000). In SCN-mutant mice, this rhythm was completely lost (Fig. 4D) in correlation with a lack of behavioral and food intake rhythms (Husse et al., 2014).
Our experiments were performed in constant darkness to avoid any direct effect of light exposure (e.g., through autonomic afferents) on eWAT rhythms. Nevertheless, on the second day in DD, eWAT rhythms were still remarkably robust (Fig. 2), which may be due in part to synchronizing signals such as glucocorticoids that continue to oscillate for some time in mutant mice under constant light conditions (Husse et al., 2014). In line with this idea, adipose tissues may respond to glucocorticoids by increasing lipolysis (Barclay et al., 2012)—which is also regulated by the local adipose clock (Shostak et al., 2013).
Loss of SCN Function Unmasks eWAT Transcript Rhythms
Our experiments also revealed a surprisingly large number of eWAT transcripts oscillating only in behaviorally arrhythmic, SCN clock–deficient Syt10Cre/Cre × Bmal1fl/– mice (Figs. 1A and 5). Of note, the extent of this gain of amplitude is comparable to the loss of rhythmicity of transcripts with rhythmic expression in control mice only, which argues against a low-amplitude oscillation–derived statistical artifact. While appearing counterintuitive on first glance, one explanation for this rhythm emergence after loss of zeitgeber input may be that expression of these transcripts is under counteractive regulation by both local clocks and systemic signals. If the systemic input is lost, as in SCN clock–deficient mice, transcriptional rhythms in these genes may become unmasked. A similar mechanism has been proposed for the regulation of blood glucose levels by both food intake (systemic signal) and the liver circadian clock (internal signal). Hepatocytes react to acute changes in circulating glucose levels (Klover and Mooney, 2004), but the release of glucose into the bloodstream follows a diurnal pattern that counterbalances the lack of glucose input during the fasting (rest) phase (Lamia et al., 2008). Tissue-specific deletion of clock function in the liver disrupts this buffer function, promoting daily fluctuations in blood glucose levels following feeding behavior (Lamia et al., 2008).
Enrichment analysis revealed that many of the emergent rhythmic genes were associated with immune functions (Fig. 5C). Adipose tissue is permanently transmigrated by large quantities of immune cells, which can make up 5% to 50% of the total cell mass (Weisberg et al., 2003; Ortega et al., 2009). Most of the genes involved in the chemotaxis of neutrophils displayed their eWAT expression maximum in the early subjective night in Syt10Cre/Cre × Bmal1fl/– mice, while their transcription was broadly distributed and less rhythmic in control animals (Fig. 5D). Under normal conditions, the content of free neutrophils in blood of wild-type mice follows a robust circadian oscillation with a maximal concentration around midday (Brown and Dougherty, 1956). At this time, the concentration of neutrophils in adipose tissue is low. In line with this, the expression of most neutrophil chemotaxis genes reached its nadir in SCN-KO mice (Fig. 5D). Given that neutrophil immigration into adipose depots is one of the first steps of metabolic inflammation, it is tempting to speculate that—similar to the situation in liver—food intake and eWAT clock gene rhythms counterregulate neutrophil chemotaxis gene expression in control mice. In SCN clock–deficient animals, however, the food intake influence is lost, unmasking the impact of the local clock gene machinery. Fasting induces lipolysis and the release of free fatty acids from adipocytes into the bloodstream. Fatty acids, in turn, can increase the immune cell content in adipose tissue (Kosteli et al., 2010). As the natural rhythm of free fatty acid release from adipose tissue (Shostak et al., 2013) opposes innate immune cell recruitment, this may stratify the expression of neutrophil chemotaxis genes in control animals.
In the immune context, it was demonstrated that glucocorticoids interplay with the bronchiolar secretory cell clocks and modulate the circadian response to infection (Gibbs et al., 2014). The rhythm of glucocorticoids is preserved in our mutant mice and could potentially control the expression of immunity-relevant genes. However, the participation of other systemic signals cannot be excluded, and further experiments are needed to specify the role of local clock genes in this context.
Conclusion
In the absence of external time cues, the SCN master clock is required to sustain transcriptional rhythmicity (Husse et al., 2015). In our study, genetic disruption of master pacemaker function led to an overall disruption in the oscillation of metabolic transcripts in eWAT. At the same time, newly rhythmic transcripts emerged associated with migrating behaviors of innate immune cells. The timing of food intake has previously been shown to modulate inflammation and obesity (Hatori et al., 2012), and our data suggest a complex interaction of behavioral, physiological, and cellular zeitgeber signals in the regulation of adipose circadian transcriptome programs. Further studies are needed to evaluate the physiological consequences of this interplay and its possible therapeutic potential for preventing the immunologic and metabolic consequences of circadian misalignment.
Footnotes
Acknowledgements
We thank Dr. Anthony Tsang for critical comments on the manuscript. This work was funded by the German Research Foundation (DFG; GRK-1957). H.O. is a Lichtenberg Fellow of the Volkswagen Foundation. The authors declare no conflicts of interest.