
Abstract
Individuals with a later chronotype (evening types) tend to have unhealthier behaviors and increased morbidity and mortality as compared with those with an earlier chronotype (morning types). However, the role of genetics in explaining evening types’ adverse health and health behavior is unclear. Our aim was to study genetic associations of chronotype among 8433 Finns from the cross-sectional National FINRISK 2007 and 2012 studies. First, we studied associations between chronotype and 20 key clock genes with a candidate-gene approach and then performed a full genome-wide association study (GWAS) of chronotype. We also developed a genetic risk score (GRS) for chronotype based on 313 single nucleotide polymorphisms (SNPs) that have previously been associated with chronotype. Chronotype was assessed with a shortened version of Horne and Östberg’s Morningness-Eveningness Questionnaire (sMEQ), and for comparison, we also used the single self-evaluation question on chronotype from the questionnaire. Linear and logistic regression was used for statistical analysis assuming additive effects. The clock gene analysis revealed 1 independent association signal within NR1D2 (lead SNP rs4131403) that was associated with chronotype (p < 0.05; as based on both chronotype assessment methods). The GWAS analysis did not yield any genome-wide significant associations (p > 5 × 10⁻⁸). However, higher GRS was associated with evening chronotype (p < 0.001; as based on both chronotype assessment methods). In conclusion, our findings indicated novel genetic associations between chronotype and the NR1D2 clock gene, which has previously been associated with carbohydrate and lipid metabolism. Furthermore, the GRS was able to capture the genetic aspect of chronotype in our study population. These findings expand our knowledge of the genetic basis of chronotype.
Keywords
The term chronotype has been generally applied to interindividual variation in the timing of daily rhythms, and because of this variation, individuals can be categorized from extreme morning (early) to extreme evening (late) types. In observational studies, chronotype can be assessed with validated questionnaires, such as the Morningness-Eveningness Questionnaire (MEQ), which yields a score based on individuals’ preferences for timing their daily activities (Horne and Östberg, 1976), and the Munich Chronotype Questionnaire (MCTQ), which yields a reference phase over the 24-h day based on the midpoint of sleep during work and free days (Roenneberg et al., 2007). Evening type has been associated with less healthy behaviors (e.g., smoking, lower physical activity) and dietary habits than morning types (Sato-Mito et al., 2011; Kanerva et al., 2012; Wennman et al., 2015; Patterson et al., 2016; Maukonen et al., 2017). Furthermore, evening types also bear a higher risk for morbidity (e.g., type 2 diabetes, cardiovascular diseases, and depressive disorder; Levandovski et al., 2011; Merikanto et al., 2013; Merikanto et al., 2015; Yu et al., 2015; Patterson et al., 2018; Knutson and von Schantz, 2018; de Punder et al., 2019) and premature all-cause mortality (Broms et al., 2014; Knutson and von Schantz, 2018; Didikoglu et al., 2019).
According to twin studies, genetic effects account for about 50% of the between-individual chronotype variance in adults (Koskenvuo et al., 2007; Barclay et al., 2010). In Finland, the estimate for additive genetic effects was 12% and for dominant genetic effects 38%, with the remainder accounted for by environmental factors not shared by siblings (Koskenvuo et al., 2007). The proportion of these influences is subject to a change across the life span in particular, between 36 and 64 years of age, as genetic effects on chronotype can become attenuated (Koskenvuo et al., 2007; Barclay et al., 2014). However, the role of genetics in explaining adverse health and health behavior associated with being an evening type is currently unclear.
Clock genes pose a strong candidate genes group for studying the genetic background of chronotype because they control the circadian rhythms and also play an important role in regulating energy homeostasis (Ribas-Latre and Eckel-Mahan, 2016; Reinke and Asher, 2019; Ashbrook et al., 2020). Consequently, a number of single nucleotide polymorphisms (SNP) of several clock genes (CLOCK, CRY1, PER1) have been associated with metabolic disturbances, obesity, and dietary habits (Ribas-Latre and Eckel-Mahan, 2016). However, previous candidate-gene approach studies on clock gene (e.g., CLOCK, PER2) associations of chronotype have been small-scale studies and yielded inconsistent results, as reviewed by von Schantz (2017). Furthermore, 4 genome-wide association studies (GWASs) of chronotype have identified a total of 351 independent loci associated with chronotype, including variants within clock genes, such as CRY1, PER2, and PER3, along with several other genes. These GWASs are based on 2 large cohorts, the 23andMe (Hu et al., 2016) and the UK biobank study (Jones et al., 2016; Lane et al., 2016), while the most recent one is a meta-analysis of these 2 cohorts (n = 697,828; Jones et al., 2019). These cohorts included a single self-evaluation question on chronotype. As for our data set, chronotype was assessed with 6 items of the original MEQ (Horne and Östberg, 1976) in addition to a single self-evaluation question, which increase the validity and specificity of the findings.
Our aim was to study the genetic associations of chronotype in the Finnish general population (n = 8433). First, we studied associations between chronotype and 20 known key clock genes, and we also attempted to replicate the previously reported associations within these genes and chronotype (e.g., Carpen et al., 2006; Etain et al., 2014; Song et al., 2016). Our second aim was to perform a full GWAS of chronotype. We also attempted to replicate the findings from the GWAS meta-analysis of chronotype (Jones et al., 2019). Our third aim was to develop a genetic risk score (GRS) for chronotype based on the 351 lead SNPs (SNPs with the smallest p values for certain locus) from the GWAS of Jones et al. (2019).
Methods
Study Population
This study included participants from the population-based cross-sectional National FINRISK 2007 (Vartiainen et al., 2010) and 2012 (Borodulin et al., 2015) studies. The FINRISK studies monitored trends in risk factors of noncommunicable diseases in the Finnish population and have been conducted every 5 years since 1972. Random samples (n = 9958 in 2007 and n = 9905 in 2012) of men and women were selected from the National Population Register covering the age groups between 25 and 74 years. The studies included self-administered questionnaires (e.g., questions on timing of daily activities and socioeconomic status) and a health examination (e.g., blood samples) conducted between January and March for FINRISK 2007 and between January and April for FINRISK 2012. Overall, 6258 persons participated in 2007 (participation rate 63%) and 5827 in 2012 (participation rate 59%). Our final sample included 8433 participants with chronotype and genetic data available.
FINRISK 2007 and FINRISK 2012 adhered to the guidelines of the Declaration of Helsinki. The Ethics Committee of the Hospital District of Helsinki and Uusimaa approved the research protocols. All participants signed the informed consent.
Chronotype Assessment
We assessed chronotype using the following 2 methods: a shortened 6-item version of Horne and Östberg’s (1976) MEQ (sMEQ) and a single self-evaluation question on chronotype from the sMEQ.
sMEQ
The sMEQ included 6 items (items 4, 7, 9, 15, 17, and 19) from the original MEQ, accounting for 83% of the variance of the original (Hätönen et al., 2008; Suppl. Table S1). The answers to these items were scored according to the scoring of the original MEQ, and the final sum score of the sMEQ varied from 5 (extreme eveningness) to 27 (extreme morningness). In the analyses, the sum score was used either as a continuous (continuous sMEQ score) or as a binary variable (evening type: scores from 5 to 15, morning type: scores from 16 to 27; binary sMEQ score). In our study population, there were 7436 participants with complete information on genetics and on sMEQ, and they were included in the sMEQ analysis.
Single self-evaluation question on chronotype
In addition, we assessed chronotype with the single self-evaluation question on chronotype from the questionnaire (item 19): “There are so-called morning people and evening people, which are you?” (Suppl. Table S1). The question was used as a binary variable (single-item chronotype), in which those who replied either “rather more an evening than a morning type” or “definitely an evening type” were regarded as evening types, and those who replied “definitely a morning type” or “rather more a morning than an evening type” were regarded as morning types. In our study population, there were 8433 participants with complete information on genetics and on the single self-evaluation question, and they were included in the analysis of single-item chronotype.
In addition, we conducted a stepwise linear regression analysis to determine which of the 6 MEQ items (independent variables) explained the greatest proportion of variance in the final sum score of the sMEQ (dependent variable). The single item 19 (standardized β = −0.456) predicted 77% of the variance (adjusted R2 = 0.767) in the final sum score of the sMEQ. The single item 19 also correlated with the final sum score of the sMEQ (r = −0.876).
Genotyping and Quality Control
At the FINRISK study sites, trained study nurses took whole-blood samples, which were stored at −70 °C. DNA was extracted at the Finnish Institute for Health and Welfare and genotyped in several batches at the Sanger Institute, Broad Institute, or Institute for Molecular Medicine Finland using the following Illumina GWAS arrays: HumanCoreExome, Omniexpress, and 610K. Our data included 5 batches, of which 4 were substudies of FINRISK 2007 (including COROGENE controls (610K), PREDICTCVD cases, and controls (Omniexpress); the rest were included in 2 batches with (HumanCoreExome) 1 batch including participants from FINRISK 2012 (HumanCoreExome). The same standard quality control methods and standard imputation procedures were centrally applied for the data from each platform, after which a joint quality control (minor allele frequency ≥0.05 [5%], Hardy-Weinberg equilibrium p > 1 × 10⁻⁷, imputed information score [INFO] >0.7, and missing proportion <0.02 [2%]) was performed to harmonize the data content. The genotyping and imputation were performed as described in Locke et al. (2019). For each cohort, before phasing, we performed batchwise genotype quality control using standard quality thresholds. We prephased the array genotypes with Eagle (v2.3; Loh et al., 2016) and imputed genotypes genome-wide with IMPUTE (v2.3.1; Howie et al., 2009) using 2690 sequenced Finnish genomes and 5092 sequenced Finnish exomes. We assessed imputation quality by confirming sex, comparing sample allele frequencies with reference population estimates, and examining imputation quality (INFO score) distributions. We excluded any variant with INFO <0.7 within a given batch from all replication/follow-up analyses. Furthermore, we also excluded closely related individuals (n = 125) from the final data set (PLINK pi_hat >0.20). In total, genotyping was performed for 5330 FINRISK 2007 participants and for 3439 FINRISK 2012 participants.
Key Clock Genes
The clock gene analyses included 20 known key clock genes (ARNTL, ARNTL2, BHLHE40, BHLHE41, CLOCK, CRY1, CRY2, CSNK1E, CSNK1D, NFIL3, NPAS2, NR1D1, NR1D2, PER1, PER2, PER3, RORA, RORB, RORC, TIMELESS; Hayes et al., 2005; Takahashi, 2017; Sato et al., 2018; Kurien et al., 2019; Patke et al., 2019). Of the total 8668 SNPs within these clock genes, 4022 SNPs (Suppl. Table S2) passed the quality control and were included in the study. For the replication analyses, we selected altogether 66 SNPs that have previously been associated with chronotype within the following genes: ARNTL, ARNTL2, CLOCK, CRY1, NFIL3, NPAS2, PER1, PER2, PER3, RORC, and TIMELESS (Suppl. Table S3; (Katzenberg et al., 1998; Carpen et al., 2005; Mishima et al., 2005; Carpen et al., 2006; Matsuo et al., 2007; Lee et al., 2011; Kripke et al., 2014; Etain et al., 2014; Parsons et al., 2014; Song et al., 2016; Dmitrzak-Weglarz et al., 2016; Jankowski and Dmitrzak-Weglarz, 2017; Jones et al., 2019).
Genome-wide Association Analyses
For the GWAS analyses, there were altogether 12,954,971 SNPs, of which 5,842,835 passed the quality control and were included in the GWAS analyses.
For the replication analysis, we selected the top 10,000 genome-wide associated SNPs reported in the GWAS of Jones et al. (2019), of which our data included 7741 after the quality control (Suppl. Table S4). The meta-analysis was based on 2 cohorts, the 23andMe and the UK biobank study, both of which included the self-evaluation question on chronotype. The 23andMe cohort included 2 identically worded questions: “Are you naturally a night person or a morning person?” The first of these identical questions included the following options: “night person,” “morning person,” “neither,” “it depends,” or “I’m not sure,” whereas the second of questions included the responses “night owl,” “early bird,” and “neither.” The UK Biobank used the following question: “There are so-called morning people and evening people, which are you?” with the following answer options: “definitely a ‘morning’ person,” “more a ‘morning’ than ‘evening’ person,” “more an ‘evening’ than a ‘morning’ person,” “definitely an ‘evening’ person,” “do not know,” and “prefer not to answer.” This question was a modification of the original MEQ item 19 (“One hears about ‘morning’ and ‘evening’ types of people. Which ONE of these types do you consider yourself to be?”).
Genetic Risk Score
We developed a weighted GRS for chronotype based on 351 lead SNPs from the GWAS of Jones et al. (2019). By using external weights from an independent study, our model is less prone to be overfitted. Of the 351 SNPs, our data included 313 after the quality control (Suppl. Table S5). The GRS was created by summing the total number of minor alleles weighted by their corresponding regression coefficients for risk of being an evening type for our analysis based on the GWAS study (Jones et al., 2019) for each participant. For our analyses, we reversed the direction of the regression coefficients, since the coefficients were originally reported for risk of being a morning type. Furthermore, we also analyzed the individual associations of these 313 SNPs with chronotype.
Statistical Analysis
All of the analyses have been conducted with linear (semicontinuous chronotype) and logistic (binary chronotype) regression models assuming additive effects and adjusted for age, sex, genotyping batch, and 5 first principal components to account for population stratification and other spurious effects. The p values were corrected for multiple testing with the Benjamini-Hochberg (BH) and Benjamini-Yekutieli (BY) false-discovery rate methods, with p values <0.05 considered significant in all analysis except for the full GWAS analysis of chronotype. For the full GWAS, analysis results were considered as genome-wide significant for p values <5 × 10⁻⁸ and suggestive for p values <1 × 10⁻⁵. Furthermore, in the clock gene analysis, significantly associated SNPs were further linkage disequilibrium (LD) clumped (using clump in PLINK, with a threshold p < 0.05, r2 > 0.5, range: 250 kb) based on BH- and BY-corrected p values to reveal independent association signals. With regard to GRS, we estimated the proportion of variance explained with adjusted partial R2 (continuous sMEQ) and partial pseudo R2 (Nagelkerke; binary chronotype), using the R package “rsq.”
Statistical analyses have been conducted with PLINK version 2.0 (Chang et al., 2015) and version 1.9 (LD clumping) and with the R statistical computing program, version 3.5.1 (R Core Team, 2018).
Results
In our data, 32% of the participants were evening types (59% women) according to binary sMEQ score, whereas according to the single-item chronotype, 45% of the participants considered themselves as being more of an evening (52% women) than a morning type (Table 1). Furthermore, the evening types were on average 5 years younger than morning types in both chronotype assessments.
Characteristics of the study population by chronotype with means and standard deviations (SD).
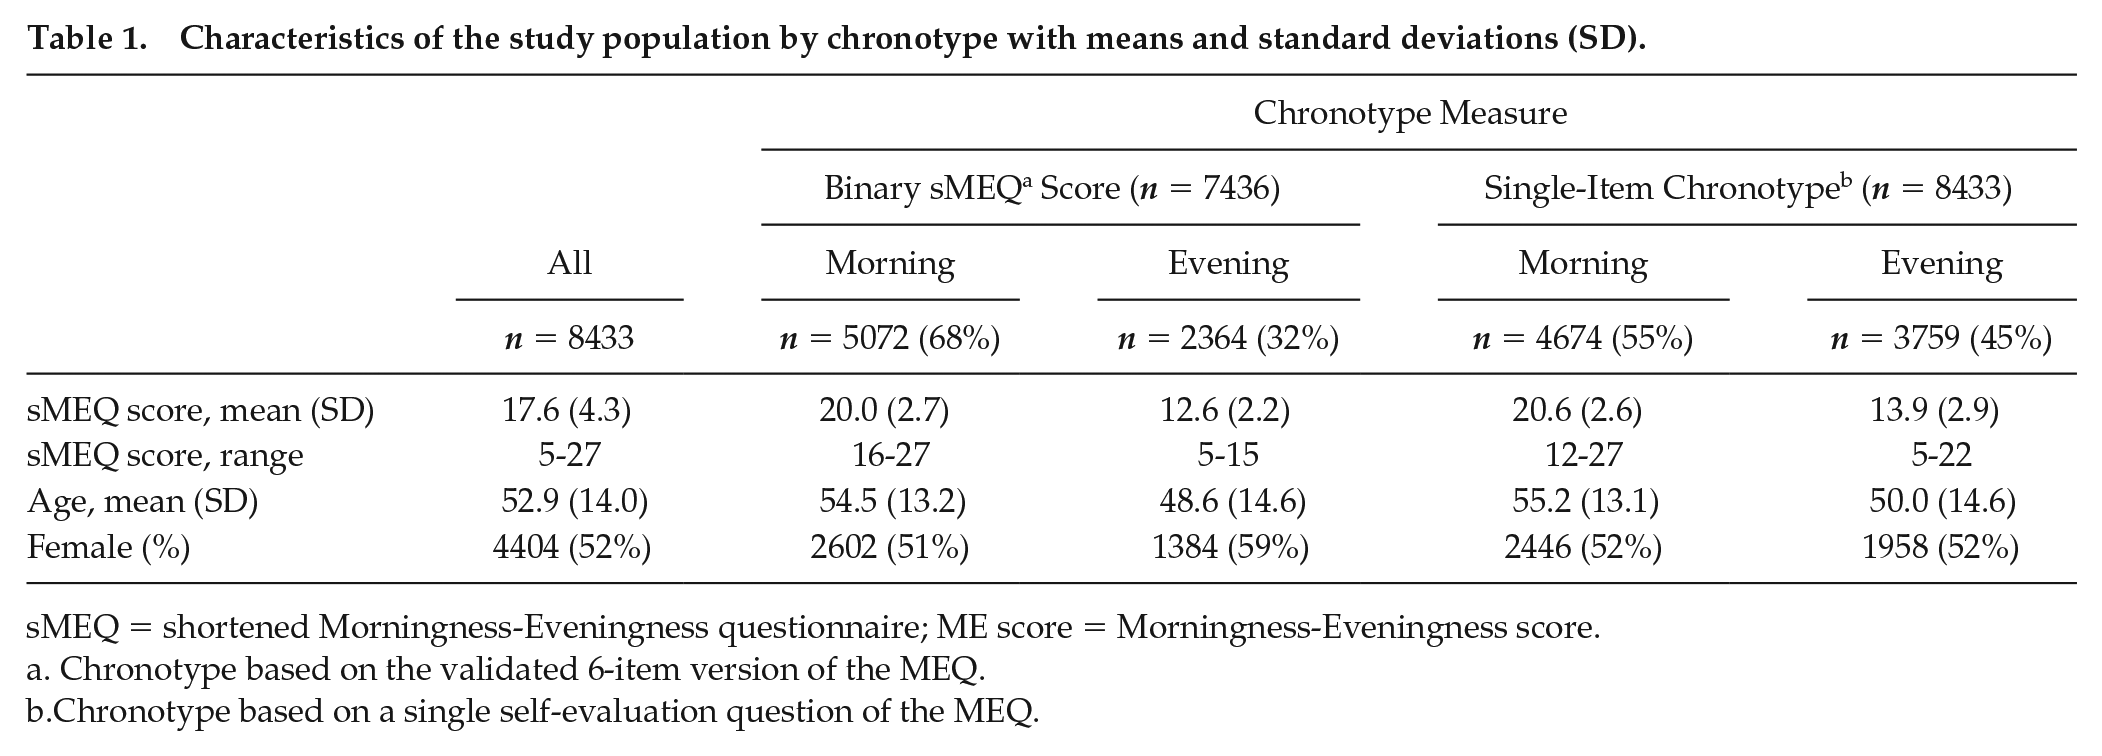
sMEQ = shortened Morningness-Eveningness questionnaire; ME score = Morningness-Eveningness score.
Chronotype based on the validated 6-item version of the MEQ.
Chronotype based on a single self-evaluation question of the MEQ.
Key Clock Gene Associations of Chronotype
When p values were corrected for multiple testing with the BH method, altogether 124 SNPs within 3 clock genes (CRY1, NFIL3, NR1D2 aka Rev-erbβ) were associated with continuous sMEQ score and single-item chronotype, whereas no associations were found by binary sMEQ score (Suppl. Table S2). These significant associations were further LD clumped (with threshold p < 0.05), which resulted in altogether 7 independent association signals. Within CRY1, 3 independent association signals with evening chronotype emerged. Two of the signals (lead SNPs rs8192440, with 39 correlated SNPs, and rs77706154) emerged with both continuous sMEQ score and single-item chronotype containing a correlated SNP (rs1017168A) that has previously been associated with evening type (Jones et al., 2019; Suppl. Table S3). One of the 3 signals within CRY1 emerged solely with continuous sMEQ score (lead SNP rs3741891, with 43 correlated SNPs; Suppl. Table S2). Within NFIL3, 3 independent signals with morning chronotype emerged. One of the signals was found with both continuous sMEQ score (lead SNP rs2482702, with 5 correlated SNPs) and single-item chronotype (lead SNP rs9409419, with 6 correlated SNPs). One signal emerged solely with continuous sMEQ score (lead SNP rs2440590, with 4 correlated SNPs) and another one solely with single-item chronotype (lead SNP rs2440592, with 4 correlated SNPs) containing a correlated SNP (rs2482705A) that has previously been associated with morning type (Kripke et al., 2014; Suppl. Table S3). Within NR1D2, 1 independent association signal with evening chronotype emerged with both continuous sMEQ score and single-item chronotype (lead SNP rs4131403, with 21 correlated SNPs; Suppl. Table S2).
When the more conservative method of false-discovery rate (BY) was applied for p values, altogether 22 SNPs in NR1D2 (Rev-erbβ) remained significantly associated with continuous sMEQ score and single-item chronotype, whereas all the other associations attenuated (Table 2). These significant SNPs represented 1 independent association signal (lead SNP: rs4131403).
Significant clock gene associations of chronotype (BETA and OR are for A1).
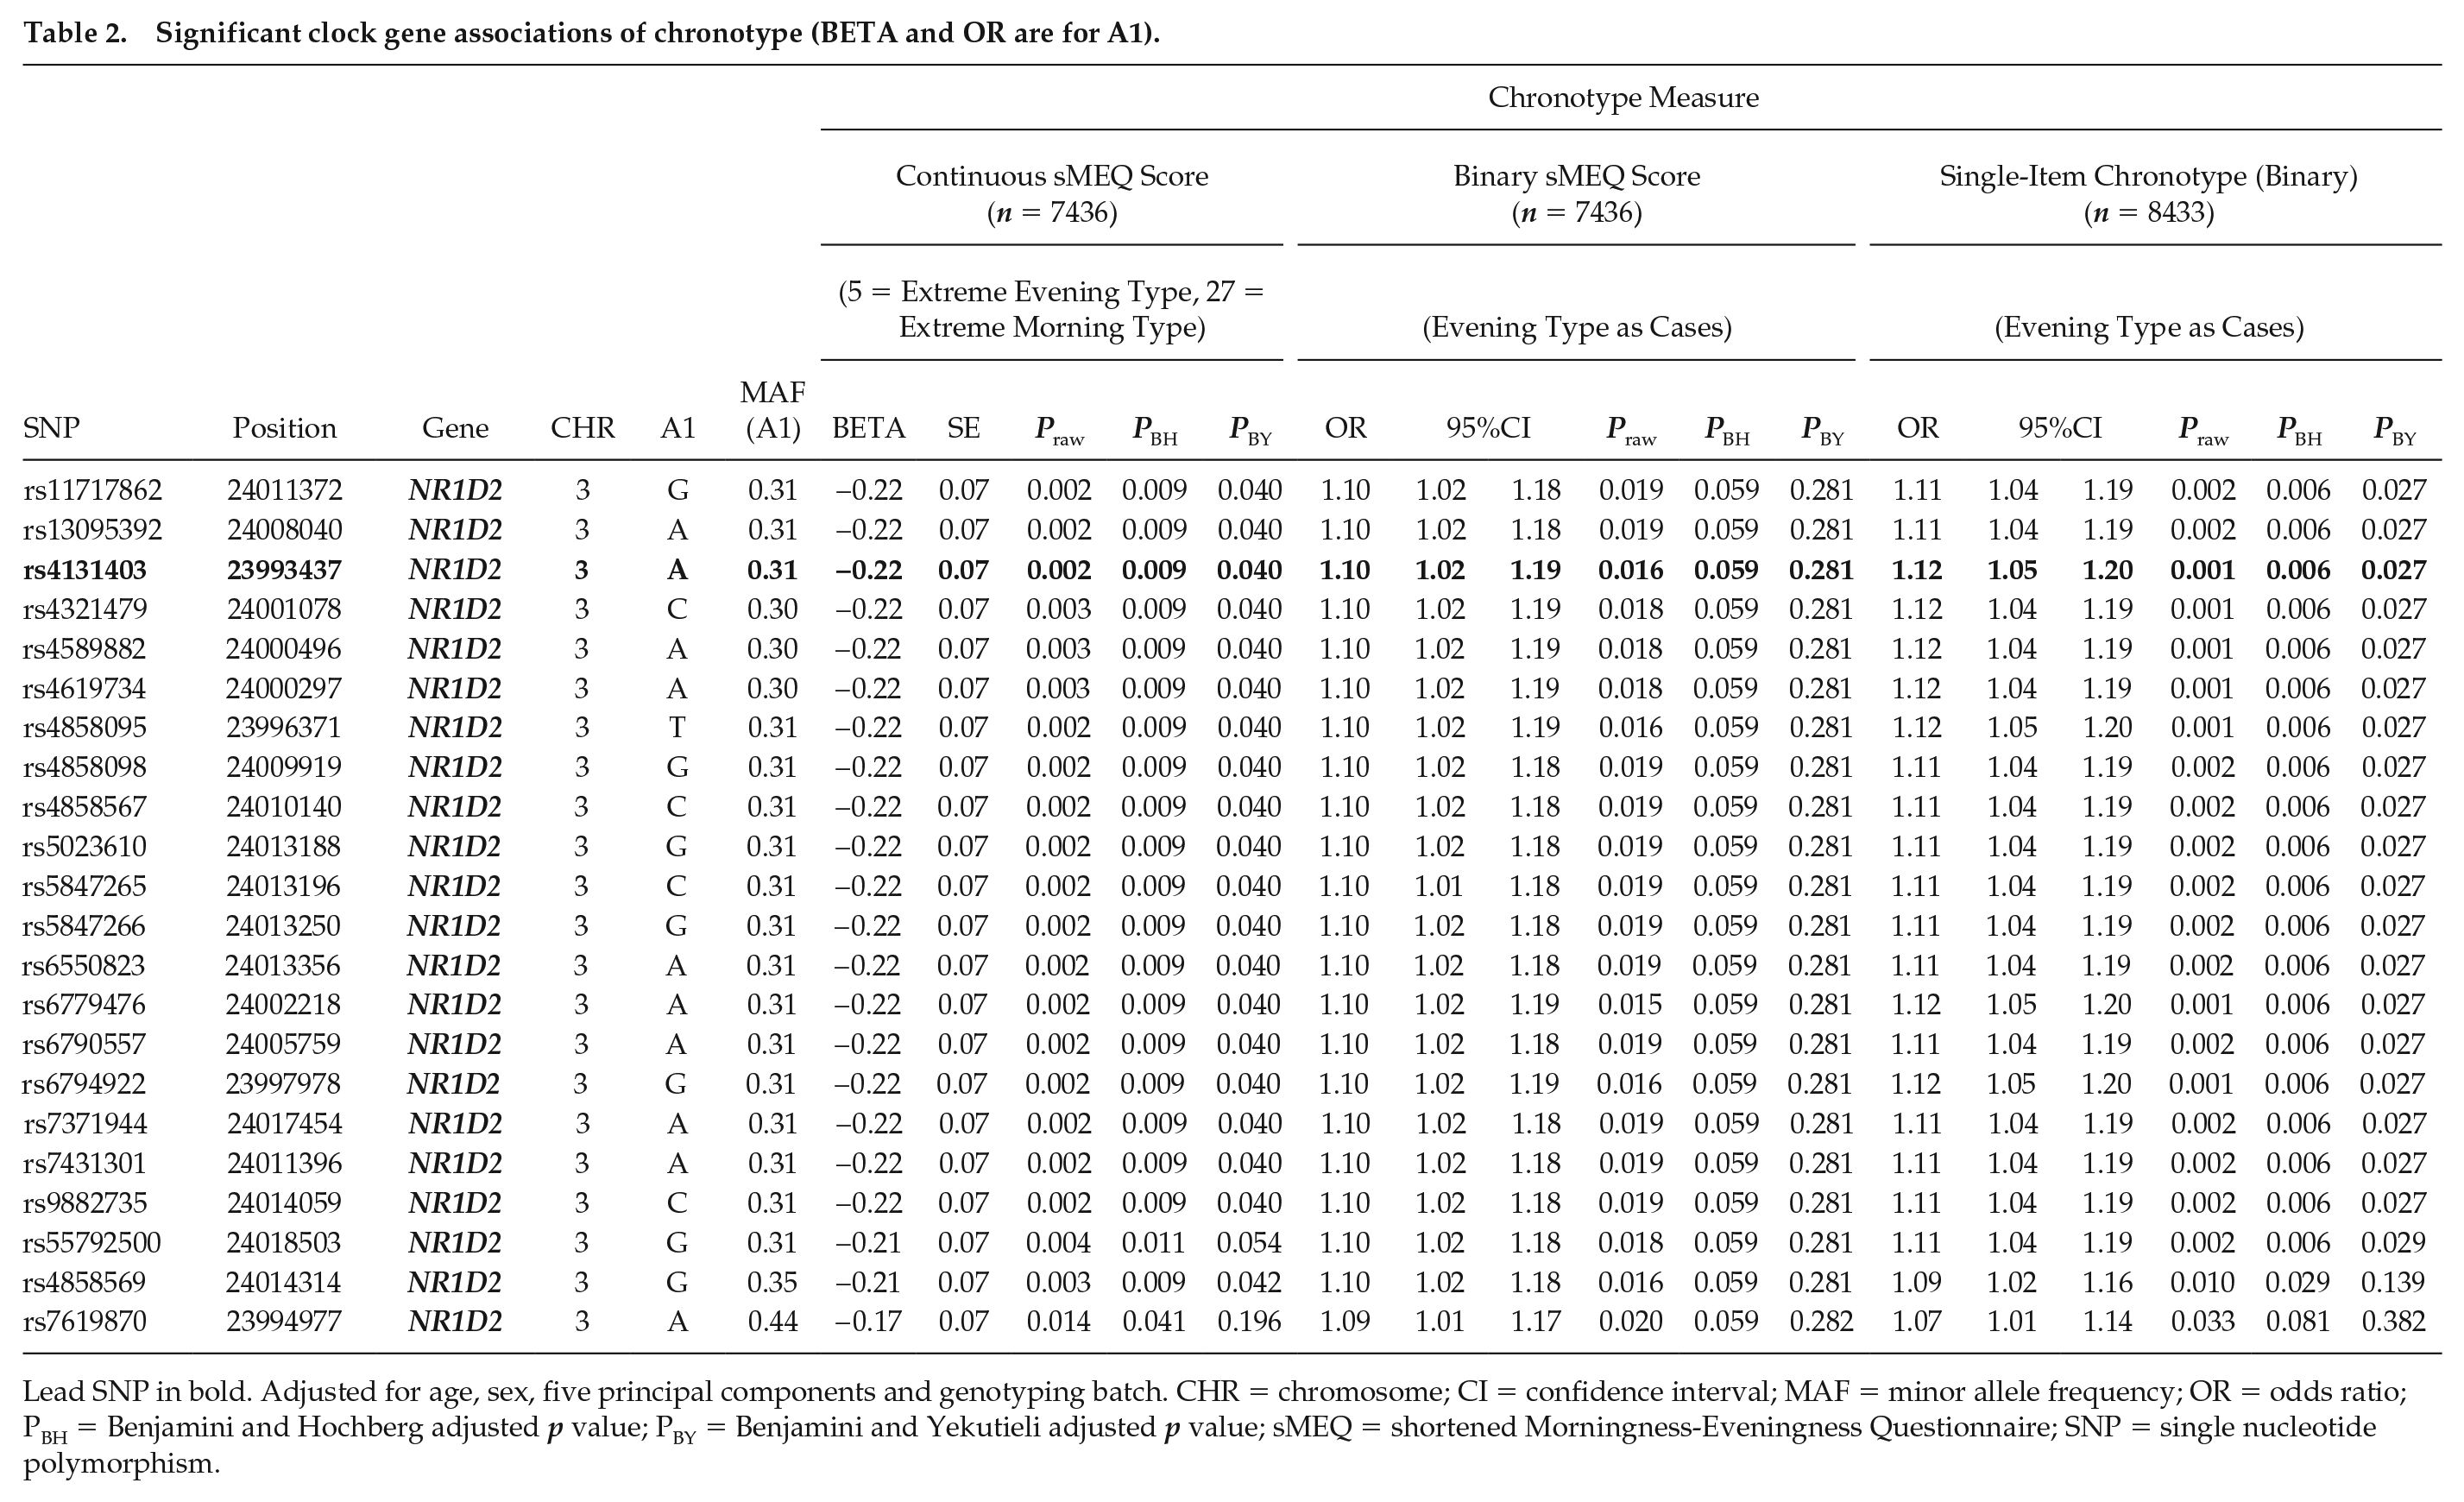
Lead SNP in bold. Adjusted for age, sex, five principal components and genotyping batch. CHR = chromosome; CI = confidence interval; MAF = minor allele frequency; OR = odds ratio; PBH = Benjamini and Hochberg adjusted p value; PBY = Benjamini and Yekutieli adjusted p value; sMEQ = shortened Morningness-Eveningness Questionnaire; SNP = single nucleotide polymorphism.
GWAS of Chronotype
Our GWAS of chronotype did not yield genome-wide significant associations (p < 5 × 10⁻⁸; Suppl. Figs. 1–3). However, there were few suggestive (p < 1 × 10⁻⁵) associations found, of which 1 intergenic SNP (rs79036472) emerged in continuous and binary sMEQ scores (Suppl. Table S6; Suppl. Figs. S1–3). Furthermore, these suggestive SNPs were not among the top 10,000 genome-wide associated SNPs reported in the GWAS of Jones et al. (2019). In addition, we sought to replicate our suggestive findings in the UK Biobank data only, which was available for download at http://www.kp4cd.org/dataset_downloads/sleep. This summary data included 5309 additional genome-wide significant SNPs, which were not among the reported top 10,000 SNPs of the meta-analysis. No evidence of replication of our suggestive findings was found among those SNPs either.
Replication of the Previous GWAS of Chronotype
We attempted to replicate the top 10,000 genome-wide associated SNPs from the previous GWAS meta-analysis of Jones et al. (2019), with p values <0.05 considered significant. Overall, our data included 7741 of the 10,000 SNPs, and the results did not reach statistical significance (p > 0.05) in any of the chronotype assessments, but the directions of the effects of the variants were mostly in the same direction (Suppl. Table S4; Suppl. Fig. S4). For the continuous sMEQ score, 80.1% (6202 of 7741) of the variants had the same direction of effect as the meta-analysis (binomial test p < 2.2 × 10⁻¹⁶); for the binary sMEQ score, 82.8% (6409 of 7741) of the variants had the same direction (binomial test p < 2.2 × 10⁻¹⁶); and for the single-item chronotype, 87.4% (6766 of 7741) of the variants had the same direction of effect as the meta-analysis (binomial test p < 2.2 × 10⁻¹⁶).
GRS for Chronotype
We developed a GRS for chronotype based on 313 lead SNPs from the recent GWAS meta-analysis (Jones et al., 2019; Suppl. Table S5). Higher GRS was associated with evening type in both chronotype assessments: for the continuous sMEQ score, beta −0.49 (s.e. 0.05), p = 1.4 × 10⁻²⁴; for the binary sMEQ score, odds ratio (OR) 1.24 (95% confidence interval [CI] 1.18-1.30), p = 1.7 × 10⁻¹⁶; for the single-item chronotype, OR 1.30 (95% CI 1.24-1.37), p = 4.3 × 10⁻²⁷ (Table 3). The GRS association was strongest for the single-item chronotype, with a slightly higher proportion of variance explained (for the continuous sMEQ score: R2 = 0.01387; for the binary sMEQ score: Nagelkerke’s pseudo R2 = 0.01312; for the single-item chronotype: Nagelkerke’s pseudo R2 = 0.01893). However, no associations were found when we studied the associations between the individual SNPs of the GRS and chronotype, but directions of effects of the variants were mostly in the same direction (Suppl. Table S5; Suppl. Fig. S5). For the continuous sMEQ score, 70.9% (222 of 313) of the variants had the same direction of effect as the meta-analysis (binomial test p = 4.4 × 10⁻¹⁴). For the binary sMEQ score, 60.7% (190 of 313) of the variants had the same direction of effect (binomial test p = 9.1 × 10−05), and for the single-item chronotype, 72.2% (226 of 313) of the variants had the same direction of effect as the meta-analysis (binomial test p = 1.1 × 10⁻¹⁵).
Linear or logistic regression analysis of genetic risk score (GRS) association with chronotype based on 313 chronotype-associated SNPs (Jones et al., 2019).
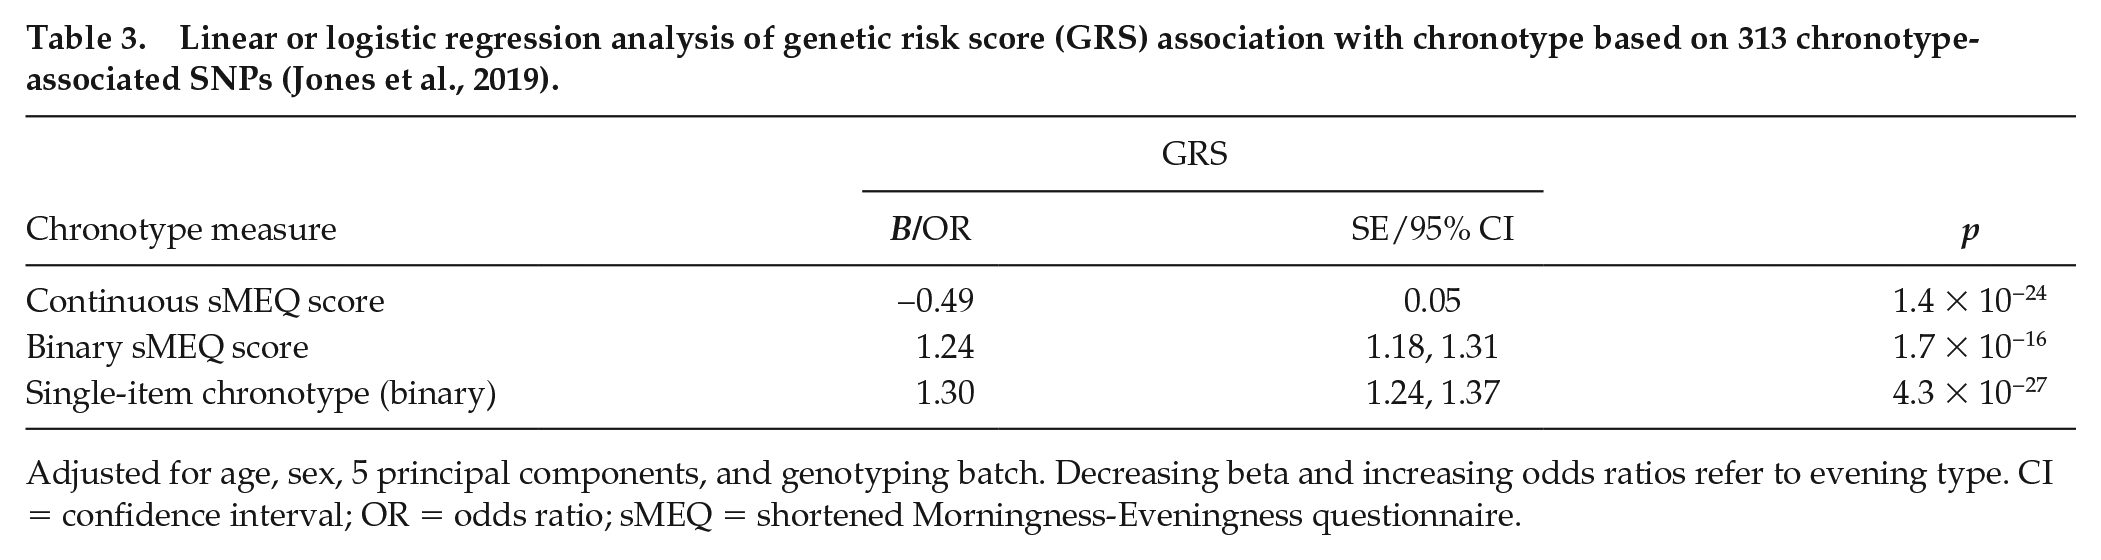
Adjusted for age, sex, 5 principal components, and genotyping batch. Decreasing beta and increasing odds ratios refer to evening type. CI = confidence interval; OR = odds ratio; sMEQ = shortened Morningness-Eveningness questionnaire.
Discussion
To the best of our knowledge, this is the first larger-scale study on the genetic associations of chronotype with a validated chronotype questionnaire. We found a novel genetic association of chronotype with 1 clock gene NR1D2 (Rev-erbβ). However, the GWAS analysis of chronotype did not yield any genome-wide significant associations; neither could we replicate any of the individual SNP associations from the previous GWAS study of chronotype (Jones et al., 2019). Furthermore, higher scores in GRS were associated with evening chronotype in our study population.
Although we could not replicate the previously reported associations between chronotype and SNPs within clock genes in our study population (e.g., Carpen et al., 2006; Etain et al., 2014; Song et al., 2016; Jones et al., 2019), we found an association between chronotype (as based on the continuous sMEQ score as well as on the single-item chronotype) and the NR1D2 gene. Earlier, NR1D2 has been associated with a difference in timing of expression between extreme morning types and extreme evening types (Ferrante et al., 2015). The circadian clock machinery is composed of a core transcription-translation feedback loop and additional interlocking loops of transcriptional activators and repressors (Liu et al., 2008). The core feedback loop is composed of transcriptional activators CLOCK and ARNTL (BMAL1), which form a heterodimer that activates the transcription of PER 1-2 and CRY 1-2 genes, whose protein products form a repressor complex that inhibits their own transcription (Takahashi, 2017). The NR1D2 gene encodes a repressor in an additional feedback loop that controls ARNTL transcription with retinoic acid orphan receptors (RORs) as opposing activators, where NR1D2 and NR1D1 play a more prominent role than the RORs in the basic clock mechanism to control rhythmic transcription of clock output genes (Liu et al., 2008). Furthermore, NR1D2 has a role in carbohydrate and lipid metabolism. In the liver, NR1D2 regulates hepatic lipid metabolism by repressing the expression of apolipoprotein C-III (Wang et al., 2007). In the skeletal muscle, NR1D2 controls the lipid and energy homeostasis by repressing several genes (e.g., CD36, FABP3, UCP3, SCD1, and MSTN) involved in lipid metabolism, body fat accumulation, and muscle hypertrophy and hyperplasia and by inducing the expression of interleukin-6 that regulates energy expenditure and inflammation (Ramakrishnan et al., 2005). Mouse studies have demonstrated that administration of synthetic NR1D2 ligands altered the expression of the circadian genes in the hypothalamus and metabolic genes in the liver, skeletal muscle, and adipose tissue, resulting in increased energy expenditure (Solt et al., 2012). Furthermore, mice with diet-induced obesity reduced fat mass and improved dyslipidemia and hyperglycemia after treatment of NR1D2 agonist (Solt et al., 2012).
These findings are supported by strong evidence from observational studies on the associations between evening chronotype and higher risks for metabolic diseases (Merikanto et al., 2013; Yu et al., 2015; Knutson and von Schantz, 2018). Furthermore, some studies have found associations between a higher body mass index or obesity and chronotype (Celis-Morales et al., 2017; de Punder et al., 2019; Sun et al., 2020), but these associations have not been confirmed among our study population (Maukonen et al., 2019). Future studies should examine in more detail the metabolic aspect of the association between NR1D2 gene and chronotype.
All of the specific SNPs within NR1D2 were intronic variants, and their function is unclear. Future experiments should further characterize these SNPs to inform us about their function. Furthermore, the minor allele frequencies of these SNPs were slightly lower in the Finnish population as compared with non-Finnish Europeans and the overall minor allele frequencies for all ethnic groups (https://gnomad.broadinstitute.org).
We did not find any genome-wide significant associations in our GWAS of chronotype. This could be due to our rather small sample size in terms of GWAS studies, with limited power to detect genome-wide associations. However, we found some suggestive findings, of which 1 intergenic variant (rs79036472) emerged in the analyses using continuous as well as binary sMEQ scores. Although these suggestive associations have not been found in the GWAS of Jones et al. (2019) and we were unable to replicate any of the findings from the previous GWAS, the directions of the effects of the variants were mostly in the same direction, showing a good consistency between our results and the GWAS of Jones et al. (2019).
The GRS was associated with chronotype in our study population and accounted for ~1.3% (binary sMEQ), ~1.4% (continuous sMEQ), and ~1.9% (single-item chronotype) of chronotype variation. The heritability estimates from twin studies show a range from 37% to 54% (Hur et al., 1998; Koskenvuo et al., 2007; Barclay et al., 2010; Watson et al., 2013), and in Finland, the estimate for additive genetic effects was 12% (Koskenvuo et al., 2007). The slightly stronger association found with single-item chronotype is likely because the 313 SNPs of the GRS were taken from data in which chronotype assessment was based on the single-item chronotype (Jones et al., 2019). Furthermore, because these SNPs and their effects were taken from data sets independent of ours, these results also increase the validity of our findings. The association between GRS based on external weights from independent data sets and chronotype was also found in a recent Spanish study (n = 1693) with overweight and obese participants with 15 SNPs that have previously been associated with chronotype (Vera et al., 2018). Together, these findings support the idea that the GRS based on GWAS studies may be a useful tool for capturing the genetic component of chronotype in different populations.
Furthermore, although we assessed chronotype with a validated and more detailed questionnaire in addition to the simple self-evaluation question on chronotype, the chronotype assessment was still based on self-report and thus is subject to possible reporting biases.
In conclusion, our findings indicated novel genetic associations of chronotype with the NR1D2 (Rev-erbβ) clock gene, which has a previously reported role in energy and lipid metabolism. Furthermore, GRS based on GWAS studies of chronotype may be a useful tool in capturing the genetic aspect of chronotype in different populations. However, more large-scale GWASs of chronotype are warranted in the future, with validated questionnaire-based chronotype assessments.
Supplemental Material
Supplemental_Figure1_R1_manhattan – Supplemental material for Genetic Associations of Chronotype in the Finnish General Population
Supplemental material, Supplemental_Figure1_R1_manhattan for Genetic Associations of Chronotype in the Finnish General Population by Mirkka Maukonen, Aki S. Havulinna, Satu Männistö, Noora Kanerva, Veikko Salomaa and Timo Partonen in Journal of Biological Rhythms
Supplemental Material
Supplemental_Figure2_R1_manhattan – Supplemental material for Genetic Associations of Chronotype in the Finnish General Population
Supplemental material, Supplemental_Figure2_R1_manhattan for Genetic Associations of Chronotype in the Finnish General Population by Mirkka Maukonen, Aki S. Havulinna, Satu Männistö, Noora Kanerva, Veikko Salomaa and Timo Partonen in Journal of Biological Rhythms
Supplemental Material
Supplemental_Figure3_R1_manhattan – Supplemental material for Genetic Associations of Chronotype in the Finnish General Population
Supplemental material, Supplemental_Figure3_R1_manhattan for Genetic Associations of Chronotype in the Finnish General Population by Mirkka Maukonen, Aki S. Havulinna, Satu Männistö, Noora Kanerva, Veikko Salomaa and Timo Partonen in Journal of Biological Rhythms
Supplemental Material
Supplemental_Figure4_R1_scatterplot – Supplemental material for Genetic Associations of Chronotype in the Finnish General Population
Supplemental material, Supplemental_Figure4_R1_scatterplot for Genetic Associations of Chronotype in the Finnish General Population by Mirkka Maukonen, Aki S. Havulinna, Satu Männistö, Noora Kanerva, Veikko Salomaa and Timo Partonen in Journal of Biological Rhythms
Supplemental Material
Supplemental_Figure5_R1_scatterplot – Supplemental material for Genetic Associations of Chronotype in the Finnish General Population
Supplemental material, Supplemental_Figure5_R1_scatterplot for Genetic Associations of Chronotype in the Finnish General Population by Mirkka Maukonen, Aki S. Havulinna, Satu Männistö, Noora Kanerva, Veikko Salomaa and Timo Partonen in Journal of Biological Rhythms
Supplemental Material
Supplemental_Table2_R2 – Supplemental material for Genetic Associations of Chronotype in the Finnish General Population
Supplemental material, Supplemental_Table2_R2 for Genetic Associations of Chronotype in the Finnish General Population by Mirkka Maukonen, Aki S. Havulinna, Satu Männistö, Noora Kanerva, Veikko Salomaa and Timo Partonen in Journal of Biological Rhythms
Supplemental Material
Supplemental_Table3_R2 – Supplemental material for Genetic Associations of Chronotype in the Finnish General Population
Supplemental material, Supplemental_Table3_R2 for Genetic Associations of Chronotype in the Finnish General Population by Mirkka Maukonen, Aki S. Havulinna, Satu Männistö, Noora Kanerva, Veikko Salomaa and Timo Partonen in Journal of Biological Rhythms
Supplemental Material
Supplemental_Table4_R2 – Supplemental material for Genetic Associations of Chronotype in the Finnish General Population
Supplemental material, Supplemental_Table4_R2 for Genetic Associations of Chronotype in the Finnish General Population by Mirkka Maukonen, Aki S. Havulinna, Satu Männistö, Noora Kanerva, Veikko Salomaa and Timo Partonen in Journal of Biological Rhythms
Supplemental Material
Supplemental_Table5_R2 – Supplemental material for Genetic Associations of Chronotype in the Finnish General Population
Supplemental material, Supplemental_Table5_R2 for Genetic Associations of Chronotype in the Finnish General Population by Mirkka Maukonen, Aki S. Havulinna, Satu Männistö, Noora Kanerva, Veikko Salomaa and Timo Partonen in Journal of Biological Rhythms
Supplemental Material
Supplemental_Table6_R2 – Supplemental material for Genetic Associations of Chronotype in the Finnish General Population
Supplemental material, Supplemental_Table6_R2 for Genetic Associations of Chronotype in the Finnish General Population by Mirkka Maukonen, Aki S. Havulinna, Satu Männistö, Noora Kanerva, Veikko Salomaa and Timo Partonen in Journal of Biological Rhythms
Supplemental Material
Supplemental_Table_1_R2 – Supplemental material for Genetic Associations of Chronotype in the Finnish General Population
Supplemental material, Supplemental_Table_1_R2 for Genetic Associations of Chronotype in the Finnish General Population by Mirkka Maukonen, Aki S. Havulinna, Satu Männistö, Noora Kanerva, Veikko Salomaa and Timo Partonen in Journal of Biological Rhythms
Footnotes
Acknowledgements
M.M. was supported by the doctoral program in population health of the University of Helsinki, the Juho Vainio Foundation, and the Finnish Cultural Foundation. A.S.H. was supported by the Academy of Finland, grant 321356. V.S. was supported by the Finnish Foundation for Cardiovascular Research.
Conflict of Interest Statement
Dr. Salomaa has received honoraria for consultations from Novo Nordisk and Sanofi and travel support from Novo Nordisk. He also has an ongoing research collaboration with Bayer Ltd. (all unrelated to the present study). The other authors declare no conflict of interest.
Data Availability
Notes
References
Supplementary Material
Please find the following supplemental material available below.
For Open Access articles published under a Creative Commons License, all supplemental material carries the same license as the article it is associated with.
For non-Open Access articles published, all supplemental material carries a non-exclusive license, and permission requests for re-use of supplemental material or any part of supplemental material shall be sent directly to the copyright owner as specified in the copyright notice associated with the article.