
Abstract
The intrinsically photosensitive retinal ganglion cells are the main conduit of the light signal emanating from the retina to the biological clock located in the suprachiasmatic nuclei of the hypothalamus. Lighting manufacturers are developing white light sources that are devoid of wavelengths around 480 nm (“cyan gap”) to reduce their impact on the circadian system. The present study was designed to investigate whether exposure to a “cyan-gap,” 3000 K white light source, spectrally tuned to reduce radiant power between 475 and 495 nm (reducing stimulation of the melanopsin-containing photoreceptor), would suppress melatonin less than a conventional 3000 K light source. The study’s 2 phases employed a within-subjects experimental design involving the same 16 adult participants. In Phase 1, participants were exposed for 1 h to 3 experimental conditions over the course of 3 consecutive weeks: 1) dim light control (<5 lux at the eyes); 2) 800 lux at the eyes of a 3000 K light source; and 3) 800 lux at the eyes of a 3000 K, “cyan-gap” modified (3000 K mod) light source. The same protocol was repeated in Phase 2, but light levels were reduced to 400 lux at the eyes. As hypothesized, there were significant main effects of light level (F1,12 = 9.1, p < 0.05, ηp² = 0.43) and exposure duration (F1,12 = 47.7, p < 0.05, ηp² = 0.80) but there was no significant main effect of spectrum (F1,12 = 0.16, p > 0.05, ηp² = 0.01). There were no significant interactions with spectrum. Contrary to our model predictions, our results showed that short-term exposures (≤ 1 h) to “cyan-gap” light sources suppressed melatonin similarly to conventional light sources of the same CCT and photopic illuminance at the eyes.
Keywords
The human circadian clock “free runs” (i.e., cycles independently, without external cues) at a period that is slightly greater than 24 h. The 24-h LD pattern reaching the retina is the major synchronizer of the circadian clock to one’s local position on Earth (Czeisler et al., 1989; Khalsa et al., 2003; Zeitzer et al., 2000). A person whose circadian system is synchronized to local time is said to be entrained. Asynchrony or misalignment between the endogenous biological clock and the external LD cycle—as is likely for shift-workers or people experiencing rapid transmeridian travel—leads to circadian disruption. It is important to address disruption in circadian rhythms, as it has been associated with a series of decrements such as poor sleep, depression, increased risk for metabolic and cardiovascular disease, and a higher incidence of cancer in workers whose schedules involve evening and night shifts (Costa et al., 2013; Davis and Mirick, 2006; Karatsoreos, 2014; Maemura et al., 2007; Potter et al., 2016; Stevens et al., 2007; Young and Bray, 2007).
Nocturnal melatonin suppression is a primary outcome for characterizing the impact of light on the biological clock (Brainard et al., 2001; Thapan et al., 2001). Published psychophysical studies of nocturnal melatonin suppression using narrowband light sources have shown that the human circadian system is maximally sensitive to short-wavelength (“blue”) light, peaking close to 460 nm (Brainard et al., 2001; Thapan et al., 2001). Regarding nighttime exposures to broadband sources, past studies have demonstrated that filtering out short-wavelength light <530 nm from polychromatic white light sources limits the suppression of melatonin secretion in humans (Kayumov et al. 2005; Rahman et al., 2017; Sasseville et al., 2006; Van de Werken et al., 2013). Studies by Rahman et al. (2011) have further shown that filtering out short-wavelength energy <480 nm from a broadband light source prevents nocturnal melatonin suppression; however, significant suppression was recorded for the same light source when energy at only wavelengths <460 nm was filtered out.
It has been demonstrated that the intrinsically photosensitive retinal ganglion cells (ipRGCs) are the main conduit of the light signal emanating from the retina to the biological clock located in the suprachiasmatic nuclei (SCN) of the hypothalamus. The ipRGCs express melanopsin, which makes them intrinsically photosensitive, and in situ have a peak spectral sensitivity close to 480 nm (Bailes and Lucas, 2013). The peak spectral sensitivity to short-wavelength light observed for acute melatonin suppression at 460 nm cannot be exclusively attributed to this single type of photoreceptor. Rather, the ipRGCs receive input from more distal photoreceptors (i.e., rods and cones) in the process of circadian phototransduction (Foster et al., 1991; Hattar et al., 2003; Ruby et al., 2002).
Nevertheless, lighting manufacturers have begun developing white-light sources that are devoid of wavelengths around 480 nm to provide white light while avoiding circadian-effective light, categorizing these newly developed light sources as “cyan-deficient” or “cyan-gap”. A “cyan-gap” spectrum type has, for example, been employed in a recent study by Souman et al. (2018), who exposed 15 participants to 3 h of the same amount of photopic illuminance of white light with either low or high radiant power between 450 nm and 500 nm, which is close to the maximal sensitivity of the ipRGCs. Their results showed that melatonin suppression, calculated using area under the curve for 3 h, was significantly reduced for the “cyan-gap” source relative to the white light source without selective attenuation of short wavelengths between 450 nm and 500 nm. In another recent nighttime study involving 11 participants (aged 21 to 30 y), Allen et al. (2018) reported an increase in subjective sleepiness and salivary melatonin levels following exposure to a customized visual display unit (VDU) providing lower “melanopic stimulation” compared with a standard VDU, without changing the visual appearance of the display.
In the wake of these developments, the present study was designed to test the effectiveness of a newly developed “cyan-gap” LED light source on nighttime melatonin suppression. Unlike the white light source used in the Souman et al. studies (2700 K), which had enhanced radiant power at very short wavelengths (i.e., 410 nm), the light source used in the current study (3000 K mod) had enhanced radiant power at 450 nm and reduced radiant power between around 475 nm and 495 nm.
To predict the impact of this newly developed light source on melatonin suppression, this study employed the Rea et al. model of human circadian phototransduction (Rea and Figueiro, 2018; Rea et al., 2005; Rea et al., 2012), which is based in part on the light-induced nocturnal melatonin suppression data from Brainard et al. (2001) and Thapan et al. (2001). The model is constrained by the fundamental knowledge of retinal neurophysiology and neuroanatomy and provides a framework for depicting how classical photoreceptors (i.e., rods and cones) provide input to the ipRGCs. Mathematically, for any light source, the model converts the spectral irradiance at the eyes into circadian light (CLA), reflecting the spectral sensitivity of the circadian system, and then transforms it into a circadian stimulus (CS) value, reflecting the absolute sensitivity of the circadian system. Thus, CS is a measure of the effectiveness of the retinal light stimulus for the human circadian system from threshold (CS ≈ 0.1) to saturation (CS ≈ 0.7) after a 1-h exposure. Using the model calculations, it was hypothesized that the “cyan-gap” light source would induce a small (≈8% at both light levels) but significant reduction in melatonin suppression compared with a conventional 3000 K light source. It was also hypothesized that melatonin suppression would be significantly greater at higher light levels and with longer exposure durations.
Materials and Methods
Participant Selection
Sixteen adult participants (12 females, 4 males; mean age [SD] = 37.8 [13.9] y) were recruited for the study via personal referrals, word of mouth, Rensselaer Polytechnic Institute’s social media platform, and lists of participants from previous studies. All participants completed the protocol. Depicting the clock hour of mid-sleep times on free days, the participants’ mean (SD) Munich Chronotype Questionnaire score (Roenneberg et al., 2003) was 2.94 (1.29), indicating that they were neither extreme larks (early persons) nor extreme owls (late persons). The study was conducted in 2 phases (see Experimental Conditions) of 3 weeks each, with Phase 1 running from 10 February 2017 to 3 March 2017 and Phase 2 running from 7 April 2017 to 5 May 2017. All participants were pre-screened for major health problems such as bipolar disorder, seasonal depression, cardiovascular disease, diabetes, and high blood pressure. Participants were excluded from the experiment if they were taking any over-the-counter melatonin or prescription medications such as blood pressure medicine, antidepressants, sleep medicine, or beta-blockers. Participants’ reporting eye diseases, such as cataracts or glaucoma, were also excluded, as were participants who were identified by the study team as having color vision deficiency according to Ishihara color blindness tests (Ishihara, 1960). No participants were scheduled to undertake transmeridian travel over the course of each study phase.
To maintain a stable circadian melatonin rhythm, all participants were required to follow a consistent sleep-wake schedule during the week leading up to each experimental session, with bedtimes no later than 2300 h and wake times no later than 0730 h. Participants were also requested to refrain from caffeine consumption 12 h before the beginning of each experimental session. Given that all of the participants were full-time workers, their sleep schedules were presumed to be regular throughout the duration of the study.
This study conformed to the Code of Federal Regulations (CFR) document Protection of Human Subjects, 45 CFR 46, (2016), and international ethical standards (Portaluppi et al., 2010). It was reviewed, approved, and monitored by Rensselaer Polytechnic Institute’s Institutional Review Board. Informed consent was obtained from all study participants.
Experimental Conditions
The study’s 2 phases employed a within-subjects experimental design involving the same 16 participants to minimize the effects of potential confounding factors such as age and individual differences. During each phase, the participants reported to the Lighting Research Center’s laboratory in Troy, NY, on 3 nights that were separated by at least 1 week to allow for a washout period between the conditions. The participants were randomly divided into 3 groups (two groups of 5 and one group of 6 participants), and each group was exposed to a single experimental condition per session in a planned, counter-balanced order to avoid order effects. Each experimental session began with a 30-min dim light adaptation period that preceded presentation of the experimental conditions.
For each study phase, participants were exposed to 3 experimental conditions comprising one dim-light control condition and 2 lighting interventions derived from spectrally distinct white light sources: 3000 K and 3000 K “cyan-gap” modified (3000 K mod). On random allocation, the study phases delivered either high (Phase 1) or low (Phase 2) levels of the 2 intervention spectra at the participants’ eyes during separate sessions. The higher light level employed in Phase 1 (approximately 800 lux at the eyes), although not typically found in the built environment, was selected to maximize the signal-to-noise ratio and, therefore, reliably detect melatonin suppression from all participants. The lower light level employed in Phase 2 (approximately 400 lux at the eyes) was also selected because it would still maximize the signal-to-noise ratio and minimize the impact of individual differences in the response while being representative of light levels one can potentially experience in healthcare and commercial applications. These higher light levels would also minimize the impact of photic history on the experimental results. The dim-light control condition was employed to collect participants’ baseline melatonin levels for analysis.
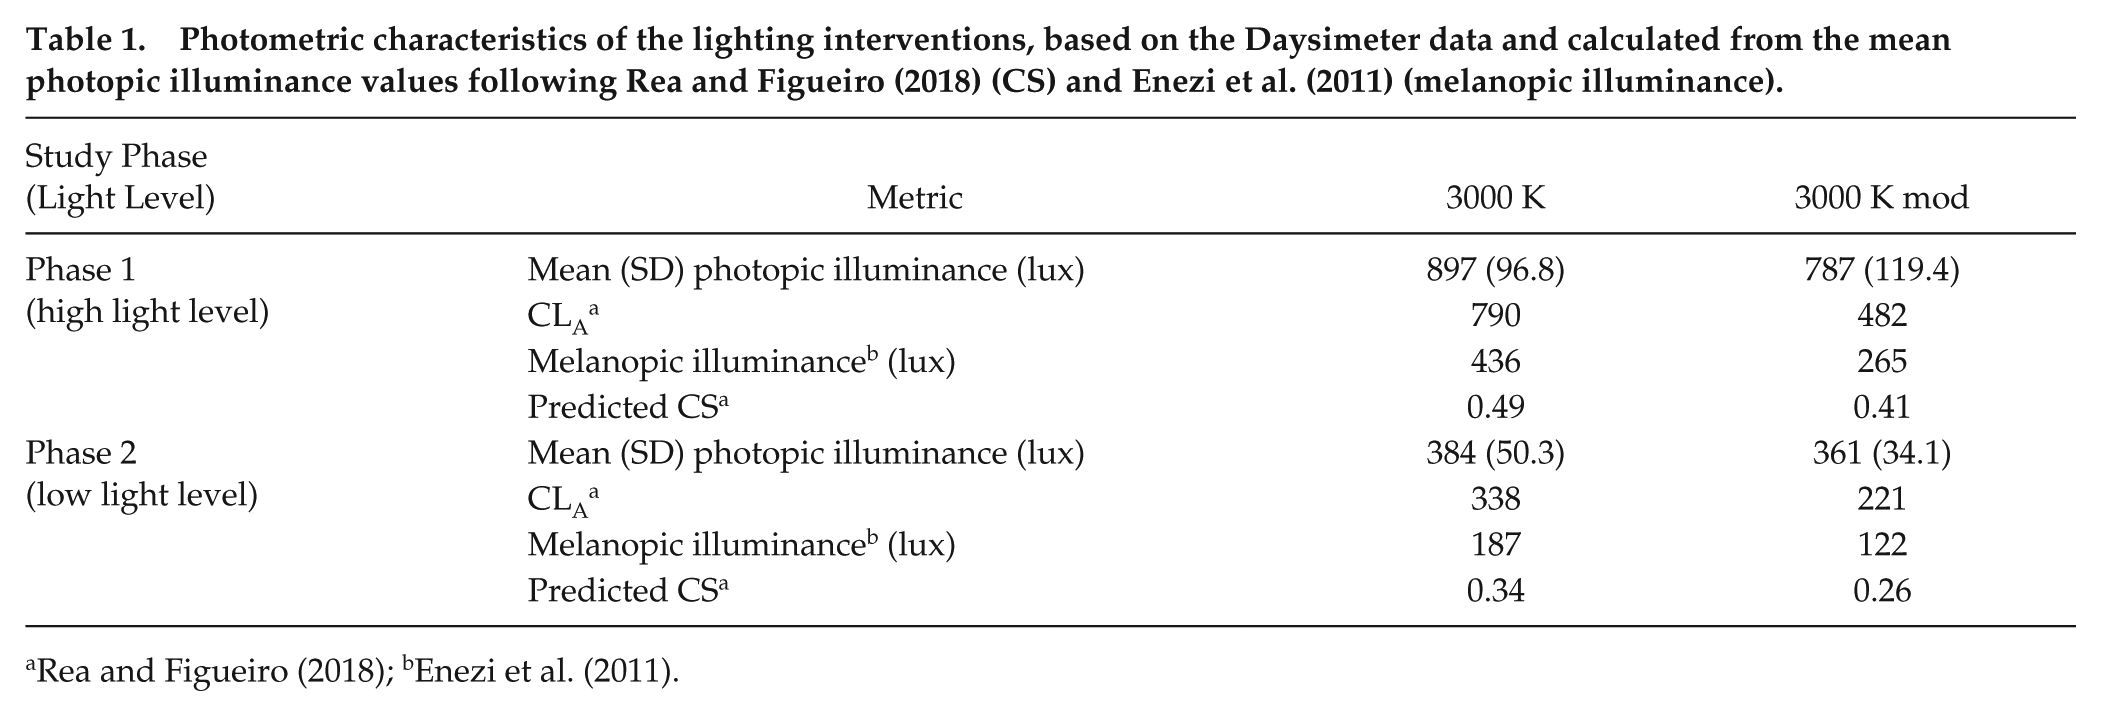
Spectral irradiance measurements for the lighting interventions were performed using a spectrometer (Model USB650, Ocean Optics, Winter Park, FL, USA), and their relative spectral power distributions are shown in Figure 1. The photometric characteristics (i.e., illuminance, CLA, melanopic illuminance and CS) of the light stimulus delivered, based on the Daysimeter data (see Recording Equipment) and calculated following the Rea et al. (CS) (Rea and Figueiro, 2018; Rea et al., 2005; Rea et al., 2012) and Enezi et al. (2011) (melanopic illuminance) models, are provided in Table 1. The corresponding α-opic irradiances of the lighting interventions, following the SI-compliant approach recommended by the Commission Internationale de l’Éclairage (CIE) (2015), are provided in Table 2.
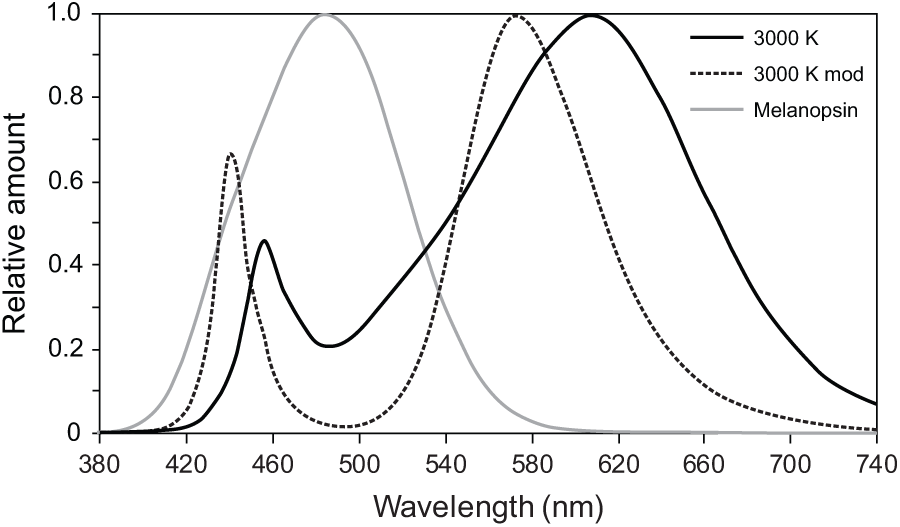
The relative spectral power distributions of the lighting interventions employed in this study and the melanopsin efficiency function adjusted to account for crystalline lens transmission according to Wyszecki and Stiles (1982). 3000 K is the conventional light source and 3000 K mod is the “cyan-gap” source.
Photometric characteristics of the lighting interventions, based on the Daysimeter data and calculated from the mean photopic illuminance values following Rea and Figueiro (2018) (CS) and Enezi et al. (2011) (melanopic illuminance).
Calculated α-opic irradiances for all experimental conditions, following the SI-compliant approach recommended by the CIE.
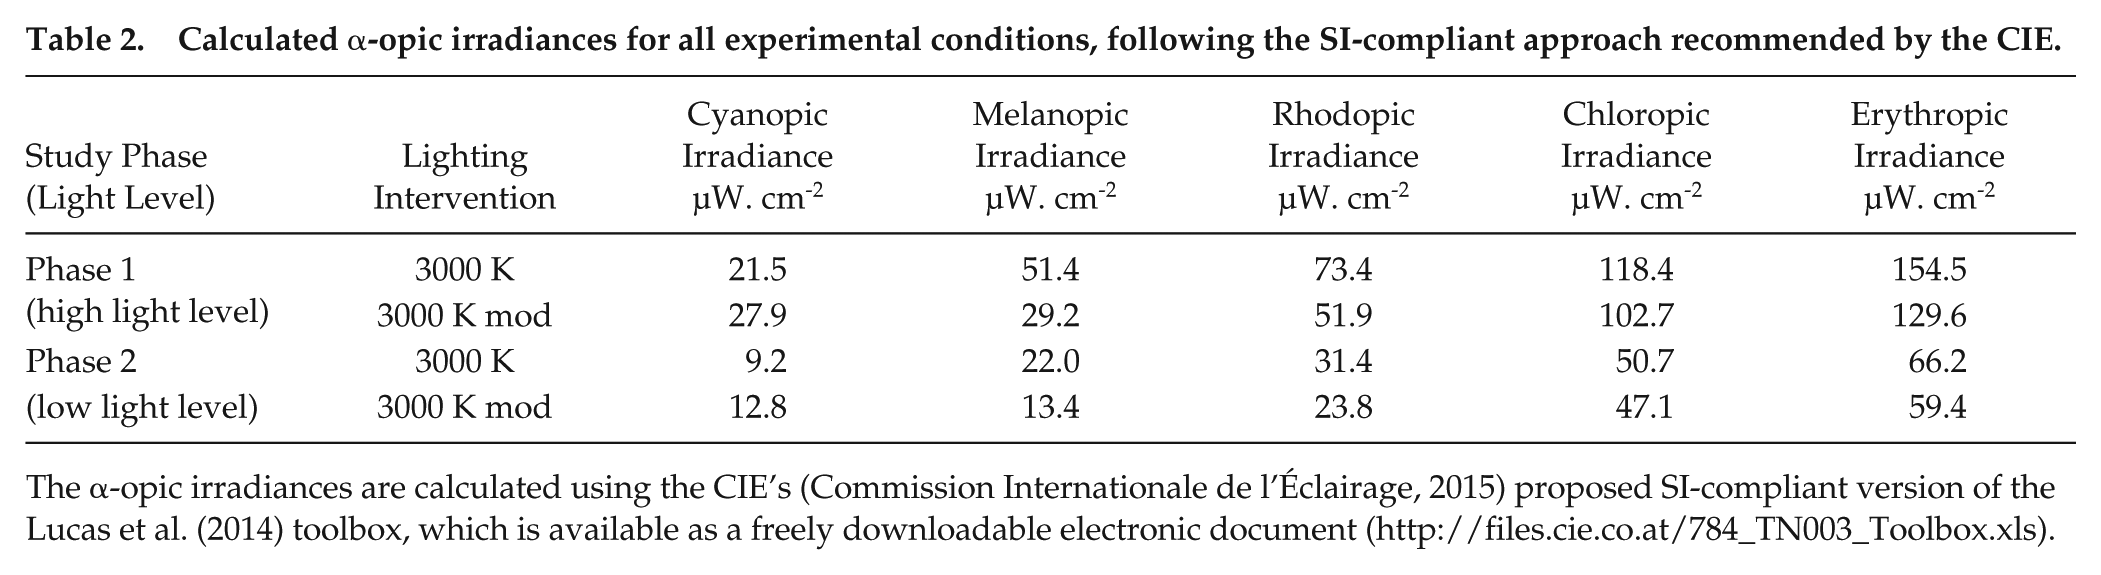
The α-opic irradiances are calculated using the CIE’s (Commission Internationale de l’Éclairage, 2015) proposed SI-compliant version of the Lucas et al. (2014) toolbox, which is available as a freely downloadable electronic document (http://files.cie.co.at/784_TN003_Toolbox.xls).
Lighting Apparatus
The lighting interventions were delivered via custom-built luminaires that were mounted on laboratory tables. Each luminaire housed an LED light bar composed of 48 low-power white LEDs (Lumileds, San Jose, CA, USA) operating in a constant current mode (200 mA max). White, spectrally neutral diffusers were installed on the luminaires to eliminate potential discomfort glare and provide a uniform light distribution. The luminaires were mounted on adjustable stands, and their height and distance from participants’ eyes were individually adjusted for each participant to ensure delivery of the desired stimulus of 800 lux at the eyes for Phase 1, and 400 lux at the eyes for Phase 2 (Figure 2). For a fixed width of 45.7 cm (18 inches) and a standard viewing distance of 76.2 cm (30 inches), the luminaires delivered an image that was approximately 33° in width at the participants’ eyes. Consistency of the light stimulus throughout the 60-min exposure was ensured through continual monitoring of the light levels through spot measurements taken with an illuminance meter every 10 min. The luminaires were not employed for the dim light control condition.
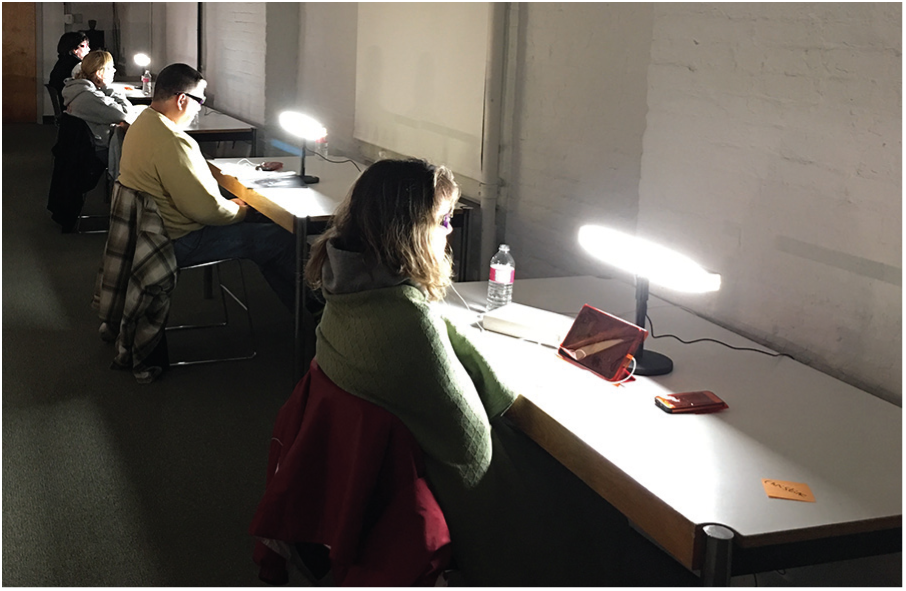
The experimental setup, showing participants performing their choice of task with the desktop luminaires in place. The luminaires were mounted on adjustable stands, and their height and distance from participants’ eyes were individually adjusted for each participant to ensure delivery of the desired stimulus. For a fixed width of 45.7 cm (18 inches) and a standard viewing distance of 76.2 cm (30 inches), the luminaires delivered an image that was approximately 33° in width at the participants’ eyes.
Recording Equipment
The study did not employ chin rests to control the participants’ gaze angle. Potential variability within the individual spectral and absolute characteristics of the stimulus delivered to the participants was addressed by continual data collection from the Daysimeter (Model 12, Lighting Research Center, Troy, NY USA). The Daysimeter was positioned near each participant’s eyes, mounted on lensless eyeglass frames, and recorded the light stimulus at 30-s intervals throughout the 60-min light exposure.
Study Protocol
Participants arrived at the laboratory at 2330 h and remained in dim light (<5 lux at the eyes) for 30 min, followed by a 60-min exposure to one of the 3 experimental conditions (Figure 3). During the experiment, the participants were instructed to not remove or block the Daysimeter’s sensor. The participants were not required to directly look at the light emitting fixtures but were instructed to face them to ensure minimum variability with respect to the target stimulus (see Figure 2). Participants were free to operate their personal electronic devices (i.e., computers, tablets, cell phones, etc.) and were required to perform a similar task (e.g., browse the Internet, watch a video or movie, read an e-book, etc.) on all study nights. All displays were covered with orange-tinted media (Roscolux #21 golden amber, Rosco Laboratories, Stamford, CT, USA) that filtered out radiation <525 nm to prevent participants from receiving additional circadian-effective light from their self-luminous devices. In a previous study, photometric measurements of the stimulus emitted by similarly filtered electronic displays revealed increased light levels of <5 lux, which translated to an additional CS of <0.001 (Nagare et al., 2018a). During each session, the participants refrained from consuming any food and were allotted a 10-min window to drink water, following each saliva sample time. Periodic visual monitoring was carried out by an experimenter to ensure compliance with the experimental protocol and confirm that none of the participants closed their eyes.
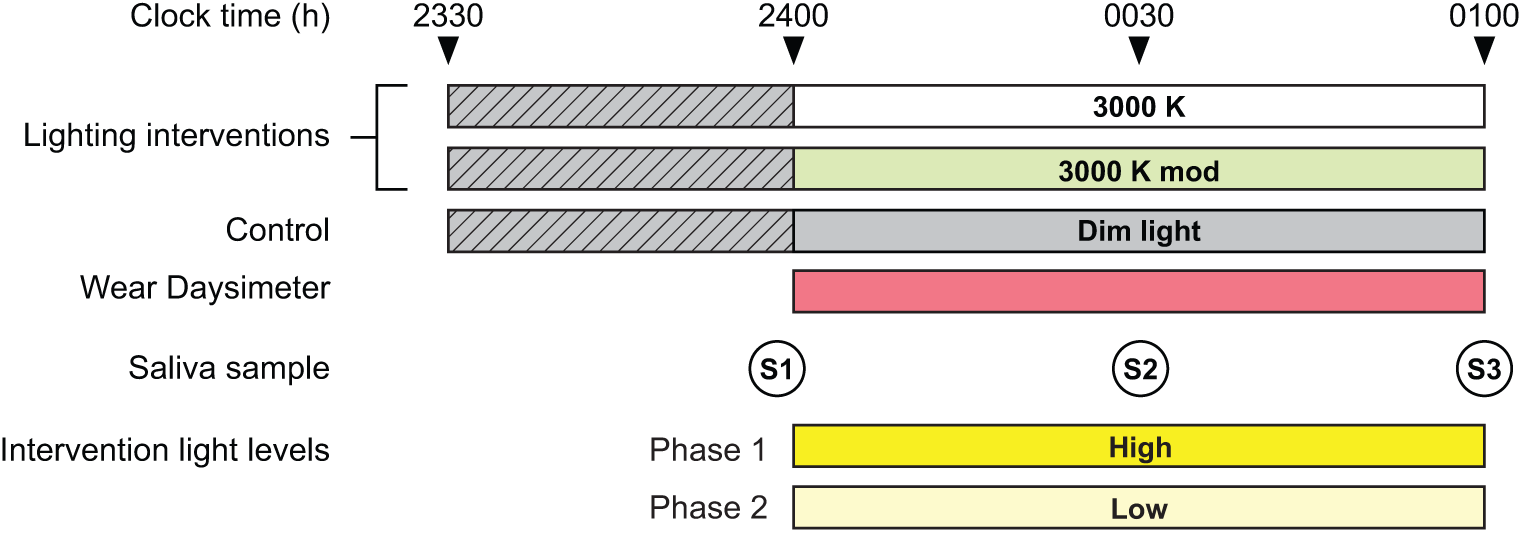
The experimental protocol used for the study, showing the relationship between experimental conditions, saliva sample times (S1, S2, and S3), and Daysimeter use. The participants were exposed to all 3 experimental conditions in both phases of the study, with high levels for the lighting interventions delivered during Phase 1 and low light levels for the lighting interventions delivered during Phase 2 (see Tables 1 and 2). Light levels were maintained at <5 lux at the eyes for the dim-light period (represented by the hatched pattern) preceding the lighting conditions and the dim-light control.
Three saliva samples were collected from each participant over the course of each experimental session. The first sample was taken immediately before the beginning of the lighting intervention after a 30-min dim-light exposure and the 2 remaining samples were taken thereafter at 30-min intervals. At 0100 h, after the final saliva sample was collected, the participants were released from the laboratory. Saliva samples (1 ml) were collected using the Salivette system (Sarstedt, Nümbrecht, DE); the participant chewed on a plain cotton cylinder for 1-2 min (not timed individually) that was immediately placed in a test tube, centrifuged for 5 min at 1000 ×g, and frozen (−20°C). The frozen samples from each session were assayed in a single batch using a melatonin radioimmunoassay kit (Direct Melatonin RIA, ALPCO, Salem, NH, USA). The sensitivity of the saliva sample assay was reported to be 0.3 pg/mL and the intra- and inter-assay coefficients of variability were 11% to 14% and 14% to 17%, respectively.
Melatonin data were acquired from all participants for the low light level (Phase 2). For the high-light level (Phase 1), melatonin data could not be processed from one participant for the 3000 K mod condition (S2), one participant for the 3000 K condition (S2), and one participant for both the 3000 K and 3000 K mod conditions (all samples) due to a lack of sufficient saliva collected.
Data Analysis
Circadian-effective light levels (Rea et al., 2010) were calculated from the Daysimeter data and transformed to the CS metric following the Rea et al. model (Rea and Figueiro 2018; Rea et al., 2005; Rea et al., 2012). Melatonin suppression was determined by comparing melatonin levels collected during the dim-light control night to those collected at the corresponding times on each lighting intervention night (see Figure 3). For each session, melatonin concentrations for S2 and S3 were first normalized to S1, and the melatonin suppression at each time point was then calculated using Equation 1.
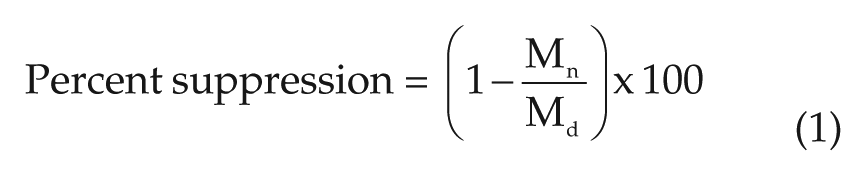
where Mn is the normalized melatonin concentration at each time point on the respective intervention nights and Md is the normalized melatonin concentration at each corresponding time point on the dim-light control night.
Primary statistical analyses were performed using repeated measures analysis of variance (ANOVA) with spectrum, light level, and exposure duration as the within-subject factors. Baseline melatonin levels across the 2 study phases with 3 experimental conditions each were also subjected to repeated measures ANOVA. ANOVA was performed with SPSS statistical software (SPSS version 25, IBM, Armonk, NY, USA). Further evaluation for the main effects and interactions was performed using post hoc, 1-sample t-tests. The test results were considered statistically significant if the p value was <0.05.
Results
Absolute Melatonin Levels
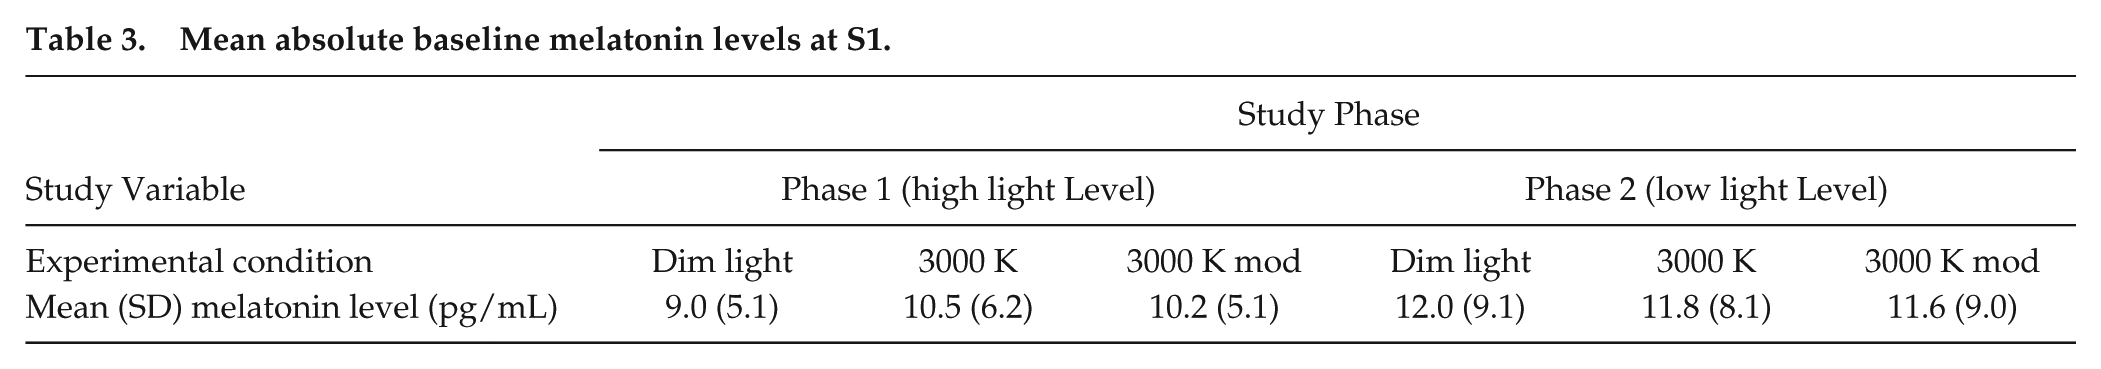
The ANOVA revealed that the absolute melatonin levels recorded at the beginning of each study night (S1) were not significantly different across the 2 study phases (F1,14 = 1.24, p = 0.28, ηp² = 0.08) and the 3 experimental conditions (F2,28 = 1.51, p = 0.24, ηp² = 0.10), suggesting that the light treatment was delivered at a similar circadian phase for all participants on all study nights (Table 3). Figure 4 shows the absolute melatonin data for the dim-light control and the 2 intervention spectra for both light levels at baseline and after 30-min and 60-min exposures.
Mean absolute baseline melatonin levels at S1.
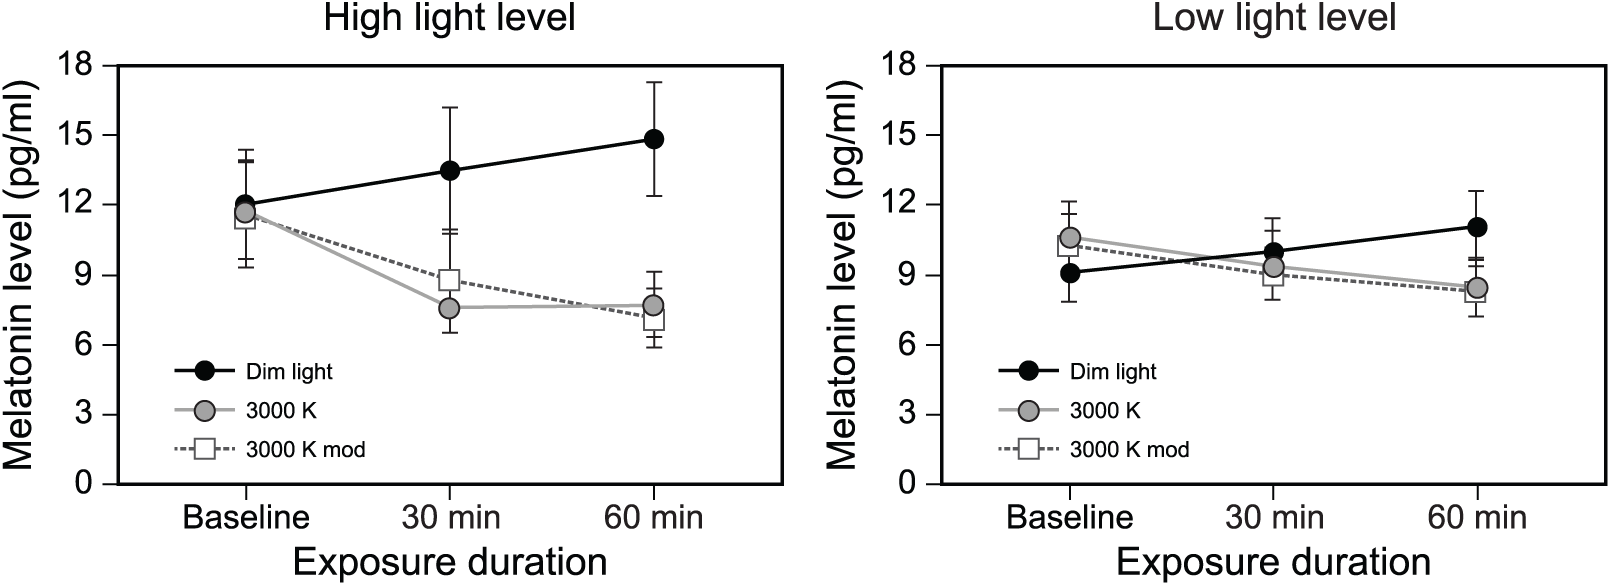
Absolute melatonin data for the dim-light control and the 2 intervention spectra for both study phases at baseline and after 30-min and 60-min exposures. Data for the high light level (Phase 1) are shown on the left, and those for the low light level (Phase 2) are shown on the right. The error bars represent standard error of the mean.
Effect of Lighting Characteristics on Melatonin Suppression
The ANOVA revealed significant main effects of light level (F1,12 = 9.1, p < 0.05, ηp² = 0.43) and exposure duration (F1,12 = 47.7, p < 0.05, ηp² = 0.80), wherein, as expected, greater melatonin suppression was observed following exposure to higher light levels and longer durations during the participants’ biological night (Figure 5).
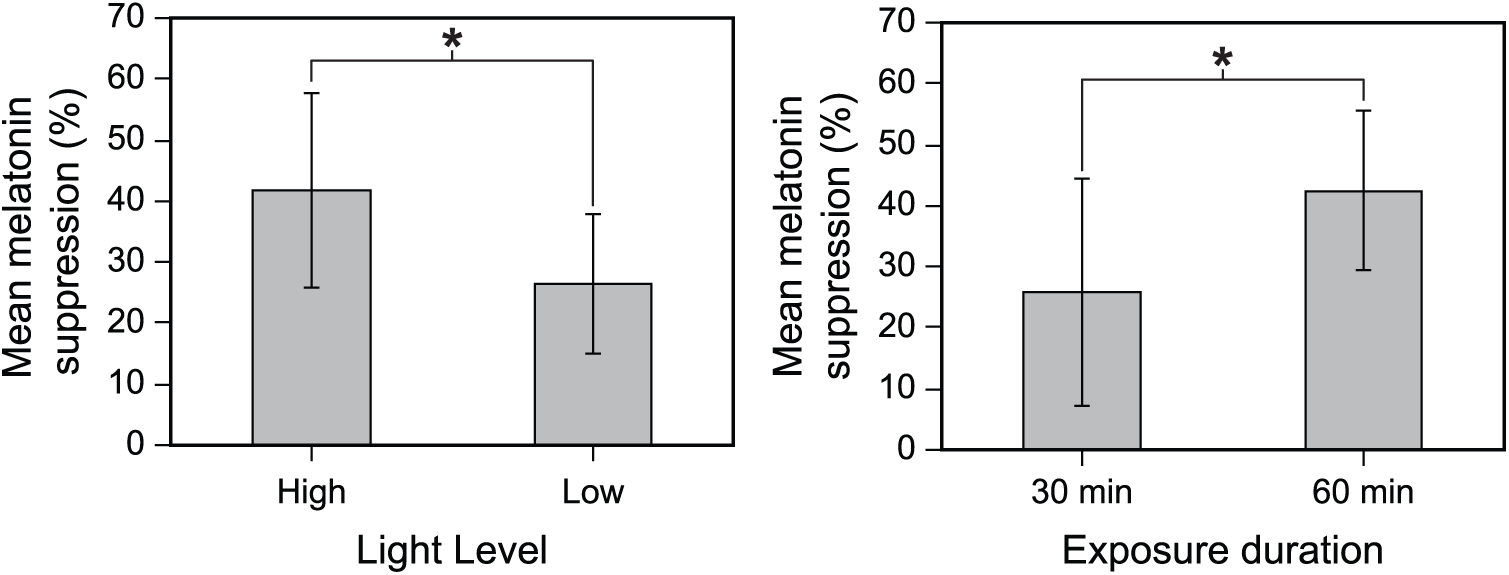
The graph on the left depicts the main effect of light level on nocturnal melatonin suppression compared with the dim-light control condition, combined across the 2 spectra and the 2 exposure durations. The graph on the right depicts the main effect of exposure duration on nocturnal melatonin suppression compared with the dim-light control condition, combined across the 2 spectra and the 2 light levels. The error bars represent SD. The asterisks represent statistical significance (p < 0.05).
The ANOVA did not reveal a significant main effect of intervention spectrum (F1,12 = 0.16, p = 0.69, ηp² = 0.01), whereby the mean melatonin suppression between the 2 spectra was not statistically discernible (Figure 6) for both phases of the study. The mean (SD) melatonin suppression following a 1-h exposure to the high-light level was 49% (13%) and 50% (13%) for the 3000 K and 3000 K mod interventions, respectively. The mean (SD) melatonin suppression following a 1-h exposure to the low light level was 34% (11%) and 36% (11%) for the 3000 K and 3000 K mod interventions, respectively. Statistical analysis did not reveal any outliers within the entire data set, suggesting that the results were not skewed by any particular participant(s). The median (IQR) melatonin suppression following a 1-h exposure to the low light level was 34% (15%) and 32% (17%) for the 3000 K and 3000 K mod interventions, respectively. The median (IQR) melatonin suppression following a 1-h exposure to the high light level was 44% (19%) and 53% (19%) for the 3000 K and 3000 K mod interventions, respectively. No statistically significant interactions between the independent variables were identified (p > 0.05).
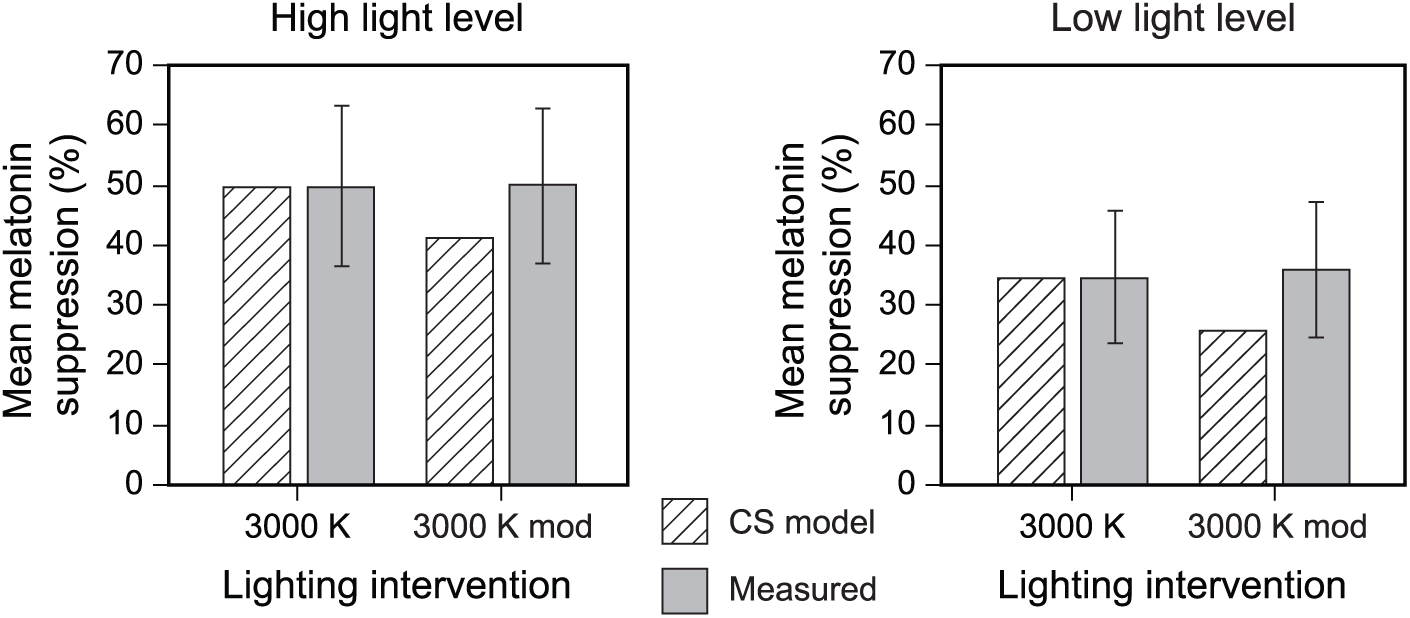
Mean and SD melatonin suppression for the 2 light levels after a 1-h exposure, normalized to the control (dim-light condition), compared to the a priori CS predictions derived following Rea and Figueiro (2018). The error bars represent SD.
Post hoc statistical analyses showed that melatonin suppression following a 1-h exposure was significantly greater than zero for both the 3000 K mod (Phase 1: t 14 = 15.0, p < 0.05; Phase 2: t 15 = 12.9; p < 0.05) and the conventional 3000 K (Phase 1: t 14 = 14.1, p < 0.05; Phase 2: t 15 = 12.4, p < 0.05) sources. Furthermore, melatonin suppression following exposure to the 3000 K intervention was not significantly different (p > 0.05) from the a priori CS levels predicted for both the high (t14 = −0.06; p > 0.05) and low (t15 = 0.07; p > 0.05) light levels. However, melatonin suppression was significantly greater than the predicted CS levels for the 3000 K mod intervention at the high (t 14 = 2.59; p < 0.05) and low (t 14 = 3.47; p < 0.05) light levels, following a 1-h exposure.
Discussion
The present study was designed to investigate whether exposures to a “cyan-gap” white light source that is spectrally tuned to reduce stimulation of the melanopsin-containing photoreceptor suppressed less melatonin than a conventional 3000 K light source. Contrary to our model predictions and conventional wisdom, the results showed that participants exposed to the “cyan-gap” 3000 K mod, light source experienced similar levels of melatonin suppression (50% at high light levels, 36% at low light levels) compared with those experienced after exposure to the conventional 3000 K intervention (49% at high light levels, 34% at low light levels; see Tables 1 and 2). The measured levels of light-induced nocturnal melatonin suppression after 1-h exposures closely matched the predicted CS values for the conventional 3000 K light source; however, measured suppression levels for the “cyan-gap” 3000 K mod source were statistically equal to those for the conventional source. Therefore, suppression was greater for the “cyan-gap” source than would be expected if the ipRGC, melanopsin-containing photoreceptors were solely responsible for nocturnal melatonin suppression by both light sources.
Although there was no statistical difference between the “cyan-gap” source and the conventional source at either light level, the results are consistent with our hypothesis and with those from many previous studies showing that higher light levels and longer exposure durations result in significantly greater melatonin suppression (Chang et al., 2012; Nagare et al., 2018b; Zeitzer et al., 2000). The present data, as well as those reported by Nagare et al. (2018b) for light levels commonly experienced in indoor environments with white light sources, suggest that lighting dose (amount × duration) is of greater relative importance than spectrum for the same CCT when describing the effect of photic stimulus on the human circadian system.
At first glance, the results of the present study may appear to contradict those of Souman et al. (2018), who demonstrated reduced melatonin suppression with the reduction of spectral power between 450 nm and 500 nm (Souman et al., 2018). Several methodological differences between the 2 studies are noteworthy, however. First, the Souman et al. study used an exposure duration of 3 h rather than the 1-h duration employed here. Importantly, Souman et al. showed no significant differences in melatonin suppression for their “cyan-gap” source and their conventional source after 1-h exposure, consistent with the present study. Second, the melanopsin stimulation ratio of the “high MEF” to “low MEF” light sources from the Souman et al. study was almost twice (≈3.5) the melanopsin stimulation ratio (≈1.6) of the 2 light sources employed in the present study. A third key difference is that the absolute levels of irradiance at the eyes provided by Souman et al. were much lower than those employed in the present study. As such, it is possible that differential habituation to the 2 low-light stimuli may have occurred in the Souman et al. study. A recent study by Rahman et al. (2017) also examined melatonin suppression following sustained low-level light exposures (≈ 50 lux at the eyes) to a conventional, 4100 K fluorescent light source (FL) and a “blue-depleted” LED light source (C-LED). Although nocturnal melatonin suppression by the C-LED source was significantly lower than that from the fluorescent source after 8 h of exposure, there was no difference between the 2 sources initially following collection of melatonin data early in the night. Thus, even though the results from Rahman et al. are consistent with the results presented here as well as those from Souman et al., it is nevertheless important to examine the temporal dynamics of light exposures in the future to determine why 2 light stimuli of different spectral composition would have equal nocturnal melatonin suppressing effects for short durations but not for long durations.
A limitation of the present study is that we did not monitor or control participants’ photic history leading up to the experimental sessions. Since all participants were employed adults or students with regular schedules, we presumed that they would receive consistent daily light exposures over the course of the two 3-week study phases. The study’s protocol also did not employ chin rests to control the participants’ gaze angle; although, any potential variability within the individual spectral and absolute characteristics of the stimulus was addressed by continual data collection from the Daysimeter positioned near the participants’ eyes. Again, there is no evidence that the absolute light levels were confounded with the light source spectrum. Finally, while we acknowledge a sex disparity among the study’s participants (75% females), it should be noted that past studies have reported no differences in measures of circadian preference and sleep with respect to sex (Giannotti et al., 2002; Russo et al., 2007).
The findings from the present research should be of particular interest to lighting manufacturers who are interested in producing light sources that can have a differential effect on the circadian system without affecting photopic light levels and CCTs, which are key lighting parameters considered by light specifiers. The results of the present study suggest that, for short-term exposures (≤1 h) “cyan-gap” light sources affect the human circadian system similarly to conventional light sources of the same CCT and photopic illuminance at the eyes.
Footnotes
Acknowledgements
The present study was funded by LumiLeds, the Light and Health Alliance (Acuity Brands, CREE, Current Powered by GE, Ketra, Osram, Philips, and USAI Lighting) and the NIH Training Program in Alzheimer’s Disease Clinical and Translational Research (NIA 5T32AG057464). None of the sponsors participated in the design, data collection or data analyses. The authors would like to thank Wouter Soer (LumiLeds), and LRC staff (Sharon Lesage, David Pedler, Kassandra Gonzales, Martin Overington, and Howard Ohlhous) for their technical and editorial assistance.