
Abstract
Body temperature is known to vary with circadian phase and to be influenced by factors that can mask its circadian expression. We wanted to test whether skin temperature rhythms were sensitive to an abrupt shift of the sleep schedule and to the resetting effects of light. Nineteen healthy subjects spent 6 days in time isolation and underwent a simulated night-shift procedure. They were assigned to either a control group (n = 10) or bright light group (n = 9) and measurements were taken under a baseline day-oriented schedule and during the 4th cycle of a night-oriented schedule. In the bright light group, participants were exposed to a 3-cycle 8-h exposure of ~6,500 lux at night, while the control group remained in dim light conditions (~3 lux). Skin temperature was recorded in 10 and 4 participants from the control and bright light groups, respectively. We found significant circadian rhythms of plasma melatonin, core body temperature (CBT), and skin temperature at baseline for both groups (p < 0.001 for all). Rhythms of melatonin, CBT, and skin temperature following night shifts were significantly phase delayed by about 7 to 9 h (p < 0.05) in response to bright light at night, whereas there was no shift in the control group. In addition, we found that at bedtime melatonin does not consistently increase before the increase in distal skin temperature and subsequent decrease in CBT, in contrast to what has been previously reported. The present study shows that, in constant posture conditions, skin temperature rhythms have an evoked component sensitive to abrupt changes in the timing of sleep. They also comprise an endogenous component that is sensitive to the resetting effects of bright light exposure. These results have applications for the determination of circadian phase, as skin temperature is less intrusive than rectal temperature recordings.
Body temperature is known to vary with time-of-day and to comprise endogenous circadian and evoked components (Wever, 1979), the latter being in response to several factors, such as physical activity, postural changes, meals, sleep, and the light-dark (LD) cycle (Dauncey and Bingham, 1983; Gander et al., 1986; Minors et al., 1989; Badia et al., 1991). These so-called masking factors can modulate overt rhythms, and, for instance, the sleep-wake cycle can contribute to about half the amplitude of the CBT rhythm (Wever, 1985). Under a regular day-oriented schedule, the endogenous circadian system maintains a stable phase relationship with the rest-activity cycle, making it difficult to tease apart the respective contribution of the endogenous and evoked components. To do so, Wever (1985) compared data collected during continuous bedrest with data obtained during sleep deprivation (i.e., continuous activity). However, in that experiment, spontaneous activity occurred at all times of day, making it difficult to exclude its masking effects on the CBT rhythm. Other methods have been proposed to experimentally limit the masking effects of activity changes on body temperature rhythms.
The constant routine (CR) procedure was proposed as a way of minimizing changes in the levels of activity, sleep-wake states, light exposure, and food intake, which could mask the endogenous circadian rhythm of CBT. However, the sleep deprivation that increases with the time spent awake during such a procedure may also interfere with the circadian regulation of CBT (Lack and Lushington, 1996) and thus limits the interpretation of the data.
Another experimental procedure, called the forced desynchrony, leads to a desynchronization between the circadian system and the sleep-wake cycle by forcing subjects to live on a sleep-wake cycle with a period much shorter (e.g., 20 h; Hiddinga et al. (1997)) or longer (e.g., 28 h; Dijk and Czeisler (1995)) than the endogenous circadian period and falling outside the range of entrainment of the circadian system. With such a protocol, it is possible to mathematically partial out the endogenous circadian and evoked (e.g., linked to the sleep-wake cycle) components. However, the forced desynchrony protocol is time-consuming and laborious and does not perfectly control for the effects of sleep restriction at various circadian phases.
Finally, another possible approach is to mathematically correct for the effect of masking (Folkard, 1989; Folkard et al., 1993), but some assumptions regarding the relative strengths of the endogenous and evoked components and the presumed constant effect of sleep deprivation at various times of day are limiting its usefulness. Moreover, this does not represent an ideal method given the non-linear additive effects of the masking components.
In highly controlled laboratory conditions, the circadian phase of the central clock is usually based on either serial hormonal samples, which require time for assays, or the continuous recording of rectal CBT rhythm (Wever, 1985), which can be unpleasant, especially during activity periods. Alternative methods are available to record CBT, such as the use of a thermistor pill, which is swallowed to allow measurements of gut temperature (Edwards et al., 2002). Both the rectal and gut temperatures exhibit similar rhythms, although the use of such pills presents disadvantages (Roach et al., 2010; Bongers et al., 2015). For instance, fluid intake can alter the temperature values recorded and there is a high degree of within- and between-subject variability in transit time of the pill, which can be problematic, especially when long periods of recording are needed. In addition, the pill needs to be ingested ≥6 h prior to the start of recordings, is rather expensive, and can only be used once.
A non-invasive alternative is to measure skin temperature, the rhythm of which is known to be correlated to the CBT rhythm with a measured phase (time of maximum for distal temperature [DT]; time of minimum for proximal temperature [PT] occurring slightly earlier than the CBT minimum) (Krauchi and Wirz-Justice, 1994; Shechter et al., 2011). This phase relationship seems to be an important element for body temperature regulation and was proposed to play a role in sleep initiation. During the onset of sleep, there is an increase of distal skin temperature (e.g., hands and feet temperature) triggered by increased skin blood flow and resulting in heat loss, which downregulates CBT. It was proposed that the onset of melatonin secretion in the late evening may act as a modulator of vascular tone, leading to changes in DT (Krauchi et al., 2006) then fall of CBT.
Skin temperature is easily recorded in humans using wireless data loggers, as reviewed in Hasselberg et al. (2013) and Polugrudov et al. (2016). Under a day-oriented schedule, DT rhythms are inverted compared with the CBT rhythm, and display higher amplitude when measured in either controlled (e.g., CR) or field conditions (Krauchi and Wirz-Justice, 1994; Krauchi et al., 2014).
The case of proximal skin temperature (e.g., infraclavicular region, sternum) is more complex. Under CR conditions, the PT rhythm follows the CBT rhythm with lower values at night (Krauchi and Wirz-Justice, 1994); yet, under real-life conditions, PT rhythms were reported to be similar to DT rhythms, with maximal values occurring at night (Krauchi et al., 2014). It was proposed that the opposite shape of the DT and PT rhythms observed during CR are related to differences in thermophysiological regulatory mechanisms (Gompper et al., 2010). Nevertheless, the difference between field and controlled laboratory studies suggests that some additional factors (e.g., sleep, food intake, light exposure), which are less easily controllable in field conditions, can have prominent masking effects on skin temperature rhythms, as demonstrated for CBT.
The relative strengths of the endogenous circadian and evoked components on skin temperature rhythms are unknown, therefore limiting their use as reliable markers of the circadian system in ambulatory conditions. Our study used a simulated night-shift protocol to further investigate the endogenous circadian component of skin temperature rhythms. Indeed, night-shift work leads to an acute temporal misalignment between the sleep-wake cycle and the endogenous circadian system (Boivin, 2007; James et al., 2007b; Boivin et al. 2012a, 2012b; Morris et al., 2012b; Boivin and Boudreau, 2014; Cuesta et al., 2016; Morris et al., 2016). This allowed us to investigate the evoked response of the skin temperature rhythm to an abrupt shift of the sleep schedule.
Field and simulated shift-work studies in humans have shown that nighttime phototherapy can induce large shifts of the endogenous CBT, melatonin, and cortisol rhythms (Czeisler et al., 1990; Boivin and James; James et al., 2007b; Boivin et al. 2012a, 2012b). To our knowledge, skin temperature rhythms have never been studied during shift work with or without bright light exposure. Therefore, we also wanted to test the sensitivity of the endogenous circadian component of skin temperature to an abrupt shift in the timing of sleep and to light-induced phase shifts. More specifically, we tested whether this intervention can adjust skin temperature rhythms to a night-oriented schedule concomitantly to that of the CBT and melatonin rhythms. In addition, we explored the changes of plasma melatonin and body temperature occurring at bedtime.
Materials and Methods
Subjects
Nineteen healthy subjects (mean [SD]: 23.7 [4.2] years old; 2 women) were enrolled in a 6-day night-shift simulated study in time isolation at the Centre for Study and Treatment of Circadian Rhythms, Douglas Mental Health University Institute. Subjects were recruited as previously described (James et al., 2007a) after they gave informed consent to their participation, as approved by the Douglas Institute Ethic Board and within the ethical standard of the declaration of Helsinki. They were assigned to either a control (n = 10, 1 woman) or bright light group (n = 9, 1 woman). A main cohort of 14 subjects was studied from May to August in 2012, 2013 and 2014 (control, n = 10; bright light, n = 4). In addition, we used CBT and plasma melatonin data (see below) obtained from 5 subjects who participated in a 12-day study performed in our laboratory from July to August 2005, for which the 6 first experimental days were identical to those from the 2012-2014 study (James et al., 2007b). Thus, subjects were assigned to study groups in a non-randomized manner. Age (mean [SD]: 22.6 [3.4] and 24.6 [4.7]; p = 0.41), BMI (21.4 [1.2] and 23.2 [2.6]; p = 0.10) and chronotype (57 [8] and 54 [3]; p = 0.64) were similar in the control and bright light groups, respectively. The 2 female participants had regular menses (cycle duration of 32 [1] days and 27 [1] days) and entered the laboratory on the second and fifth day of their menstrual cycle, respectively. One control subject (S20) only participated to the baseline part of the study and thus, his results were excluded from the phase shift analyses (see below).
As detailed below and in Suppl. Table S1, we could measure skin temperature for the entire experiment in 10 and 4 participants from the control and bright light groups, respectively.
Experimental Protocol
Participants maintained a stable sleep/wake schedule for at least 7 days before laboratory admission (James et al., 2007a), with similar average sleep duration of 7h59min (2 min) and 8h03min (2 min) in the control and bright light groups, respectively (p = 0.15). This was calculated with subjective sleep diaries filled out by the subjects and verified by calls made to the laboratory at each bed and wake time. In addition, actigraphic recordings (Actiwatch-Light, Mini-Mitter, Bend, OR, USA) served as an objective sleep measure and allowed us to verify that subjects complied with their sleep schedule. Subjects were admitted to a time-free laboratory environment for 6 days (Figure 1A, C). The sleep-wake schedule in the laboratory was based on the subjective sleep diary filled out before the laboratory protocol, and subjects continued to wear the Actiwatch during the 6-day laboratory experiment. After one night on their habitual sleep/wake schedule (experimental day 1), subjects participated in a constant posture (CP) procedure for 16 h (experimental day 2; Figure 1A, C), in which we controlled levels of activity, light exposure, and food intake to minimize their masking effects on circadian parameters during waking (James et al., 2007a). The first sampling session served to determine baseline rhythms and was done for 24 h under a day-oriented schedule. It included the 8-h baseline sleep episode followed by the first 16-h CP procedure. Then, the simulated night-shift work procedure began at the start of experimental night 2 with a night of sleep deprivation in which participants were allowed to move. This was followed by an 8-h daytime sleep episode that was delayed 10 h relative to habitual sleep times. The night-oriented schedule was maintained for 4 consecutive 24-h cycles until the evening of experimental day 6. A second 16-h CP procedure (experimental days 5 and 6; Figure 1A, C) took place in simulated night-shift conditions starting after the third diurnal 8-h sleep episode of experimental day 5. This 16-h CP procedure followed by the fourth diurnal 8-h sleep episode represented the second 24-h sampling session. It served to determine the effects of a night-oriented schedule with or without bright light on circadian rhythms of measured parameters. Participants could leave the laboratory upon awakening from the last diurnal sleep episode on experimental day 6.
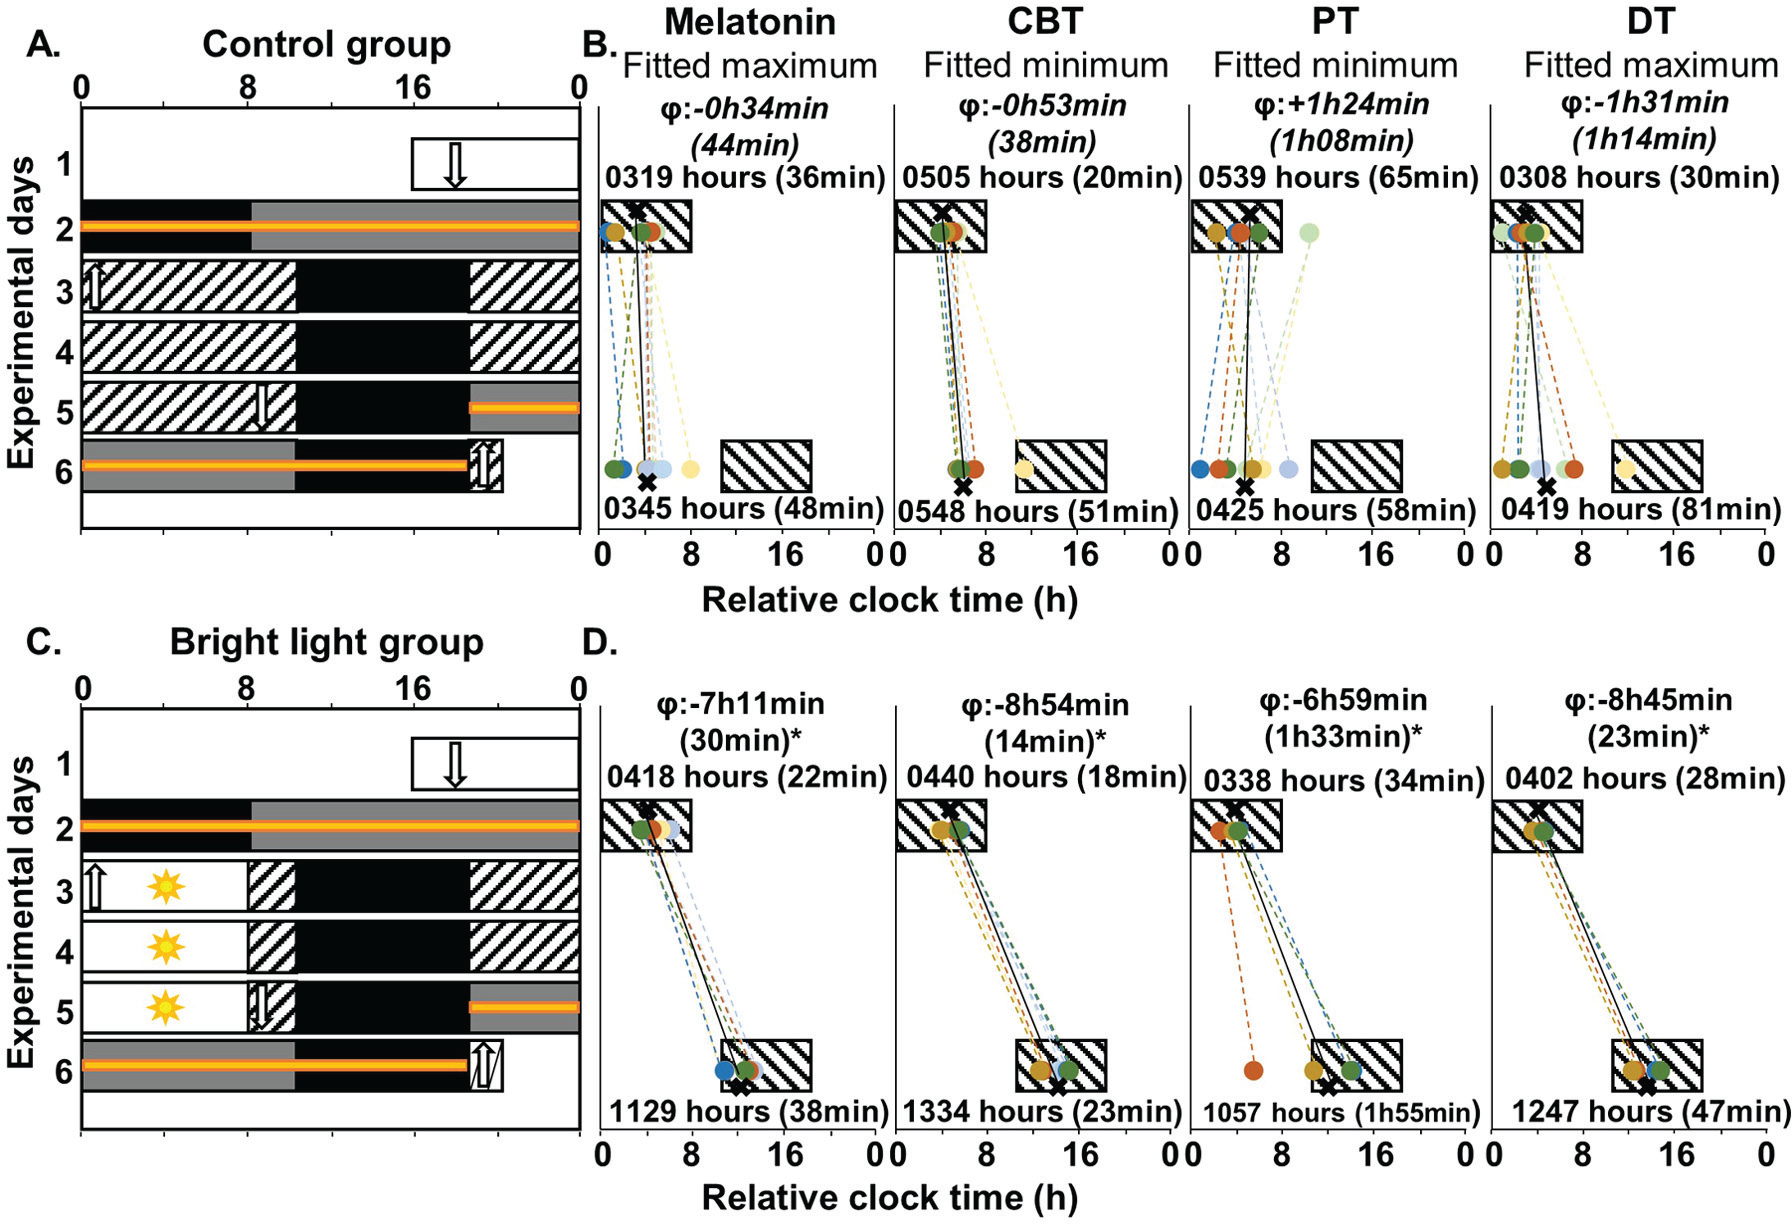
Experimental protocol and mean individual phase shifts of circadian markers for the entire group (number of subjects as per Suppl. Table S1). A and C: The 6-day experimental protocol is described in the Material and Methods section. Successive experimental days are shown from top to bottom on the y-axis and time-of-day is shown on the x-axis. For analysis purposes, the bedtimes and wake times of each subject at baseline were assigned a relative clock time of 0000 hours and 0800 hours, respectively. The black rectangles represent the 8-h sleep periods in darkness. The white bars represent waking periods during standard days in ~100 lux. The hatched white bars represent waking periods in dim light (~10 lux). The 8-h bright light exposure is shown as white bars with sun symbols (~6,400 lux). The grey bars represent the 16-h CP procedure (~10 lux) during experimental days 2 and 5-6. As indicated by orange lines, blood was collected hourly for 24 h during each 16-h CP procedure and the 8-h sleep period preceding CP1 and following CP2. Vertical white arrows represent time at which the catheter was inserted (downward arrows) and removed (upward arrows). B and D: Diurnal and nocturnal sleep periods are represented by black boxes. For each individual (colored circles) and each group (black Xs), the phase of each marker is shown at baseline (experimental day 2) and following simulated night shifts (experimental day 6). The averaged phase (SEM) for each marker is given in relative clock time above or below each box. The phase shift (ϕ) for each marker is indicated at the top of each panel. Non-significant phase-shifts are indicated in italic (p > 0.05).
On experimental day 1, subjects received an evening meal and a snack, 6 and 2 h before lights off, respectively. During experimental day 2 (first CP) and the first night shift (experimental day 3), subjects were given hourly isocaloric snacks. From the evening of experimental day 3 to the morning of experimental day 5, 3 meals per day were provided (+45 min, +4 h, and +10 h after lights on), as well as a snack 2 h before lights off. During the evening of experimental day 5 and during the night and morning of day 6 (second CP), subjects were given hourly isocaloric snacks.
Throughout the experiment, we tightly controlled ambient light exposure and verified its intensity every 2 h by measuring light levels during waking periods in the subject’s averaged angle of gaze with a research photometer (IL1400A, International Light Technologies Inc., Peabody, MA, USA). In addition, participants continuously wore an Actiwatch with a light-mounted sensor to assess light exposure during both wake and sleep periods. During the waking period of experimental day 1, the average ambient light levels were similar in the control (295.5 [10.8] W/m2 or 100.9 [3.7] lux) and the bright light (329.1 [52.4] W/m2 or 112.4 [17.9] lux) groups. In both groups, subjects spent their sleep periods in darkness with levels of light below 0.1 W/m2 (<0.03 lux). From the start of CP1 to the end of the study, all wake periods were in very dim light and similar in both groups (control: 7.6 [0.6] W/m2 or 2.6 [0.2] lux; bright light: 10.5 [1.2] W/m2 or 3.5 [0.4] lux; p = 0.06), except during the intervention for the bright light group.
During the 8-h bright light exposure (starting 10 h before bedtime), subjects were seated and asked to center their gaze on an image hung on the wall for 10 min every 20 min (considered as the “up” period) (James et al., 2007b). During this “up” period, subjects of the bright light group were exposed to an average of 18,742 (586) W/m2 (6,422 [185] lux). The angle of gaze was not restricted the rest of the time (“down” period) and the light intensity measured at that time represented about 80% of the averaged intensity observed during “up” periods. In the control group, the same angle-of-gaze procedure was used, but subjects were kept in dim light (7.8 [0.6] W/m2 or 2.7 [0.2] lux).
Core Body and Skin Temperature Recordings
CBT was recorded every 15 sec using a 10-cm rectal sensor (rectal-esophageal temperature probe, recording range: 34 °C to 41 °C; resolution: 0.2 °C; Cincinnati Sub Zero, Cincinnati, OH, USA) and stored on an in-house data acquisition system. Some data were lost due to probe slips or dysfunction (16% of all recordings; detailed in Suppl. Table S1).
Skin temperature was recorded at 6 locations from each subject throughout the entire experiment. We used wireless temperature sensors (DS1921H Thermochron iButton; diameter X height: 17.35 × 5.89 mm, resolution: 0.125 °C; Maxim, Dallas, TX, US) to record skin temperature at a frequency rate of 1 min. The iButtons were fixed to left and right hands, feet and infraclavicular fossa using thin adhesive tape (Opsite Flexifix, Smith & Nephew, Hull, UK). The iButtons were replaced every 24 h throughout the experimental protocol. We used 2 sets of iButtons so that every 24 h, one set was quickly replaced by another one leading to minimal interruption of data recording (of about 15 min per day). Each iButton was placed to a similar location as that of the previous one except when it was uncomfortable for the subject. PT was defined as the mean skin temperature of the left and right infraclavicular fossa and DT as the mean skin temperature of the left and right hands and feet. While the bright light group comprised 9 subjects, 5 of them were studied in 2005 and no skin temperature was recorded at that time. Therefore, for the skin temperature recordings, the number of subjects in the bright light group was limited to 4. Among the 4 bright light and 10 control subjects analyzed, PT and DT data during the night-shift condition was lost for a control subject (S15) due to iButtons dysfunction; detailed in Suppl. Table S1).
Plasma Melatonin
An indwelling catheter was inserted into a forearm vein (Boivin et al., 2003; James et al., 2007a; Cuesta et al., 2015) at least 4 h before the start of each CP procedure (in the evening of experimental day 1 for CP1 and the morning of experimental day 5 for CP2; Figure 1), allowing the sampling of blood samples without disturbing the subject’s sleep. Two ml of whole blood was withdrawn every ~60 min in K2EDTA-coated tubes, centrifuged at 1,494 ×g for 15 min at 4 °C to obtain plasma samples, which were stored at −80°C until further analysis. The kit used to measure melatonin levels in the 2012 to 2014 study (Labor Diagnostika Nord, Nordhorn, Germany; range 3 to 1,000 pg/mL; sensitivity, 2.3 pg/mL) differed from the kit used in 2005 (Stockgrand, Guilford, Surrey, UK; range 5 to 500 pg/mL; sensitivity 2.5 pg/mL). The intra- and inter-assay CVs were 8.3% and 4.4%, respectively. To verify that possible variation introduced by the use of 2 different kits did not impact our data, we transformed our data into Z-scores and found the same results and statistical differences (data not shown) as those observed using raw data. Therefore, we present the raw data results. Some data were lost due to difficult draws for a bright light subject (S06), which prevented the statistical assessment of its rhythmicity. The data from the control group were previously published as part of another article (Cuesta et al., 2016), as well as those from 5 subjects out of 9 in the bright light group (James et al., 2007b).
Data Transformation
Since the experimental protocol was based on participants’ habitual sleep times, circadian rhythms were analyzed relative to each participant’s habitual wake time. This allowed assessing circadian rhythms and their changes throughout the study relative to their baseline position (see Figures 1, 2 and 3 for subgroups with complete data set for all parameters in both conditions [control, n = 8; bright light, n = 3]; Suppl. Figures S1 and S2 for groups with all subjects; for both groups and subgroups Tables 1 and 2). Average pre-study reported times in and out of bed are shown in Suppl. Table S2.
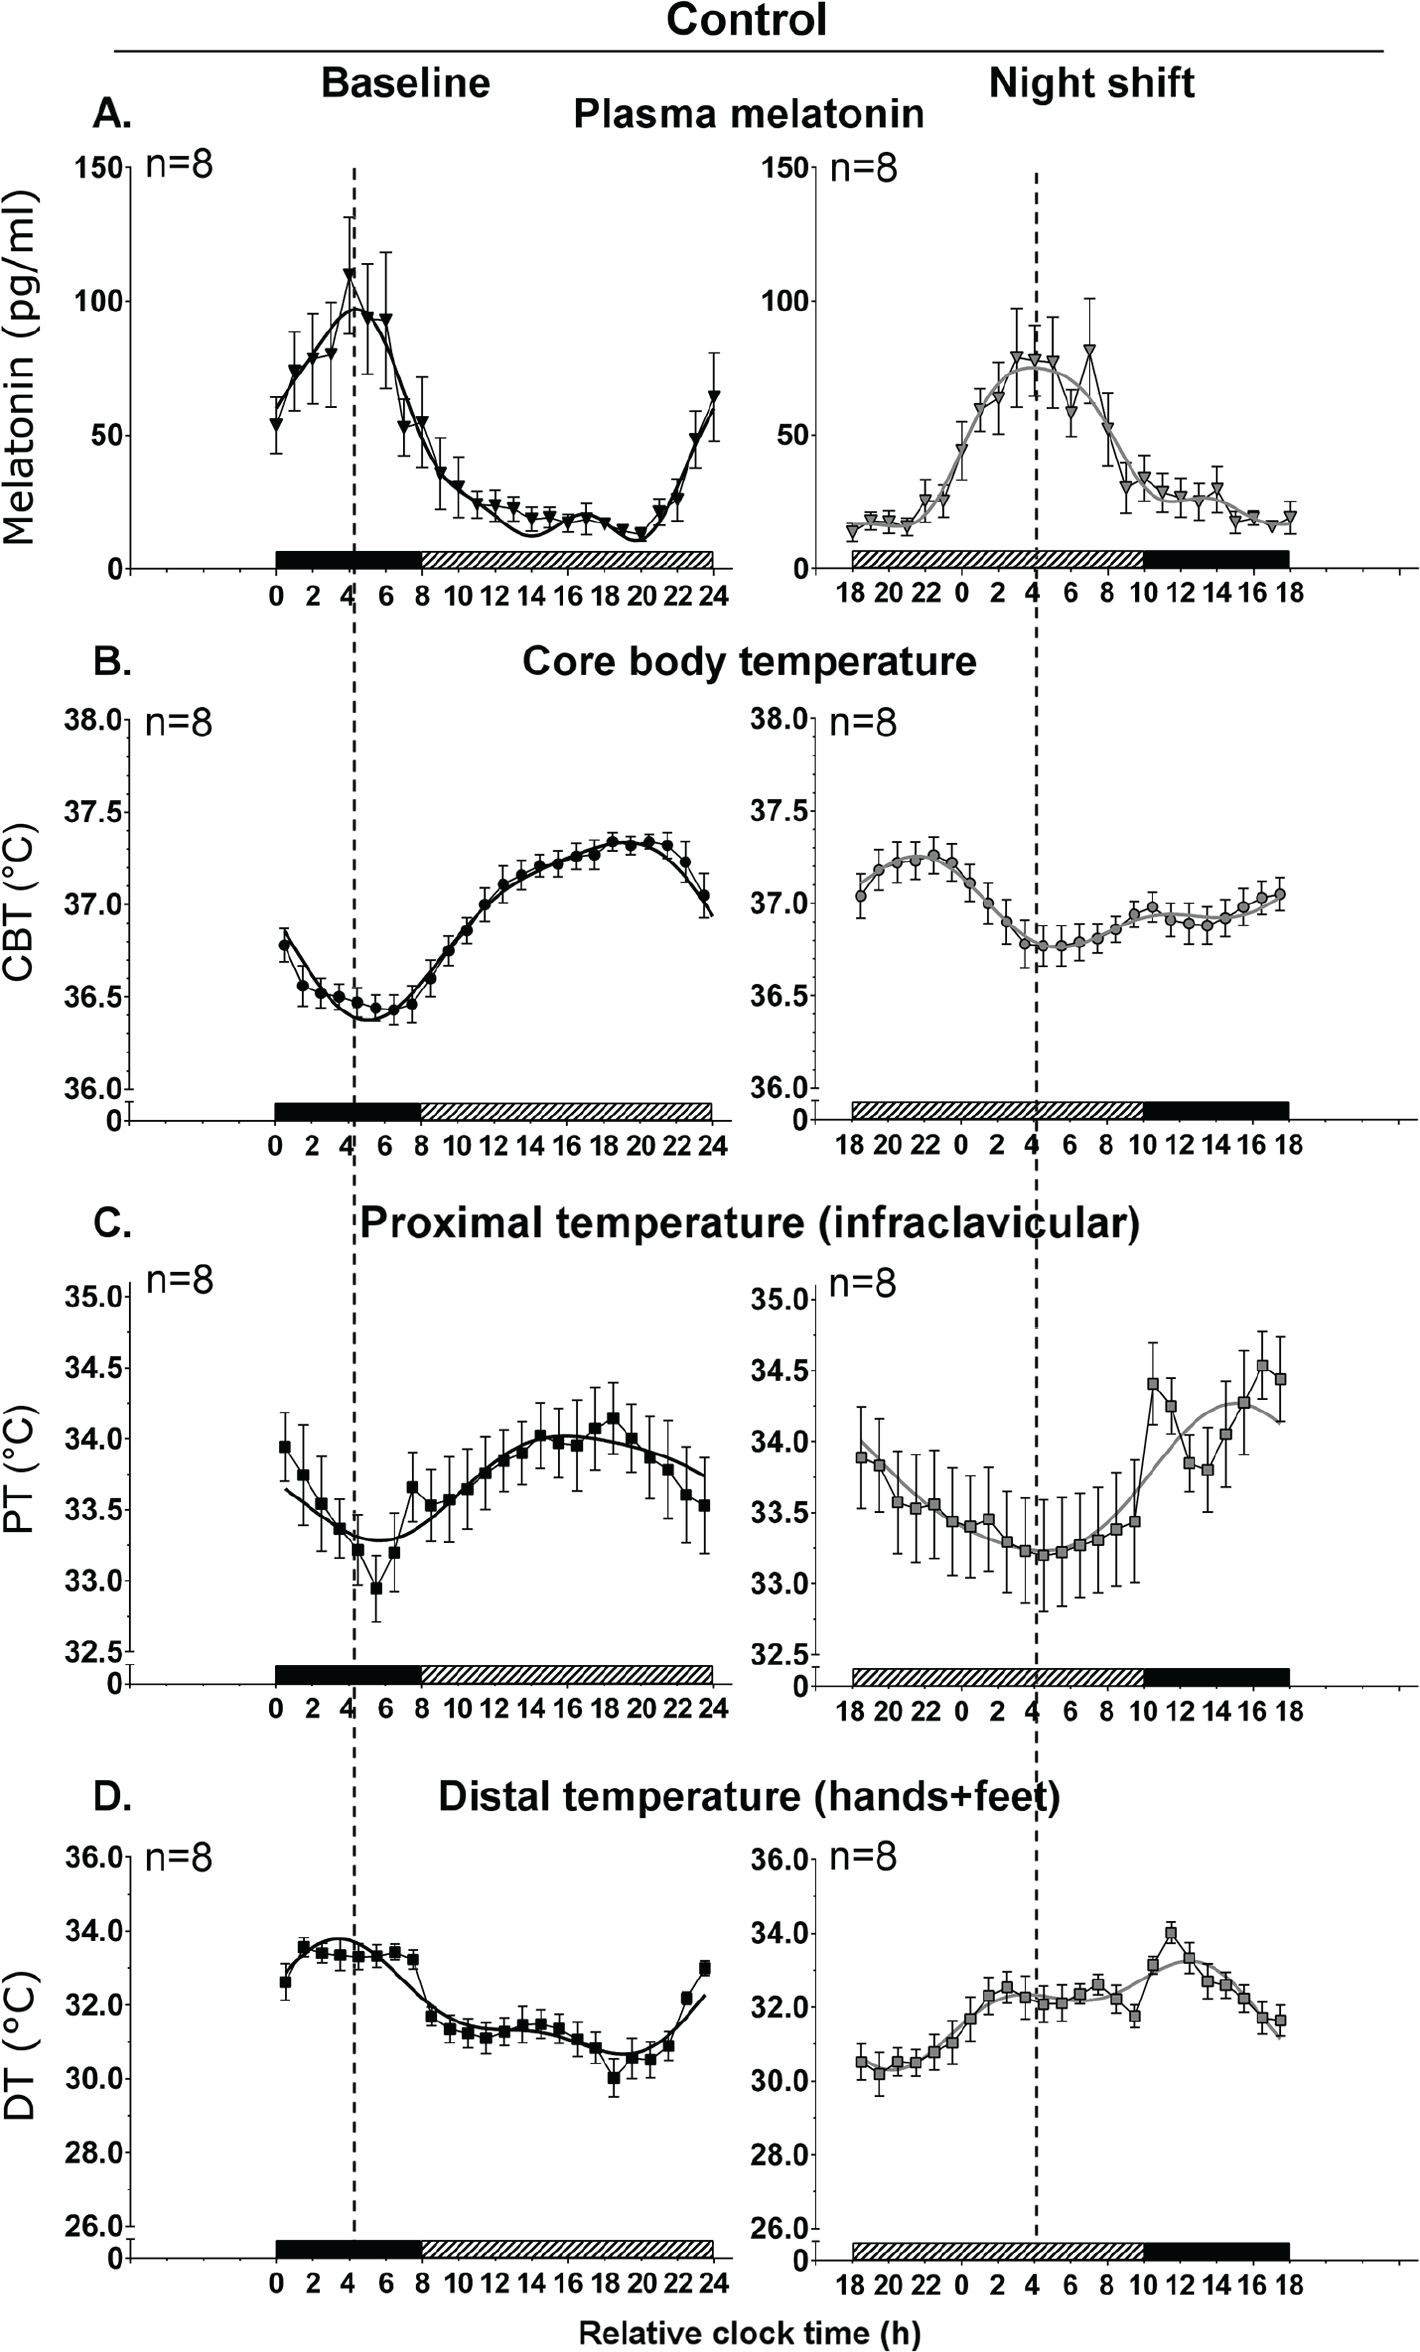
Circadian rhythms relative to wake time in baseline and night shift conditions in the control subgroup (n = 8). Mean levels (± SEM) and group harmonic regression are reported for plasma melatonin (pg/ml) (A), core body temperature (CBT, °C) (B), proximal temperature (PT, °C) (C), and distal temperature (DT, °C) (D). Baseline and night-shift conditions are represented by black and grey symbols for mean levels, respectively, and by black and grey lines for harmonic regressions, respectively. Bedtimes and wake times at baseline were assigned a relative clock time of 0000 hours and 0800 hours, respectively (x-axis). Above the x-axis, the black and hatched bars represent the 8-h sleep and 16-h CP procedure at each visit episode, respectively. The vertical dashed line represents the melatonin acrophase and serves to illustrate the phase relationship between the different rhythms.
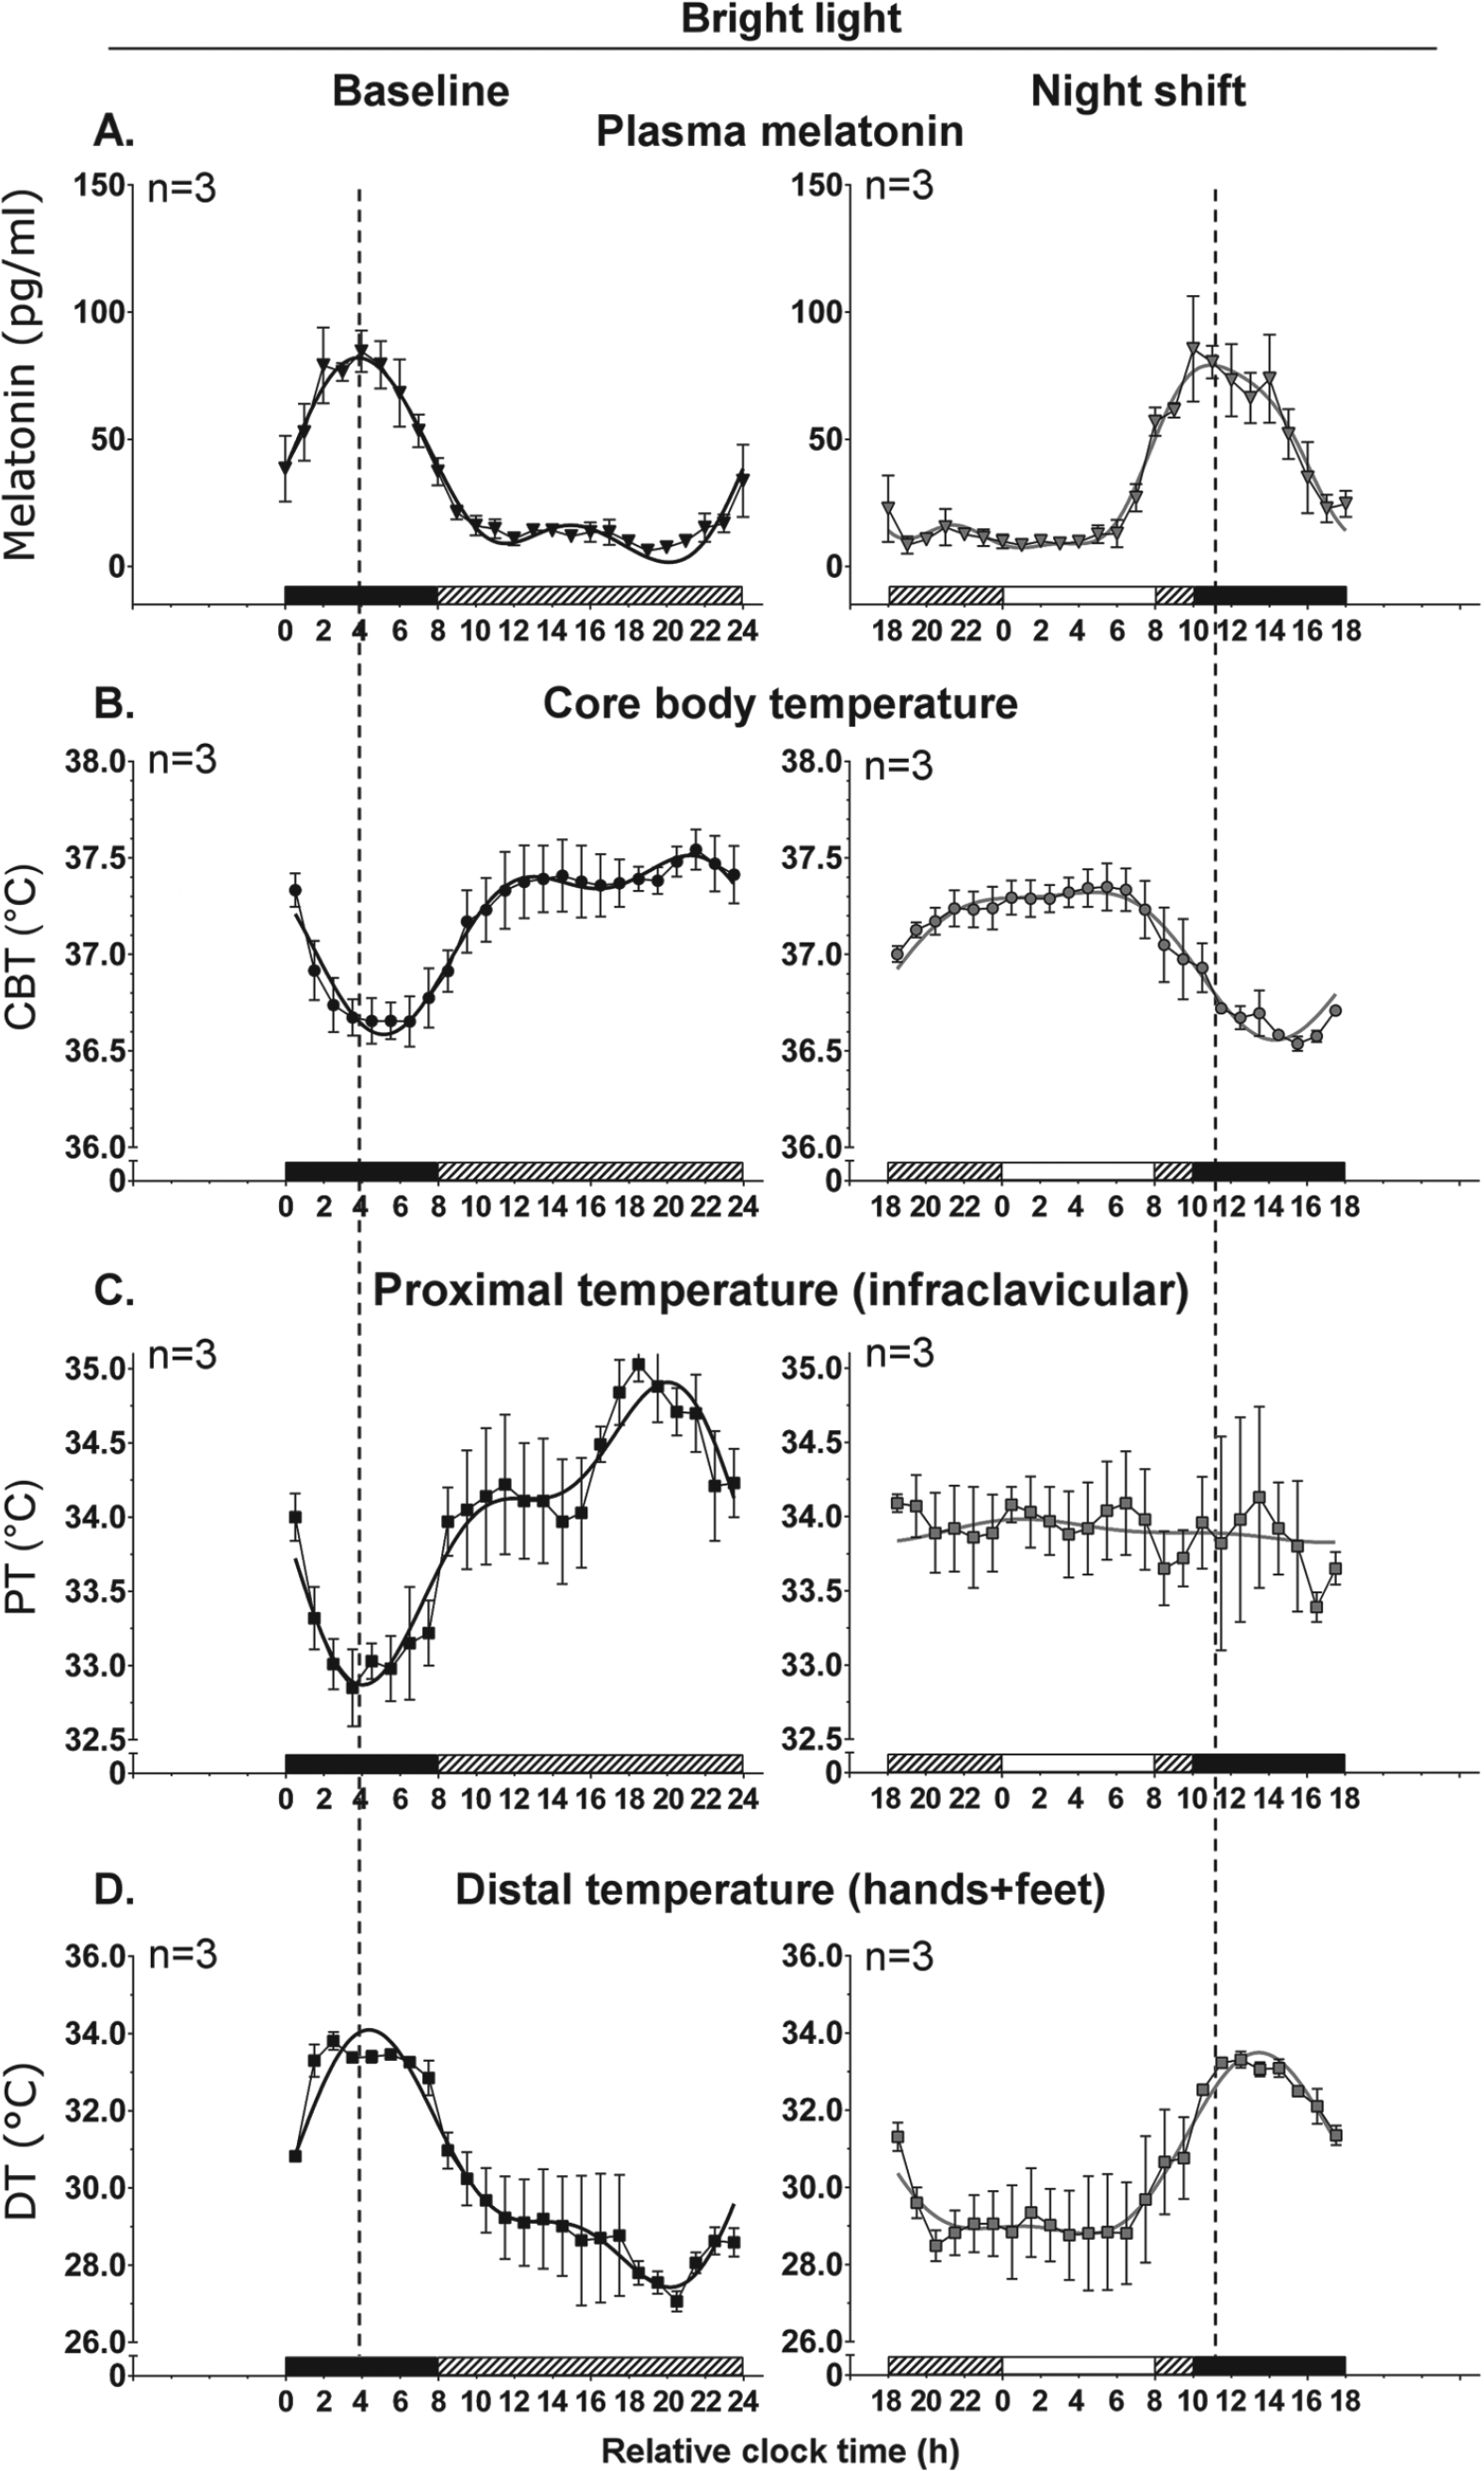
Circadian rhythms relative to wake time in baseline and night-shift conditions in the bright light subgroup (n = 3). Refer to legend of Figure 2. White bars above the x-axis represent the waking episodes in bright light.
Circadian Parameters of Melatonin, CBT, PT and DT rhythms.
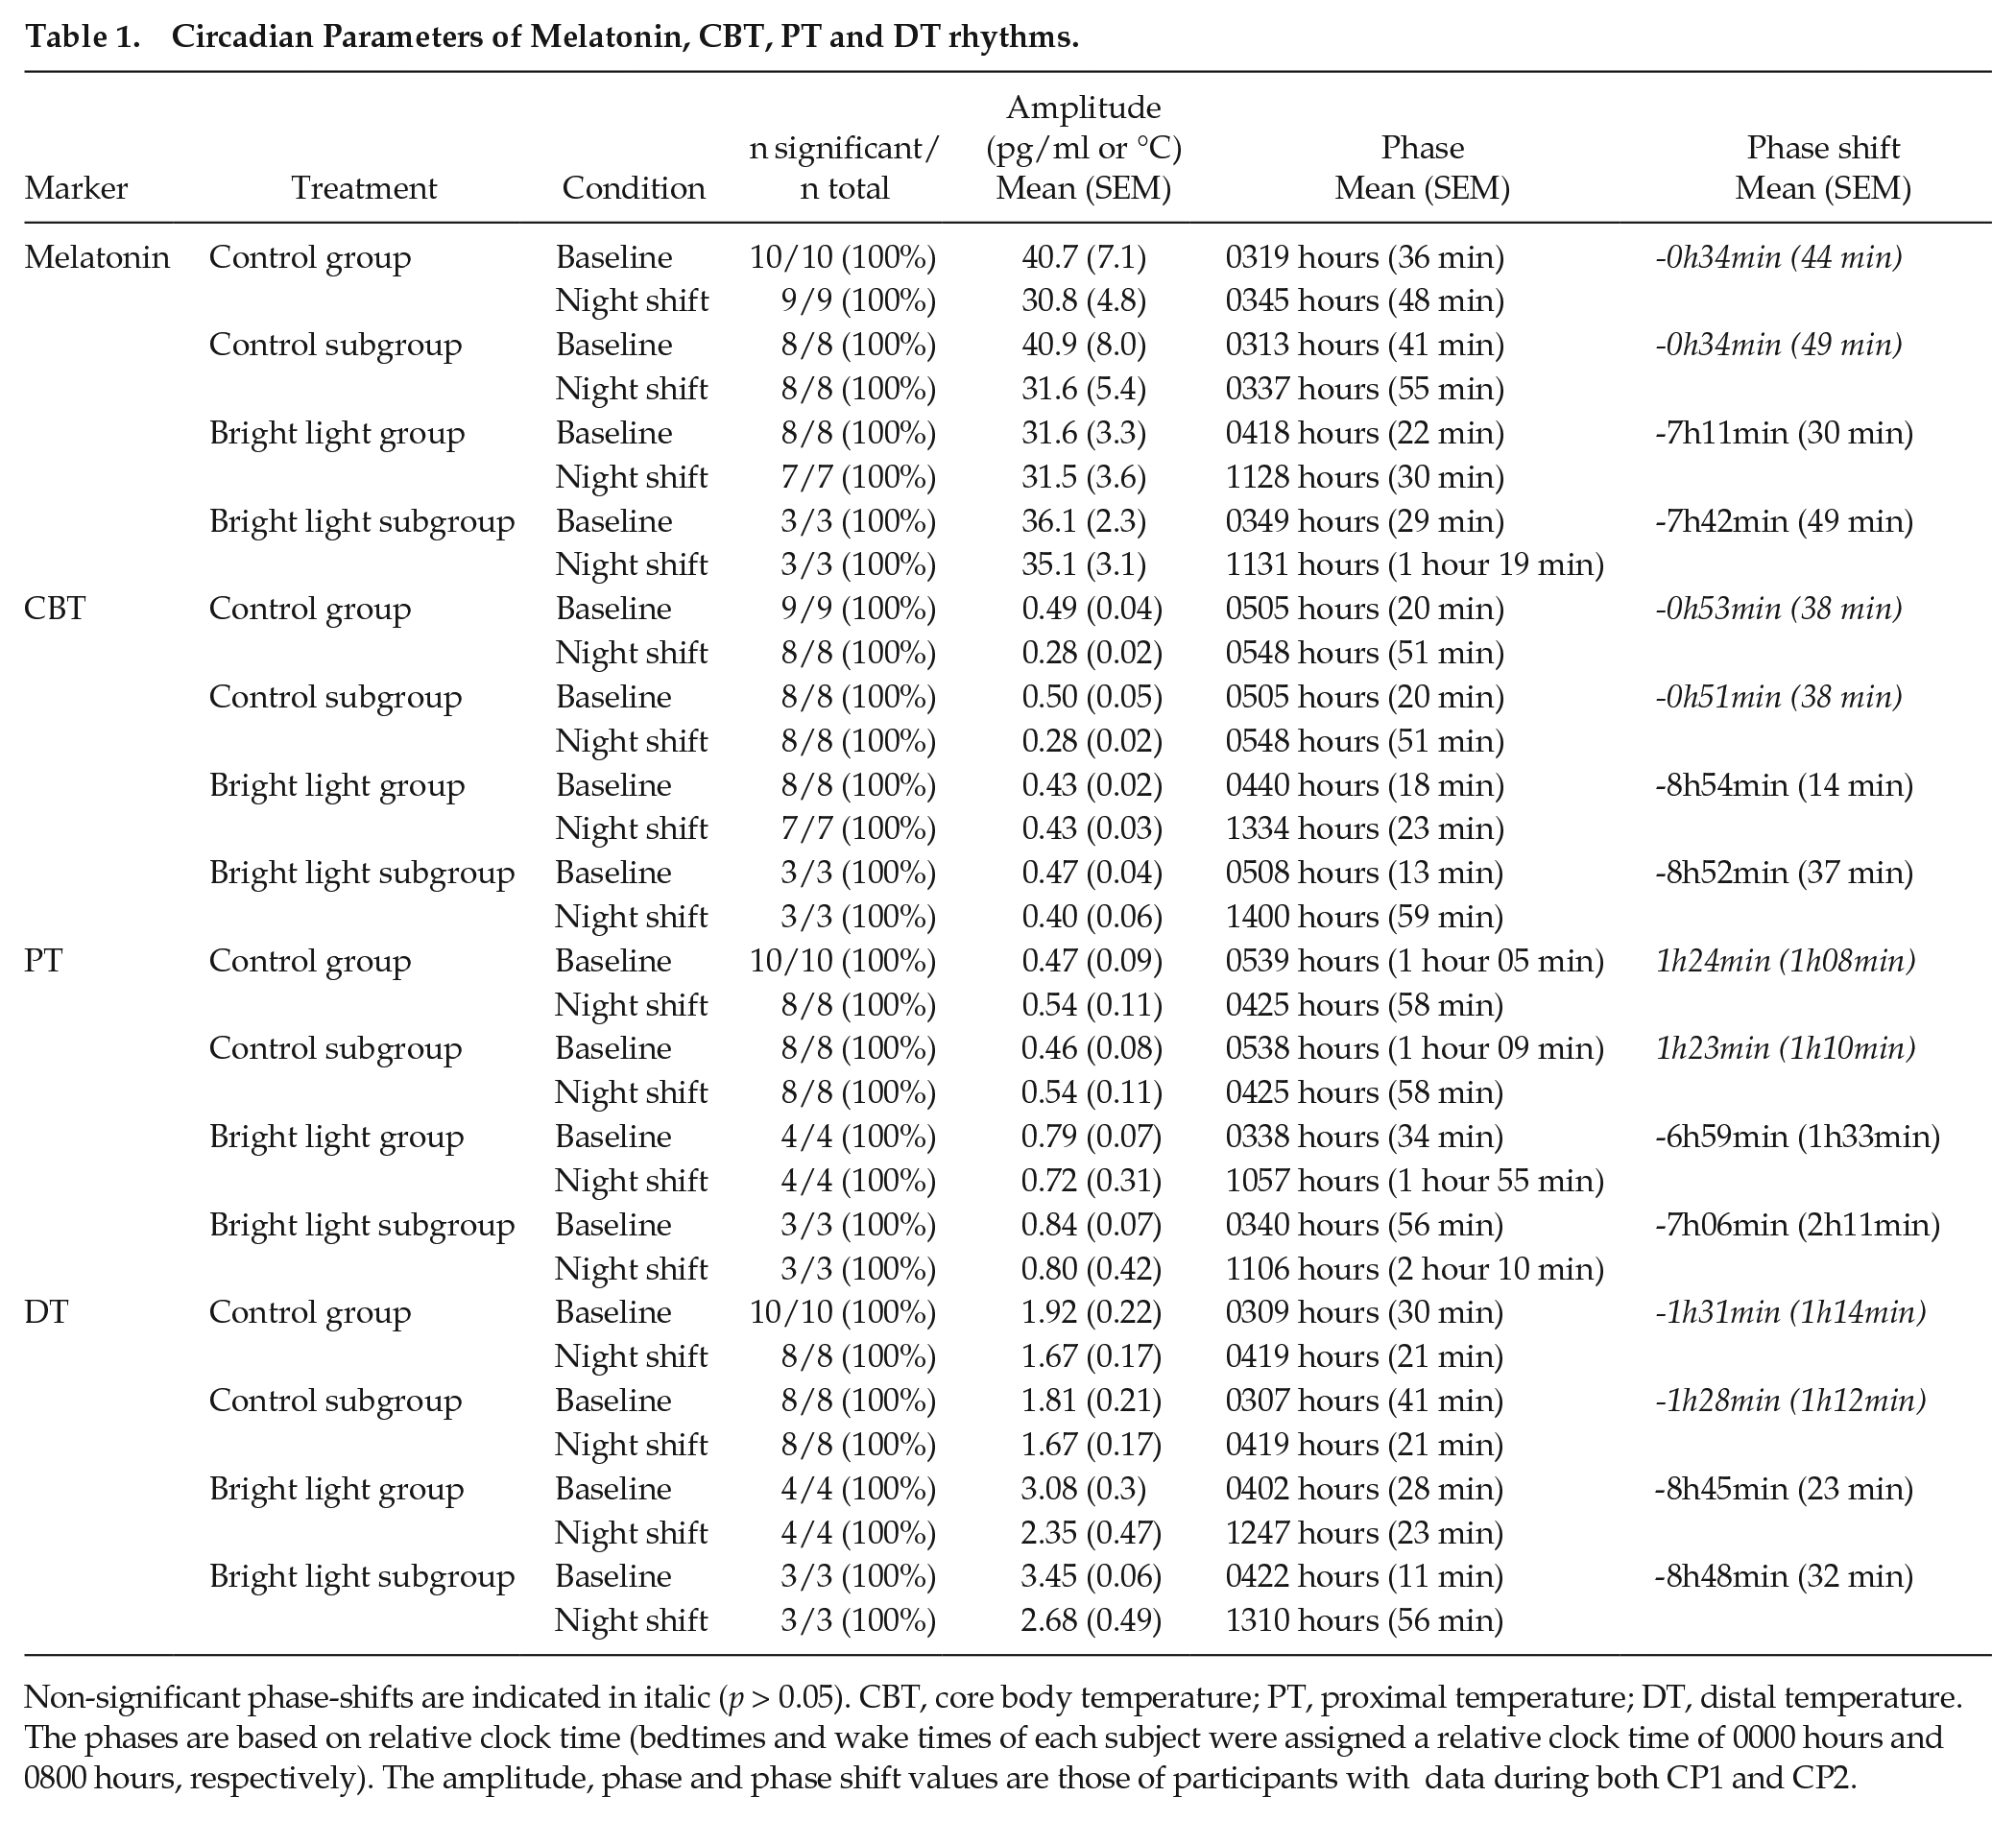
Non-significant phase-shifts are indicated in italic (p > 0.05). CBT, core body temperature; PT, proximal temperature; DT, distal temperature. The phases are based on relative clock time (bedtimes and wake times of each subject were assigned a relative clock time of 0000 hours and 0800 hours, respectively). The amplitude, phase and phase shift values are those of participants with data during both CP1 and CP2.
Mixed Linear Model Results for Melatonin, CBT, PT and DT Rhythms.
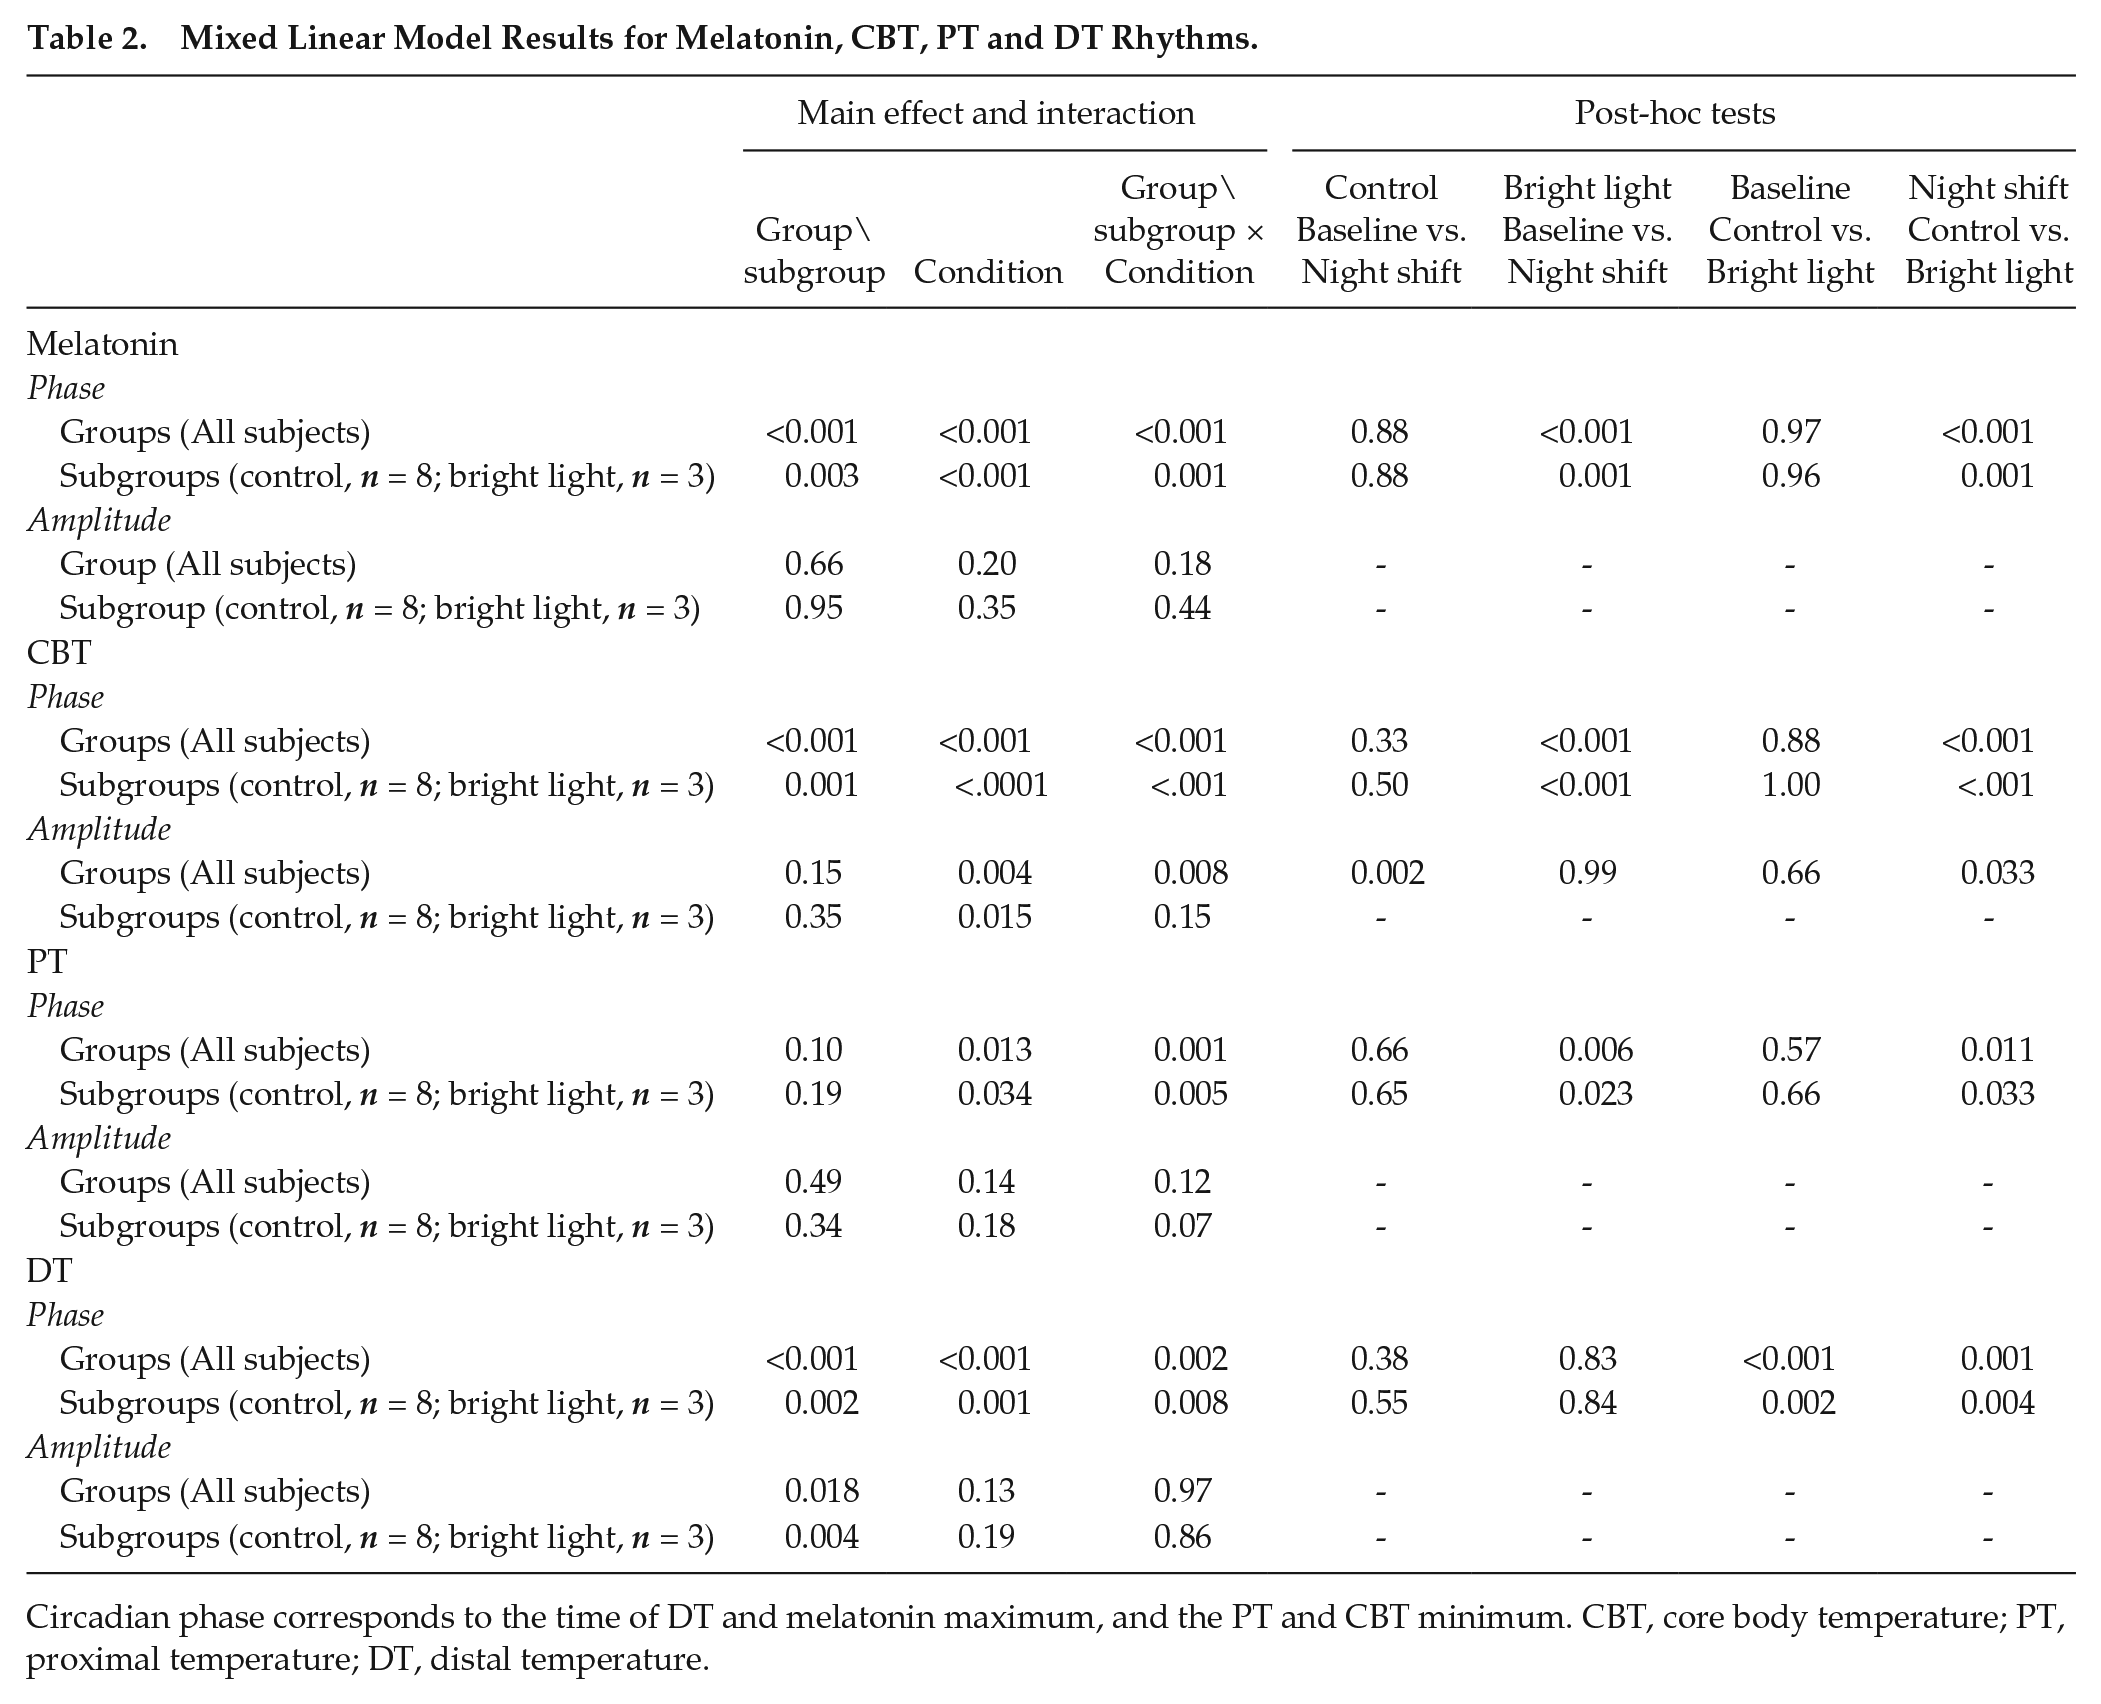
Circadian phase corresponds to the time of DT and melatonin maximum, and the PT and CBT minimum. CBT, core body temperature; PT, proximal temperature; DT, distal temperature.
For illustrative and analyses purposes, bedtimes and wake times were assigned a relative clock time of 0000 hours and 0800 hours, respectively
To assess the circadian variation of body temperature rhythms, we expressed CBT, PT, and DT rhythms relative to the melatonin acrophase, which is a reliable circadian marker minimally influenced by the timing of sleep. For each subject, melatonin acrophase was assigned a circadian phase 0° and used to assign a circadian phase from 0° to 359.9° for temperature data points. This allowed us to follow the phase relationships of these rhythms throughout the experimental protocol for the groups (all subjects, not illustrated) and the subgroups with complete data sets (control, n = 8; bright light, n = 3; Figure 4).
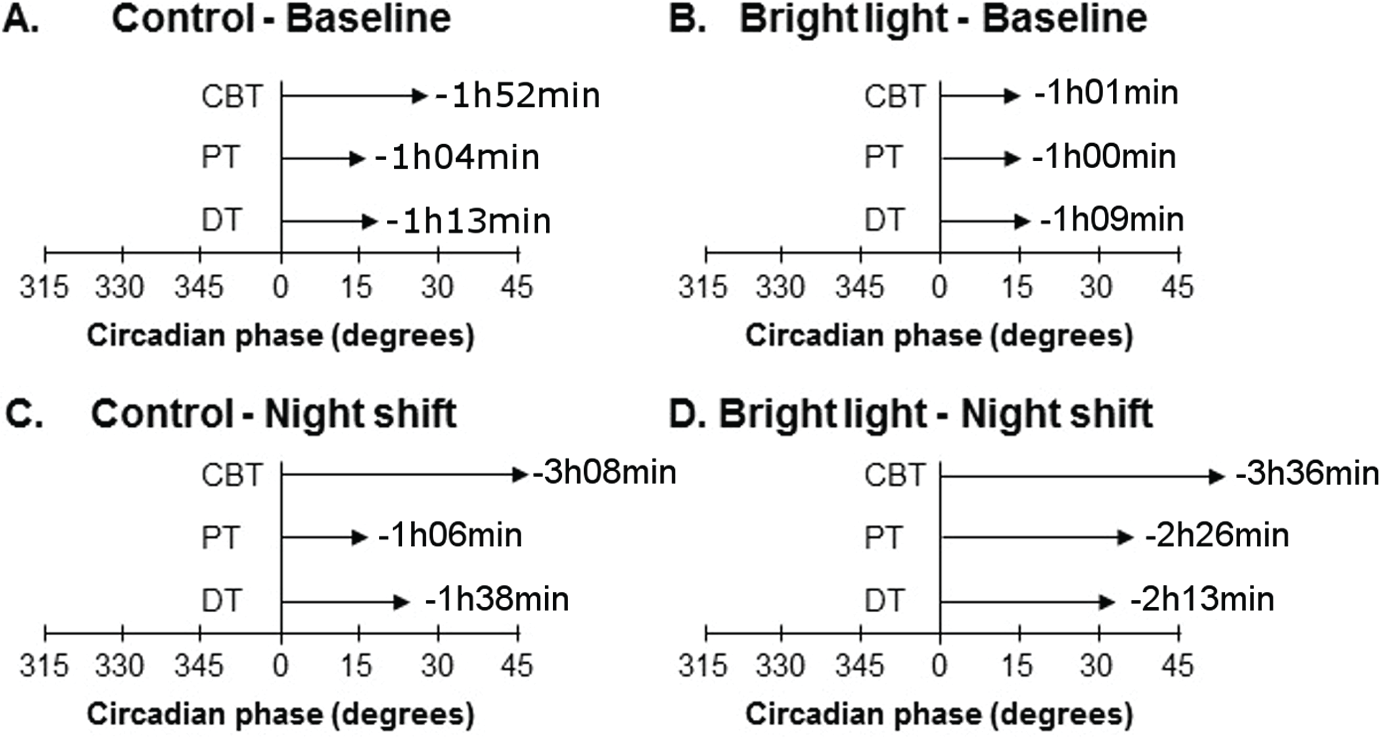
Phase angle of the temperature rhythms relative to the melatonin rhythm in the subgroups (control, n = 8; bright light, n = 3). Mean phase of CBT, PT, and DT are represented relative to the melatonin acrophase (assigned to a circadian phase of 0°). Results are represented at baseline for the control (A) and bright light (B) subgroups and following night shifts for the control (C) and bright light (D) subgroups. The horizontal arrows indicate the phase relationship between the melatonin acrophase and the phase of each marker, and is also indicated in h:min.
In additional analyses, we also expressed PT and DT rhythms relative to the CBT minimum, a widely used and reliable circadian marker. This allowed us to study the phase relationship between CBT, PT, and DT rhythms. In these supplementary analyses, the CBT minimum was assigned a circadian phase 0° and used to assign a circadian phase from 0° to 359.9° to PT and DT data points. Data were then binned into 15° circadian phases (1-h blocks), yielding a curve spanning the 24-h day for the subgroups (control, n = 8; bright light, n = 4; Suppl. Figure S3). We included in this analysis data from S12 (male), as only melatonin data were missing for this subject. These analyses were thus on 4 bright light subjects.
To explore the relationship between melatonin secretion and temperature changes around bedtime, data collected during the second CP procedure were averaged in 2-min bins from 60 min prior to lights-off until 60 min following lights-off (Figure 5). Because the blood sample session at baseline only started 15 min after lights-off during the first CP procedure, we did not conduct this analysis at baseline.
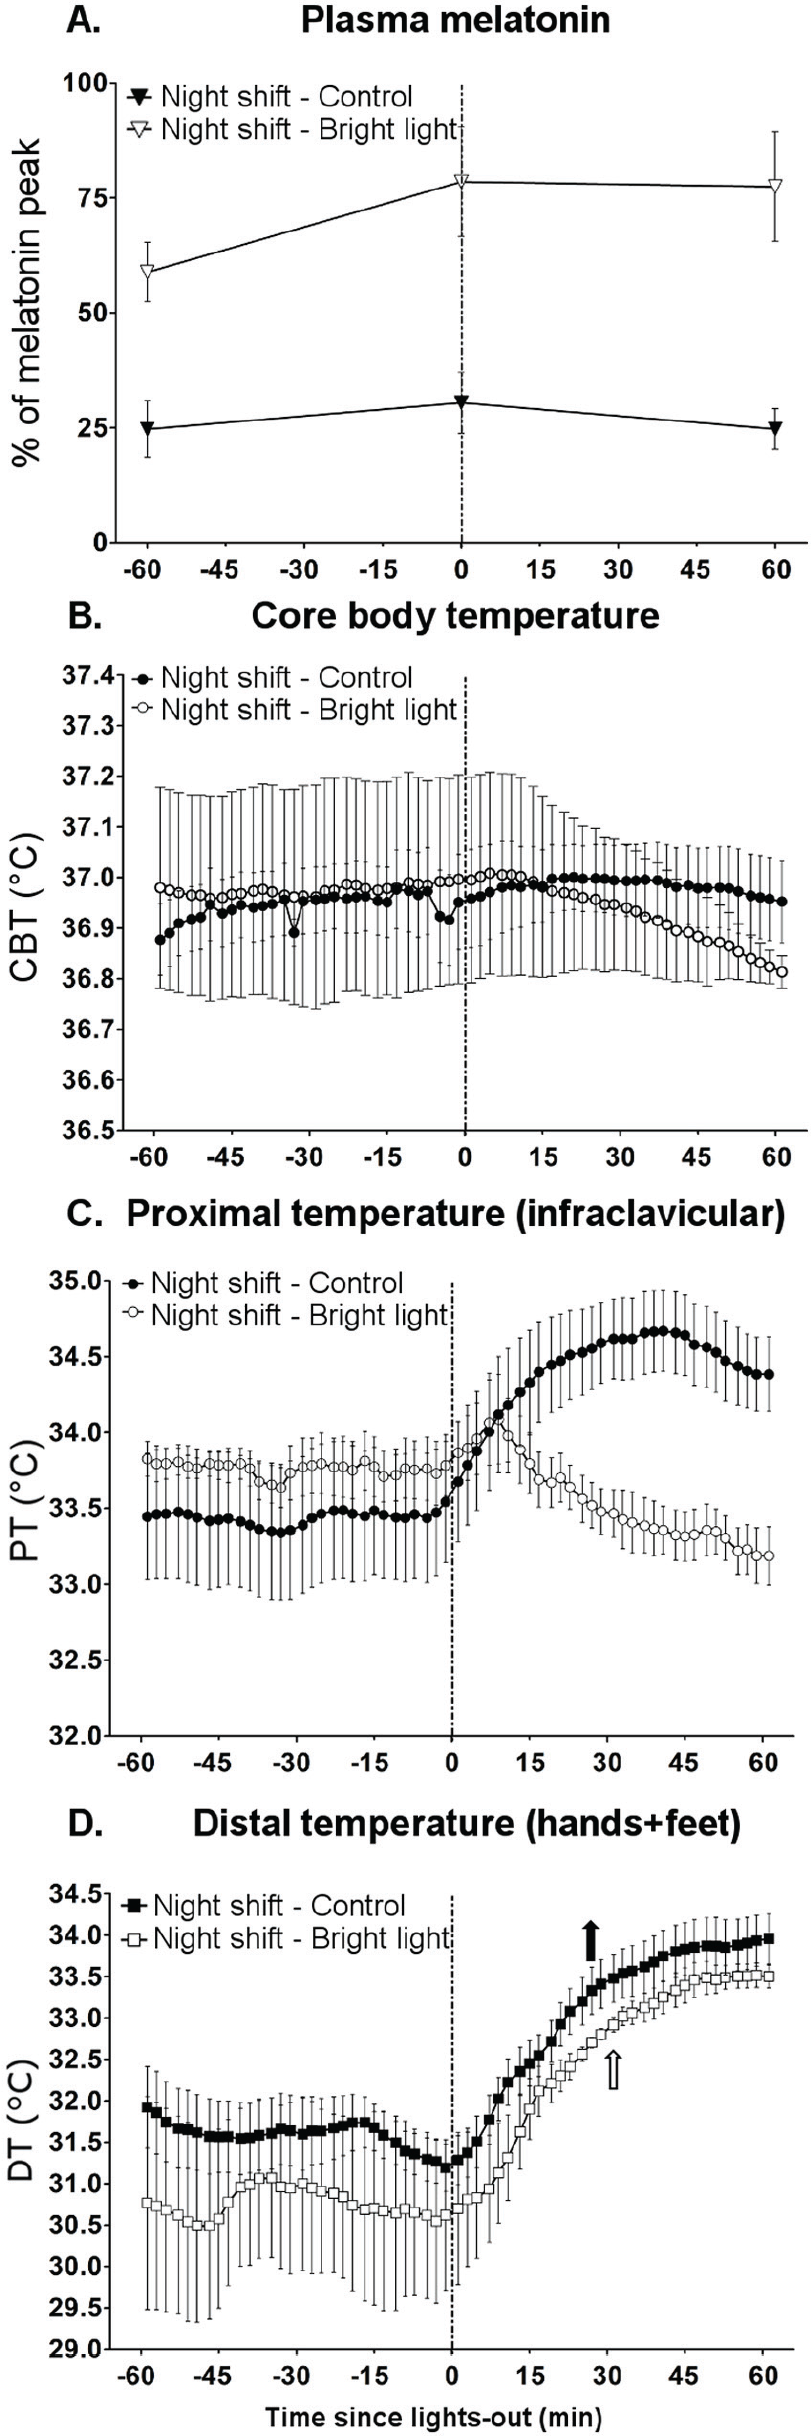
Variations in melatonin and body temperature from 60 min before to 60 min after lights-off under a night-oriented schedule in the subgroups (control, n = 8; bright light, n = 3). Averaged plasma melatonin (±SEM) (triangles, % of the melatonin peak) (A) are reported 60 min before lights-off, at the time of lights-off, and 60 min after lights-off. Averaged 2-min bins (±SEM) are reported from 60 min before lights-off until 60 min after lights-off for CBT (B), PT (C) and DT (D). Parameters from the control and bright light groups are represented by black and white symbols and arrows, respectively. When significant main effects or interactions were found, pairwise comparisons (Newman-Keuls, p < 0.05) were conducted; significant differences are indicated by arrows. Upward arrows indicate the time at which a circadian marker was significantly increased compared with values in the 2-min bin occurring just before lights-off.
Statistical Analyses
Data are presented as mean (SEM), except demographic data (age, body mass index (BMI), chronotype, menstrual cycle length), which are reported as mean (SD). Values of p < 0.05 are considered significant. Data regarding participants were analyzed with parametric (light intensity) or non-parametric (age, chronotype, BMI, sleep duration) t-tests.
Harmonic regressions were applied to each subject’s CBT, PT, and DT data train during the first (8-h baseline nocturnal sleep period and 16-h first CP) and second (16-h second CP and 8-h diurnal sleep period on experimental day 6) sampling sessions to assess the circadian phase and amplitude at baseline and under a night-oriented schedule (Prism 6, GraphPad Software Inc., San Diego, CA, USA). We set the “period” parameter of the regression to 24 h instead of allowing the regression to calculate the period value without restriction. A rhythm was considered significant when the 95% confidence interval of the calculated amplitude did not include the zero value and only significant rhythms obtained during both sampling sessions for a given subject were considered in the statistical analyses. A dual-harmonic regression was used to assess rhythms of CBT, PT, and DT (James et al., 2007b; Shechter et al., 2011) and a 3-harmonic regression was used to assess the rhythm of melatonin (Shechter et al., 2012; Cuesta et al., 2015; Cuesta et al., 2016). These regressions provided fitted amplitudes and phases that were then used to calculate composite phases (via a manual process) corresponding to the time of DT and melatonin maximum, and the PT and CBT minimum. Circadian amplitude was defined as the mean-to-trough difference of the first harmonic of the regression (Jewett et al., 1994). Composite phases were then averaged by group for baseline and night-shift conditions for visual representation (individual and averaged phases are reported in Figure 1B, D). The average composite phase was calculated using the circular mean rather than the arithmetic mean, providing a more appropriate assessment of the phase (Refinetti et al., 2007).
To statistically assess phase shifts and amplitude changes between the baseline and night-shift conditions with or without bright light, we used a mixed linear model (mixed SAS procedure, SAS Institute, Cary, NC, USA). This model tested for a main effect of group (control, bright light), condition (baseline, night shift), and their interaction on the phase and amplitude of melatonin, CBT, PT and DT rhythms. When an interaction was significant, a Tukey post-hoc test was used. As this model allows for missing values, all data were first included (see Table S1). These analyses were repeated in a subgroup of subjects for which complete data set were available for all parameters in both the baseline and night shift conditions (control, n = 8; bright light, n = 3).
As sex differences exist in the phase angle of CBT rhythm and the sleep period (Boivin et al., 2016), data were statistically analyzed with and without the inclusion of female subjects (control, n = 1; bright light, n = 1). Similar results were found and therefore we only reported those including both males and females.
In addition, harmonic regressions were applied on group data (nonlinear mixed-effect models using nlmixed SAS procedure (Cuesta et al., 2015) to obtain a regression curve at the level of the group (Figure S1 and S2) and different subgroups (Figures 2, 3 and Suppl. Figure S3) for visual representation.
Analyses of changes in melatonin, CBT, PT, and DT around bedtime of the diurnal sleep period were done using a 2-way ANOVA for repeated measures (factors: group, time) followed by Newman-Keuls post-hoc tests when significant main effects or interactions were found. For CBT, PT, and DT, using pairwise comparisons, we compared the value occurring in the 2-min bin before lights-off to the other values.
Results
Circadian Rhythms of Melatonin, CBT, DT, and PT at Baseline
Throughout this article, the reported results are based on individual analyses, unless stated otherwise. Thereafter, “groups” refer to all individuals (see Suppl. Table S1) and “subgroups” refer to subjects for which all data were available for each parameter (melatonin, CBT, DT and PT) in both baseline and night-shift conditions (control, n = 8; bright light, n = 3).
At baseline, all subjects of both the control and bright light groups expressed significant plasma melatonin, CBT, DT, and PT rhythms (phases are reported in Figure 1B, D and Table 1). The nlmixed procedure also revealed significant rhythms for all parameters for the groups (Suppl. Figures S1 and S2) and the subgroups (Figures 2 and 3). For a given rhythm, the phases observed in each group were similar (see Table 2 for p values) and occurred at conventional times of day. Namely, the troughs of CBT and PT rhythms, as well as melatonin and DT acrophases, happened during the nocturnal sleep episode (Figure 1B, D, Table 1). More precisely, at baseline, CBT, PT and DT phases occurred shortly after the melatonin acrophase in both the control and bright light groups and subgroups (Figure 4A, B). This indicates a similar relationship between the central clock and body temperature rhythms at baseline in both groups. Relative to the CBT minimum, the trough of the PT rhythm occurred at 18.7° (9.5°) and 352.6° (9.5°) in the control and bright light subgroups (control, n = 8; bright light, n = 4), respectively (75 min after and 30 min before the CBT minimum, respectively; Suppl. Figure S3A). The peak of the DT rhythm occurred at 344.8° (4.5°) and 355.8° (3.1°) in the control and bright light subgroups, respectively (61 min and 17 min before the CBT minimum, respectively; Suppl. Figure S3B), as previously observed (Krauchi and Wirz-Justice, 1994; Shechter et al., 2011).
Effects of a Night-oriented Schedule on Melatonin, CBT, DT, and PT
Following night shifts, all circadian parameters remained significantly rhythmic for each subject (phases are reported in Figure 1B, D and Table 1) in both groups (Suppl. Figures S1 and S2) and subgroups (Figures 2 and 3). In the control group and subgroup, the phases of plasma melatonin and CBT rhythms were not significantly shifted in response to the night-oriented schedule (Figure 1B; see Table 1 for average phases and phase shift values; see Table 2 for p values). There was no amplitude change for the melatonin rhythm in response to night shift (see Table 1 for amplitude values; see Table 2 for p values) whereas CBT amplitude was significantly reduced in the control group under the night-oriented schedule, a difference not observed in the subgroup (Table 2).
In the control group following night shifts, the circadian profiles of DT and PT were significant, but different to those observed at baseline (Figure 2). Before calculating phase shifts between final and initial assessments for DT and PT rhythms, we wanted to make sure to correctly assess their circadian phase. Indeed, on the final assessment, we observed 2 acrophases for DT in the control group (Suppl. Figure S1D) and subgroup (Figure 2D): the first one occurring at a similar time as the baseline acrophase (therefore not shifted compared to baseline), and the second (with a higher peak) occurring in the middle of the delayed sleep period. This second acrophase was coincidental to the rapid increase of DT following lights-off at bedtime (Figure 2D and Suppl. Figure S1D), which corresponds to the evoked component of the DT rhythm. As for melatonin, the first DT acrophase was not shifted compared to baseline and was used to calculate the resetting of the endogenous circadian system. Interestingly, under a night-oriented schedule, the PT rhythm still expressed a trough at a similar time as that observed at baseline in both the group (Suppl. Figure S1C) and the subgroup (Figure 2C), which corresponds to the endogenous component. In addition, it also displayed an increase following lights-off at bedtime, which corresponds to the evoked component.
We expressed CBT, PT, and DT (the first acrophase) phases relative to the melatonin acrophase for the groups and the subgroups (Figure 4A, C for controls) and observed that they all occurred later than the melatonin acrophase, as observed in baseline.
To further explore the relative contribution of the endogenous and evoked components, we expressed DT and PT rhythms relative to CBT minimum in the subgroup (Suppl. Figure S3) and calculated at what phase of the CBT rhythm were PT and DT phases observed. The trough of the PT rhythm occurred at 320.1° (24.6°) (2h40 min before CBT minimum; Suppl. Figure S3A), and the peak of DT rhythm at 342.7° (4.7°) (1h10min before CBT minimum; Suppl. Figure S3B).
Based on our observation of the endogenous and evoked components on skin temperature rhythms, we used the first DT acrophase and the first PT trough to calculate the phase shifts induced by night shift in the control group and found that they were not significant (Figure 1B; Tables 1 and 2).
Photic Resetting of Melatonin, CBT, PT, and DT Rhythms
Bright light induced significant phase delays of −7h11min (30 min) and −8h54min (14 min) for melatonin and CBT rhythms, respectively (Figure 1D; group analysis in Tables 1 and 2). Similar significant phase delays (−7h42min [49 min] for melatonin rhythm and −8h52min [37 min] for CBT rhythm) were observed for the bright light subgroup (Tables 1 and 2). There was no amplitude change for melatonin and CBT rhythms in response to simulated night shift in bright light in the group and subgroup (Tables 1 and 2).
In addition, bright light induced significant phase delays for PT (Figure 1D; Tables 1 and 2; −6h59min [1h33min] for the group and −7h06min [2h11min] for the subgroup) and DT rhythms (Figure 1D; Tables 1 and 2; −8h45min [23 min] for the group and −8h48min [32 min] for the subgroup). Interestingly, they were of similar magnitude as the phase delays observed for melatonin and CBT rhythms. There was no amplitude change for PT and DT rhythms in response to night shift in both the bright light group and subgroup (Tables 1 and 2).
The shifting effect of bright light was also observable when we represented the CBT, PT, and DT phases relative to the melatonin acrophase for the group and subgroup (Figure 4D). All phases occurred after the melatonin acrophase as it was observed at baseline. In addition, we calculated the phase relationship between CBT, PT, and DT rhythms for the bright light subgroup following night shifts (Suppl. Figure S3). The trough of the PT rhythm occurred at 338.8° (9.2°) (1h25min before CBT minimum; Suppl. Figure S3A) and that of the DT rhythm occurred at 355.1° (3.8°) (20 min before CBT minimum; Suppl. Figure S3B).
Relationship between Melatonin Levels, Increased DT and PT, Decreased CBT and Bedtime
We analyzed changes occurring from 60 min before to 60 min after lights-off under a night-oriented schedule in the control (n = 8) and bright light (n = 3) subgroups. We first expressed melatonin levels at −60 min, 0 min and +60 min from lights-off as percentages of the individual maximum melatonin levels (Figure 5A). By comparing the control and bright light groups following night shifts, we found a main effect of group (p < 0.001), but no main effect of time (p = 0.35) or interaction (p = 0.12). This indicates that the melatonin levels did not significantly change from the hour before to that following lights-off in both groups. Notably though, during this 2-h period, melatonin levels were significantly higher in the bright light group than in the control group (71.6% vs. 26.7% of the melatonin peak, respectively, p < 0.001). Although melatonin levels were stable during this 2-h period, we observed an effect of time on CBT (main effect of group, p = 0.33; main effect of time, p < 0.001; interaction, p = 0.11) and significant effects for PT (main effect of group, p = 0.64; main effect of time, p < 0.001; interaction, p < 0.001) and DT values (main effect of group, p = 0.24; main effect of time, p < 0.001; interaction, p = 0.1) in both groups (Figure 5). For DT, values were significantly higher from +26 min and +28 min after lights-off in the control and bright light groups, respectively (Figure 5D).
Discussion
To our knowledge, the present study is the first to show that bright light at night can efficiently reset skin temperature rhythms in human subjects following several cycles of a night-oriented schedule. As skin temperature shifts concomitantly with melatonin and CBT rhythms, these results support the use of DT as a marker of the endogenous circadian system.
By using a data train collected during a CP procedure and a sleep period, we observed skin temperature rhythms under a day-oriented schedule similar to what was previously reported in CR (in which sleep is replaced by constant waking; see Krauchi and Wirz-Justice, 1994). Here, the DT rhythm was based on skin temperature recorded on the subject’s hands and feet. Under a day-oriented schedule, DT reached maximal values at night, shortly before CBT minimum, confirming reports made in both laboratory and field conditions (Krauchi and Wirz-Justice, 1994; Krauchi et al., 2014). PT results were more variable. We used the infraclavicular fossa to measure PT during an 8-h sleep episode and a 16-h CP procedure and found results similar to what was shown with CR only (Krauchi and Wirz-Justice, 1994). The PT minimum occurred 88 min before the CBT minimum in the bright light subgroup, and 33 min after the CBT minimum in the control subgroup. This unusual phase relationship at baseline in the controls resulted from a high inter-individual variability with a late PT trough (~1000 hours) observed in 2 subjects and an earlier trough in the other 2 subjects (trough between 0300 hours and 0600 hours). This unusual phase relationship was not observed under the night-oriented schedule, as the PT minimum occurred before the CBT minimum in both subgroups. Interestingly, a recent field study under a day-oriented schedule showed that PT rhythms (infraclavicular region, sternum and thigh) were similar to DT rhythms with maximal values occurring during the nocturnal sleep period (Krauchi et al., 2014). In that field study, the shape of the PT rhythm recorded at the infraclavicular region was inverted compared to what was observed here and in a previous study (Krauchi and Wirz-Justice, 1994). The cause of these inconsistencies are unclear but could be influenced by more variable masking effects on PT from the sleep, postural changes, light exposure, levels of activity, and food intake in field conditions.
Following night shifts, all the circadian parameters we measured in the control group and subgroup were still rhythmic, but not realigned to the delayed sleep-wake cycle. Therefore, the conventional phase relationship between these rhythms and the sleep-wake cycle was lost as reported in previous night shift studies (Boivin, 2007; James et al., 2007b; Boivin et al. 2012a, 2012b; Morris et al., 2012; Boivin and Boudreau, 2014; Cuesta et al., 2016; Morris et al., 2016). We expressed PT and DT rhythms relative to both the melatonin acrophase and CBT minimum, two reliable and widely used circadian markers. We observed that the phase relationships between the circadian component of CBT, DT, and PT rhythms were essentially preserved before and after an abrupt shift in the timing of sleep, supporting their endogenous circadian component.
The simulated night shift protocol induced a temporal dissociation between the endogenous circadian system and the sleep-wake cycle (Klerman et al., 1999), both of which affect body temperature rhythms. In addition to the circadian control of skin temperature rhythms, it is well known that there is an increase in DT triggered by an evoked bedtime increase in skin blood flow at the extremities (Krauchi et al., 2006). Under a day-oriented schedule, both endogenous and evoked components lead to an increase in DT at night. Under a night-oriented schedule, the circadian increase in DT still occurred at a similar clock time as baseline, whereas a second evoked peak occurred ~10 h later, at the new shifted bedtime during the day. Knowing that both melatonin and CBT rhythms were not shifted in response to night shift in controls, and considering the correlation between CBT and DT rhythms, we concluded that the first DT acrophase was controlled by the circadian system whereas the second acrophase was an evoked response to changes in the timing of sleep. As for DT, we observed an increase in PT at bedtime following night shift, more evident in the control group (Fig. 2 and Supplemental Fig. S1) and consistent with similar observations under a day-oriented schedule (Krauchi et al., 2000); although, contradictory results have been reported (Krauchi et al., 2014).
Since melatonin onset was proposed to trigger the changes observed in skin temperature around bedtime (Krauchi et al., 2006), we verified whether this was still the case under simulated night-shift conditions. Under a day-oriented schedule, we could not report the melatonin levels the hour before lights-off because blood sampling only started 15 min after lights-off. Nevertheless, melatonin levels observed at baseline in the control (n = 8) and bright light (n = 3) subgroups at 1 h after lights-off were 64.8% and 58.0% of the baseline nocturnal melatonin peak, respectively. Under a night-oriented schedule, the levels of melatonin around bedtime were low in the control subgroup (26.7% of the melatonin peak) and higher in response to phototherapy (71.6% of the melatonin peak), as nocturnal bright light exposure corrected the misalignment between the circadian system and the shifted sleep schedule. In the bright light subgroup, these levels were slightly higher than those observed at the same period at baseline, because the melatonin rhythm was not completely adjusted to the night-oriented schedule and, therefore, peak levels occurred earlier in the daytime sleep period. These observations suggest that the melatonin onset—even if it might participate in the modulation of the vascular tone leading to changes in DT under a day-oriented schedule—is not the main factor involved in these changes at bedtime.
As the peak of DT occurs before the CBT minimum, the circadian increase in DT precedes the circadian decline in CBT. This suggests the presence of a possible circadian clock in blood vessels, or central and peripheral control of the DT rhythm. The increase in DT observed at lights-off could be a consequence of the relaxation-induced vasodilation resulting from a withdrawal of sympathetic tone in precapillary muscles involved in regulating peripheral blood vessels (Krauchi, 2007). It has been proposed that melatonin and thermoregulatory changes are associated with sleep initiation (Krauchi et al., 2000; Cajochen et al., 2003). Our results and those of a previous study, which demonstrated that the lack of melatonin in tetraplegic patients (Zeitzer et al., 2000) did not suppress the ability to sleep, rather challenges the idea of a causal role for melatonin in that series of events. Nonetheless, it might be possible that melatonin synthesized in extra-pineal organs and tissues, such as the skin (Slominski et al., 2012), influences thermoregulatory changes at bedtime. Other mechanisms have been proposed to explain the thermoregulatory changes leading to skin temperature variations and their relationship with sleep. The circadian master clock (i.e., suprachiasmatic nucleus) itself could influence thermoregulatory brain areas, through neuronal connections towards the dorsal subparaventricular zone (Van Someren, 2006). In addition, the suprachiasmatic nucleus could modulate neuronal networks involved in both sleep- and temperature-regulating systems, such as the hypothalamic preoptic area and diagonal band but also in the adjacent basal forebrain (Van Someren, 2006).
The 3-cycle 8-h bright light exposure at night allowed an almost complete adjustment of plasma melatonin and CBT rhythms to a night-oriented schedule, as previously reported (Boivin and James, 2002; James et al., 2007b). This intervention induced a 7- to 9-h phase delay for these 2 central markers, which was very close to the 10-h shift of the sleep-wake cycle. Importantly, we showed, for the first time, that PT and DT rhythms were also phase delayed to a similar extent (7 to 9 h) and almost adapted to the night-oriented schedule. In the bright light group, the phase relationship between the CBT, DT, and PT rhythms was preserved and the evoked increase in DT occurring at lights-off was superimposed to the increase due to the circadian system, as observed under a day-oriented schedule. Taken together, these results confirm that bright light exerted a similar resetting effect on all circadian markers studied.
Based on the results of the present study, we propose that skin temperature can be used to assess circadian phases in controlled laboratory conditions, such as CP and CR. Under our experimental conditions, including in the presence of a masking factor (sleep under a day-oriented schedule), a desynchronizing factor (simulated night shift), and a strong synchronizer (bright light exposure), skin temperature rhythms were observed at a preserved phase relationship with the CBT rhythm. Other studies have studied skin temperature rhythms in laboratory conditions and in the field, as reviewed in Hasselberg et al. (2013) and Polugrudov et al. (2016). For instance, in ambulatory conditions, using wrist temperature, Sarabia and colleagues (Sarabia et al., 2008) showed that the presence of skin temperature rhythms correlated with actigraphically recorded rest-activity cycles, and that several masking factors, such as sleep, activity, food intake, and light levels, influenced the shape of the rhythm. In addition, the authors showed a normal phase relationship with body temperature (recorded orally under controlled laboratory conditions) and enforced 24-h waking. Since light was not dim, and meals and activity levels were not controlled for, they could not quantify the respective contribution of the endogenous and evoked components on skin temperature rhythms, and to our knowledge, no study has tried this so far. A recent study (Polugrudov et al., 2016) showed that a decreased amplitude of wrist temperature rhythms was associated with subjects suffering from social jet lag. We did not observe a reduction of amplitude of the DT rhythm under a night-oriented schedule but our simulated protocol was only conducted for a few days, and it is possible that such reduction would occur over the long-term.
The present study has a few limitations. The number of subjects in the bright light group with available skin temperature data was low (n = 4). Despite this limitation, we were still able to observe significant rhythms and their resetting by bright light at night similar to what was observed for plasma melatonin and CBT rhythms. It would have been interesting to explore sex differences as the phase angle of CBT rhythm and the sleep period differ between men and women (Boivin et al., 2016). Unfortunately, this was impossible due to our small sample size. Nevertheless, women were studied during their follicular phase to reduce the effect of progesterone on the expression of their body temperature rhythm. The replacement of iButtons during the study could have biased the determination of circadian parameters; although, it is highly improbable it affected our ability to evaluate phase shifts. Indeed, the iButtons were changed only once during CP1, about 6 h before the end of the CP procedure. The circadian amplitude of PT but not that of DT was affected by the removal of the last section of the data. However, the circadian phase of DT and of PT were not affected by the inclusion or exclusion of data following the change. The protocol we used has the advantage of closely mimicking night-shift work schedules but it introduces the presence of a masking factor, namely sleep. Although we observed endogenous circadian and evoked components driving the rhythms of body temperature, we could not quantify their relative strengths. Nonetheless, our experimental design and analyses allowed us to tease apart the impact of these 2 components on our different measures. Additional laboratory studies conducted in a larger group of individuals are needed to confirm that skin temperature is a reliable marker of the central clock. Moreover, field studies under day-oriented and night-oriented schedules should be conducted to verify whether the circadian phase of the skin temperature could still be properly assessed despite the presence of numerous masking factors (sleep, postural changes, light exposure, activity levels, and food intake). This line of investigation could lead to the refinement of skin temperature rhythms as a reliable and non-invasive marker of circadian phase in laboratory and field conditions.
In conclusion, our study shows that in CP, night shifts lead to a desynchronization of melatonin, CBT, and skin temperature rhythms from the sleep-wake cycle, and that the endogenous component of these rhythms maintains a stable temporal relationship and can be shifted in response to bright light exposure at night. These results confirm that bright light at night can alleviate the circadian misalignment induced by night shift (Boivin, 2007). In addition, these results, if confirmed, could have potential applications for the determination of circadian phase. Indeed, we demonstrated that skin temperature rhythms, especially DT, which is less variable than PT, could be used as a substitute to CBT to assess circadian rhythms in controlled conditions minimizing masking factors. While DT has some of the same drawbacks as CBT with regards to sleep-wake conditions, it has clear clinical advantages due to its non-invasive nature. It could thus provide a useful approach for the study of more vulnerable populations, including those suffering from psychiatric and neurodegenerative diseases in which circadian deficits have been observed (Boivin, 2000; Cermakian et al., 2011; Cuesta et al., 2013) or those with concerns of using a rectal probe.
Footnotes
Acknowledgements
We thank Drs. S. Rhéaume and A. Solignac, as well as A. Azzoug, M.R. Guertin and A. Tchomgang (research nurses) for medical supervision, Dr. A.S. Zandi, Dr. E.A. Begum and W.H. Yeh for their help during blood drawing sessions, Dr. C.D. Walker for hormonal assays, all the research assistants who helped during the experiment, and all the subjects for their participation.
This work was supported by operating grants from the Canadian Institutes of Health Research (MOP-102724 to D.B.B. and N.C.). M.C. received a postdoctoral fellowship and N.C. received a salary award from the Fonds de Recherche du Québec–Santé.
Conflict of Interest Statement
The author(s) declared no potential conflicts of interest with respect to the research, authorship, and/or publication of this article.
References
Supplementary Material
Please find the following supplemental material available below.
For Open Access articles published under a Creative Commons License, all supplemental material carries the same license as the article it is associated with.
For non-Open Access articles published, all supplemental material carries a non-exclusive license, and permission requests for re-use of supplemental material or any part of supplemental material shall be sent directly to the copyright owner as specified in the copyright notice associated with the article.