
Abstract
The human circadian system is primarily regulated by the 24-h LD cycle incident on the retina, and nocturnal melatonin suppression is a primary outcome measure for characterizing the biological clock’s response to those light exposures. A limited amount of data related to the combined effects of light level, spectrum, and exposure duration on nocturnal melatonin suppression has impeded the development of circadian-effective lighting recommendations and light-treatment methods. The study’s primary goal was to measure nocturnal melatonin suppression for a wide range of light levels (40 to 1000 lux), 2 white light spectra (2700 K and 6500 K), and an extended range of nighttime light exposure durations (0.5 to 3.0 h). The study’s second purpose was to examine whether differences existed between adolescents’ and adults’ circadian sensitivity to these lighting characteristics. The third purpose was to provide an estimate of the absolute threshold for the impact of light on acute melatonin suppression. Eighteen adolescents (age range, 13 to 18 years) and 23 adults (age range, 24 to 55 years) participated in the study. Results showed significant main effects of light level, spectrum, and exposure duration on melatonin suppression. Moreover, the data also showed that the relative suppressing effect of light on melatonin diminishes with increasing exposure duration for both age groups and both spectra. The present results do not corroborate our hypothesis that adolescents exhibit greater circadian sensitivity to short-wavelength radiation compared with adults. As for threshold, it takes longer to observe significant melatonin suppression at lower CS levels than at higher CS levels. Dose-response curves (amount and duration) for both white-light spectra and both age groups can guide lighting recommendations when considering circadian-effective light in applications such as offices, schools, residences, and healthcare facilities.
Keywords
The human circadian system is primarily regulated by the 24-h LD cycle incident on the retina. Inconsistent exposure to light and dark, such as that experienced during shift work and rapid trans-meridian travel, disrupts entrainment and desynchronizes the internal circadian pacemaker with local sunrise and sunset (Folkard et al., 1978; Panda, 2018; Patkai et al., 1977). Failure to readapt to the local solar cycle results in an altered phase relationship between the circadian system and the sleep-wake cycle (Graham et al., 2001; Panda, 2018; Travlos et al., 2001; Zeitzer et al., 2000), which can be detrimental to sleep quantity, sleep quality, and health.
Nocturnal melatonin suppression is a primary outcome measure for characterizing the biological clock’s response to retinal light exposures (Czeisler and Klerman, 1999). Light exposures experienced during the night can affect melatonin production in a dose-dependent manner. It is also well established that short-wavelength (“blue”) light is maximally effective for suppressing melatonin and phase shifting dim light melatonin onset (DLMO); for example, a 90-min exposure to 470-nm light at 2 lux on the cornea will suppress the nocturnal production of melatonin (Cajochen et al., 2005; Figueiro et al., 2011; Lockley et al., 2003). It is important to note, however, that the peak spectral sensitivity to short-wavelength light observed for acute melatonin suppression is not exclusively attributable to a single type of photoreceptor (Foster et al., 1991; Hattar et al., 2003; Ruby et al., 2002).
Based in part on the light-induced nocturnal melatonin suppression data from Brainard et al. (2001) and Thapan et al. (2001), a model of human circadian phototransduction was proposed. Importantly, the model was constrained by the fundamental knowledge of retinal neurophysiology and neuroanatomy (Rea et al., 2005; Rea et al., 2012; Rea and Figueiro, 2018). The model has been used in the laboratory and the field to make predictions of the efficacy of light exposure on clinically relevant outcome measures, such as sleep onset time, demonstrating its scientific and face validity (Figueiro and Rea, 2016; Figueiro et al., 2017; Wood et al., 2013; Young et al., 2015). Operationally, the model provides a framework for depicting how the classical photoreceptors (i.e., rods and cones) provide input to the intrinsically photosensitive retinal ganglion cells (ipRGCs) (Güler et al., 2008), which are the main conduit of electrical signals from the retinae to the master clock in the suprachiasmatic nuclei of the anterior hypothalamus, where the biological clock is located. Mathematically, for any light source, the model converts the spectral irradiance at the cornea into units of circadian light (CLA), reflecting the spectral sensitivity of the circadian system, and then transforms those values into circadian stimulus (CS) values, reflecting the absolute sensitivity of the circadian system. Thus, CS is a measure of the effectiveness of the retinal light stimulus for the human circadian system from threshold (CS ≈ 0.10) to saturation (CS ≈ 0.70).
The current model provides quantitative estimates of nocturnal melatonin suppression following 1-h exposures only, whereas several studies have shown that variations in exposure duration have a non-linear impact on the amount of light needed to stimulate the circadian system (Aoki et al., 1998; Chang et al., 2012; Dewan et al., 2011; McIntyre et al., 1989; Nagare et al., 2018b). A 2010 study also suggested that spectral sensitivity changes over exposure duration, wherein the contributions of classical photoreceptors to melatonin suppression decrease relative to that from the ipRGCs over the course of a night during continuous light exposure (Gooley et al., 2010). In general, the limited amount of data related to the combined effects of light level, spectrum, and exposure duration on nocturnal melatonin suppression has limited the development of circadian-effective lighting recommendations and light-treatment standards.
In view of these shortcomings, the primary goal of the present study was to measure nocturnal melatonin suppression from a wide range of light levels (40 to 1000 lux), 2 white-light spectra (2700 K and 6500 K), and extended nighttime light exposure durations (0.5 to 3.0 h). The exposure duration was limited to 3 h because our previous research identified an upper limit of response saturation after 3 h of nighttime light exposure (Nagare et al., 2018b). Other studies have also reported a non-linear, dose-response relationship that indicates a drop in efficacy of light sources to suppress melatonin or induce a phase shift over longer (over ~3 h) exposure durations (Chang et al., 2012; Gooley et al., 2010; St Hilaire et al., 2012). The present study’s lighting conditions were chosen to be representative of lighting conditions people might experience in North American indoor environments (Rea, 2000) and thereby help bridge the science of circadian phototransduction into applications.
The secondary purpose of the study was to extend recent findings that identical light exposures can differentially affect the circadian systems of different age groups (Duffy et al., 2015; Figueiro and Overington, 2016; Nagare et al., 2018b; Revell and Skene, 2010; Wood et al., 2013). Our previous work investigating the impact of conventional indoor white light sources (Nagare et al., 2018b) and self-luminous devices (Figueiro and Overington, 2016; Wood et al., 2013) on melatonin suppression suggests an enhanced sensitivity to light at night, particularly short-wavelength light, among adolescents.
Lastly, for most architectural spaces, such as offices, schools, and healthcare facilities, recommended light levels are primarily based on the needs of the human visual system. Past studies, however, have shown that the amount of polychromatic light necessary to activate the human circadian system is substantially greater than that required for vision (Lewy et al., 1980; Zeitzer et al., 2000). Since there is no firmly established threshold for the circadian system’s absolute sensitivity to light, the third purpose of the study was to provide a more exact estimate of threshold activation. This study considered activation of the circadian system to be marked by light-induced nocturnal melatonin suppression above 10%, since suppression values below 10% are within the assay measurement error. Even though the absolute sensitivity of the human circadian system has been shown to be affected by not only lighting characteristics (e.g., spectrum) but also the physiological (e.g., age) and behavioral (e.g., photic history) traits of the target population, the threshold criterion of 10% is intended to be conservative and based on the response of the age group with the highest circadian sensitivity (i.e., adolescents).
Figueiro et al. (2006b) recommended 30 lux of white light at the cornea, 30 min before bedtime, as a preliminary working threshold for reliably measuring melatonin suppression while cautioning against its broad application due to individual differences between subjects and the spectral power distributions of light sources. A follow-up study partially supported that recommended threshold, demonstrating that a 1-h nighttime exposure to white light (2670 K) at the eye reliably suppressed melatonin by 19% at a level of 200 lux, but not at 60 lux (Rea and Figueiro, 2013). Thus, it is anticipated that the present study’s more complete experimental design (light exposures from 2 spectra at 4 light levels for 3 h) will lead to a better characterization of the impact of light on acute melatonin suppression.
Materials and Methods
Participant Selection
This 10-week study was conducted in two 5-week phases. The original 32 participants (17 females and 15 males) recruited for Phase 1 of the study were of 2 age groups. The participants were recruited via personal referrals, word of mouth, Rensselaer Polytechnic Institute’s social media platform, and lists of participants from previous studies. The 16 adolescent participants (8 females and 8 males) ranged in age from 13 to 18 years, with a mean (SD) age of 15.9 (1.1) years, and the 16 adult participants (9 females and 7 males) ranged in age from 24 to 55 years, with a mean (SD) age of 42.4 (10.9) years. Using the clock hour of mid-sleep times on free days, the mean (SD) Munich Chronotype Questionnaire (MCTQ) scores (Roenneberg et al., 2003) recorded for the adolescents and adults were 3.4 (1.4) and 2.2 (1.5), respectively, which suggests that both participant groups were neither extreme larks (early persons) nor extreme owls (late persons).
Twenty-four of the study’s 32 original participants took part in Phase 2 of the study, along with 9 new participants (7 adults and 2 adolescents) who were recruited as described above. For study Phase 2, the 17 adolescent participants (9 females and 8 males) ranged in age from 14 to 18 years, with a mean (SD) age of 16.0 (1.1) years. The 16 adult participants (8 females and 8 males) ranged in age from 26 to 54 years, with a mean (SD) age of 38.7 (11.6) years. Using the clock hour of mid-sleep times on free days, the Phase 2 mean (SD) MCTQ scores recorded for the adolescents and adults were 3.5 (1.3) and 2.6 (1.6), respectively.
All participants were prescreened for major health problems, such as bipolar disorder, seasonal depression, cardiovascular disease, diabetes, and high blood pressure. Participants were excluded from the study if they were taking over-the-counter melatonin or any prescription medications (e.g., blood pressure medicine, antidepressants, sleep medicine, or beta-blockers). They were also excluded if they reported any type of eye disease (e.g., cataracts, glaucoma, etc.) or had scheduled trans-meridian travel during the study.
All participants were either attending school or regularly employed, so they were able to follow a consistent sleep-wake schedule (bedtimes no later than 2300 h and wake times no later than 0730 h) during the week preceding each study night. Compliance for the adolescent participants was verified using digital wrist-worn actigraphs (Actiwatch 2, Philips Respironics, Murrysville, PA, USA) and sleep logs. Adult participants were not required to wear actigraphs or keep a sleep log because they all reported being employed and having regular wake and sleep times during the week. Participants were also required to refrain from caffeine consumption for 12 h before the start of each study night. None of the participants reported difficulties in complying with the schedule or caffeine restriction over the course of the study.
This study conformed to the Code of Federal Regulations (CFR) document Protection of Human Subjects, 45 CFR 46, (2018), and international ethical standards (Portaluppi et al., 2010). It was reviewed, approved, and monitored by Rensselaer Polytechnic Institute’s Institutional Review Board. Informed consent was obtained from all study participants and/or their legal guardians.
Experimental Conditions
Over the course of the study, all participants were exposed to 2 spectrally distinct white light sources with correlated color temperatures (CCTs) of 2627 K (2700 K rated) and 5936 K (6500 K rated) (Figure 1). Each spectrum was delivered across a range of illuminance levels (40 to 1000 photopic lux) at the cornea to provide 4 target circadian stimulus (CS) levels of 0.07, 0.14, 0.30, and 0.50. Figure 2 shows the 4 target CS levels for every combination of CCT and photopic illuminance.
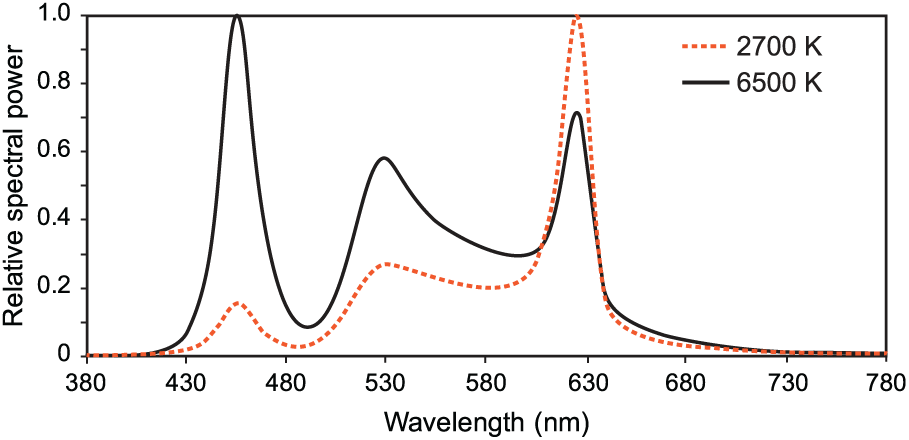
The spectral power distributions of the rated 2700 K and 6500 K LED white light sources used in the study.
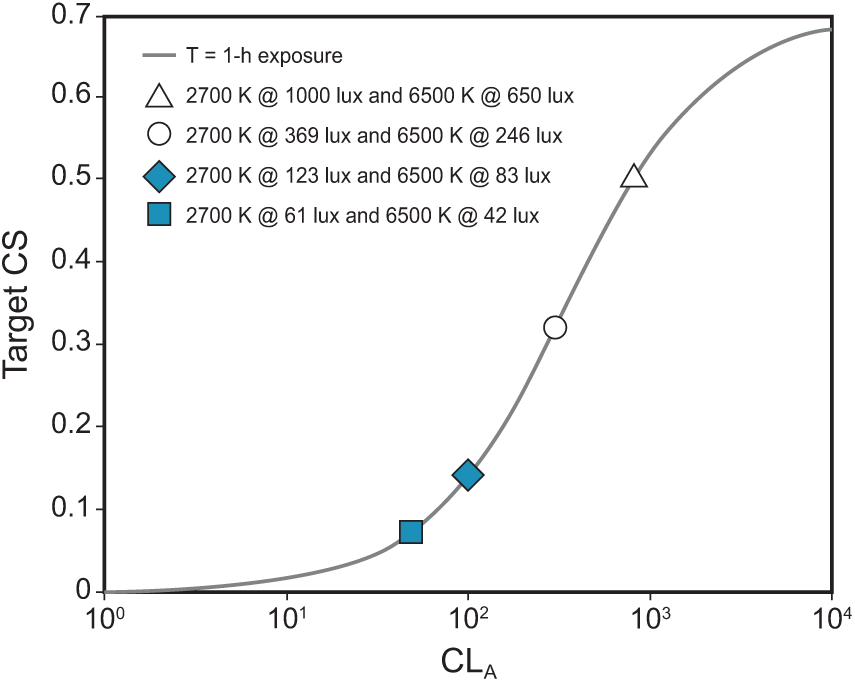
The target CLA and CS values for the study’s lighting conditions for a 1-h exposure, predicted using the Rea et al. model of circadian phototransduction (Rea et al., 2005; Rea et al., 2012; Rea and Figueiro, 2018).
The 10-week study was conducted in two 5-week phases since the experimental apparatus could support only 4 lighting conditions (rather than the total of 8 conditions) to be run simultaneously. On random assignment, Phase 1 delivered the 2 spectra at 2 high-light levels each, providing target CS levels of 0.50 and 0.30 at the level of the participants’ eyes, and Phase 2 delivered the 2 spectra at 2 lower light levels each, providing target CS levels of 0.14 and 0.07 at the participants’ eyes (see Protocol). During each phase, participants experienced 4 lighting conditions (2 white light spectra × 2 light levels) in a counter-balanced order using a Latin squares design. For both phases, the participants reported to the laboratory on 5 nights, each separated by at least 1 week to allow for a wash-out period between the conditions. In addition to the 4 intervention nights, all participants were exposed to a dim-light control night that provided a baseline observation of the participants’ natural rise in melatonin levels over the course of the night.
Lighting Apparatus
The white light spectrum was provided and controlled using RGB color-tunable, linear LED light bars (G2, High Output Linear Accent, Ketra, Austin, TX, USA) pre-programmed for the desired output modes and mounted on participants’ desks on a 30.5-cm-high supporting stand (Figure 3). With a fixed width of ~55.8 cm (22 inches) and a viewing distance of 76.2 cm (30 inches) the lighting apparatus delivered an image of approximately 40° in width at the participants’ eye level. Spectrally neutral diffusers covered the luminaires to eliminate potential glare and provide a uniform light distribution. For the range of lighting conditions used in the present study, discomfort glare, as calculated following Bullough et al. (Alliance for Solid-State Illumination Systems and Technologies (ASSIST), 2011), ranged from 4.6 (approaching “just permissible”) to 7.8 (“satisfactory”) on the de Boer scale (de Boer, 1967). The light stimulus was calibrated using a tripod-mounted illuminance meter (Model X-91 Broadband Lightmeter, Gigahertz-Optik, Haverhill Rd, Amesbury, MA, USA) to verify the light levels at the level of the participants’ eyes. Light levels for the target CS levels were computed using the LRC’s open-access online CS calculator.
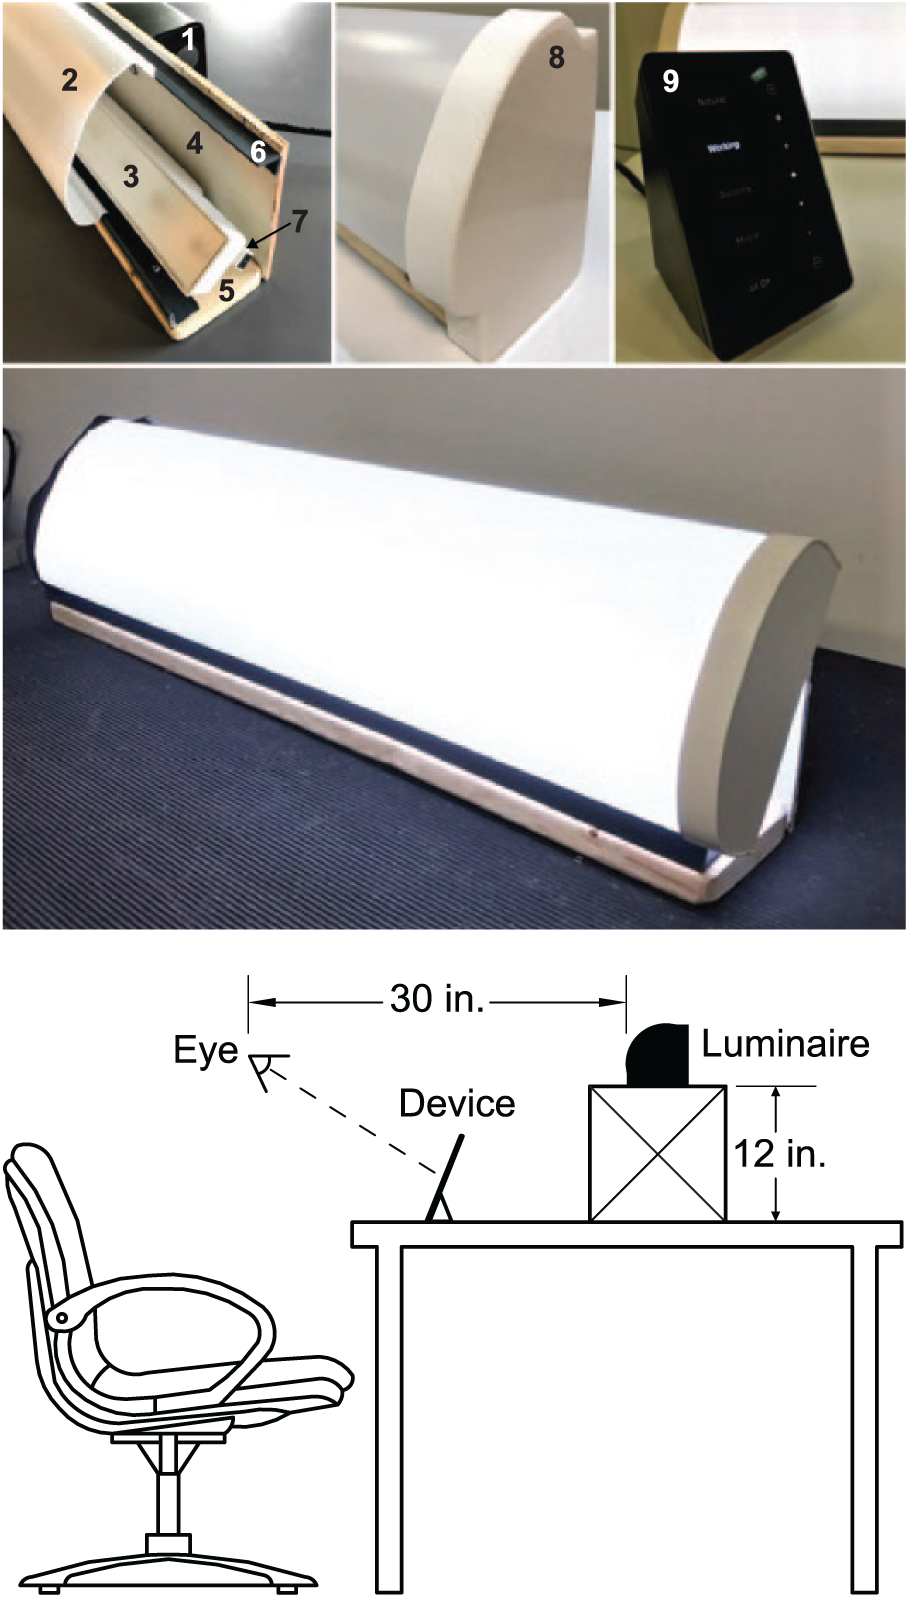
Components of the desktop luminaire that was custom-built by the LRC for use in this study (top): 1) satellite link controller, 2) light diffuser, 3) LED linear accent, 4) plywood housing back, 5) pine board base, (6) ½-in. × 1-in., PVC 90° angle (×2), 7) connector cable, 8) installed endcap, and 9) touchpad interface. A prototype of the assembled luminaire is shown in operation (middle) and the typical viewing geometry experienced by the participants is shown at the bottom. The luminaire was placed on a 30.5-cm-high supporting stand positioned behind the participants’ personal electronic devices.
Data Recording Equipment
To monitor the retinal light exposures experienced under the experimental conditions, each participant was provided with lensless eyeglass frames fitted with a Daysimeter (Model 12, Lighting Research Center, Troy, NY, USA) that recorded the light stimulus at 30-s intervals throughout the 3-h light exposure (Bierman et al., 2005; Figueiro et al., 2013). During each 3-h data collection period, light levels at the eye were also spot-checked hourly using a spectrometer (Model USB650 Red Tide Spectrometer, Ocean Optics, Winter Park, FL) and monitored continually using an illuminance meter. The CLA levels (Rea et al., 2005; Rea et al., 2010) were calculated from the spectrometer data following Equation 1, using Matlab software (MathWorks, Natick, MA, USA). Participants’ mean CS exposures were calculated following Equation 2, based on the Rea et al. model as most recently published in Rea and Figueiro (2018).
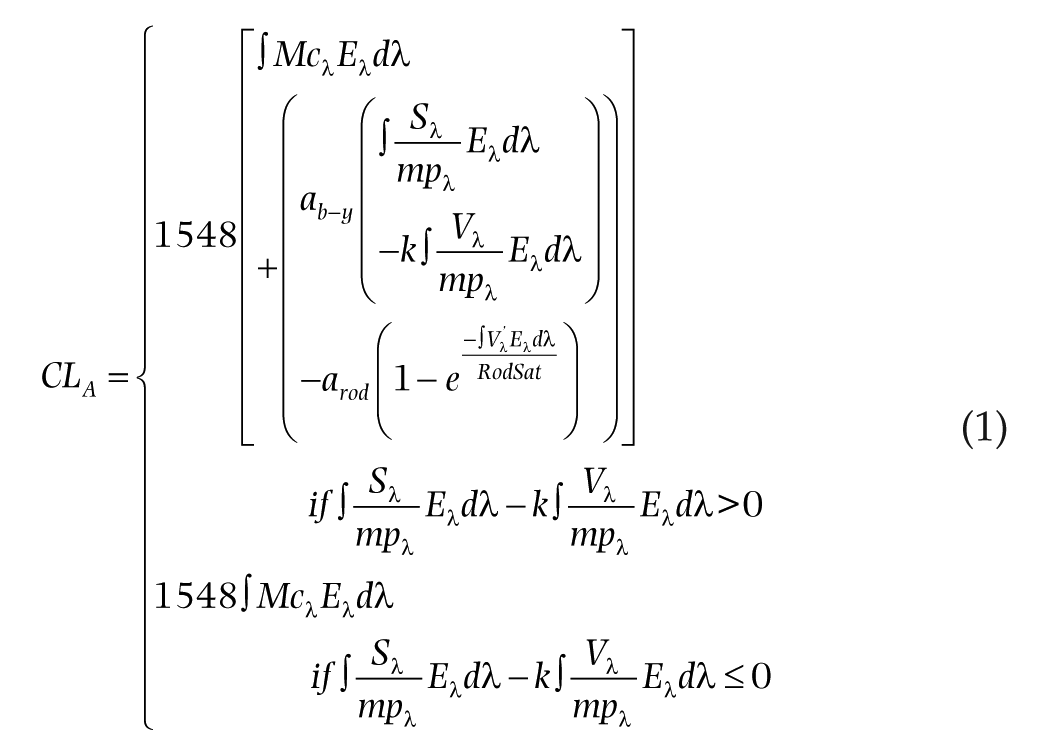
Where:
CLA: Circadian light; the constant, 1548, sets the normalization of CLA so that 2856 K blackbody radiation at 1000 lux has a CLA value of 1000.
Eλ: light source spectral irradiance distribution
Mcλ: melanopsin (corrected for crystalline lens transmittance)
Sλ: S-cone fundamental
mpλ: macular pigment transmittance
Vλ: Photopic luminous efficiency function
V’λ: Scotopic luminous efficiency function
RodSat: Half-saturation constant for bleaching rods = 6.5 W/m2
k = 0.2616
ab-y = 0.700
arod = 3.300

Protocol
During both study phases, participants arrived at the laboratory by 2230 h and remained in dim light (<5 lux at the eye) for 30 min, followed by a 3-h exposure to one of the 4 lighting interventions (i.e., 2 spectra × 2 target CS levels) or dim light. To counter a potential subject-expectancy effect, no information concerning the pre-determined, counter-balanced order of experimental conditions was provided to the participants, although subjective assessments were not conducted to ascertain whether the participants could differentiate between the 2 spectra. Over the course of each study night, 7 saliva samples were collected from each participant; the first sample was taken immediately before commencement of the lighting condition after a 30-min dim light exposure, and 6 additional samples were taken thereafter at 30-min intervals (Figure 4). After the final saliva sample was collected at 0200 h, the participants were free to go home.
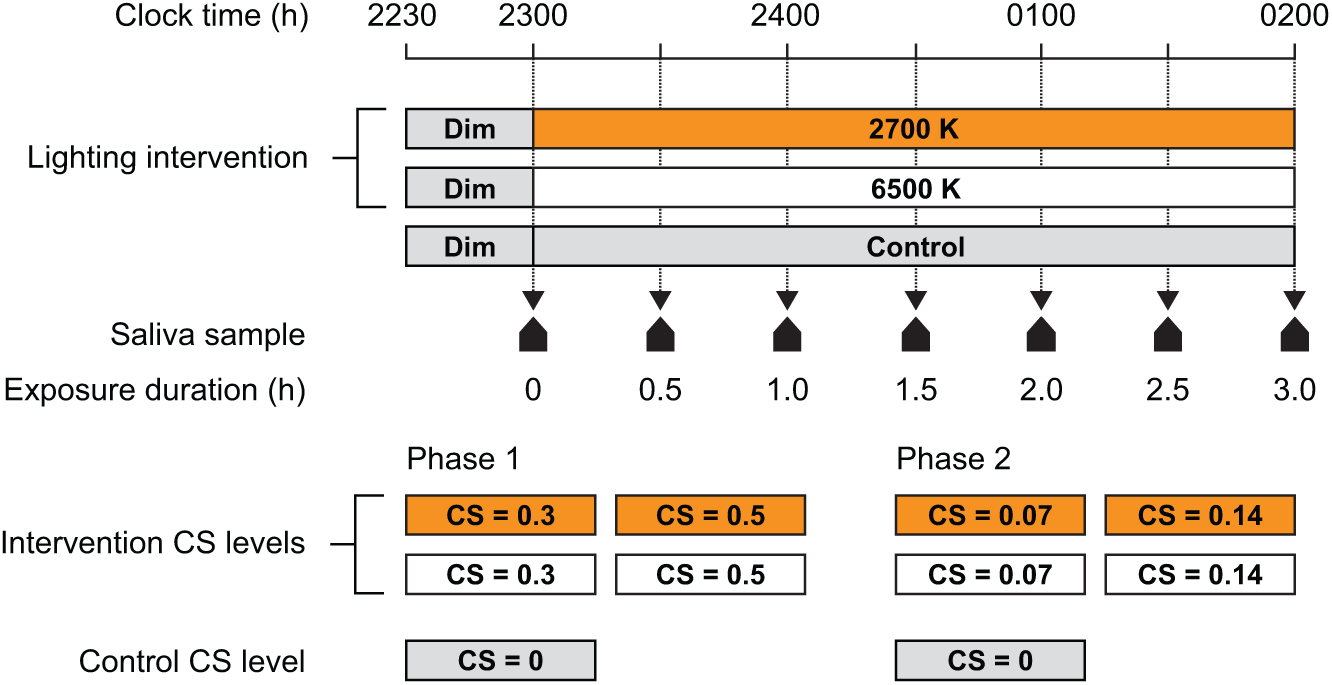
The study protocol. Participants arrived in the laboratory and were held in dim light (<5 lux at the eye) until the first saliva sample was obtained at 2300 h. After the first saliva sample was obtained, the desktop luminaires were turned on and 6 additional saliva samples were collected at 30-min intervals.
During the experiment, the participants were required to refrain from consuming food of any kind and allotted a 10-min window (following the collection of each saliva sample) to drink water. Participants were not required to look directly at the light but were instructed to face the desktop luminaire to ensure minimum variability with respect to the target stimulus (see Figure 3). They were also instructed to keep their eyes open at all times and neither block nor remove the glasses-mounted Daysimeter, which recorded the actual light stimulus delivered at the eye. Bathroom breaks for all participants were logged and verified using the Daysimeter data. Participants were free to operate their personal electronic devices (i.e., computers, tablets, cell phones, etc.) on all study nights. All displays were dimmed down and covered with orange-tinted media (Roscolux #21 golden amber, Rosco Laboratories, Stamford, CT, USA) that filtered out radiation <525 nm to prevent participants from receiving additional circadian-effective stimulus from their self-luminous devices. In a previous study, photometric measurements of the stimulus emitted by similarly filtered electronic displays revealed increased light levels of <5 lux, which translated to a CS of <0.001 (Rea and Figueiro, 2018). Periodic visual monitoring was carried out to ensure compliance with the experimental protocol and confirm that none of the participants closed their eyes.
Saliva samples were collected using the Salivette system (Sarstedt, Nümbrecht, DE), wherein the participant chewed on a plain cotton cylinder for an average of 1 to 2 min. (The participants were not individually timed during sample collection.) The samples were then placed in a test tube, centrifuged for 5 min at 1000 ×g, and immediately frozen (−20°C). The frozen samples for each participant were assayed in a single batch using a melatonin radioimmunoassay kit (Direct Melatonin RIA, ALPCO, Salem, NH, USA). The reported sensitivity of the saliva sample assay was 1 pg/ml and the intra- and inter-assay coefficients of variability were 11% and 14%, respectively.
Data Analysis
Melatonin suppression for each condition was determined by comparing the normalized melatonin levels collected during the dim light condition (the baseline control) with the normalized levels collected at the corresponding time on each lighting intervention night. For each study night, melatonin concentrations at 6 time points (exposure durations 0.5 to 3.0 h) during the 3-h exposures were first normalized to the value for the first sample taken at 2300 h (see Figure 4), and the melatonin suppression at each of those times was then calculated using the following formula:

where Mn is the normalized melatonin concentration at each time point on respective intervention nights and Md is the normalized melatonin concentration at each time point on the dim light control night.
None of the adult participants had missing data. Within the adolescent group, melatonin data were unavailable for 3 participants exposed to the 6500 K source at CS 0.14 due to participant absence. Furthermore, salivary melatonin samples could not be processed for a single participant in the 6500 K (CS = 0.5) and 2700 K (CS = 0.5) lighting conditions, for a participant in the 2700 K (CS = 0.3) lighting condition, and for a participant in the 6500 K (CS = 0.14) lighting condition (Figure 5) because not enough saliva (i.e., less than 1 mL) was obtained for the assay.
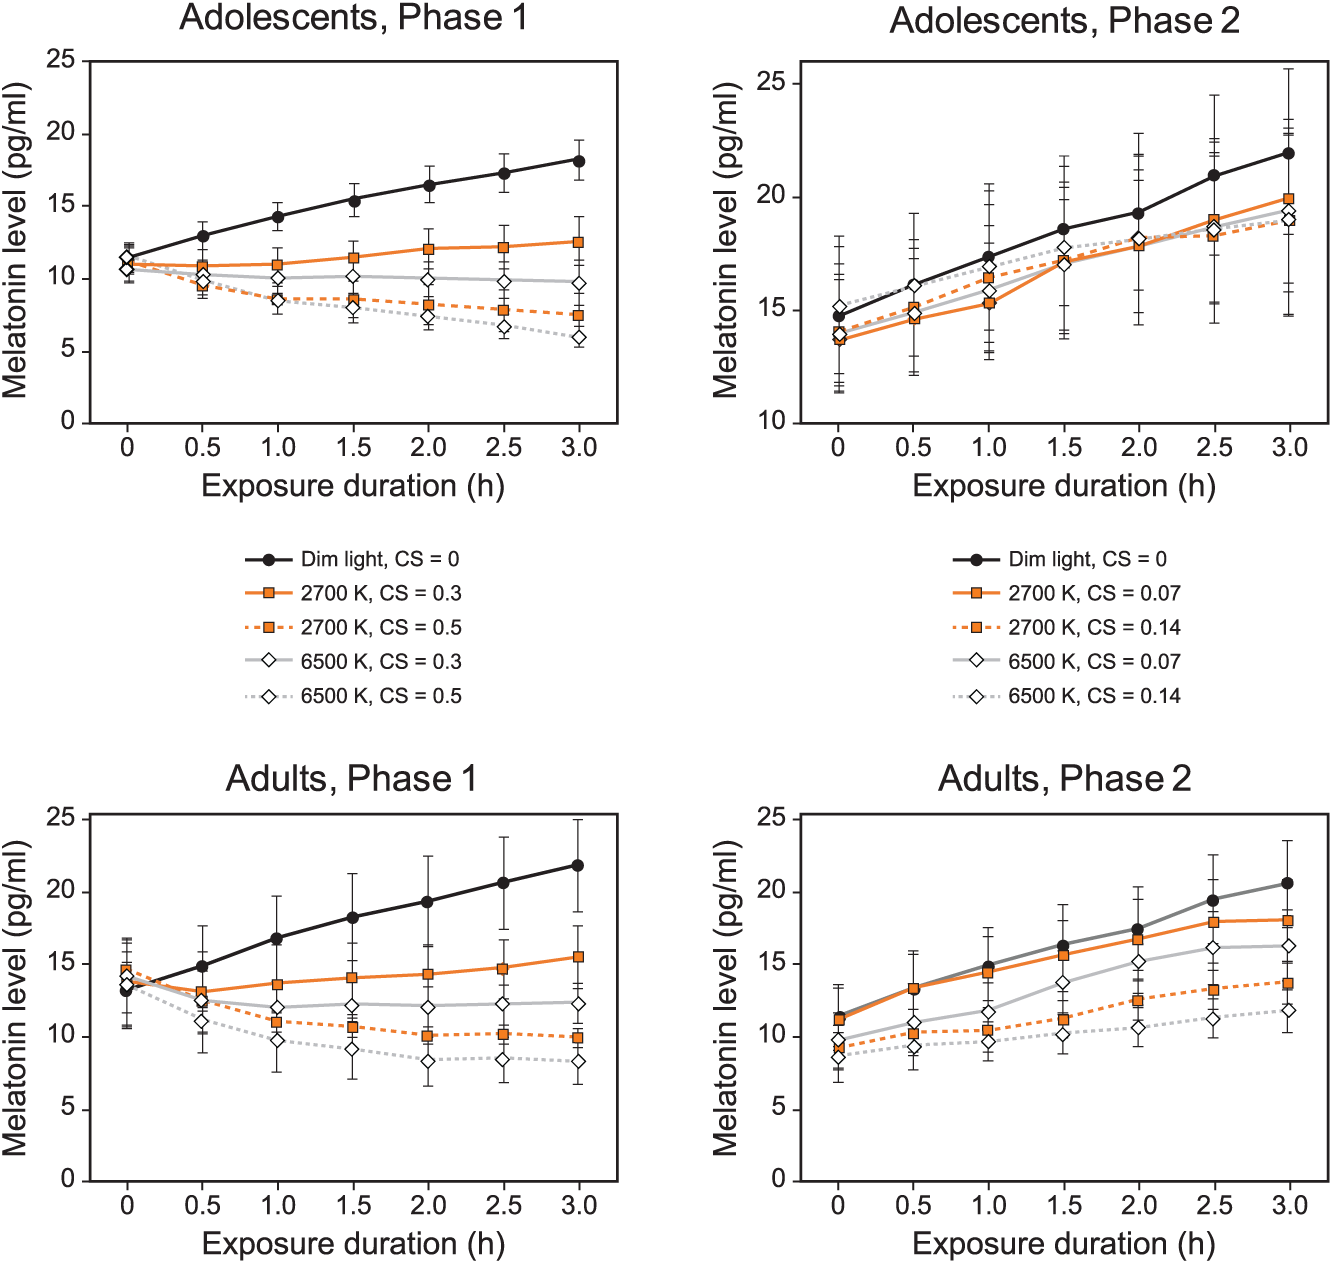
Mean salivary melatonin levels for participants in the study’s 2 phases and 2 age groups at each exposure duration. The light levels for Phase 1 (16 adolescents, 16 adults) correspond to the target CS levels of 0.3 and 0.5 for the 2 spectra, and the low-light levels for Phase 2 (17 adolescents, 16 adults) correspond to the target CS levels of 0.07 and 0.14 for the 2 spectra. The error bars represent SEM.
The linear mixed effect model included all 41 participants recruited for the study and contained one “between-fixed factor” (age group), 3 “within-fixed factors” (spectrum, CS, and exposure duration), and one “random factor” (participant). The between-fixed factor age group contained 2 levels (adolescents and adults). The within-fixed factor spectrum contained 2 levels (2700 K normalized to dim and 6500 K normalized to dim). The within-fixed factor CS contained 4 levels (0.07, 0.14, 0.3 and 0.5). Twenty-four participants completed both phases of the study, and therefore had data for all 4 CS levels. Eight participants only completed Phase 1, and therefore had complete data for 2 CS levels. Nine participants only completed Phase 2, and therefore had complete data for 2 CS levels. The within-factor of time contained 6 levels (Times 2 to 7).
In addition, to determine whether participants’ baseline melatonin levels across the 2 study phases and between the 2 age groups were similar, suggesting that light was applied at similar circadian phase, melatonin levels collected at Time 1 at each session for each age group were subjected to analysis of variance (ANOVA) using SPSS statistical software (SPSS version 25, IBM, Armonk, NY, USA).
When reporting a significant main effect of an independent variable (e.g., white light spectra), the responses for the dependent variable are averaged across all other independent variables. Further evaluation for main effects and interactions was performed using post hoc 2-tailed, Student’s t-tests with Bonferroni corrections. In some instances, effects were also evaluated using post hoc 1-sample t-tests. The results of the ANOVA and all t-tests were considered to be statistically significant if the resulting p value was less than 0.05 (as reported by SPSS).
Results
Photometric Analysis
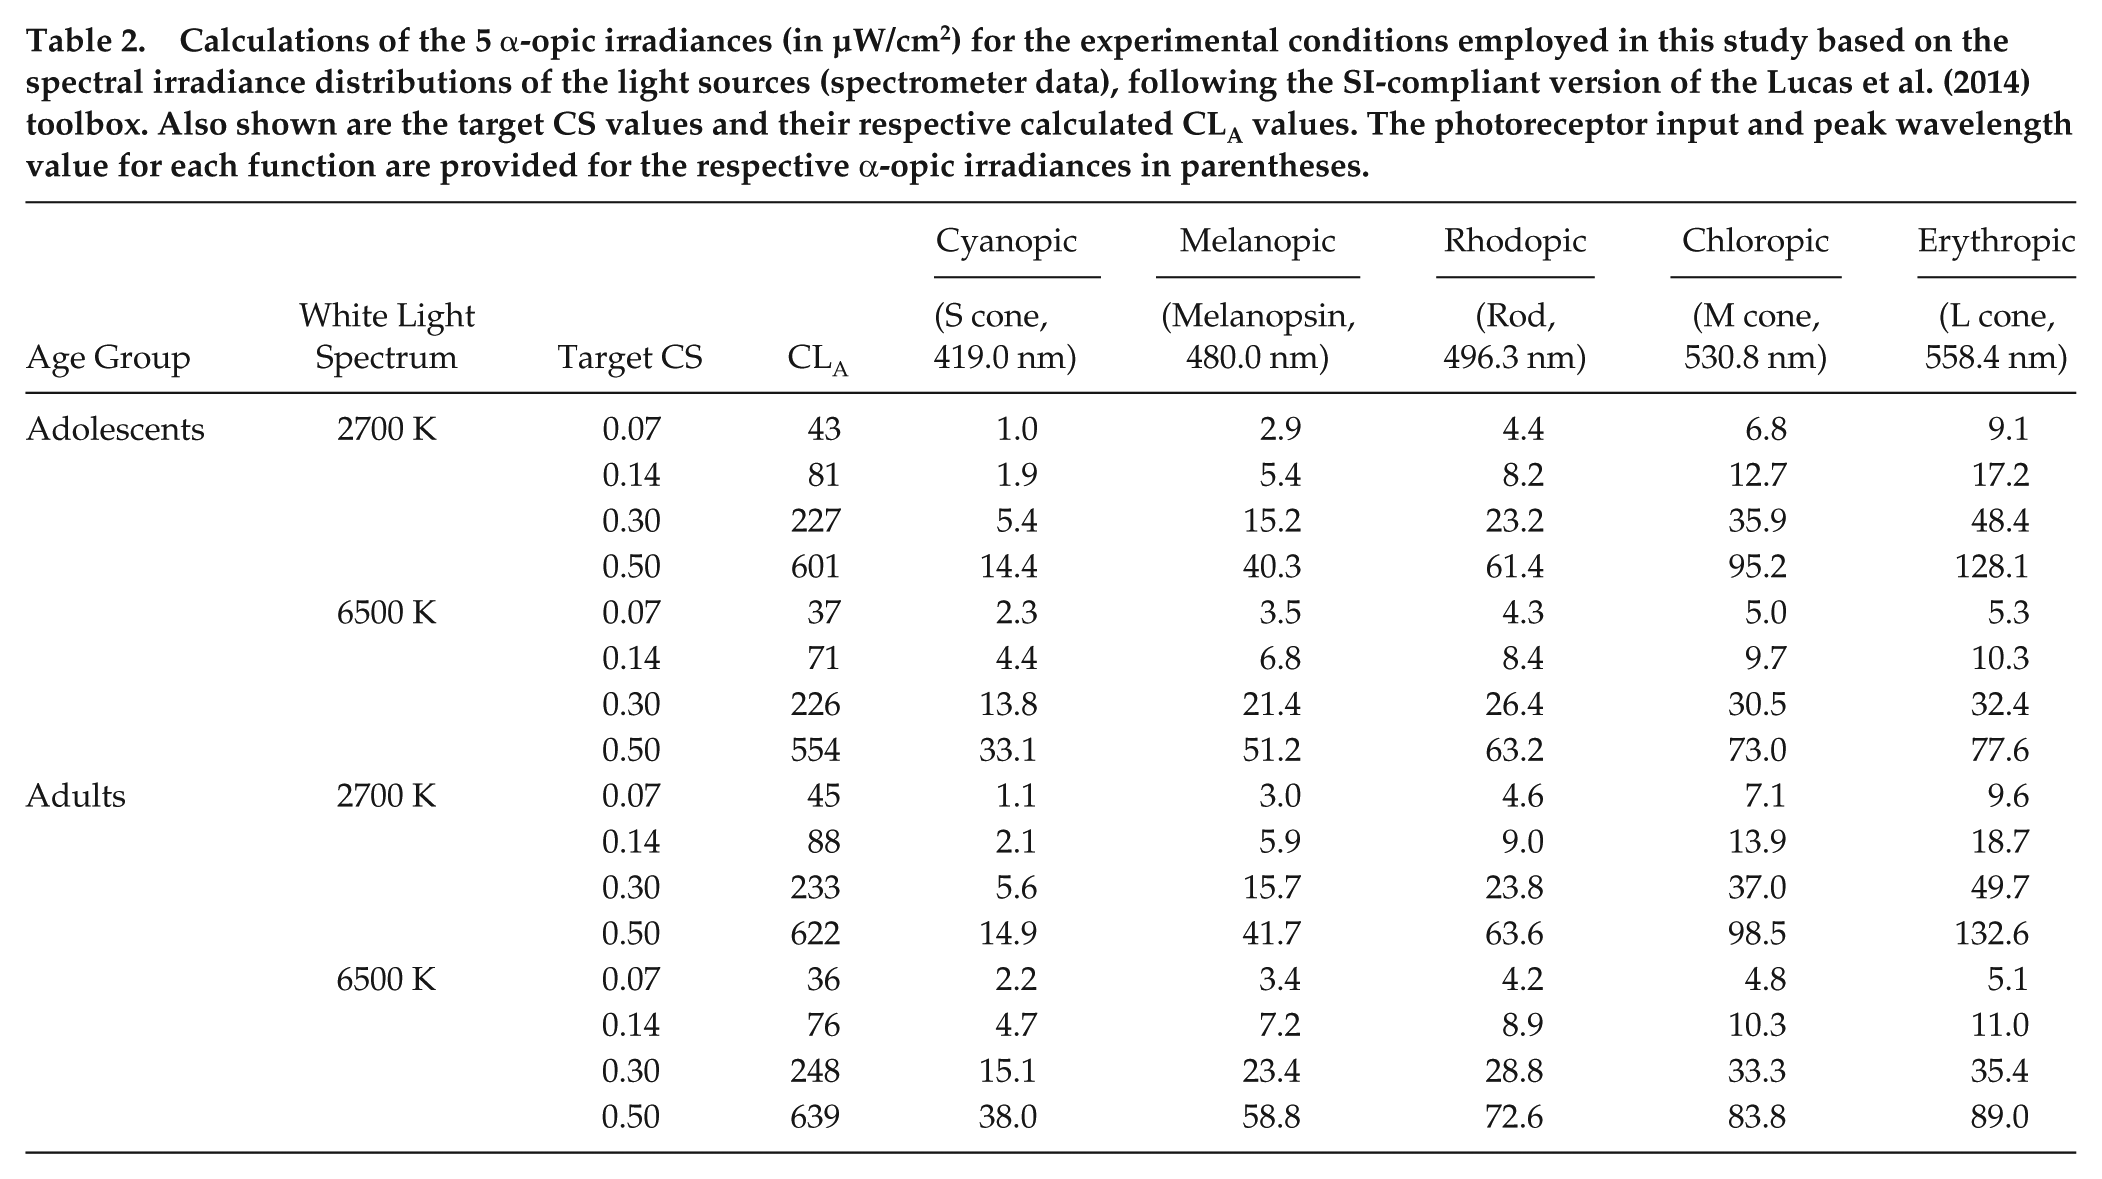
The photometric characteristics of the experimental lighting interventions, as reliably measured by the spectrometer are provided in Table 1. The 5 α-opic irradiances (µW/cm2) for the experimental conditions employed in this study are shown in Table 2. Daysimeter data were used to verify the light exposure for all participants.
Mean (SD) photopic illuminances (in lux) obtained during the study days using the spectrometer and the corresponding predicted CS values obtained using the spectrometer data and the Rea et al. model of circadian phototransduction (Rea and Figueiro, 2018).
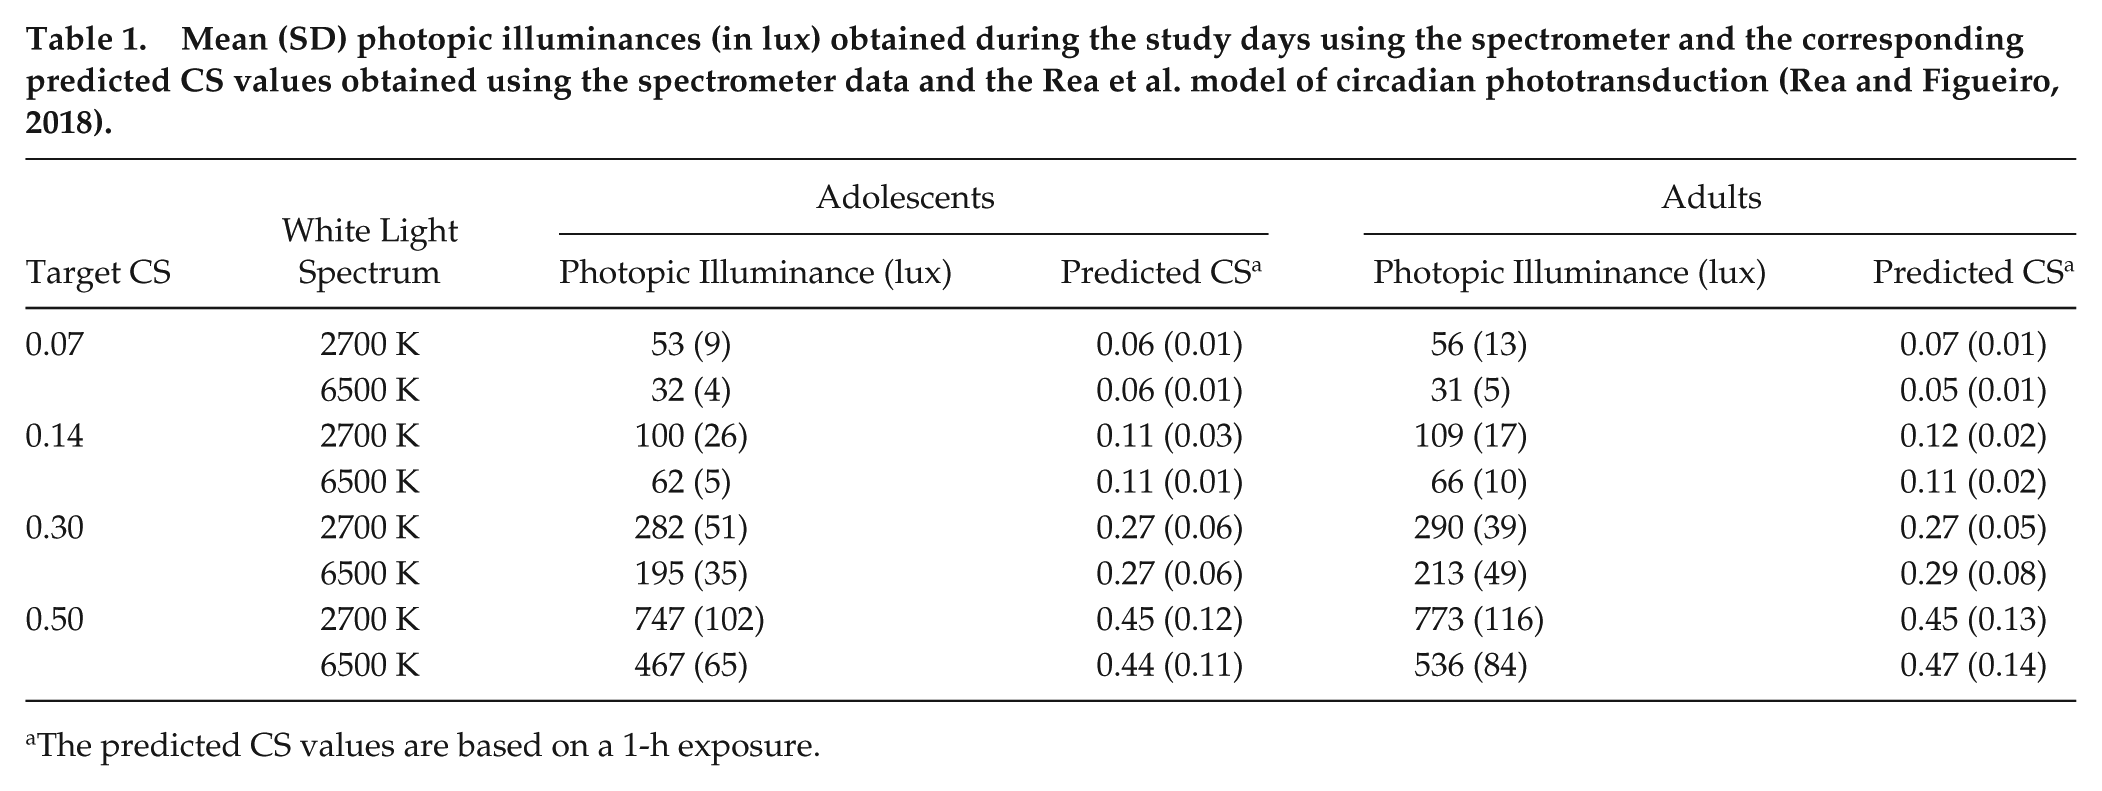
The predicted CS values are based on a 1-h exposure.
Calculations of the 5 α-opic irradiances (in µW/cm2) for the experimental conditions employed in this study based on the spectral irradiance distributions of the light sources (spectrometer data), following the SI-compliant version of the Lucas et al. (2014) toolbox. Also shown are the target CS values and their respective calculated CLA values. The photoreceptor input and peak wavelength value for each function are provided for the respective α-opic irradiances in parentheses.
As a check on the a priori predictions from the original Rea et al. CS model (Equations 1 and 2), the measured 1-h melatonin response data from the present experiment were compared with the model’s predicted responses. A sigmoidal 4-parameter logistic function, based on the formulation used by Zeitzer et al. (2000) and adapted from the Rea et al. CS model (Equation 4), was also applied to the 1-h response data. Curve fitting was performed by optimizing the model parameters using a nonlinear least squares fitting analysis based on the Levenberg-Marquardt method, according to the following logistic function:
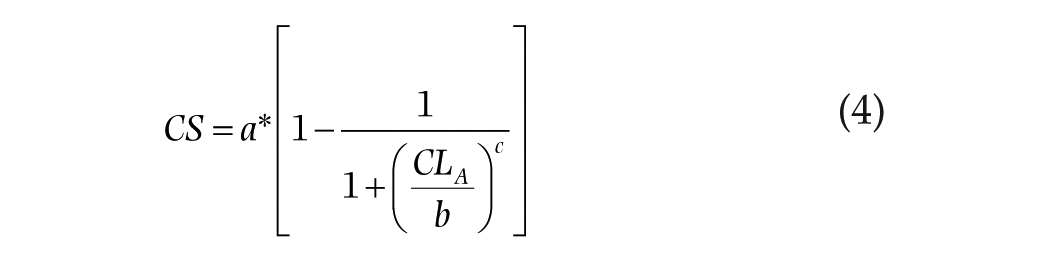
where a is the asymptotic maximal responsiveness of the system that was a shared parameter across all conditions, b is the CLA value that elicits a half-maximal response, and c is a measure of the steepness of the rising portion of the curve (Rea et al. 2012).
The measured 1-h melatonin response data from the present experiment are plotted along with the original Rea et al. CS model’s (Equations 1 and 2) predicted responses in Figure 6. Whereas the original CS model provided a good fit to the new 1-h data (R2 = 0.90), the 4-parameter fit was, as would be expected, a better fit (R2 = 0.96). This same 4-parameter curve fitting approach was taken for all new data so that every combination of spectrum and amount could be directly compared at every exposure duration and for both age groups. Additional melatonin data for a target CS level of 0.25 acquired from a similar previous study (Nagare et al., 2018b) have been included to generate the final dose-response curves.
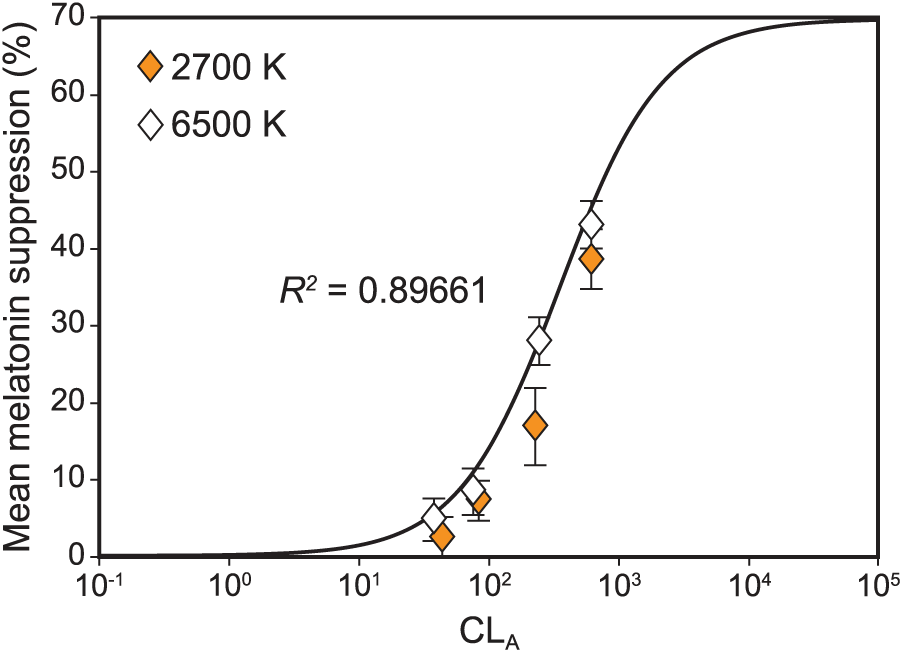
Logistic plot comparing the measured 1-h response data from the present experiment with the predicted responses from the original CS model to validate its accuracy. The data points correspond to mean nocturnal melatonin suppression following 1-h exposures to the 2700 K and the 6500 K sources at different corneal light levels (CLA, Equation 1). The continuous solid line represents the respective predicted CS values according to Equation 2 and depicts the functional relationship between CLA and CS plotted without regard for the measured melatonin suppression values obtained in the present study. Goodness of fit (R2) for the logistic function is 0.90. The error bars represent SEM.
Statistical Analyses
Main effect of study phase and age group
The absolute baseline melatonin levels recorded at the beginning of each study night (Time 1) were not significantly different across the 2 study phases (F1,152 = 0.11, p = 0.74) and the 2 age groups (F1,152 = 0.53, p = 0.49), supporting the inference that the light treatment was delivered at a similar circadian phase for both age groups and phases of the study. The predicted between-groups, main effect of participant age on nocturnal melatonin suppression was not statistically significant (F1,39 = 0.19, p = 0.67). Two-way interactions between participant age group and other independent variables (white light spectra, light level, and exposure duration) were also not statistically different (p > 0.05).
Effect of Lighting Characteristics on Melatonin Suppression
Light level
A significant main effect of photopic light level on melatonin suppression was observed (F7,994 = 110.1, p < 0.001), wherein higher photopic light levels were associated with more melatonin suppression. A logistic best-fit to the melatonin suppression data as a function of photopic light levels (R2 = 0.86) revealed that, for each target CS level, higher photopic light levels for the 2700 K source consistently resulted in lower melatonin suppression compared with the CS-matched 6500 K source providing lower photopic light levels (Figure 7). This discontinuity was rectified by fitting the melatonin suppression data as a function of CLA levels (Rea et al., 2012), resulting in an improved fit (R2 = 0.96) (Figure 8). Subsequent analysis also revealed a significant main effect of target CS levels on melatonin suppression (F3,159 = 91.8, p < 0.001), wherein a higher target CS level was associated with greater suppression (Figure 9). Given that CS was a better metric, all subsequent results are reported in CS rather than photopic illuminance.
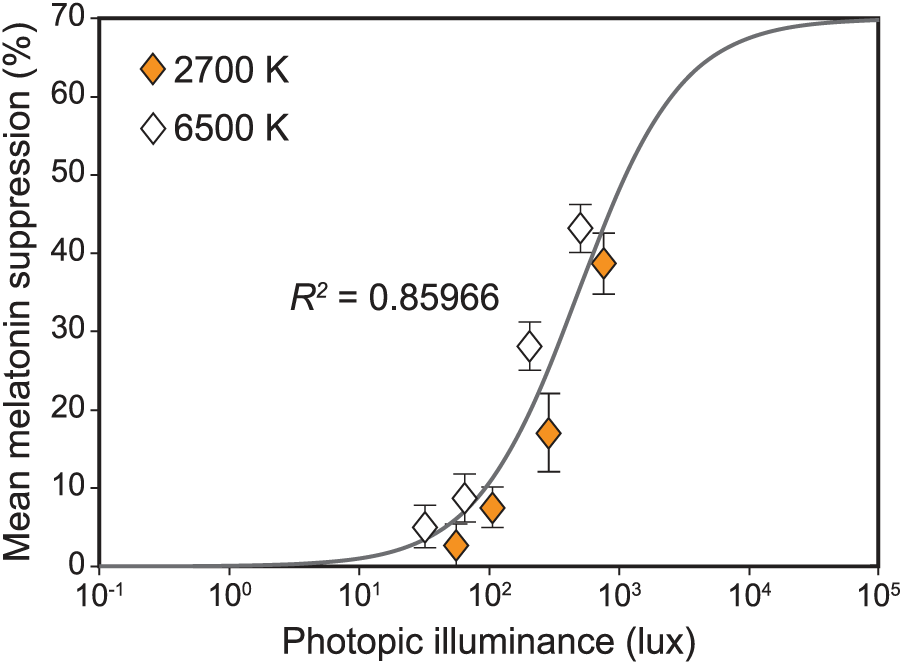
Logistic best-fit (R2 = 0.86) to the melatonin suppression data further plotted as a function of photopic illuminance levels, which is a widely used metric to characterize many human visual responses. For each target CS level, the higher photopic light levels for the 2700 K source consistently resulted in lower melatonin suppression compared with the circadian stimulus-matched 6500 K source providing lower photopic light levels. The error bars represent SEM.
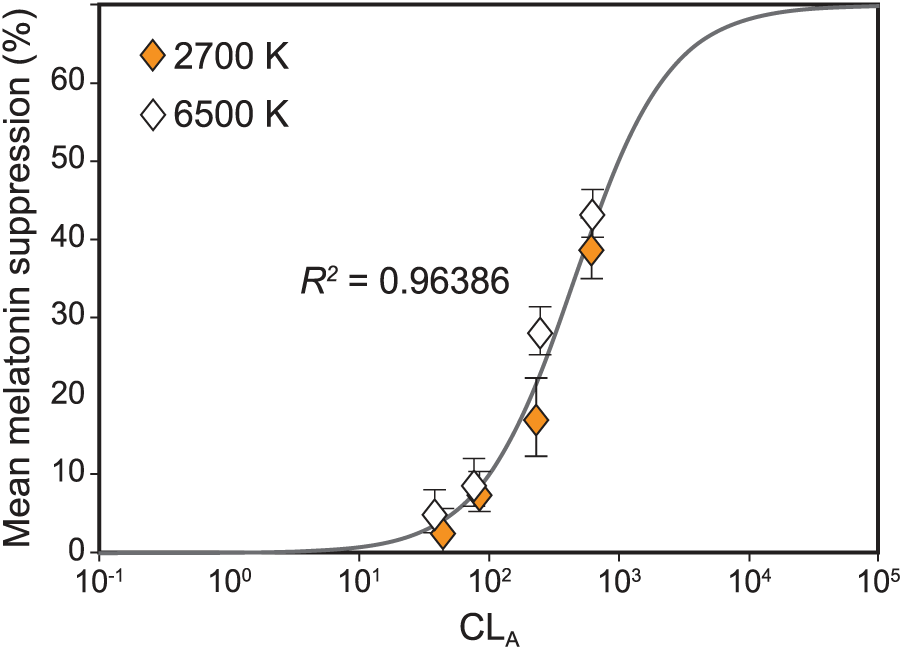
Logistic best-fit to the melatonin suppression data as a function of CLA resulted in an improved fit (R2 = 0.96) while rectifying the discontinuity revealed by the fit as a function of photopic illuminance levels (see Figure 7). The error bars represent SEM. It is important to note that, while the original fit (see Figure 6) has been derived from the original Rea et al. CS model to validate its accuracy, the logistic best-fits as a function of the photopic illuminance levels (see Figure 7) and CLA, shown here, are based on the formulation used by Zeitzer et al. (2000) and adapted from Rea et al., 2012 (Equation 4) to compare the effectiveness of the 2 metrics in characterizing the impact of light on nocturnal melatonin suppression (Rea et al., 2005; Rea et al., 2012; Rea and Figueiro, 2018).
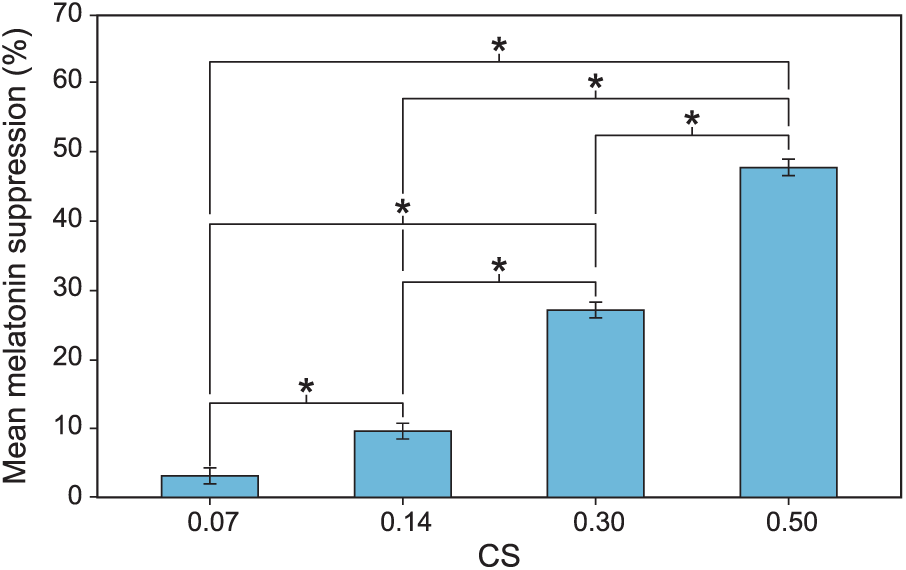
The significant main effect of CS level. The asterisks represent p < 0.05 and the error bars represent SEM.
Post hoc 1-sample t-tests showed that the mean melatonin suppression across all participants following a 1-h exposure was not significantly different from the predicted CS using the original Rea et al. model (Rea et al., 2005) at all light levels (Table 3, see Figure 6).
Post hoc 1-sample t-test results comparing measured 1-h melatonin suppression values with the predicted CS model responses.
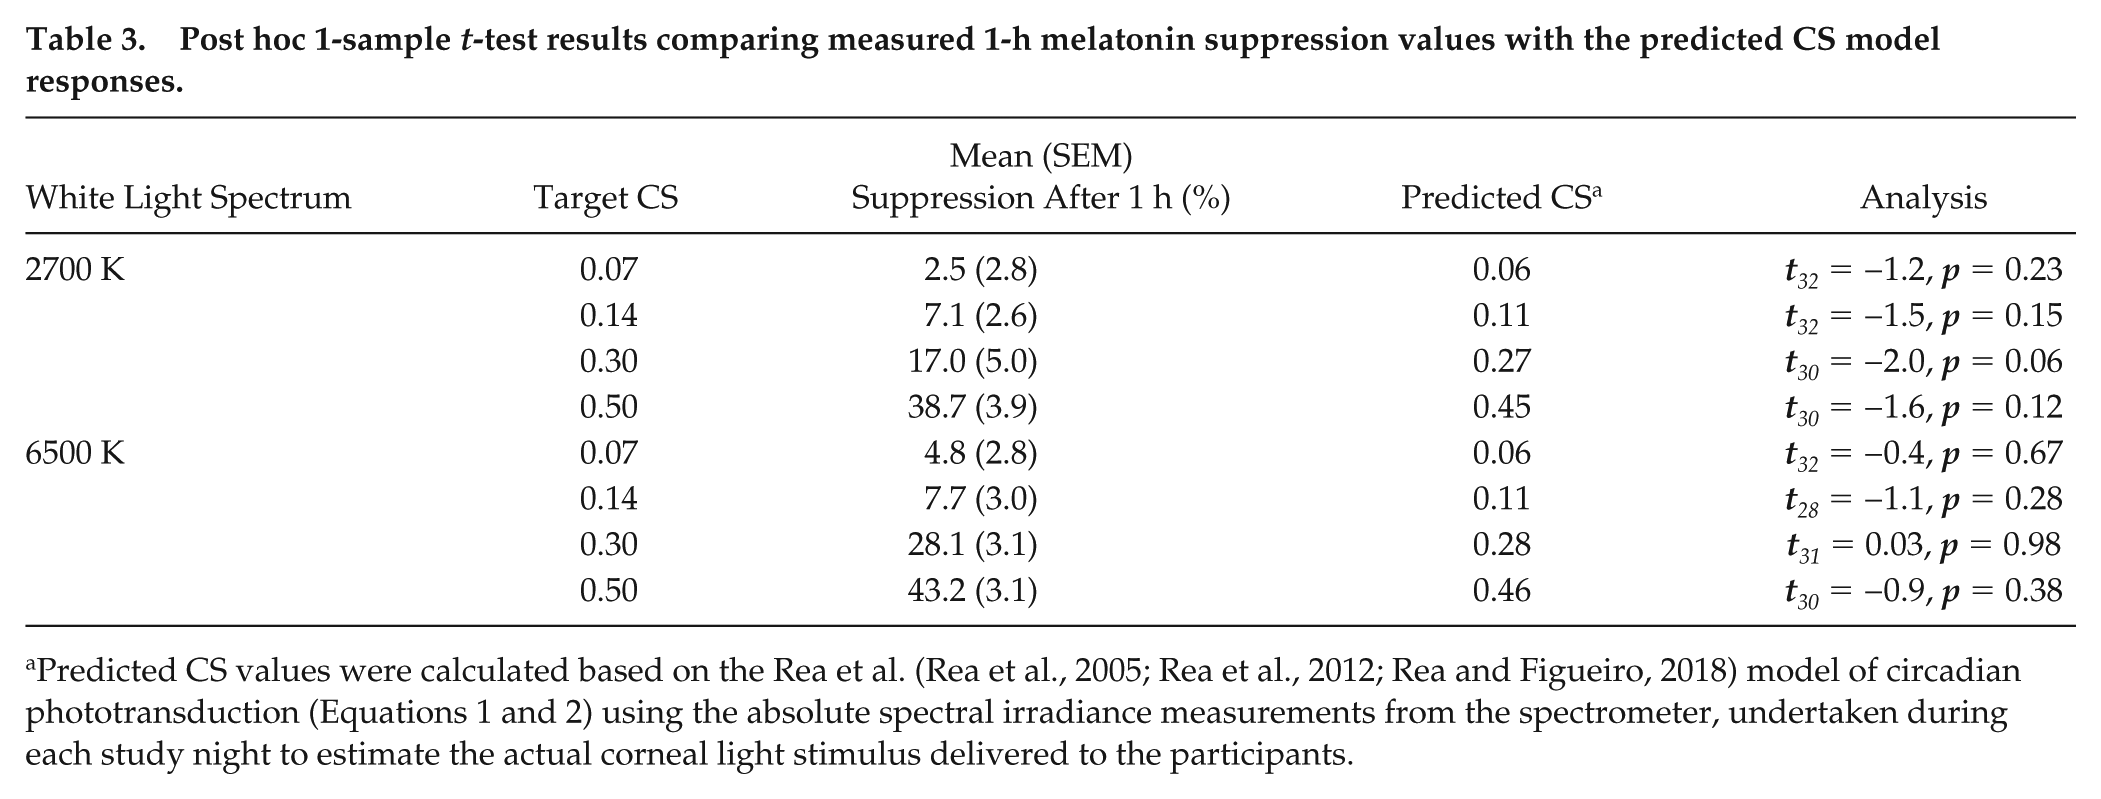
Predicted CS values were calculated based on the Rea et al. (Rea et al., 2005; Rea et al., 2012; Rea and Figueiro, 2018) model of circadian phototransduction (Equations 1 and 2) using the absolute spectral irradiance measurements from the spectrometer, undertaken during each study night to estimate the actual corneal light stimulus delivered to the participants.
White light spectra
There was a significant main effect of white light spectra (F1,39 = 8.3, p < 0.01); mean melatonin suppression was greater for the 6500 K source (mean [SEM] = 24.7% [1.0%]) compared with the 2700 K source (mean [SEM] = 18.4% [1.0%]). For the adolescent participants, the mean [SEM] melatonin suppression over the entire 3-h session was 18.9% [1.4%] after exposure to the 2700 K source and 24.6% [1.4%] after exposure to the 6500 K source. For the adult participants, the mean (SEM) melatonin suppression over the entire 3-h session was 17.9% [1.5%] after exposure to the 2700 K source and 24.8% [1.5%] after exposure to the 6500 K source; thus, there was no interaction between age group and light source CCT.
Exposure duration
The analysis also revealed a significant main effect of exposure duration (F5,1185 = 92.5, p < 0.001), indicating that longer exposure durations suppressed melatonin to a greater degree during participants’ biological night (Figure 10). Post hoc 2-tailed, Student’s t-tests of the main effect of exposure duration showed that melatonin suppression after a 3-h light exposure (mean [SEM] = 29.5% [2.1%]) was significantly greater (p < 0.05) than after 0.5-h (10.9% [1.3%]), 1-h (18.4 [1.5%]), and 1.5-h (20.8% [1.7%]) light exposures. Differences in mean (SEM) melatonin suppression after 2-h (22.7% [1.9%]) and 2.5-h (26.6% [2.0%]) light exposures were not significantly different (p > 0.05) compared with the 3-h exposure.
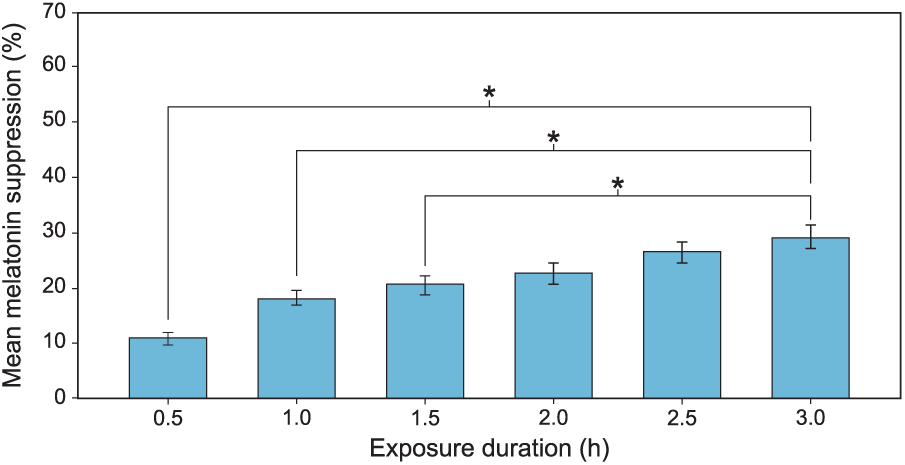
The significant main effect of exposure duration. The asterisks represent p < 0.05 and the error bars represent SEM.
Consistent with the results from our previous research (Nagare et al., 2018b), the analysis did not reveal a significant interaction between spectrum and exposure duration on melatonin suppression (F5,1185 = 1.99, p = 0.08), suggesting that the spectral sensitivity of acute melatonin suppression does not change with exposure duration. There was, however, a statistically significant interaction between the effects of CS level and exposure duration on melatonin suppression (F15,1185 = 13.1, p < 0.001), as is evident from the differing gradients for the 4 curves shown in Figure 11. At lower CS levels, longer exposure durations are required for significant melatonin suppression, whereas significant suppression is observed within 30 min at higher CS levels.
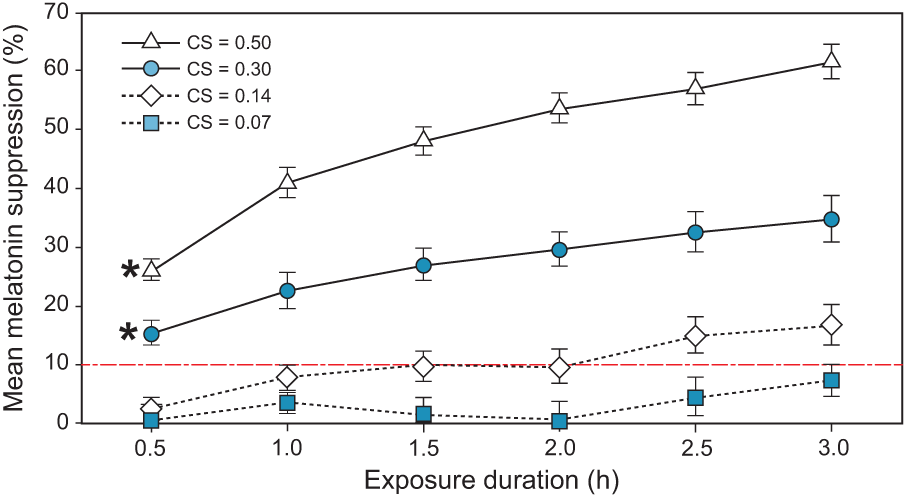
The significant interaction between exposure duration and target CS level (p < 0.001). Points marked with an asterisk represent the earliest juncture at which melatonin suppression was significantly >10% (p <0.05; indicated by a dashed line). The error bars represent SEM.
Exploring this interaction further, post hoc 1-sample t-tests were performed at each of the 24 dose levels (4 light levels × 6 exposure durations) across all the participants (adults and adolescents) after taking an average of the observations across the 2 spectra. Analyses revealed that melatonin suppression at the lowest target CS level of 0.07 was not significantly greater than zero even following a 3-h exposure duration (t32 = 1.75, p = 0.09). For the target CS levels of 0.14, 0.30, and 0.50, melatonin suppression was significantly greater than zero at exposure durations of 1 h (t32 = 3.60, p < 0.01), 0.5 h (t31 = 6.09, p < 0.001), and 0.5 h (t30 = 11.34, p < 0.001), respectively. Given that melatonin assay variability is close to 10%, however, it could be argued that any suppression below 10% would be within that potential measurement error.
To address this matter, we sought to determine whether melatonin suppression at the various target CS levels and exposure durations was significantly greater than 10%. Post hoc 1-sample t-tests revealed that melatonin suppression was significantly greater than 10% for all exposure durations at each of the 2 higher light levels (CS = 0.30 and 0.50), with p < 0.05. At the lower target CS levels of 0.07 and 0.14, melatonin suppression was not significantly greater than 10% at any of the exposure durations (p > 0.05).
Dose-response characteristics and threshold estimation
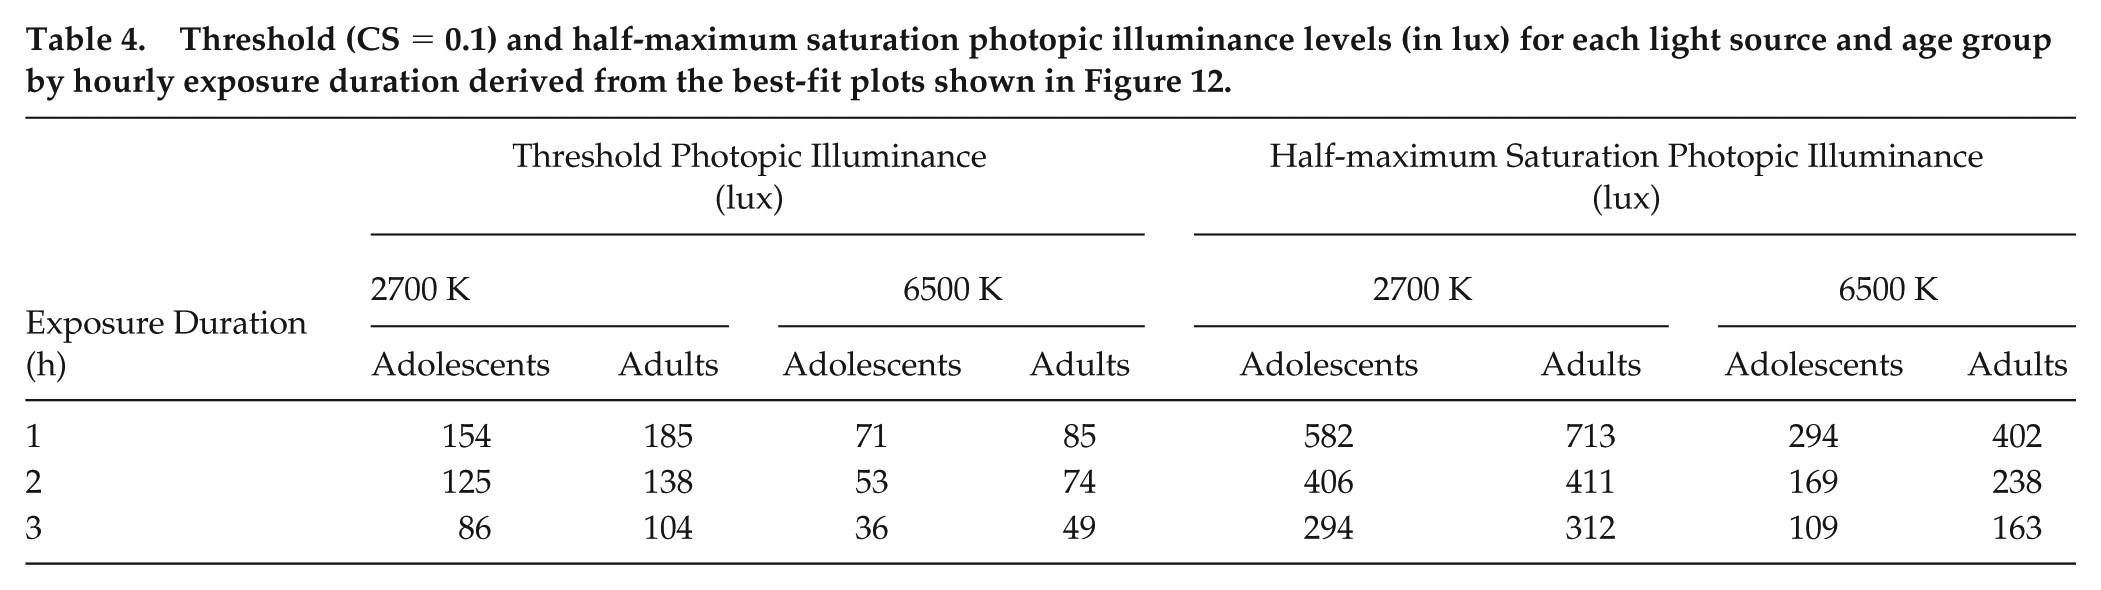
Figure 12 shows the best-fit dose-response curves generated separately for the 2 age groups and the 2 spectra at each exposure duration. All the post hoc models significantly fitted the data (p < 0.05, Approximate F test (Davenport and Webster, 1972)), wherein the goodness of fit as assessed by adjusted correlation coefficient (R2) was always better than 0.90. Using the best-fit dose-response curves, we were able to calculate threshold and half-maximum saturation for each light spectrum, exposure duration, and age group. Table 4 summarizes the derived threshold (10% melatonin suppression) and half-saturation photopic illuminance levels.
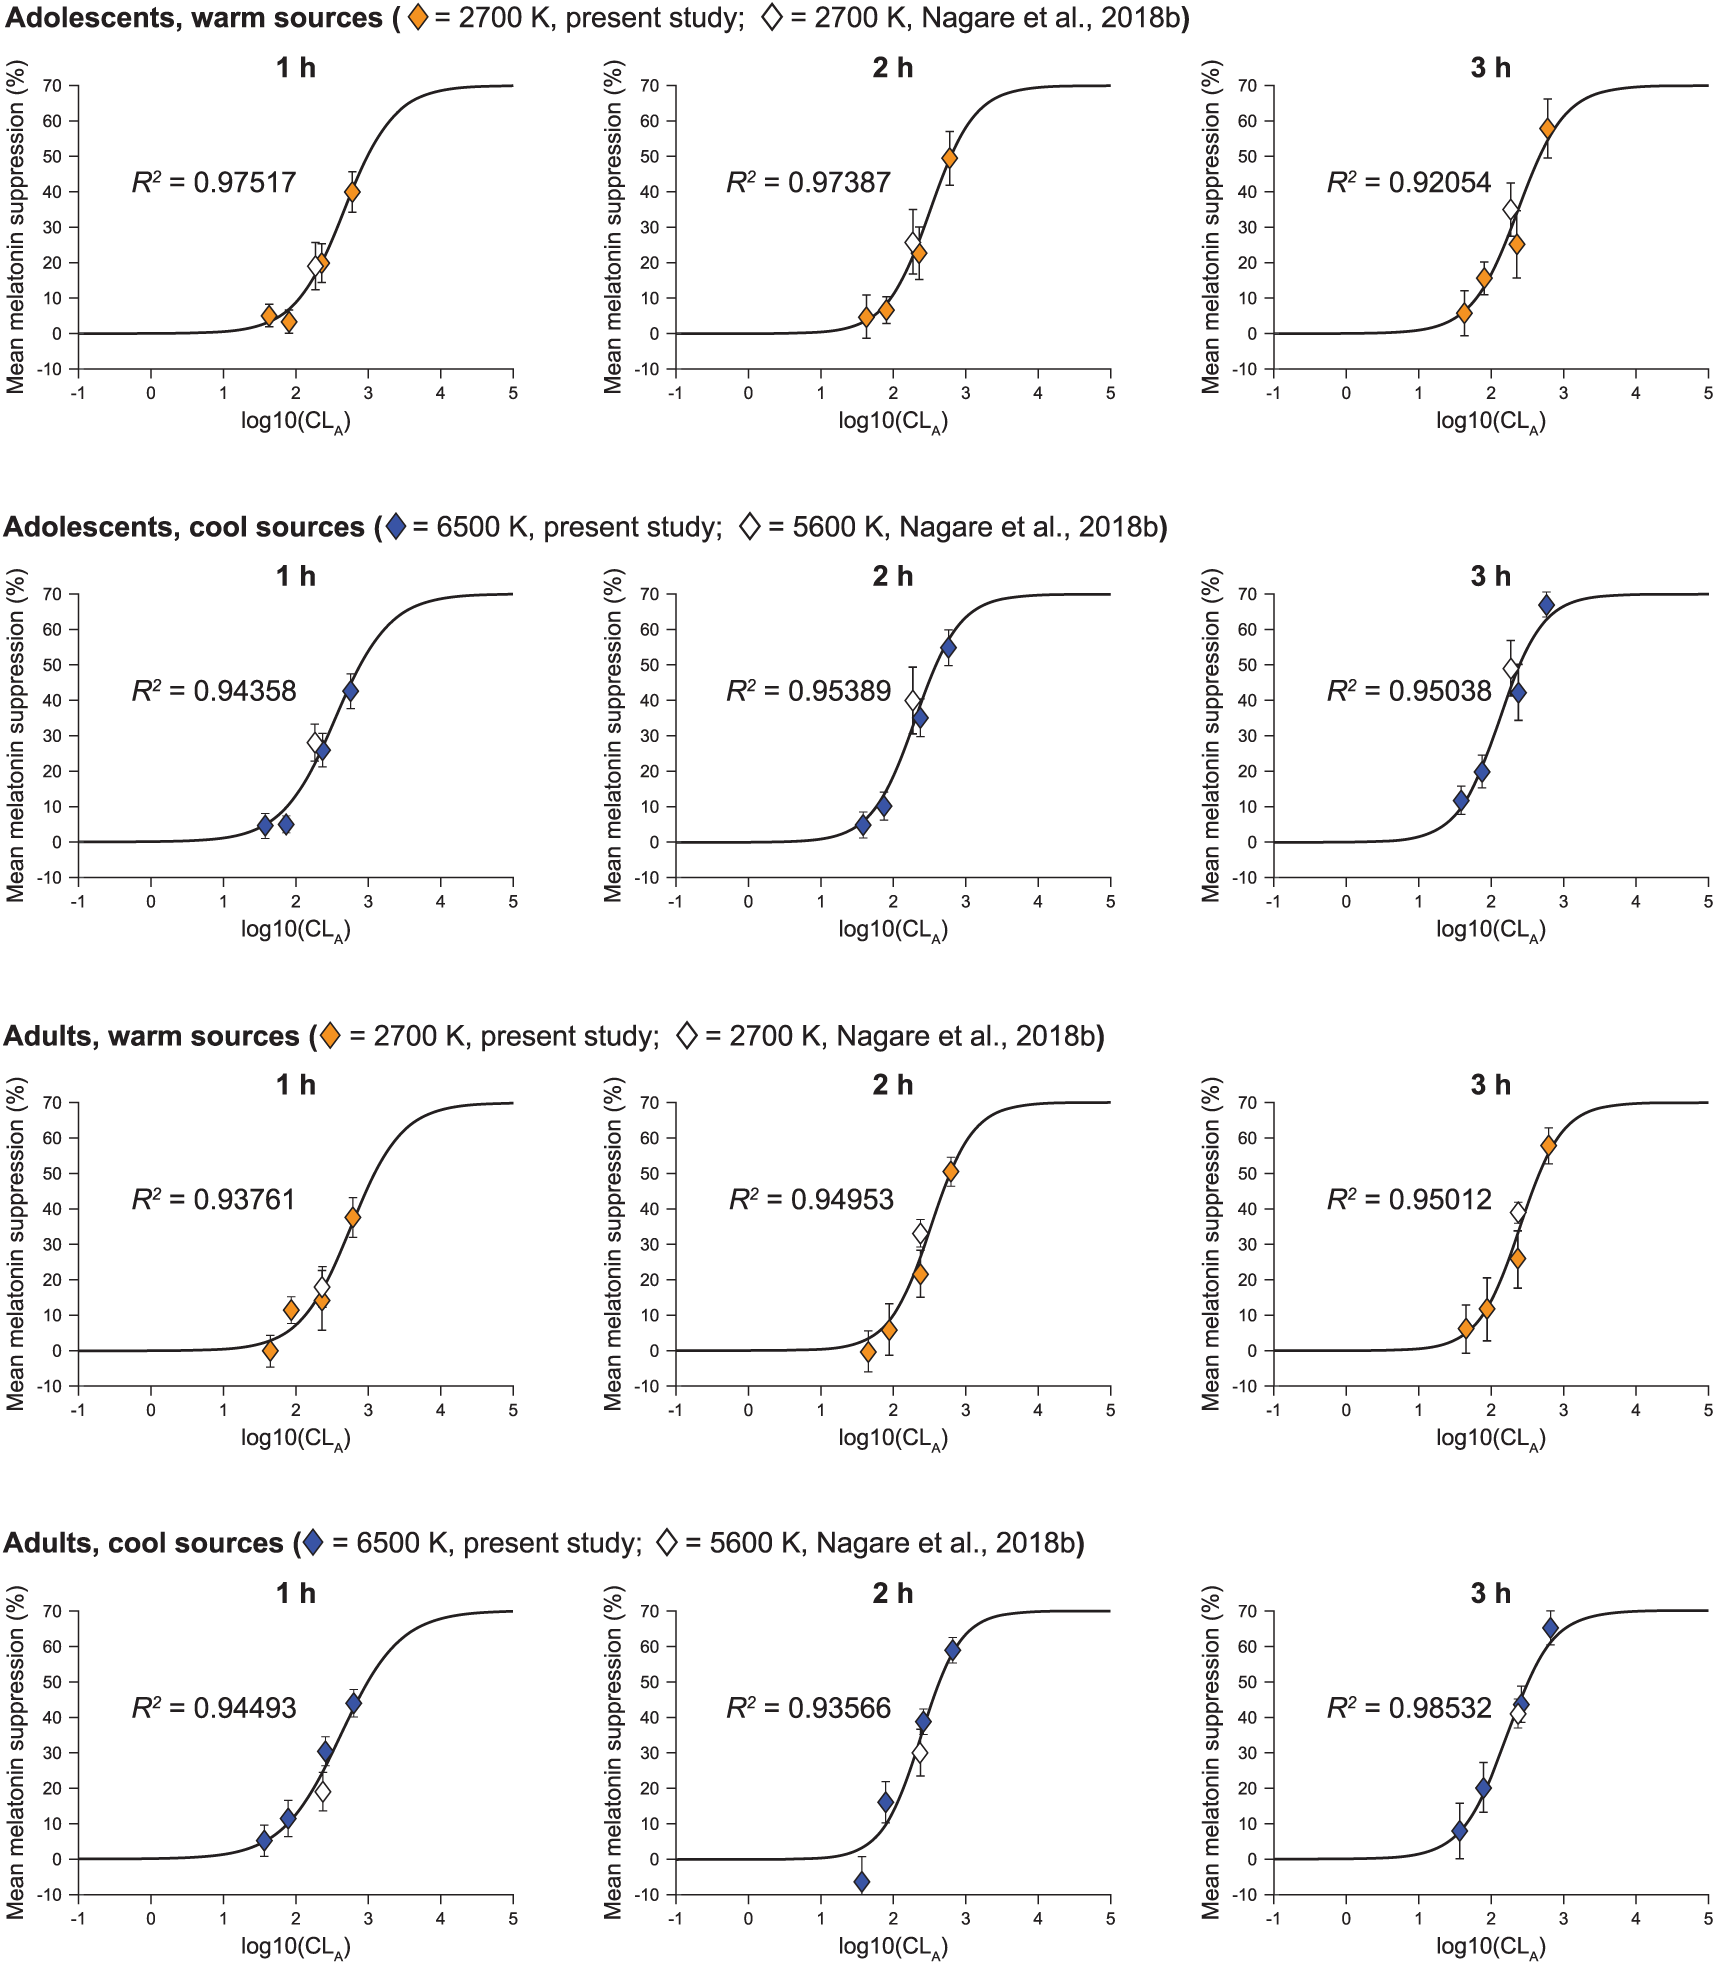
Using the least squares method, a 4-parameter logistic function (Rea et al., 2012) that converts CLA to CS was used to best-fit the melatonin suppression data at each hourly exposure duration, by age group and light source. The warm sources include the 2700 K source from the present study (solid polygons) and a similar 2700 K source from a previous white light study (hollow polygons) (Nagare et al., 2018b). The cool sources include the 6500 K source from the present study (solid polygons) and a similar 5600 K source from the same, previous white light study (hollow polygons) (Nagare et al., 2018b). The error bars represent SEM. The threshold (CS = 0.1) and half-saturation CLA levels, derived using the respective best-fit plots, were subsequently converted to photopic light levels for the respective spectra, and are summarized in Table 4.
Threshold (CS = 0.1) and half-maximum saturation photopic illuminance levels (in lux) for each light source and age group by hourly exposure duration derived from the best-fit plots shown in Figure 12.
Discussion
The primary goal of the present study was to measure nocturnal melatonin suppression for a wide range of light levels (40 to 1000 lux), 2 white-light spectra (2700 K and 6500 K) and extended nighttime light exposure durations (0.5 to 3.0 h). Overall, the results show that the incremental effectiveness of light in suppressing melatonin diminishes with increasing exposure duration for both age groups and both light sources. The mean absolute percent suppression per hour of exposure, averaged across all other independent variables, was 34.8% (1 h), 22.2% (2 h), and 17.3% (3 h), again highlighting the human circadian system’s non-linear dose-dependent response to photic stimuli (Chang et al., 2012; Nagare et al., 2018b; St Hilaire et al., 2012). The interaction between exposure duration and CS level further suggests that it takes longer to observe significant melatonin suppression at lower CS levels than at higher CS levels (Chang et al., 2011; Wong et al., 2005).
The lack of an interaction between white light spectra and exposure duration replicates the findings by Nagare et al. (2018b). The efficacy of the 2700 K source, relative to the 6500 K source providing stronger short-wavelength stimulation (see Table 2), did not decrease with an increase in exposure duration, supporting the inference that the spectral sensitivity of the participants from both age groups did not change over the 3-h exposure duration. The present results and those by Nagare et al. (2018b) are not in agreement with those from Gooley et al., who reported, using narrowband light sources, that cone photoreceptors only participate in the response during the first 60 to 90 min and that, for longer exposure durations, the response is mediated by the ipRGCs alone (Gooley et al., 2010). These differences may be attributed to the fact that Gooley et al. used narrowband light sources and that the response to polychromatic, white light sources may be different, as previously observed by Revell and colleagues (Revell and Skene, 2007; Revell et al., 2010). Another important difference between the 2 studies is that the 2 stimuli employed in the Gooley et al. study were not of the same stimulus magnitude. For example, the 460-nm source had a CS = 0.55 and the 555-nm source had a CS = 0.17 for the highest light levels. This significant difference in stimulus magnitude makes it impossible to determine if the relative change in suppression after 6 h of light exposure was a change in spectral sensitivity over time or simply a differential change in response to stimuli of very different magnitudes.
The significant main effect of spectrum was not predicted, given that the stimuli were equated to match CS. These results suggest that the CS model is either over-predicting the response to the 2700 K source or under-predicting the response to the 6500 K source. Based on the data from this study and those from Nagare et al. (2018b), it appears that the former is more likely. The CS model formulation assumes that, for “cool” polychromatic light sources (e.g., 6500 K), S-cones contribute to circadian phototransduction through the spectrally opponent blue versus yellow (b-y) color channel. This formulation closely predicts the 6500 K data in the present study as it has in previous studies with “cool” polychromatic sources (Figueiro et al., 2005; Figueiro et al., 2006a; Nagare et al., 2018b) and with narrowband light sources (Brainard et al., 2001; Thapan et al., 2001). The CS formulation assumes a melanopsin-only spectral sensitivity for “warm” polychromatic light sources. This one-photopigment formulation for “warm” sources perhaps ignores, based on these new data, subtle but important contributions from the photoreceptors distal to the retinal ganglion cells through intervening neural channels. For example, recent studies have shown an inhibitory relationship between cone-photopigments and melanopsin-based photopigments in pupil-size control (Spitschan et al., 2014; Woelders et al., 2018). Subsequent studies should be designed to investigate these interactions more specifically, but in the interim, the CS model formulation for “warm” sources should be adjusted to more accurately predict nocturnal melatonin suppression from the present, more extensive study.
These data can also be used to expand the circadian phototransduction model proposed by Rea et al. (Rea et al., 2005; Rea et al., 2012; Rea and Figueiro, 2018) to include light exposure durations longer than 1 h. From the logistic best-fit plots shown in Figure 12, it can be inferred that optimizing the half-maximum saturation and rate constants for the current equation transforming CLA to CS (b and c in Equation 4) accurately (R2 > 0.90) depicts the response characteristics for nocturnal melatonin suppression. It nonetheless should be noted that the present study’s measured levels of light-induced nocturnal melatonin suppression after 1-h exposures to each experimental condition (2 spectra × 4 target CS) were quite close to the predicted CS values revealed by the statistical analysis. Incorporating additional factors for exposure duration and participant age into the model will bring us closer to comprehensively characterizing the impact of chronic nighttime exposure to electrical lighting on melatonin suppression.
The present study’s secondary purpose was to examine whether differences in the spectral, absolute, or exposure duration sensitivity to light exist between adolescents and adults. The results do not corroborate the study’s hypothesis that adolescents exhibit greater circadian sensitivity to short-wavelength radiation compared with adults. This finding, however, is inconsistent with our previous work showing that melatonin suppression was significantly greater after exposure to a 5600 K intervention (43%) compared with a 2700 K intervention (29%) for adolescents only (Nagare et al., 2018b). Nonetheless, for all experimental conditions, the threshold light levels (CS = 0.1) and the half-maximum saturation were consistently, but not significantly, lower for the adolescents compared with the adults (see Table 4).
A similar trend was reported by Gabel et al. (2017), who showed that melatonin suppression after exposures to matched levels (250 lux) of warm (2800 K) and blue-enriched (9000 K) light was similar for adults (n = 12; mean [SEM] age = 63.6 [1.3] years), but suppression was more pronounced for young adults (n = 26; mean [SEM] age = 25.0 [0.6] years) after exposure to the blue-enriched light. It is important to view the present results in the context of the mean age of the adult participants (mean [SD] age of 42.4 [10.9] years and 38.7 [11.6] years, for study Phases 1 and 2, respectively) who were somewhat younger than the adult participants in the Nagare et al. (2018b) study (mean [SD] age of 46 [5.2] years) and considerably younger than those in the Gabel et al. (2017) study (mean age [SEM] age of 63.6 [1.3] years). It is also noteworthy that not all previous studies employing melatonin as a circadian biomarker have reported differential circadian sensitivity with respect to age (Benloucif et al., 2006; Kim et al., 2014; Klerman et al., 2001). A recent study by Najjar et al., (2014) investigating a series of non-visual responses to 60-min duration, monochromatic light exposures showed that melatonin suppression was not significantly different between older participants (mean [SEM] age of 59.4 [0.99] years) and younger participants (mean [SEM] age of 25.8 [0.73] years) when matched for photic stimulus at 480 nm. Thus, additional research is needed to better understand how age-related physiological changes affect the light sensitivity of the human circadian system.
The third purpose of the study was to provide empirical data for estimating an absolute threshold for discussing light’s impact on acute melatonin suppression. The threshold criterion used in this study was a CS level of 0.10 (equivalent to 10% melatonin suppression) because, in general, values <10% are within the assay variability. Depending on the age group, the 6500 K white light source required light levels of approximately 71 to 85 lux for a 1-h exposure and 36 to 49 lux for a 3-h exposure to reach the threshold criterion of 10% melatonin suppression. In terms of absolute photopic light levels, the highest sensitivity for melatonin suppression from white light has been reported in the adolescent age group for the cooler 6500 K source at all exposure durations. Thus, the proposed melatonin suppression threshold of 30 lux for 30 min for white light, suggested by Figueiro, Rea, and colleagues in various publications (Bullough et al., 2008; Figueiro and Rea, 2005; Figueiro et al., 2006b; Rea and Figueiro, 2013) appears to be an acceptable, if conservative, recommendation. However, whether <10% melatonin suppression can be deemed as a “safe” criterion for light at night is an idea that requires further consideration and additional research. In the present paper, it is simply used as a threshold for reliable melatonin suppression measurement within the protocol employed.
It should also be noted that, while acute melatonin suppression and phase shifting are likely to have the same spectral sensitivity (i.e., both are more sensitive to short wavelength light), the absolute sensitivities and temporal characteristics for the 2 outcome measures may not be the same. In other words, depending on the outcome measure, different inferences can be drawn about the circadian system even if the light stimulus to the SCN is identical. Therefore, caution should be taken when extrapolating these acute melatonin suppression results to other circadian system outcomes. Notwithstanding, the present results are relevant to the American Medical Association’s broad recommendation for limiting outdoor lighting CCTs to 3000 K or lower (American Medical Association, 2016). As shown in Table 1, the light levels typically recommended by the Illuminating Engineering Society of North America for outdoor environments at night (18 lux on the horizontal plane or approximately 9 lux at the eye) are below the threshold for melatonin suppression observed by the present study, even after a 3-h exposure for both the high-CCT and low-CCT sources (Illuminating Engineering Society, 2011). Computer displays and portable electronic devices, on the other hand, could potentially suppress melatonin at night, as has been shown by previous studies (Cajochen et al., 2011; Chang et al., 2015). This has also been shown by our previous studies (Figueiro and Overington, 2016; Nagare et al., 2018a) demonstrating that self-luminous electronic devices (e.g., iPads) can deliver as much as 80 to 100 lux (CS = 0.14 to 0.18) at the eye when a white background is used.
A limitation of the present study is that participants’ light exposures in the week prior to the laboratory session were neither monitored nor controlled. Given that all participants were full-time employees or students with regular schedules, however, it was assumed that they would receive consistent light exposures throughout the 10 weeks of the study. Since the present study was mostly interested in assessing the acute effect of light exposure on melatonin suppression, we did not specifically assess the participants’ circadian phase nor did we track DLMO. The fact that the baseline melatonin levels recorded at the beginning of each study night were not significantly different, both across the 2 study phases and between the 2 age groups, suggests that the light treatment was delivered at a similar circadian phase, but there is a possibility that this was not the case. Second, as mentioned above, the study’s adult participants were perhaps not old enough to reliably establish an age effect; although, we are planning to conduct a similar follow-up study with an older population (>60 years of age) to address this concern. Finally, we would like to acknowledge a study design limitation that confounded light exposure duration with the timing of the exposure. Specifically, the lighting intervention and subsequent melatonin measurements were undertaken during the early part of the participants’ biological night (i.e., during the rising gradient for the daily melatonin profile), and as such our inferences about the effect of exposure duration must be interpreted cautiously given the human circadian system’s changes in sensitivity according to the time of day (Khalsa et al., 2003).
Notwithstanding, given that the lighting for most architectural spaces has been designed to meet visual requirements and address energy-conservation concerns (Rea, 2000), the dose-response curves and deduced threshold light levels data can be used as guidelines for making lighting recommendations when considering non-visual responses in applications such as offices, schools, residences, and healthcare facilities.
Footnotes
Acknowledgements
The present study was funded by Jim H. McClung Lighting Research Foundation and the NIH Training Program in Alzheimer’s Disease Clinical and Translational Research (NIA 5T32AG057464). The sponsors did not participate in the study’s design, data collection, or data analyses. The authors would like to thank Kassandra Gonzales, Sharon Lesage, Howard Ohlhous, Martin Overington, David Pedler, Charles Roohan, and Allison Thayer for their technical and editorial assistance.
Conflict of Interest Statement
The author(s) have no potential conflicts of interest with respect to the research, authorship, and/or publication of this article.