
Abstract
Studies with monochromatic light stimuli have shown that the action spectrum for melatonin suppression exhibits its highest sensitivity at short wavelengths, around 460 to 480 nm. Other studies have demonstrated that filtering out the short wavelengths from white light reduces melatonin suppression. However, this filtering of short wavelengths was generally confounded with reduced light intensity and/or changes in color temperature. Moreover, it changed the appearance from white light to yellow/orange, rendering it unusable for many practical applications. Here, we show that selectively tuning a polychromatic white light spectrum, compensating for the reduction in spectral power between 450 and 500 nm by enhancing power at even shorter wavelengths, can produce greatly different effects on melatonin production, without changes in illuminance or color temperature. On different evenings, 15 participants were exposed to 3 h of white light with either low or high power between 450 and 500 nm, and the effects on salivary melatonin levels and alertness were compared with those during a dim light baseline. Exposure to the spectrum with low power between 450 and 500 nm, but high power at even shorter wavelengths, did not suppress melatonin compared with dim light, despite a large difference in illuminance (175 vs. <5 lux). In contrast, exposure to the spectrum with high power between 450 and 500 nm (also 175 lux) resulted in almost 50% melatonin suppression. For alertness, no significant differences between the 3 conditions were observed. These results open up new opportunities for lighting applications that allow for the use of electrical lighting without disturbance of melatonin production.
Adequate exposure to the right kind of light at the right time of day is important for our health and well-being. Exposure to bright light, in particular with high power at wavelengths around 480 nm, helps to entrain the biological clock to the natural day-night cycle when timed correctly (Duffy and Wright, 2005; LeGates et al., 2014). It may also support the maintenance of alertness levels, particularly at night (Cajochen, 2007; Chellappa et al., 2011; Souman et al., 2018). On the flip side, there are strong indications that chronic exposure to the wrong light at the wrong time of day may lead to a range of health risks. Because of the importance of light in entraining the internal biological clock, light exposure at inappropriate times of the day can phase-shift this clock relative to the day-night cycle and lead to sleep disturbances (Chellappa et al., 2013; Santhi et al., 2012; Zeitzer et al., 2000). Moreover, light at night acutely suppresses melatonin (Gooley et al., 2011; Lewy et al., 1980; Zeitzer et al., 2000) and affects core body temperature (Badia et al., 1991; Cajochen et al., 2000). Although the exact mechanisms are still not completely understood, epidemiological evidence suggests that in the long run these effects of light are associated with an increased risk of obesity and diabetes, heart disease, and breast and prostate cancer (Bedrosian et al., 2016; Benke and Benke, 2013; Blask, 2009). It is therefore crucial to understand the pathways that underlie these effects and to develop solutions that mitigate the potentially negative consequences of light exposure at night.
Recent years have shown converging evidence that a subset of retinal ganglion cells, the so-called intrinsically photosensitive ganglion cells (ipRGCs), play a central role in signaling changes in ambient light conditions to the biological clock, which resides in the suprachiasmatic nuclei (SCN) (Do and Yau, 2010; Lucas, 2013). These ipRGCs express the photopigment melanopsin, making them responsive to light even in the absence of innervation by rods and cones (Berson et al., 2002; Hattar, 2002; Provencio et al., 2000). In fact, a major share of the evidence for the existence of these ipRGCs comes from studies that identified the action spectrum for melatonin suppression, showing that this could not be explained from the spectral sensitivities of rods and cones alone (Brainard et al., 2001; Thapan et al., 2001). Melanopsin sensitivity peaks around 480 nm, making these cells particularly sensitive to short wavelength light that appears blue-cyan to the human eye (Lucas et al., 2014). Several studies have shown that monochromatic blue light is more effective in suppressing melatonin than green light (Cajochen et al., 2005; Lockley et al., 2003), in particular for longer exposure durations (Gooley et al., 2010). Similarly, melatonin suppression by polychromatic white light is increasingly effective when the light spectrum contains more power in the short wavelength band between 450 and 500 nm (Brainard et al., 2015). The same effect occurs for melatonin suppression by the backlights of electronic displays (Cajochen et al., 2011).
The sensitivity of melatonin levels to light between 450 and 500 nm suggests that melatonin suppression can be reduced by limiting the power in this spectral region, either by using very warm light with a low correlated color temperature (CCT) or by filtering out this part of the spectrum. Several studies have indeed shown that reducing spectral power below 530 nm leads to lower levels of melatonin suppression (Kayumov et al., 2005; Kozaki et al., 2008; Rahman et al., 2011, 2017; van de Werken et al., 2013). However, in all of these studies, the reduction in short wavelength power was confounded with reduced illumination levels and with a change in the appearance of the light (with exception of the study by Kozaki et al., 2008, who did change the CCT and appearance of the light by filtering out short wavelengths but kept the illumination level constant). Hence, for most of these studies the effects of spectral changes on melatonin suppression cannot be distinguished from effects of changes in illuminance. Moreover, filtering out all the short wavelengths leads to very warm, yellow-orange looking light, which is not preferred for most lighting applications. It would be similar to having the light of a sodium vapor street lamp indoors. The optimal spectrum for use in the evening not only should lead to minimal melatonin suppression but also should be white in appearance and, for specific applications, have good color rendering properties.
In this study, we used polychromatic spectra that generated warm white light (Δuv < 0.006; see ANSI, 2015) with a CCT of 2700 K. We varied the spectral power around 480 nm to test the effects on melatonin suppression while keeping CCT and illumination level constant. Two different spectra were developed which differed in their “melanopic efficacy” factor (MEF), the extent to which they activated the melanopsin photopigment for equal photopic illuminance (see Supplementary Materials). One spectrum contained high spectral power between 450 and 500 nm and was therefore expected to strongly stimulate the ipRGCs and lead to a high degree of melatonin suppression. We refer to this spectrum as the “high MEF” spectrum (Fig. 1). The other spectrum contained little energy between 450 and 500 nm and was therefore expected to produce far less melatonin suppression than the high MEF spectrum. We refer to this as the “low MEF” spectrum. To keep the CCT constant and retain a white appearance for this spectrum, spectral power between 400 and 430 nm was boosted (see Supplementary Materials). As can be seen from the melanopic sensitivity curve (dashed line in Fig. 1), the melanopsin photopigment is not very sensitive to these wavelengths. Adding this peak to the spectrum allowed for retaining the white appearance of the light. Moreover, this made it possible to test the contribution of these very short wavelengths to melatonin suppression when embedded in polychromatic light. So far, the role of very short wavelengths (~420 nm) has been tested only with monochromatic light stimuli (Brainard et al., 2001; Thapan et al., 2001). In our study, effects of exposure to both spectra on melatonin levels in the evening and on subjective as well as objective alertness measures were compared with those in a dim light baseline condition.
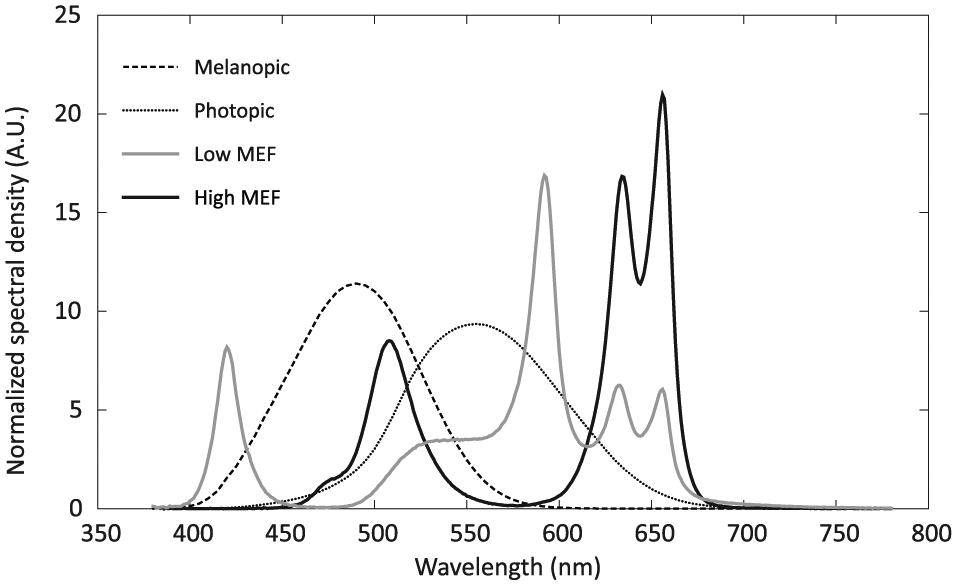
Light spectra (gray: low MEF condition; black: high MEF condition). Spectra were normalized to have the same area under the curve. For comparison, the relative melanopic (dashed) and photophic (dotted) sensitivity curves are also shown (data from Lucas et al., 2014).
Methods
Participants
Sixteen participants were recruited via an external agency. Inclusion criteria were age between 21 and 50 years, usual bedtime between 22:00 h and 00:00 h, normal or corrected-to-normal eyesight, and a maximum travel time from the laboratory to home of 30 min. Potential participants were excluded if they reported to be color blind or hypersensitive to light, had been diagnosed with an eye disease or with light-induced epilepsy or migraine, had hearing problems or chronic back or neck pain, regularly used medication (excluding birth control pills), suffered from sleep disorders, had used melatonin supplements within the last 2 months, had traveled across more than 1 time zone in the last 2 months, or had worked night shifts during the last 2 months. They were also excluded if they reported to suffer from mood disorders or regularly used large amounts of caffeine (>6 cups of coffee per day) or alcohol (>3 drinks per day) in the previous 2 months or if they had used illicit drugs in the previous 3 months. Finally, females were excluded if they reported to be pregnant. Of the 16 participants who enrolled, 9 were male and 7 female (age range, 22-50 years; mean ± SD, 36.2 ± 8.6 years). All participants passed the Ishihara color vision test (14 or 15 correct answers out of 15) and reported no severe sleeping problems (Pittsburgh Sleep Quality Index ≤8 [Buysse et al., 1989]; median ± IQR, 4 ± 1). None of them had an extreme diurnal preference according to the Morningness-Eveningness Questionnaire (MEQ) (Horne and Östberg, 1976); MEQ scores ranged from 33 to 69 (mean ± SD, 54.4 ± 8.7). All participants gave their written informed consent before entering the study and were paid for their participation at the end. Participants were naïve with respect to the study hypothesis and were debriefed after finishing the last measurements. The study was performed in accordance with the Declaration of Helsinki and was approved by the Institutional Committee for Studies on Human Subjects of Philips Lighting.
Design and Procedure
Participants were exposed to 3 light conditions, on 3 different evenings, separated by 1 week. Some exceptions to this rule occurred due to scheduling conflicts. For 1 participant, the second evening took place 2 weeks after the first evening, while 2 other participants switched their last evening, with 1 of these participants having 6 days between the second and the third evening and the other 8 days. All participants received the dim light condition on the first evening, while the order of the low and high MEF conditions was counterbalanced across participants for the second and third evenings. The first 8 participants were tested in September 2016, while the second half of the participants were tested in October 2016.
Participants were instructed to keep a regular sleep-wake schedule throughout the entire study, keeping the daily time when they went to bed within a range of 1 h. Starting 1 week before the first test evening, their bedtimes were monitored by means of actigraphy (Actiwatch Spectrum; Philips Respironics, Murrysville, PA) and self-report (sleep diary). Participants were instructed to mark the time they went to bed every night by pressing the button on the Actiwatch. Bedtimes were determined from these button presses and were verified against the data from actigraphy and sleep diary. The median bedtime in the week before the first test evening was used to determine the timing of the light exposure on all 3 test evenings. For 1 participant, the Actiwatch failed to record any data during the first week, and the self-recorded data from his sleep diary were used to compute the median bedtime. For another participant, bedtimes in the beginning of the first week proved to be much later than what she had indicated at intake as her usual bedtime. Since she stated that this was an exception, only the bedtimes of the last 3 days in the first week were used to compute the median bedtime. Comparison with bedtimes in the later weeks showed this to be an accurate estimate.
Participants were instructed not to use alcohol on the days they came to the laboratory and to refrain from caffeine, naps, and strenuous exercise in the afternoon before coming to the laboratory. Each test evening started with a 1-h adaptation period in dim light (<5 lux at the eye, 2700 K), followed by a 3-h exposure to the experimental light condition (Fig. 2). During the adaptation period, participants wore blue blocking glasses (Photonic Developments LLC, Walton Hills, OH) to further minimize exposure to short wavelength light. They were allowed to read self-brought materials (books, magazines, or nonluminous displays) or to listen to music or audiobooks, and they remained seated. They were provided with water but were not allowed to eat or drink anything else during the entire test evening. Every half-hour, starting after 30 min, a saliva sample was collected using a Salivette (Sarstedt AG, Nümbrecht, Germany) and immediately frozen at −25 °C. After providing the saliva sample, participants indicated their sleepiness using the Karolinska Sleepiness Scale (KSS) (Åkerstedt and Gillberg, 1990) and filled in the Global Vigor and Affect scale (GVA) (Monk, 1989). Both questionnaires were administered on a computer screen, using a dark background and a mid-gray font. Every hour, starting after 30 min, participants performed an auditory version of the Psychomotor Vigilance Task (PVT) (Dinges and Powell, 1985; Jung et al., 2011), administered over headphones. Participants were instructed to press the response button as fast as possible whenever they heard a 100-Hz tone (duration 0.4 sec). Tones were played against white background noise with a random interstimulus interval between 2 and 9 sec. The PVT comprised 110 trials and took approximately 10 min.
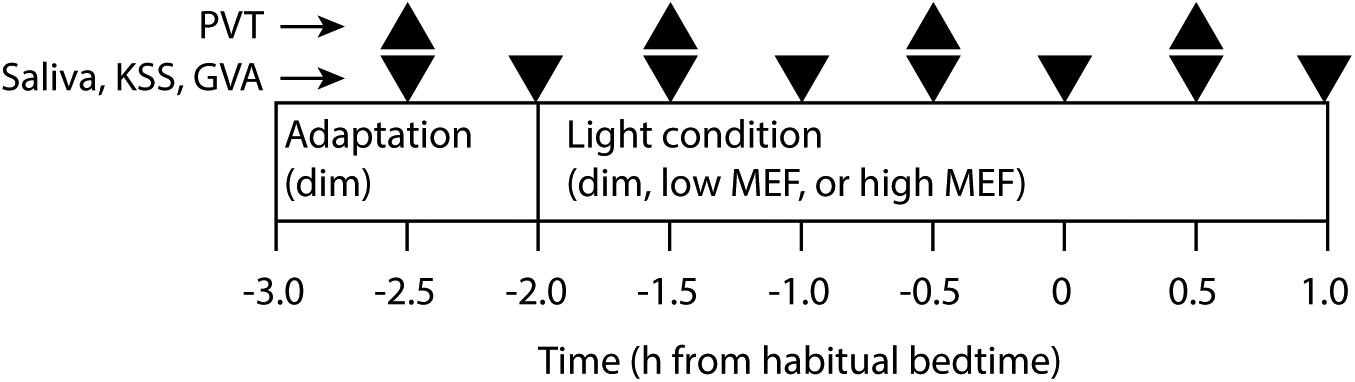
Experimental procedure during the test evenings. Each evening started with 1 h of exposure to dim light (<5 lux). Depending on the condition tested, participants then continued in dim light for the following 3 h (dim condition) or received the low or high MEF condition (both 175 lux). Every 30 min, a saliva sample was taken and participants filled in the KSS and GVA questionnaires (inverted triangles). Every hour, participants performed a 10-min auditory PVT task (upright triangles). The procedure ended 1 h after a participant’s habitual bedtime.
After the adaptation period, participants removed the blue blocking glasses and sat down in front of a custom-made light box (w × h × d: 75 × 75 × 45 cm) for the experimental condition of that evening. The interior of the light box was painted a neutral white. Light was projected through a 30 × 30 cm opening by a LEDCube (Thouslite, Changzhou, China) mounted directly on top of the box. Participants were instructed to keep looking into the light box, with their head on a chinrest, except when answering the KSS and GVA questionnaires, which were presented on a computer screen next to the light box. Every hour, after giving the saliva sample and filling in the questionnaires, participants received the opportunity to stand up and move around for 1 to 2 min. The ambient light level in the room was less than 5 lux measured vertically at eye height (CCT, 2700 K). In case a participant visited the bathroom, blue-blocking glasses were worn to minimize impact of the lighting in the hallway. During light exposure in the light box, participants were allowed to listen to music or audiobooks. The test leader regularly checked whether participants did indeed keep their eyes open. Light exposure started 2 h before and ended 1 h after a participant’s habitual bedtime as determined in the first week of the study (Fig. 2).
Light Conditions
Two spectra were designed to produce the maximal difference in “melanopic lux” 1 values (see Lucas et al., 2014) that could be achieved using the LEDCube, while having the same photopic illuminance of 175 lux at the eye and a constant CCT of 2700 K. The illuminance of 175 lux was chosen to maximize the expected difference in melatonin suppression between the 2 spectra for the highest possible light level. This was based on calculating the melanopic lux values for the results from Brainard et al. (2015) and constructing a dose-response curve of melatonin suppression versus melanopic lux (provided by Marijke Gordijn and Marina Giménez, personal communication, 2 May 2016). The resulting curve had a half maximum amount of melatonin suppression of ~25% at ~70 melanopic lux. Analysis of the possible range of spectra that could be achieved with the LEDcube showed that the minimum and maximum MEF values at 2700 K were approximately 0.30 and 1.07 (see Table 1 and Supplementary Materials). Therefore, choosing a target illuminance of 175 lux was expected to produce melanopic lux values of approximately 55 (≈ 0.30 × 175) and 187 (≈ 1.07 × 175), falling on the steepest part of the dose-response curve. As mentioned above, we refer to these spectra as low and high MEF, respectively, indicating that they differed only in the amount of melanopic stimulation, not in photopic illuminance or CCT. We also computed the α-opic daylight (D65) equivalent illuminance values for all 3 conditions, in accordance with the recent recommendations of the European Committee for Standardization (CEN, 2017). Moreover, the circadian light levels according to the model of Rea et al. (2005, 2012) were computed. All values are given in Table 2. Both the melanopic D65 equivalent lux values and the circadian light values, like the MEF values, showed a more than threefold difference between the low and high MEF conditions. This is not surprising, since for the current spectra, both of these measures also quantify only the melanopic contribution to nonvisual stimulation.
The α-opic illuminance values and melanopic efficacy (MEF) for the 3 experimental conditions.
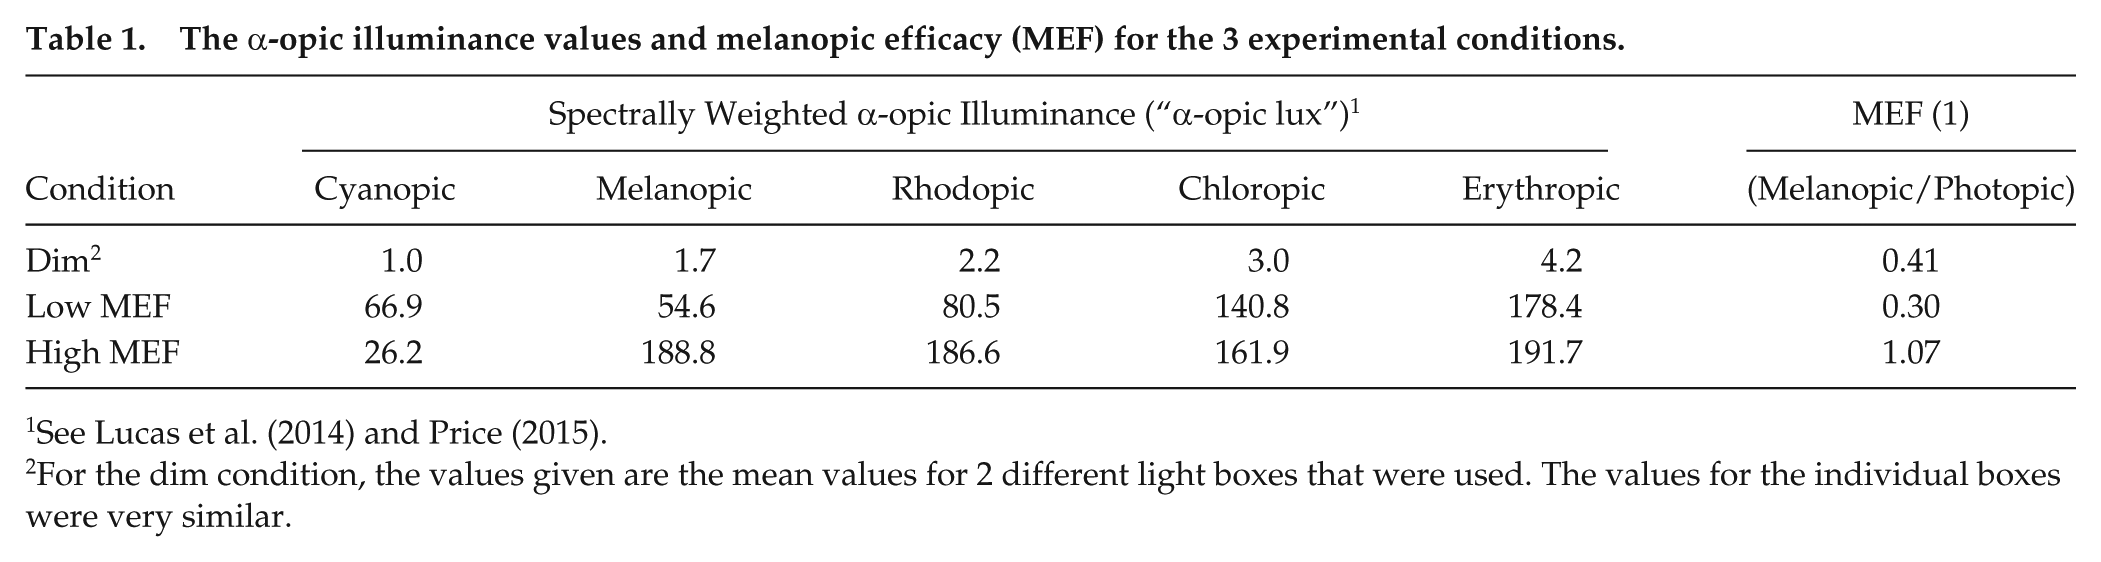
See Lucas et al. (2014) and Price (2015).
For the dim condition, the values given are the mean values for 2 different light boxes that were used. The values for the individual boxes were very similar.
The α-opic equivalent daylight (D65) illuminance values (CEN, 2017) and circadian light stimulus (CLA) for the 3 experimental conditions.
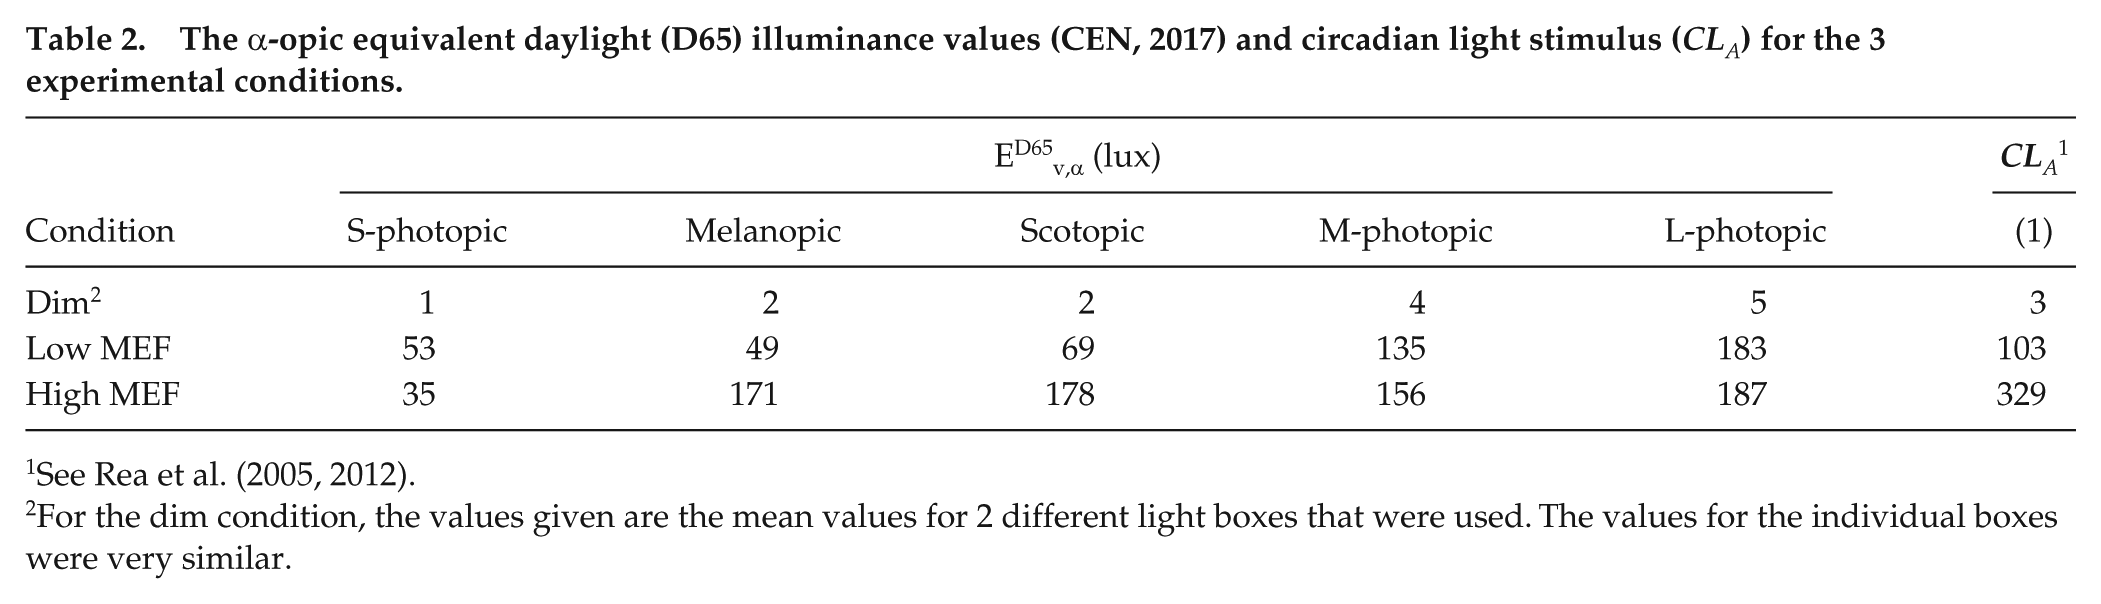
See Rea et al. (2005, 2012).
For the dim condition, the values given are the mean values for 2 different light boxes that were used. The values for the individual boxes were very similar.
The 2 experimental spectra are shown in Figure 1, together with the melanopic and photopic sensitivity curves. The spectra were measured from the position between the participant’s eyes, using a JETI Specbos 1211 spectroradiometer (JETI Technische Instrumente GmbH, Jena, Germany). Both spectra produced an equal illuminance but differed in the amount of melanopsin stimulation. For the low MEF spectrum, power density between 450 and 500 nm was minimized and an extra peak was added around 420 nm to keep the CCT at 2700 K. For the high MEF spectrum, power density around 505 nm was boosted to maximize melanopic stimulation and, in order to keep the same CCT, compensated by boosting the long wavelengths (around 650 nm) as well. For the dim light baseline condition, an intensity-reduced version of the low MEF spectrum was used, producing an illuminance at the eye less than 5 lux. Table 3 presents some photometric, radiometric, and colorimetric properties of all 3 spectra. To ensure the safety of our participants, we evaluated the blue light hazard of the spectra and found them to be far below the limit of 100 W/m2/sr recommended by the international CIE standard (International Standard CEI/IEC 62471, 2006) for exposure times more than 10,000 sec (LB = 0.06 W/m2/sr for the low MEF condition and LB = 0.01 W/m2/sr for the high MEF condition).
Spectral properties for the experimental conditions.
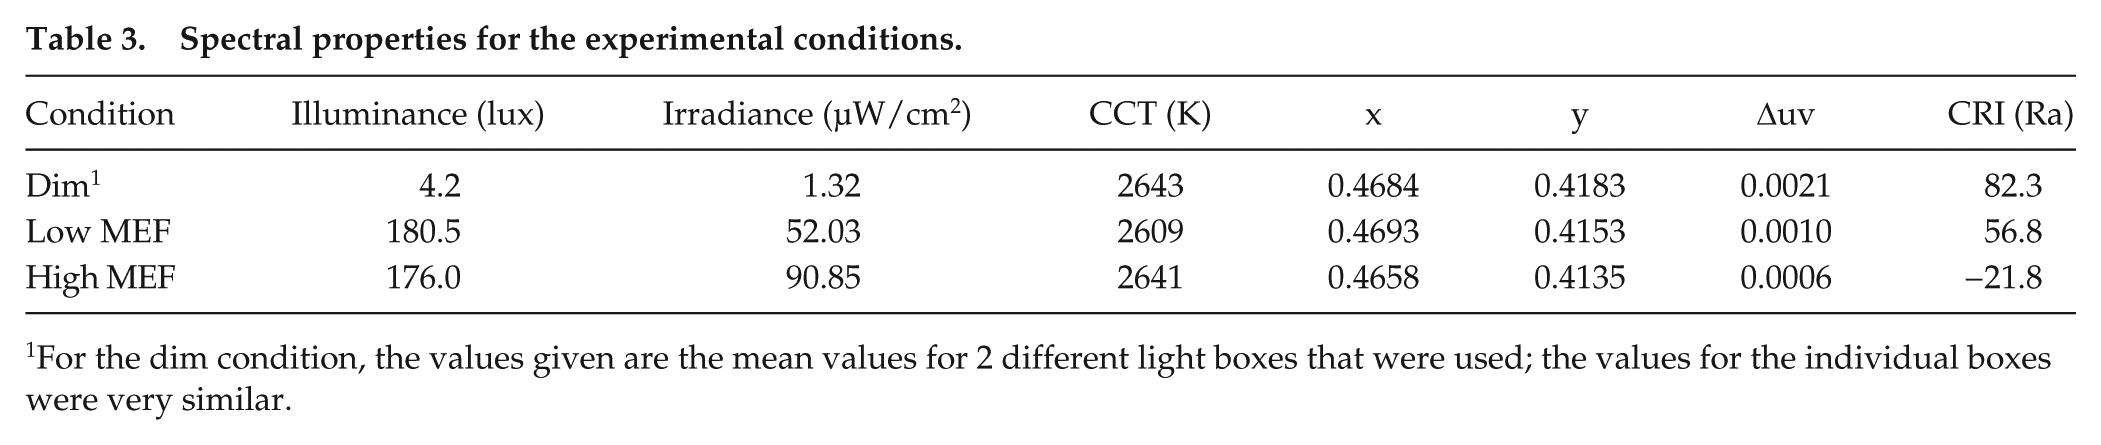
For the dim condition, the values given are the mean values for 2 different light boxes that were used; the values for the individual boxes were very similar.
Analysis
One participant decided to withdraw from participation on the first test evening. Hence, the resulting dataset contained the data from 15 participants. Saliva samples were sent in frozen condition to
For the GVA scale, separate scores for the Global Vigor and Global Affect dimensions were determined at each measurement (Monk, 1989). Only the Global Vigor (GV) scores, which relate to subjective alertness, are reported here. For each administration of the PVT, reaction times (RT) less than 100 msec were discarded and the median inverse RT for the remaining trials was computed. The inverse RT was used to improve normality (Ratcliff, 1993). The proportion of lapses (trials with missing responses or RT >500 msec) was determined as well. For all dependent measures (salivary melatonin level, KSS, Global Vigor, and PVT median inverse RT and lapses), first the difference between the 3 lighting conditions at the end of the adaptation period (first measurement for PVT, second for the other variables) was tested, using a 1-way repeated-measures ANOVA with light condition as within-subject factor. Then, the differences between the lighting conditions during light exposure were tested using a 2-way repeated-measures ANOVA with light condition and measurement time as within-subject factors. Due to technical difficulties, 3 data points from 2 participants for the KSS and GVA and 1 data point from 1 participant for the PVT were missing. These participants were therefore left out of the respective ANOVAs. To compare the amount of melatonin suppression under the low and high MEF conditions, the AUC for melatonin levels during light exposure in these 2 conditions was computed relative to that in the dim light baseline condition. In case the sphericity assumption of a repeated-measures ANOVA was violated, as indicated by the results of the Mauchly test, the Greenhouse-Geisser correction was used. Effect sizes were computed using the Measures of Effect Size toolbox for MatLab (Hentschke and Stüttgen, 2011) and are reported as partial
Results
In the week before the first test evening, participants’ mean bedtime (±SD) was 2304 h (± 34 min). The mean absolute deviations of the bedtimes in the weeks before the second and the third test evenings relative to that in the first week were 31.1 min (±21.1 min) and 36.8 min (±30.2 min), respectively. No differences were observed in prior light exposure (as measured with the Actiwatch) on the days with experimental sessions (see Supplementary Materials).
In all 3 light conditions, melatonin levels started to rise from the first measurement during the adaptation phase (t = −2.5 h) (Fig. 3A). As expected, melatonin levels were not significantly different between the 3 light conditions during this phase (F2,26 = 1.44, p = 0.254,
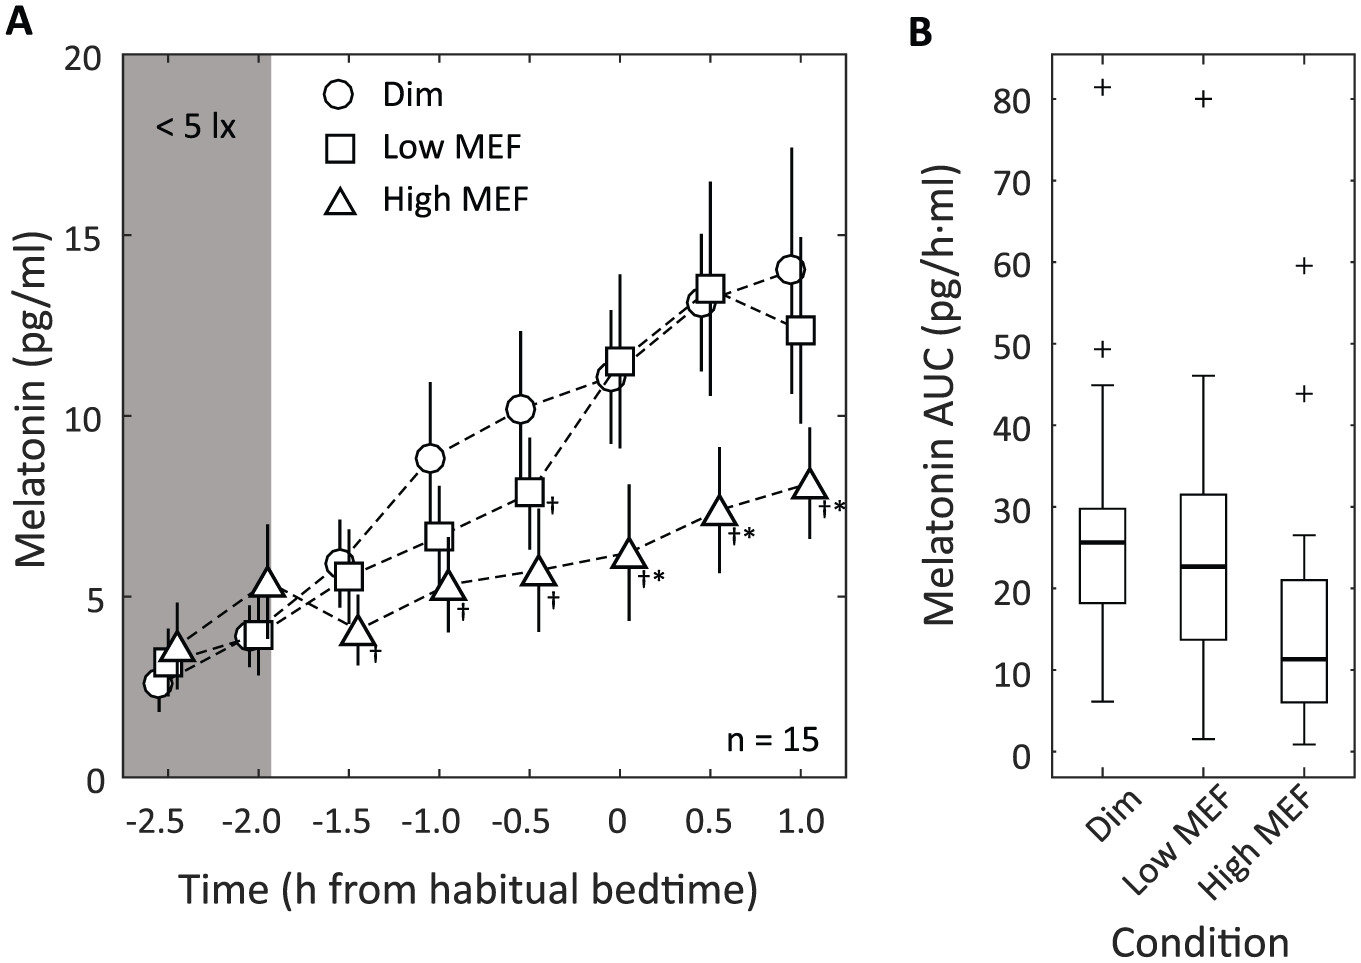
Melatonin results. (A) Mean salivary melatonin levels (±SEM) in the dim light baseline condition (circles), the low MEF condition (squares), and the high MEF condition (triangles). The first 2 measurements (at t = −2.5 and −2.0) were performed in dim light (<5 lux) for all 3 conditions. Symbols for different conditions have been slightly offset horizontally for clarity. †Melatonin levels that were significantly different (p < 0.05) from those in the dim light condition at the same time point. *Melatonin levels in the high MEF condition that were significantly different from those in the low MEF condition at the same time point. (B) Melatonin AUC boxplots for the dim, low MEF, and high MEF conditions (computed from t = −1.5 until 1.0). The small crosses indicate outliers (data points lying more than 1.5 IQR above the third quartile).
In contrast to the melatonin results, neither the subjective nor the objective measures of alertness showed significant differences between the 3 light conditions. Figure 4 shows the results for subjective alertness, measured with the KSS and the GVA (GV subscale). As expected, both measures showed decreasing alertness (increasing sleepiness) in the course of all 3 test evenings (main effect of time on KSS, F5,60 = 41.37, p < 0.001,
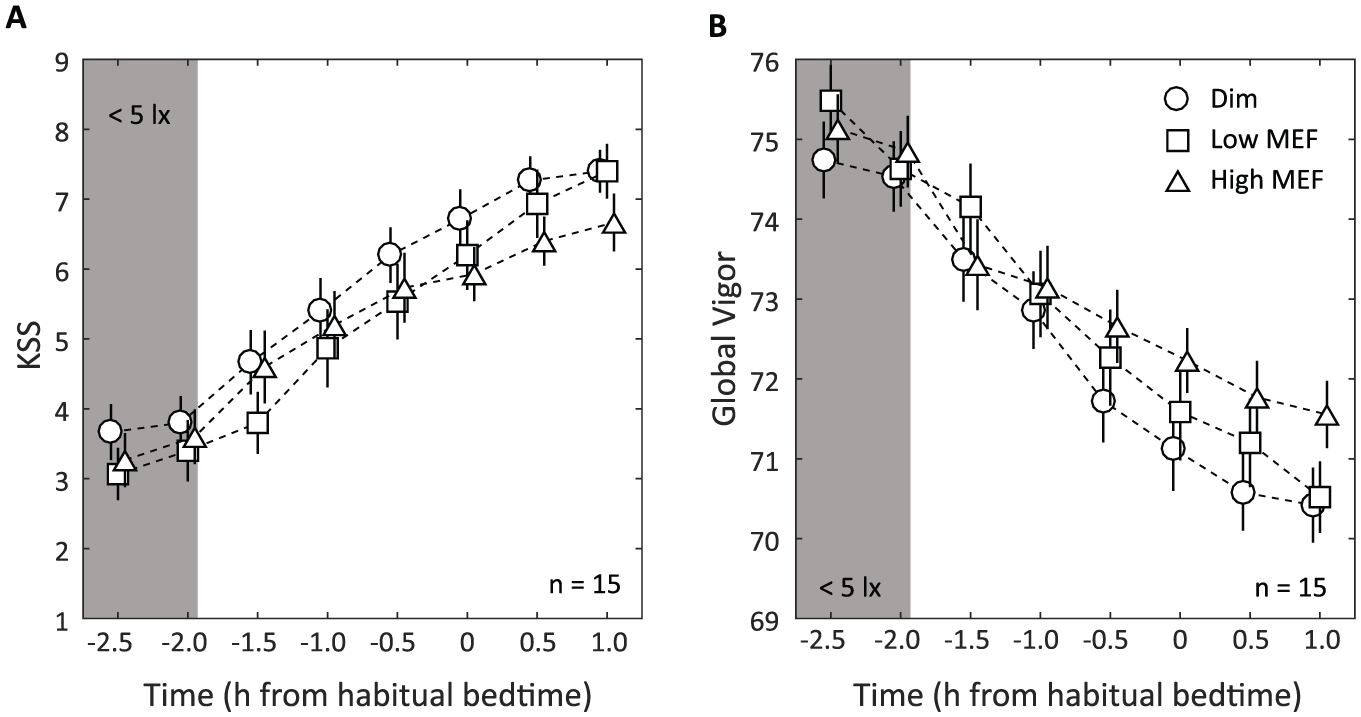
Subjective alertness. (A) Mean KSS scores and (B) mean Global Vigor scores (±SEM) in the dim light baseline condition (circles), the low MEF condition (squares), and the high MEF condition (triangles). The first 2 measurements (at t = −2.5 and −2.0) were done in dim light (<5 lux) for all 3 conditions. Note that the 2 scales have opposite polarity (higher alertness leads to lower scores on KSS and higher scores on GV). Symbols for different conditions have been slightly offset horizontally for clarity.
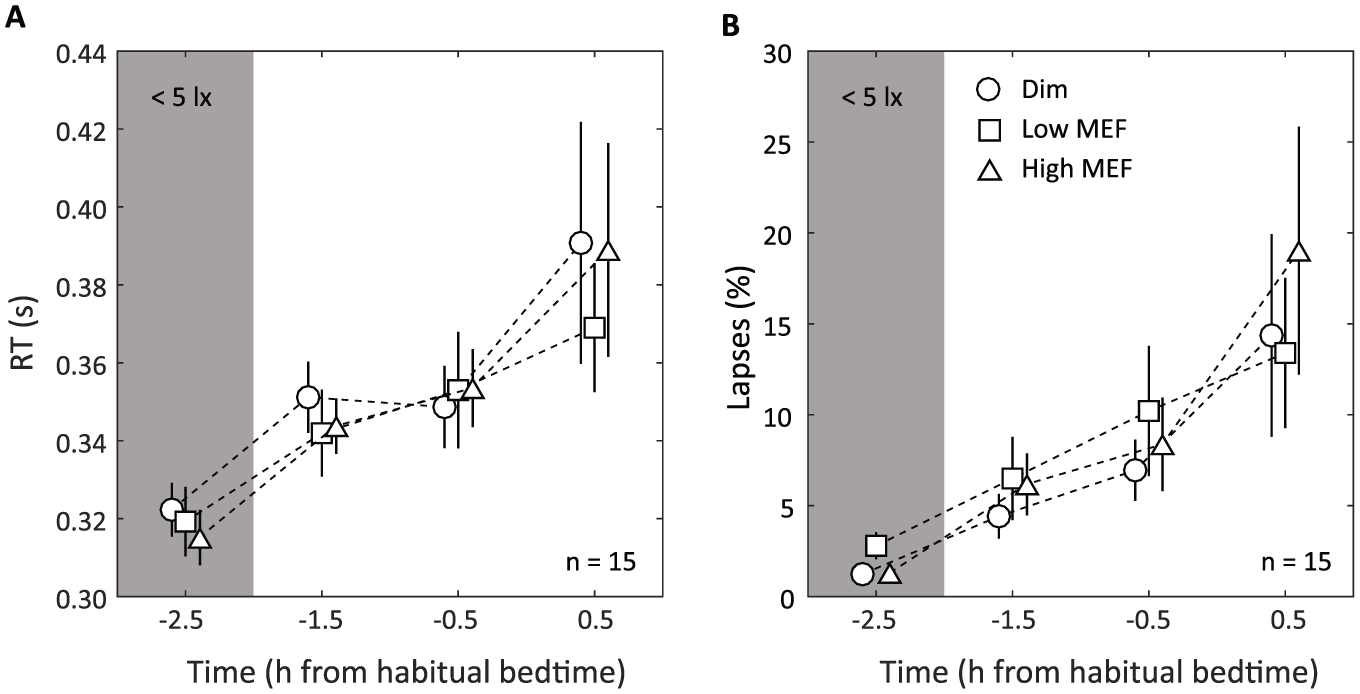
PVT results. (A) Mean PVT reaction time (based on the median reaction time per 10-min PVT block) and (B) mean proportion lapses (±SEM) in the dim light baseline condition (circles), the low MEF condition (squares), and the high MEF condition (triangles). The first measurement (at t = −2.5) was done in dim light (<5 lux) for all 3 conditions. Symbols for different conditions have been slightly offset horizontally for clarity.
Discussion
Melatonin suppression and alertness were measured for exposure to 2 spectra with a similar CCT and illuminance but different spectral power in the short wavelength band between 450 and 500 nm (melanopic sensitivity). Based on previous studies (Brainard et al., 2015; Cajochen et al., 2005), the high MEF condition was expected to cause considerable melatonin suppression when compared with the dim light baseline condition, which indeed it did (almost 50% expressed in AUC). Even more interestingly, the low MEF condition, with almost the same illuminance at the eye and a similar CCT, did not produce significant suppression of melatonin levels when compared with the dim light baseline (<9% difference in AUC). Our results provide clear evidence that for polychromatic white light, it is not the illumination level or the CCT per se that causes melatonin suppression. Instead, the spectral power at wavelengths that show high melanopic sensitivity (450-500 nm) plays a primary role in determining melatonin suppression. Moreover, our results suggest that even shorter wavelengths (400-430 nm) do not substantially add to melatonin suppression.
It is often assumed, either implicitly or explicitly, that light spectra with higher CCTs (but equal photopic luminance) will always stimulate the melanopsin photopigment more than lower CCTs and hence cause more melatonin suppression (e.g., see Kraneburg et al., 2017). Strictly speaking, however, this is true only for black body radiators, which emit a continuous spectrum, the peak of which shifts to shorter wavelengths with increasing temperature (Wyszecki and Stiles, 1982). For electrical light sources, in particular those based on solid-state lighting (LEDs), the melanopic efficacy and the CCT of the emitted spectra are far less strongly correlated. By changing the LEDs and/or phosphors used in a light source, it is possible to generate spectra with a high CCT that provide less stimulation to the melanopsin receptors than other spectra with a lower CCT (see Supplementary Materials). Indeed, our present results show that even with a constant CCT, melatonin suppression effects can vary greatly.
Our results do not assume a specific model for nonvisual effects of light, nor was the experiment designed to discriminate between different models. Even though our conditions were defined using the “melanopic illuminance” values of the spectra (Lucas et al., 2014), we do not mean this to imply that the stimulation of the melanopsin receptors is the only relevant factor in determining acute nonvisual effects of light. The concept of melanopic illuminance was used as a heuristic to create a potentially large difference in nonvisual effects while keeping crucial visual parameters constant. Other metrics, for instance the circadian light level CLA as defined by Rea et al. (2005, 2012), suggested a similar difference in nonvisual potency for our conditions (see Table 2). While our results show that these differences were certainly sufficiently large to create reliable effects on melatonin suppression, we do not exclude the possibility that with the appropriate model of how nonvisual effects depend on spectral properties, even larger differences might be created. This model may, next to the ipRGCs, also include contributions from the cone system (Figueiro et al., 2008; Gooley et al., 2010; Rea et al., 2005). In fact, our results did show a small difference between melatonin levels in the dim and low MEF conditions during the first 1.5 h of light exposure, which then disappeared toward the end of the measurements. Whether this difference reflects an initial contribution of the cone system to melatonin suppression (Gooley et al., 2010) remains to be further investigated.
Comparison of the melatonin levels under the different lighting conditions assumes that participants were in the same circadian phase in all 3 conditions. Since we measured melatonin during different light conditions in the evening, this being more relevant to potential applications than measurements in the middle of the night, we were not able to determine the dim light melatonin onset (DLMO), which could have been taken as an indicator for circadian phase. Instead, we verified that bedtimes remained stable throughout the experimental protocol as a proxy for circadian phase.
In contrast to our results for melatonin suppression, we did not find a significant difference between our low and high MEF spectra on alertness or even a difference with the dim light baseline condition. This was true both for objectively measured alertness (PVT) and for subjectively reported alertness (KSS and GV). Although it cannot be excluded that the very short wavelengths between 400 and 430 nm in the low MEF spectrum had an alerting effect that may have compensated for the lack of a blue light component in this spectrum (see Revell et al., 2006), the absence of a difference with the dim light baseline suggests that our light spectra overall had little alerting effect. This is despite the fact that all 3 alertness measures used showed a clear change toward lower alertness in the course of the test evenings, indicating that they were at least sufficiently sensitive to pick up this effect of time.
The literature on acute alerting effects of light shows a very heterogeneous pattern of results (see Souman et al., 2018, for a recent review). Several studies have reported clear effects on subjective alertness of increasing illuminance and/or spectral power between 450 and 500 nm (e.g., see Cajochen et al., 2000). However, several studies failed to find these effects or even reported negative effects (see Souman et al., 2018). In a recent paper, Hommes and Giménez (2015) constructed a psychometric curve of change in KSS scores as a function of melanopic illuminance from 8 earlier publications. However, although the melanopic illuminance in our 3 conditions spanned the entire range of this curve (2, 55, and 189 melanopic lux for the dim, low MEF, and high MEF conditions, respectively), we did not observe significant differences in KSS scores between the 3 conditions. This matches findings in several other studies that also failed to find these acute alerting effects of light (Souman et al., 2018). The absence of significant differences in alertness in our study may have been partially due to a lack of statistical power, given our sample size (n = 15), although it was sufficiently large to find significant changes in alertness over time. Another, possibly more important factor may have been the prior light history of the participants. In some of the studies used to construct the dose-response curve of Hommes and Giménez (2015), participants were kept in the dark for several hours before light exposure (also see Cajochen et al., 2000). In contrast, our participants went about their normal daily activities before coming to the laboratory in the evening, where they received a 1-h adaptation period in dim light. Previous studies have shown that exposure to light earlier in the day may modulate effects of light in the evening or at night (Chang et al., 2011; Münch et al., 2012, 2016). Consequently, exposure to daylight or electric light earlier in the day may have rendered our participants less sensitive to the effects of our experimental conditions. This may have reduced the differences in alertness in the 3 light conditions. It may also imply that the difference in melatonin suppression between the conditions as measured in our experiment could have been even bigger when measured after extensive dark adaptation.
Our results show that it is possible to produce very different nonvisual effects of light exposure, at least as far as melatonin suppression is concerned, with spectra that have similar visual characteristics (in terms of illuminance, CCT, and appearance). Although certain methodological aspects of the study (such as the dim light adaptation phase, including the use of blue blocking glasses, or the constant light exposure in a light box) make it less than straightforward to generalize our findings to real-world conditions, the results suggest new possibilities to influence at least some nonvisual effects of light exposure in daily life. This opens up exciting new avenues for applications in, for instance, the home environment, allowing for more flexibility in balancing the need for light at night with avoiding disturbance of the biological clock or melatonin production. It also may offer new solutions in healthcare, where the importance of sleep, and hence of appropriate light-dark cycles, for patients’ recovery is receiving increasing attention (Giménez et al., 2017) but needs to be balanced with good lighting for the staff. Moreover, these results offer new opportunities in research, because they suggest a way to construct placebo conditions for light manipulations that do not differ visibly from the experimental condition, thus making participants blind to the light manipulation. Obviously, other aspects of lighting, such as color rendering, also need to be taken into account when developing these solutions. Although the spectra tested in this study were not optimized for color rendering, light sources need to provide some minimum quality of color rendering for practical applications, with the acceptable minimum depending on the application at hand. For instance, bedside patient examination will require a much better color rendering than general living room lighting. Modern solid-state lighting now offers us much more flexibility in balancing these potentially conflicting lighting requirements.
Supplemental Material
Souman_et_al_Supplementary_materials_accepted – Supplemental material for Spectral Tuning of White Light Allows for Strong Reduction in Melatonin Suppression without Changing Illumination Level or Color Temperature
Supplemental material, Souman_et_al_Supplementary_materials_accepted for Spectral Tuning of White Light Allows for Strong Reduction in Melatonin Suppression without Changing Illumination Level or Color Temperature by Jan L. Souman, Tobias Borra, Iris de Goijer, Luc J. M. Schlangen, Björn N. S. Vlaskamp and Marcel P. Lucassen in Journal of Biological Rhythms
Footnotes
Acknowledgements
The authors thank Ruud Baselmans, Gosia Perz, Ambali Talen, Frank van den Berg, and Patricia van Kemenade (all Philips Lighting) for their support in data collection and Sascha Jenderny (Philips Research/University of Twente) and Tsvetomira Tsoneva and Raymond van Ee (both Philips Research) for their help in executing a precursor to this study. We also thank Mariëlle Aarts and Evert van Loenen (Eindhoven University of Technology) for their input in setting up and executing this study and Adrie de Vries (Philips Lighting) for his comments on an earlier version of this paper, as well as 2 anonymous reviewers for their helpful comments. This research was funded by Philips Lighting Research.
Author Contributions
J.L.S. and B.N.S.V. conceived of the study hypothesis; all authors were involved in the study design; I.G. and M.P.L. defined the experimental spectra; I.G., T.B., and J.L.S. performed the experiment; I.G. and J.L.S. analyzed the data; J.L.S. wrote the manuscript with input from the other authors. M.P.L. and J.L.S. wrote the Supplementary Materials. All authors reviewed the final manuscript.
Conflict of Interest Statement
The author(s) declared the following potential conflicts of interest with respect to the research, authorship, and/or publication of this article: J.L.S., T.B., L.J.M.S., and M.P.L. are employed by Philips Lighting. I.G. did her MSc graduation project at Philips Lighting. B.N.S.V. was employed by Philips Research until 28 February 2017.
Notes
References
Supplementary Material
Please find the following supplemental material available below.
For Open Access articles published under a Creative Commons License, all supplemental material carries the same license as the article it is associated with.
For non-Open Access articles published, all supplemental material carries a non-exclusive license, and permission requests for re-use of supplemental material or any part of supplemental material shall be sent directly to the copyright owner as specified in the copyright notice associated with the article.