
Abstract
In situ activity patterns of 2 Formica rufa-group species (F. pratensis; F. polyctena) were continuously studied at 4 different red wood-ant nests for 6 months in each of the years 2010, 2011, 2012, and 2016 and related to weather factors and variations in the Earth’s magnetic field. The in situ activity patterns of both species were similarly periodic and exhibited ultradian, and short- and long infradian rhythms under natural LD conditions. Crepuscular and nocturnal activities shorter than or equal to 4 h were observed in both species, especially at the new moon and first quarter after the astronomical twilight in a period of darkness in fall. We hypothesize that local variability in the Earth’s magnetic field affects these long-term activity patterns, whereas humidity and temperature were more strongly associated with ultradian rhythms (less than 20 h).
Geophysical processes, such as the Earth’s 24-h rotation, day-night cycle, tides, and the Moon’s rotation, drive all rhythms, and the behavior and survival of life on Earth (Evans and Gorman, 2016; Fuchikawa et al., 2016; Helm et al., 2017). Furthermore, the Earth’s magnetic field has a fundamental period of 24 h that varies somewhat with local time, latitude, season, and solar cycle (Macmillan, 2004). Besides diel fluctuations in environmental conditions and the tilt of the Earth’s axis (approximately 23.4°), geophysical processes are further associated with abiotic cycles, primarily seasonal changes in day length (duration and intensity of the LD cycle) and meteorological cycles (e.g., temperature, air pressure, humidity, precipitation) throughout the year (Daan, 2010; Helm et al., 2017).
The temporal organization of molecular, cellular, biochemical, physiological, and behavioral processes are thought to be coordinated by an endogenous, self-sustaining 24-h (circadian) clock, synchronized (entrained) to the daily LD cycle (e.g., Kronfeld-Schor et al., 2013; Sharma, 2003). Under natural conditions, organisms perceive this rhythmic information and generate internal representations of time (Helm et al., 2017). Both LD cycles and temperature are hypothesized to be the dominant environmental factors influencing the synchronization of circadian clocks and, consequently, the biotic cycle, in organisms from bacteria to animals. These factors can also promote a change in clock phase in either direction depending on time (Cornelissen et al., 1999; Lazzari and Insausti, 2008), which, in turn, can alter the timing of daily behaviors (e.g., rest-activity cycles, mating, egg hatching, feeding). Besides diurnal periodicity (Cornelissen et al., 1999; Gillette and Sejnowski, 2005), there are many other cyclic processes that interact with one another, such as circa-tidal (Satoh and Numata, 2014), reproductive (Houdelier et al., 2002), weekly (Meyer-Rochnow and Brown, 1998; Reinberg at al., 2017), and annual rhythmicity (Bertolucci et al., 2002).
Recent studies using model organisms to study circadian behavioral rhythms have highlighted discrepancies between rhythms observed under standardized laboratory conditions and those observed in the field (Daan, 2011; Dominoni et al., 2017; Helm et al., 2017; Kronfeld-Schor et al., 2013). Field studies show that various abiotic and biotic parameters influence organisms, including the anticipation of light transitions, twilight activity, nocturnal behavior under moonlight, and the dominance of light over temperature stimuli (e.g., Calisi and Bentley, 2009; Daan, 2011; van der Veen and Gerkema, 2017; Vanin et al., 2012). Consequently, investigations into biological rhythms in natural environments necessitate common research among multiple disciplines (e.g., biology, geology) in order to understand and explore biological clocks and how they are influenced by abiotic factors in natural ecosystems. The research described herein focuses on the role of abiotic in situ factors, such as variations in the magnetic field and weather processes, that might influence the organism’s behavior.
Social insects, including ants, show social synchronization and complex forms of timed behavior and organization within their colonies. Such synchronization appears to improve coordination among individuals for social integration (Bloch, 2009). “Around the clock” activities have been observed within nests for worker ants involved in brood care (Bloch, Barnes, et al., 2013). In contrast, pronounced diurnal rhythms and well-defined nocturnal periods of sleep were found for foragers outside the nest (Bloch, Hazan, et al., 2013). Further, the mating activities of males and females are coordinated by the timing of nuptial flights to a species-specific time of day, which facilitates reproductive isolation between species that inhabit the same region (Bloch, 2009; Hölldobler and Wilson, 1990). It has been assumed that task-specific variability in the diurnal rhythms of social insects is adaptive because it improves specialization and colony efficiency (Bloch, 2009). Ant queens show a reversible rhythmicity that switches between activities with or without circadian rhythms according to their reproductive status (Bloch, 2009; Eban-Rothschild and Bloch, 2012). Virgin queens adapt to a 24-h rhythmicity, whereas the locomotor activity of mated queens is arrhythmic during the egg-laying period and rhythmically robust afterwards (Sharma et al., 2004); this implies that ant queens have circadian clocks that are adaptive and exhibit specific patterns of activity that may be influenced by their physiological state or their tasks in the colony.
Until now, chronobiology investigations of red wood-ants (RWA), including circadian rhythms of isolated individual workers, foragers, or queens and males of several species of the Formica rufa-group, have been studied mostly in laboratory experiments under standardized artificial LD conditions (Table 1). Laboratory studies with isolated individuals have shown that circadian rhythms are predominantly entrained by light (Fuchikawa et al., 2016) and that periodicity in worker activity depends on temperature or luminosity cycle (Rosengren, 1977; Rosengren and Fortelius, 1986). The mean period of the free-running rhythm of isolated workers (of F. rufa) was 22.5 (0.45) h for ants placed in constant darkness (DD) and 24.5 (0.33) h for ants placed in constant light (LL), and these ants could be readily entrained by a LD cycle (North, 1987; North, 1993). However, synchronization of the circadian rhythms was not observed, and this varied considerably among individuals (Nowinszky et al., 1979; Nowinszky, 2004).
Literature review on circadian rhythms analysis in red wood-ants (Formica rufa-group).
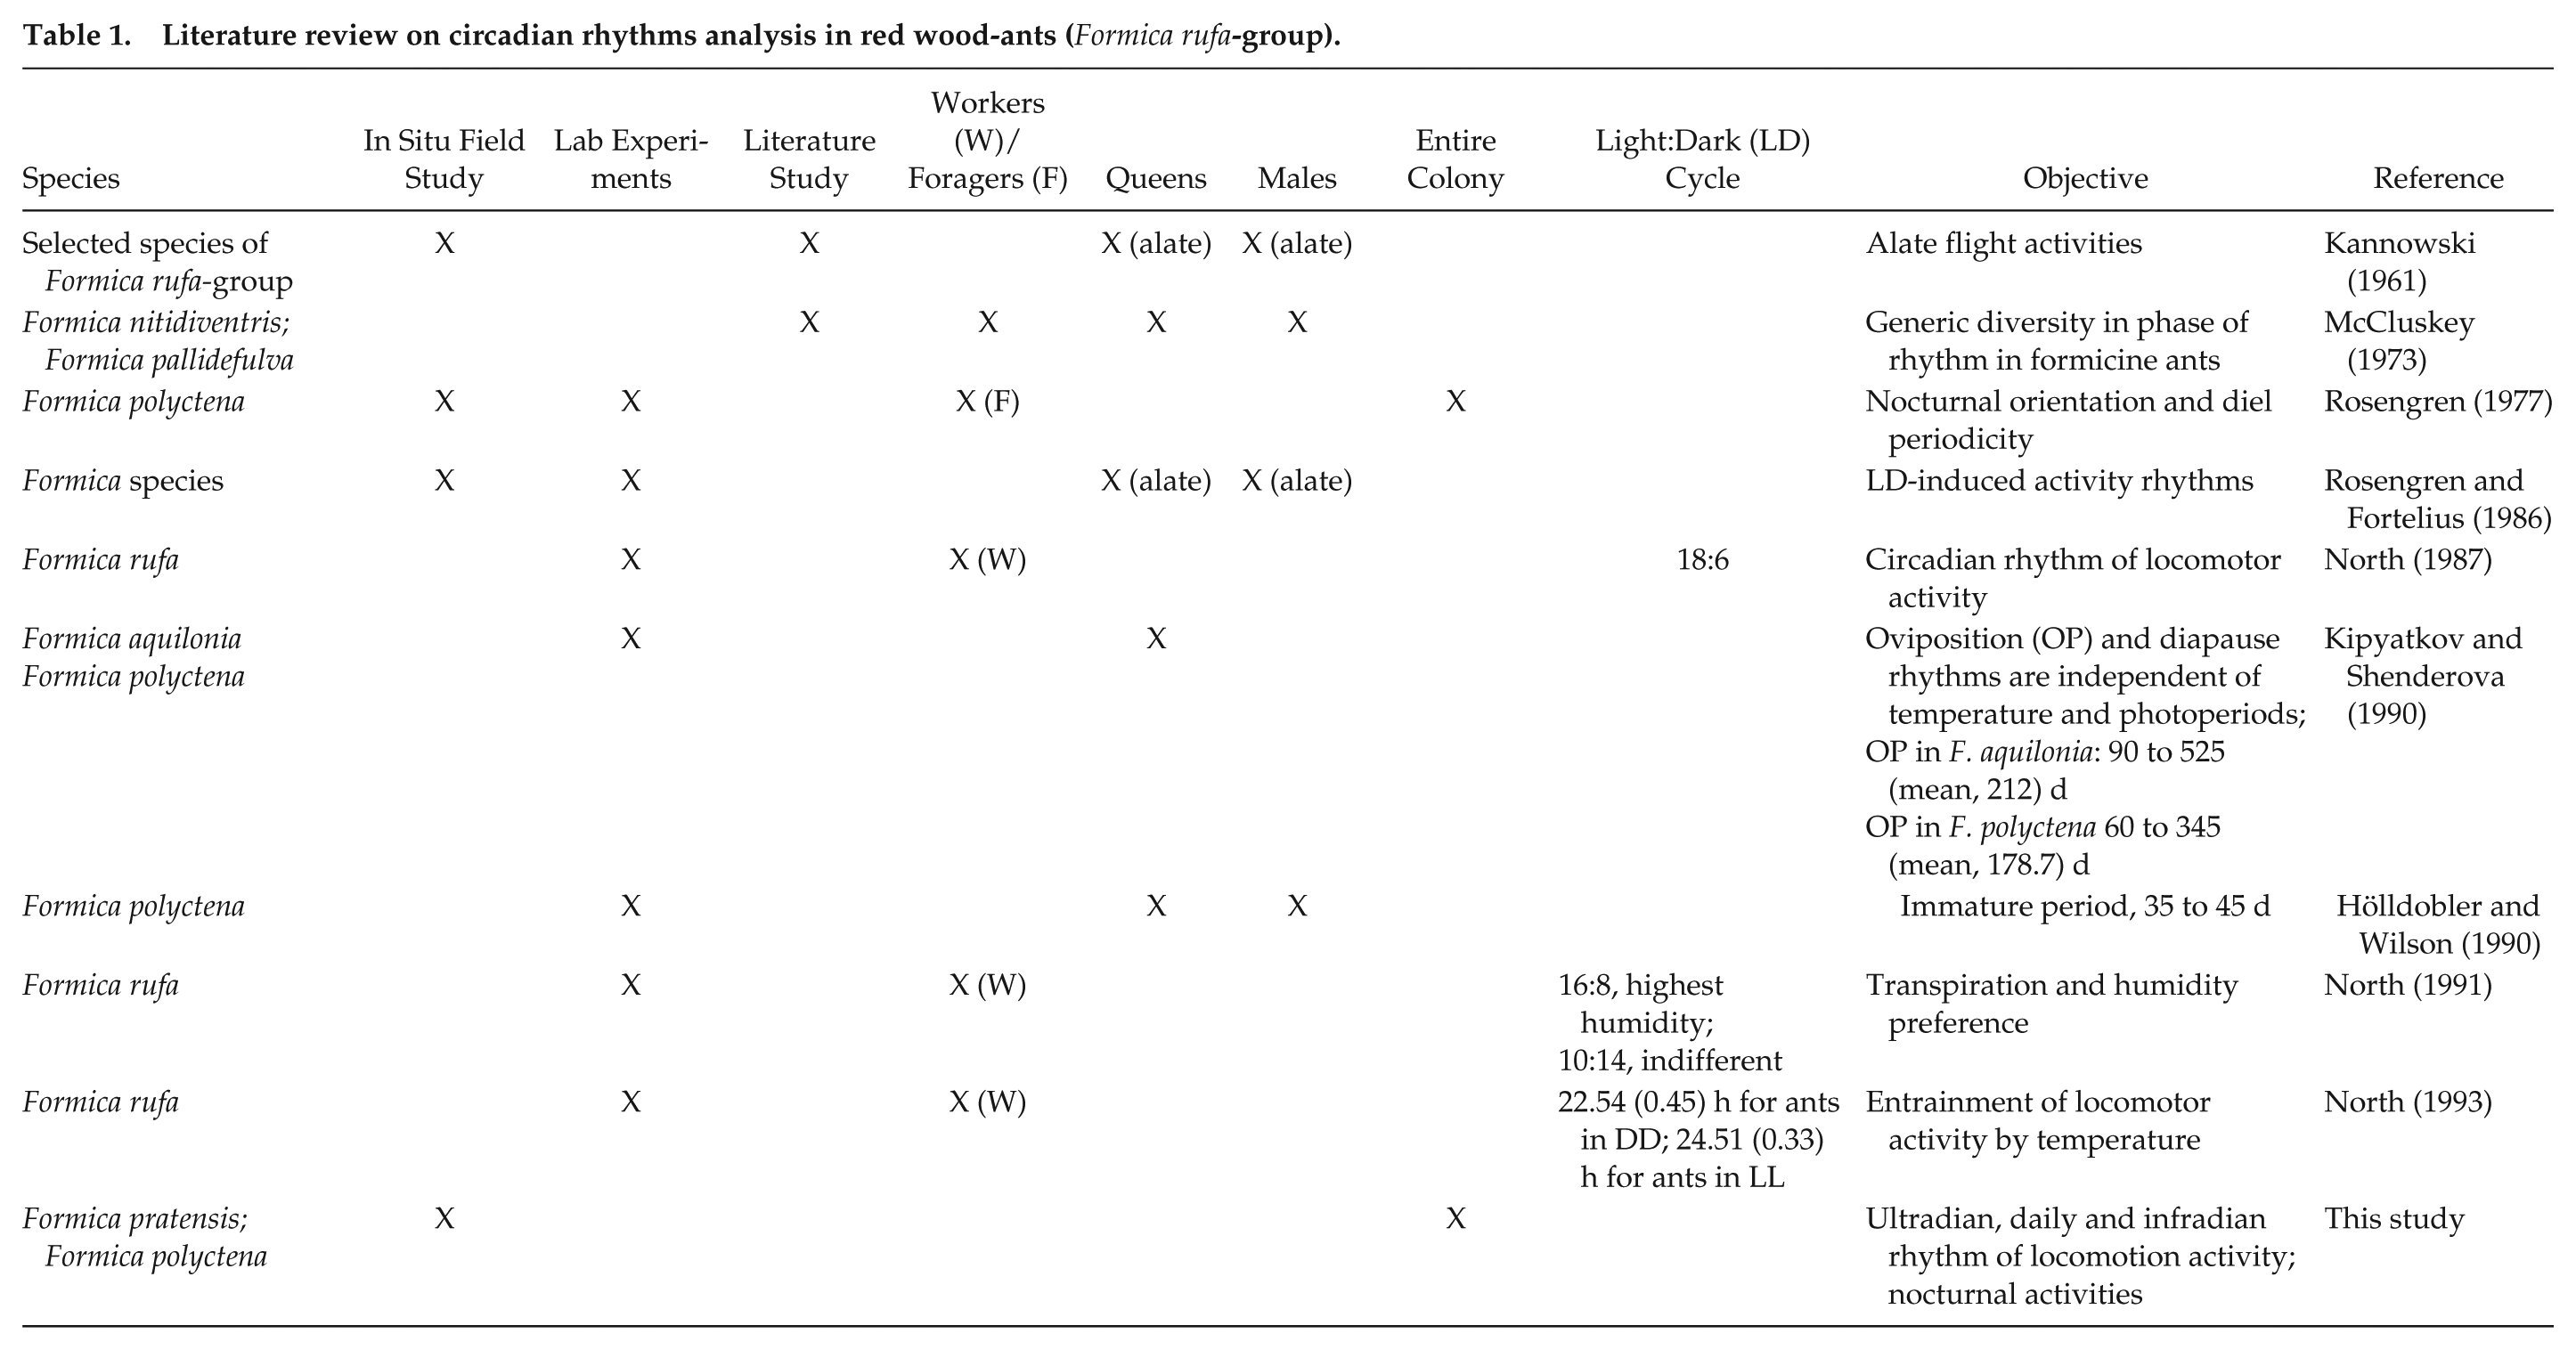
Chronobiological field studies of RWA are rare, especially ones investigating entire colonies (Rosengren, 1977; Table 1). Our results to date of long-term in situ behavioral field studies— combining geology, geophysics, ecology, and entomology—have shown that 2 RWA species, F. pratensis and F. polyctena, have well-identifiable daily and bimodal standard daily routines (M-shaped curves) that depend on seasons and weather conditions (Berberich et al., 2013).
Some major questions still remain unanswered: 1) Is there a co-expression of ultradian, diel, and infradian rhythms in an entire colony monitored in situ under natural LD conditions? 2) Are there differences in rhythms between F. pratensis and F. polyctena? 3) Is there a difference in monthly rhythms? 4) Are astronomical and civil twilight functionally significant for activities and do they influence activity patterns? and 5) What new information can be gained by investigating locomotor activities? To understand in situ activities under natural LD conditions, we continually studied long-term the activity patterns of entire colonies of these 2 species in situ using 4 nests (Nest 1 [N1]: F. pratensis; Nests 2 to 4 [N2, N3, N4]: F. polyctena) with a focus on abiotic factors, including variations in the Earth’s magnetic field (e.g., declination, horizontal variation, vertical intensity and total intensity) and weather. These in situ field studies were performed for a period of 6 months (April to September) in 2010, 2011, 2012 and 2016, encompassing approximately 15,600 recorded h (approx. 650 d) of video streams. Spring-to-autumn records were automatically evaluated by applying our previously published image evaluation routine, which is based on a difference-image (every 10 sec) technique to obtain an objective interpretation of ant behavior. This is then used to compare directly the activity patterns of these 2 species (Berberich et al., 2013).
Methods
Red Wood-Ant Nests and In Situ Continuous Monitoring of Activity Patterns
The 4 RWA nests were located approximately 22 km apart in Weibern (Nest 1; N50.40687 E7.14578; 441 m a.s.l.) and at the Goloring site (Nests 2-4; N50.33976 E7.43955; 318 m a.s.l.). Both study areas were situated west of the Rhine River in the Quaternary East Eifel Volcanic field (EEVF; western Germany). Nest 1 (F. pratensis; sunlit, height: 0.90 m; diameter: 1.20 m; monitoring period 04-09/2010 and 2011) was located in a private garden at Weibern. Nest 2 (F. polyctena; partly sunlit, height: 0.50 m; diameter: 0.80 m; monitoring period 04-09/2010, Nest 3 (F. polyctena; partly sunlit, height: 0.50 m; diameter: 1.00 m; monitoring period 04-09/2012) and Nest 4 (F. polyctena; partly sunlit, height: 0.70 m; diameter: 2.20 m; monitored within the research project “GeoBio-Interactions” from 04-09/2016) were located at the Goloring site, an Iron-aged henge sanctuary (GDKE, 2018). In the past, the main selection criteria for the chosen RWA nests had been a seismically active area with degassing faults (Berberich et al., 2013; Berberich, et al. 2018a; 2018b). For this reason, these 4 nests were the appropriate choices for studying ant activity patterns. During our monitoring periods, long-term in situ data were acquired during field campaigns in which we also studied degassing of geogenic gases (He, Rn, CO2, CH4) and tectonic processes associated with RWA nests in 2010, 2011, 2012 and 2016 (Berberich et al., 2013; 2018a; 2018b). Here, we use these long-term data and associated video footage of RWA colonies to assess ant activity and the possible influences of abiotic geophysical and meteorological processes.
Ant activity was continuously monitored using high-resolution camera systems (“AntCams”; Mobotix MX-M12D-Sec-DNight-D135N135; 1,280 × 960 pixels), installed approximately 5 m from the nests. During the monitoring periods, ant activities on top of the nest were recorded at 12 Hz and continuously time-stamped. Monitoring and automatic evaluation of ant activities was used to ensure an objective interpretation of ant behavior, using the approach developed by Berberich et al. (2013). This approach is not based on manually performed counts of single ants on top of the nest but rather applies image difference analysis techniques based on pixel differences. Berberich et al. (2018a) extended the system of Berberich et al. (2013) to compensate for slight camera movements or differences between day and night sensors. The network-compatible AntCam was connected to a network-attached storage (NAS) system and a computer to allow for the on-site evaluation of RWA activities in real time using C++ code to accelerate image evaluation (Berberich et al., 2018a). A total of 15,600 recorded h (≈650 d) of video streams were evaluated.
Data Analysis of Video Streams
We first centered and scaled the data by subtracting the mean during the target time and dividing it by the SD. Because the average ant activity produces a large peak in the origin of the amplitude spectrum, this zero frequency component would shadow low frequency components due to the main lobe of the window function and was thus removed. A median filter (width 30) was then applied to the automatically evaluated raw data. Then, the data-set was chunked into 5-min data blocks and analyzed for periodicities by applying a modified Fast Fourier Transform (FFT) using Matlab 2017a (www.mathworks.com). Because the observation interval corresponds to an infinite signal multiplied by a rectangular window, the amplitude spectrum of the signal itself is strongly influenced by the Fourier transform of the window. Consequently, we applied a Blackman window (Oppenheim et al., 1999) to suppress the side lobes of the rectangular window. The approach of Chiu (1989) with an alpha level = 0.05 was used to test for the significance of periodic components in the FFT analysis.
Locomotion Activity Plots
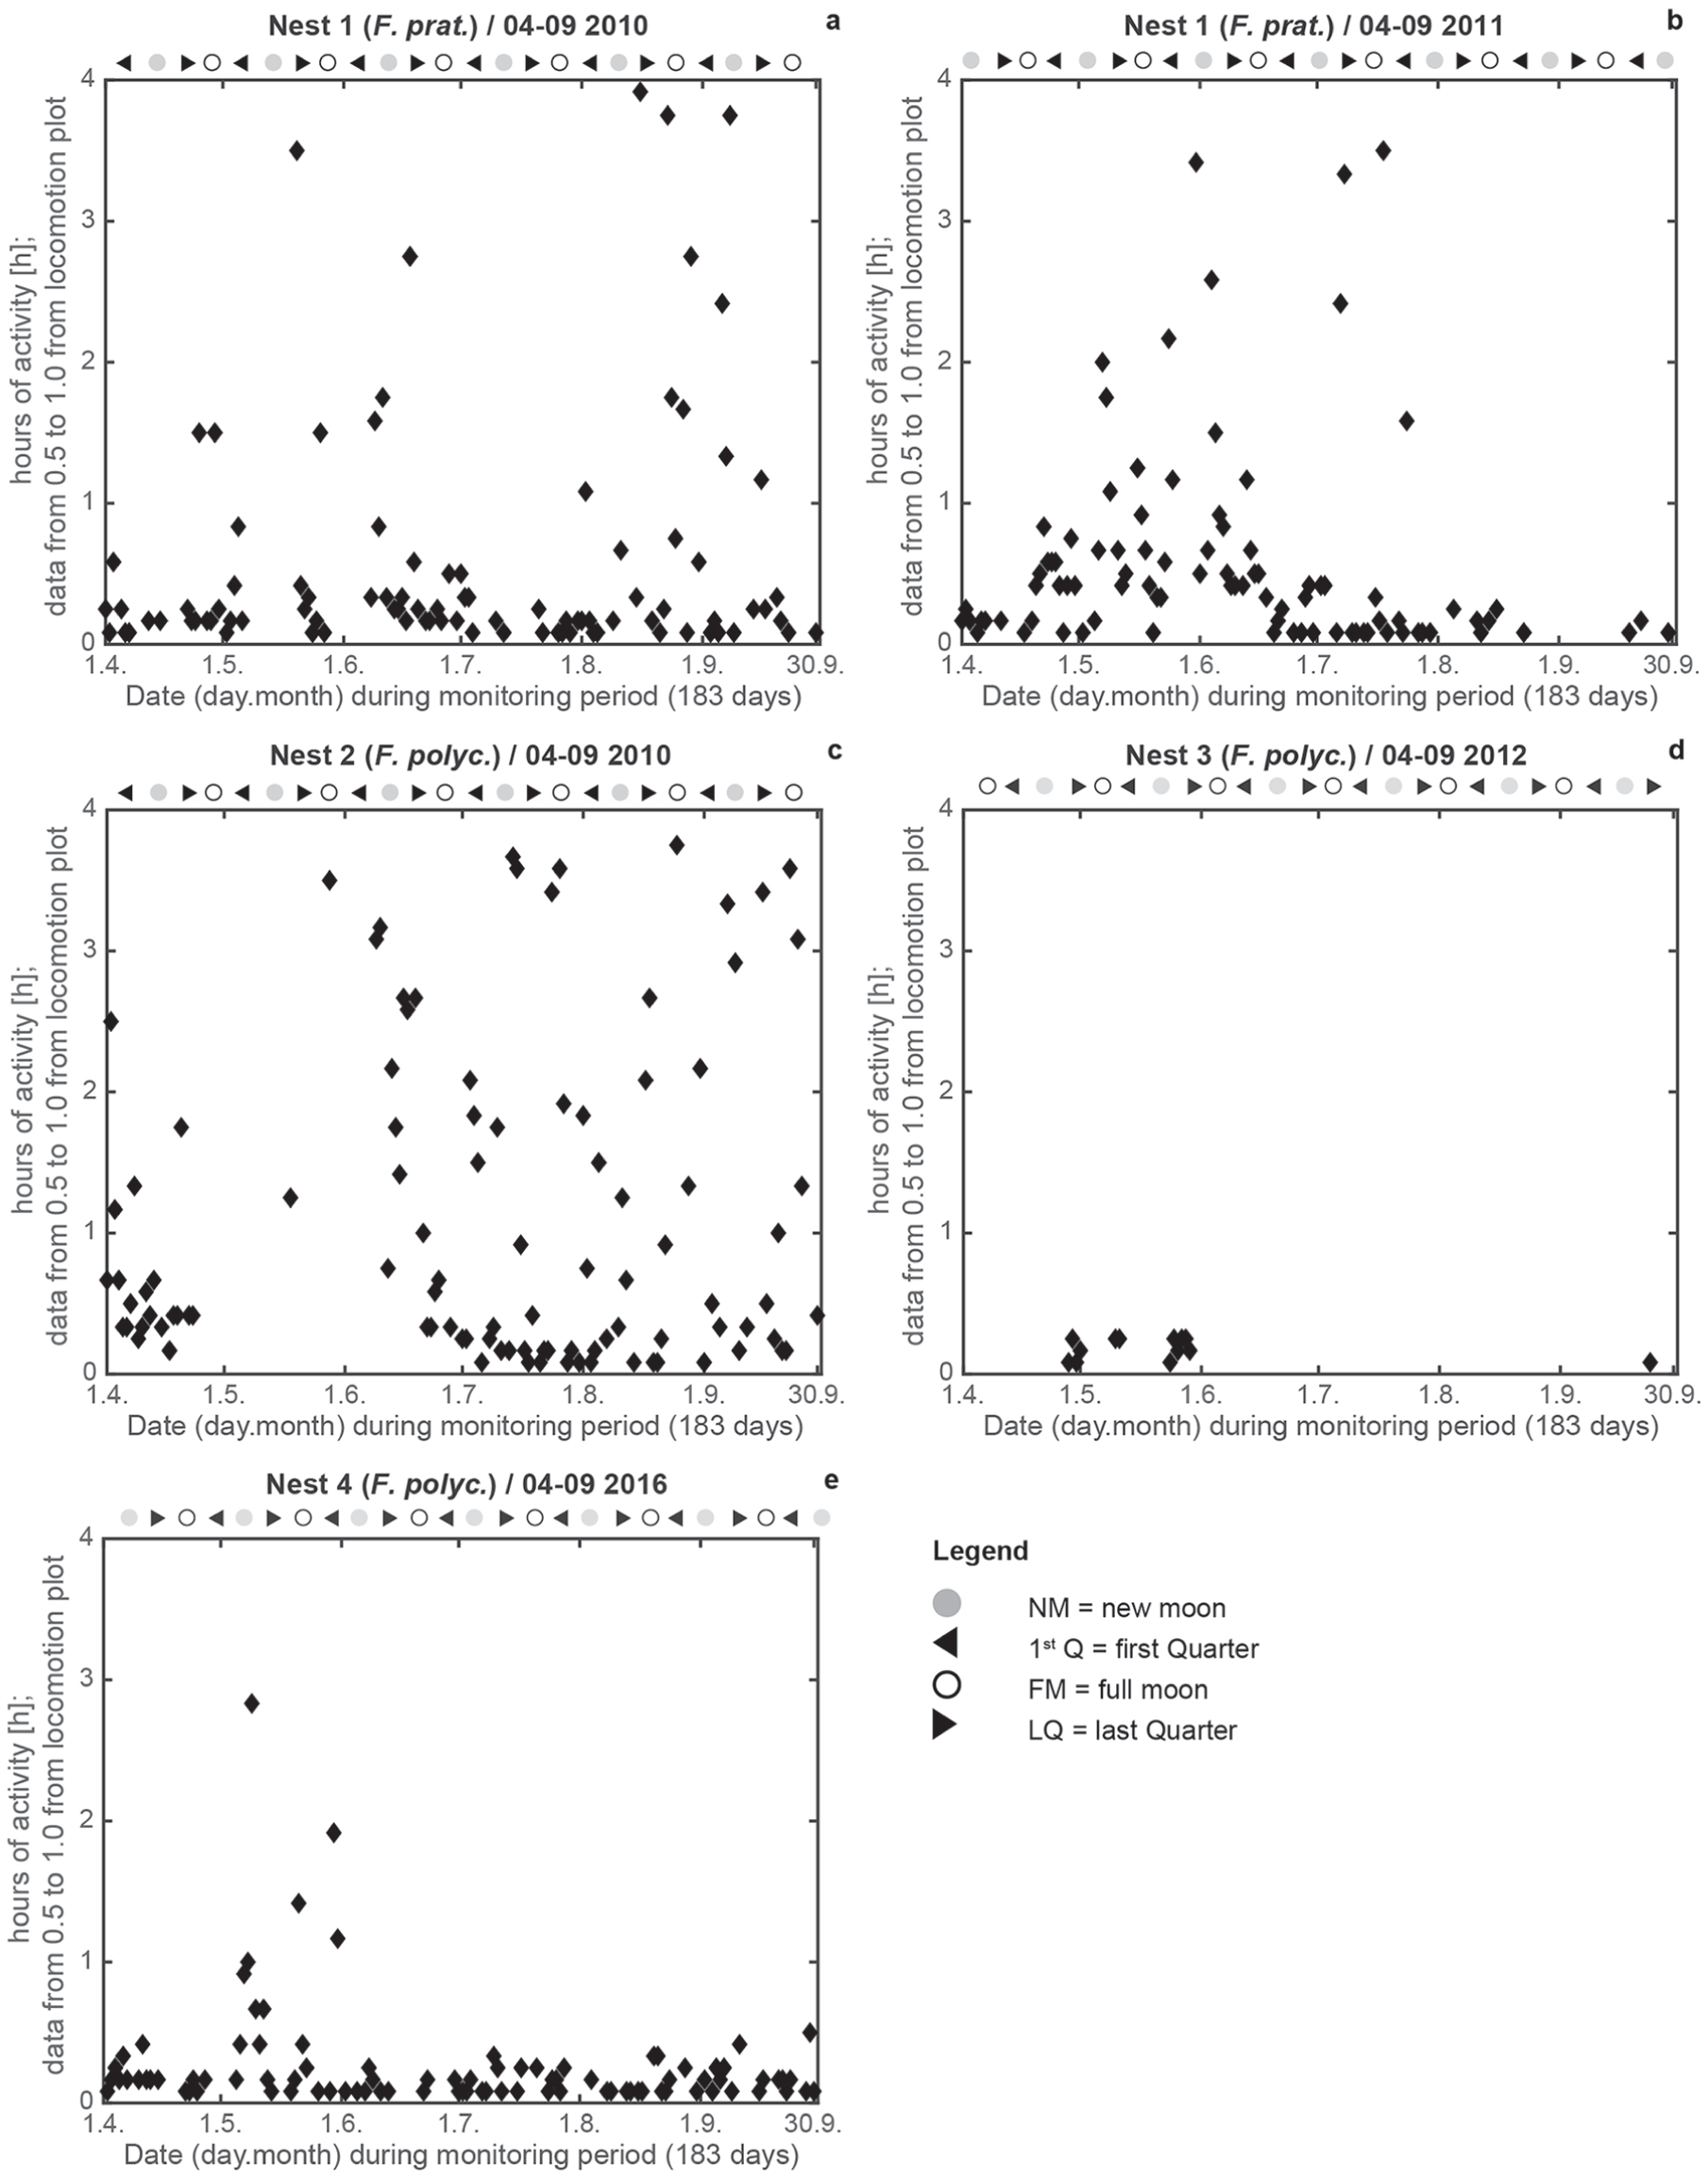
For the locomotion activity plots, the 5-min, median-filtered data blocks (288 single data per day; 183 d per monitoring period from 1 April to 30 September; in total, maximum of 212,544 data per investigated year) were normalized to range from 0 (no activity of ants on top of the nest) to 1 (maximum activity of ants on top of the nest) to ensure comparable data among all monitored years and nests. Data are graphically displayed using the contour plot function of Matlab2017a. The x-axis of each plot spans the entire monitoring period and the y-axis shows the time [UTC] from 0000 h to 2400 h. To distinguish between unimodality and bimodality in the locomotion activity plots, we applied Hartigan’s dip statistic (HDS) test (Hartigan and Hartigan, 1985; Mechler, 2002). HDS values ranged from 0 to 1, indicating significant bimodality at values <0.05 and bimodality with marginal significance at values between 0.05 and 0.10 (Freeman and Dale, 2012). To detect crepuscular and nocturnal activities between the start and end of civil and astronomical twilight for both ant species, even at low levels, and to obtain comparable results for all 4 nests, y-axis values between 0.5 and 1.0 were taken from the locomotion plots of Figure 3. To investigate the relation of crepuscular and nocturnal activities to the 4 moon phases (1st Q =1st Quarter, FM = Full moon, LQ = Last Quarter, NM = New Moon), we set a range of 3 d before and after the peak date of each moon phase (in total 7 d). We then summed the activity hours during these 7 d for each moon phase and each nest. A ±1 SD (±1σ) boundary was then applied to identify meaningful values.
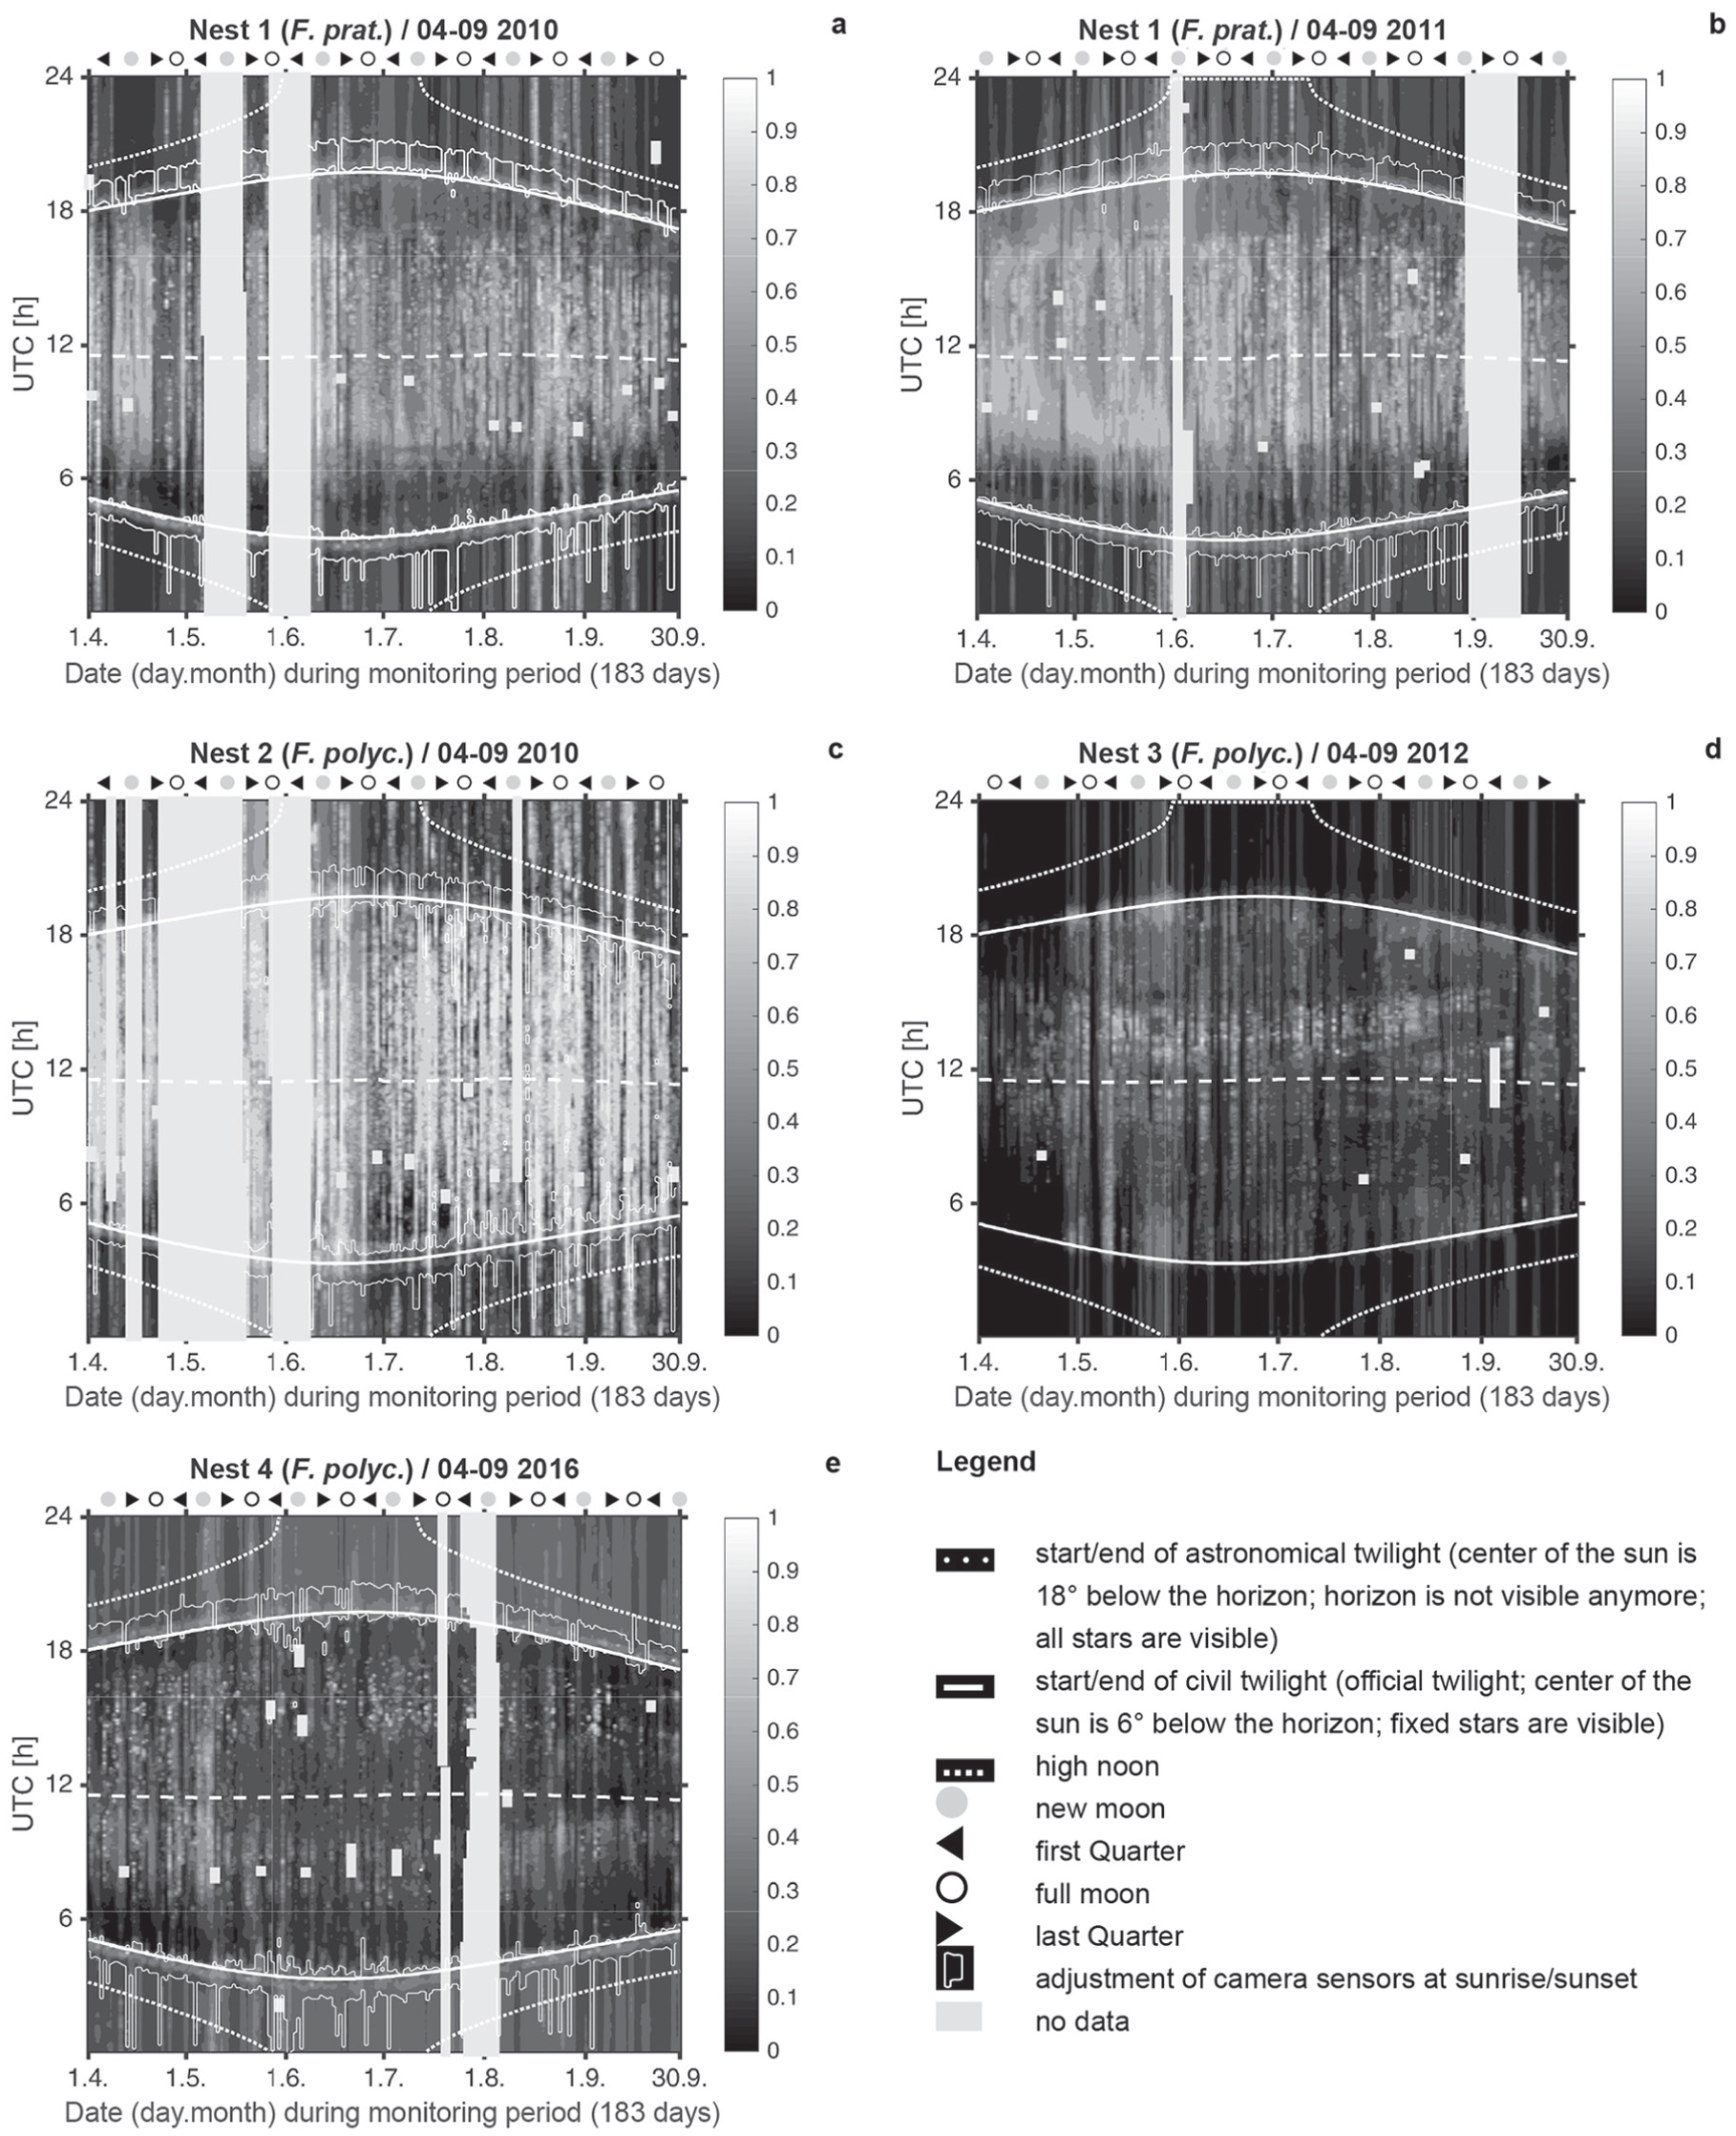
Plots of locomotion activity in N1 (a, b), N2 (c), N3 (d) and N4 (e) for April to September in 2010, 2011, 2012, and 2016. White dotted lines mark the start and end of astronomical twilight; white solid line shows the start and end of civil twilight; white dashed line indicates high noon; thin white line marks the adjustment of camera sensors. The phases of the moon are shown. High ant activities are colored in light white/white, with lower activities in dark gray/black colors. Time display in UTC (local time: UTC + 2 h); x-axis: monitoring period (183 d from April 1 to September 30).
Data for the astronomical and civil twilight for Kobern-Gondorf and Weibern (https://galupki.de/kalender/sunmoon.php), high-noon (www.timeanddate.de/sonne) and moon-phases (http://aa.usno.navy.mil) also are noted on the plots; the time of the internal switch between the infrared (night) and color (day) sensors was recorded and is also plotted. Meteorological data (temperature [°C], humidity [%], atmospheric pressure [hpa], and rainfall [mm]) were recorded by a local in situ meteorological station in 2016, chunked to 10-min data blocks, and analyzed using a modified FFT. Variations in the magnetic field (declination [D], horizontal intensity [H], and vertical intensity [Z] and independent scalar measurements of total intensity [F]) were recorded by the Adolf-Schmidt-Observatory for Geomagnetism of GFZ German Research Centre For Geosciences, Niemegk (Matzka, 2016; GFZ, 2016; http://www.gfz-potsdam.de/sektion/erdmagnetfeld/daten-produkte-dienste/daten-und-berichte/minutenmittelwerte-ngk). Data are the best available data according to the INTERMAGNET classifications. For correlation analyses, we extracted the first 100 maximum amplitude values of RWA activities (N1–N4), the magnetic variation components (D, H, Z, F) and the meteorological parameters from the FFT analyses, and assigned the values to every full hour. We then calculated the maximum possible correlations. The significance of the correlation coefficient were interpreted according to the method of Hinkle et al. (2009). Maximum activities between the start and end of civil twilight for both ant species were extracted from locomotion plots.
Data Availability
Data supporting the findings of this study are available from the Harvard Forest Data Archive (http://harvardforest.fas.harvard.edu/data-archive), dataset HF-312.
Results
Activity Patterns
The in situ activity patterns in the 4 nests of intact colonies of F. pratensis and F. polyctena were equivalently periodic, and exhibited diel, ultradian, and infradian rhythms under natural LD conditions.
Comprehensive Modified Fast Fourier Transform (FFT) Analyses
Comprehensive modified FFT analyses for the 6-month observation periods revealed similar and different periodicities for the 2 species, which is also confirmed by the highly positive correlation coefficient (r = 0.85) for N1 and N2 in 2010. Periods were categorized as ultradian (<20 h), daily (24 [4] h), semi-daily (≈12 h) or infradian (>28 h) (Mildner and Roces, 2017; Saunders, 2002). Because we monitored ants exposed to the field environment and exogenous processes such as natural light and dark periods and a temperature cycle within 24 h, we cannot discriminate between internally and externally generated daily rhythms. Therefore, we will use the expression “daily” rhythm instead of circadian and “semi-daily” instead of “semi-tidal”.
There were no differences between the 2 species in activity rhythms during the entire monitoring period of 183 d (Fig. 1a–e): the main peak was observed at 24 h/25 h (daily); a second lower peak at 12 h (semi-daily; ultradian). Significant ultradian peaks occurred at approximately 18 h and 19 h, respectively (≈18/19 h), and at 8, 6, 4, and 3 h, but with lower amplitudes. Noticeable short infradian periodicities were observed at 1.2, 1.6, 1.8, 2.0, 2.2, 2.9 d; and longer ones at 3.2 and 21.3 d. The maximum period observed was 1360 h (57 d) in 2010 (N1) and 816 h (34 d) in 2011 (N1), 2012 (N3), and 2016 (N4). Two peaks corresponding to long periods of 85 d were not significant from a signal processing perspective and were discarded from further analysis.
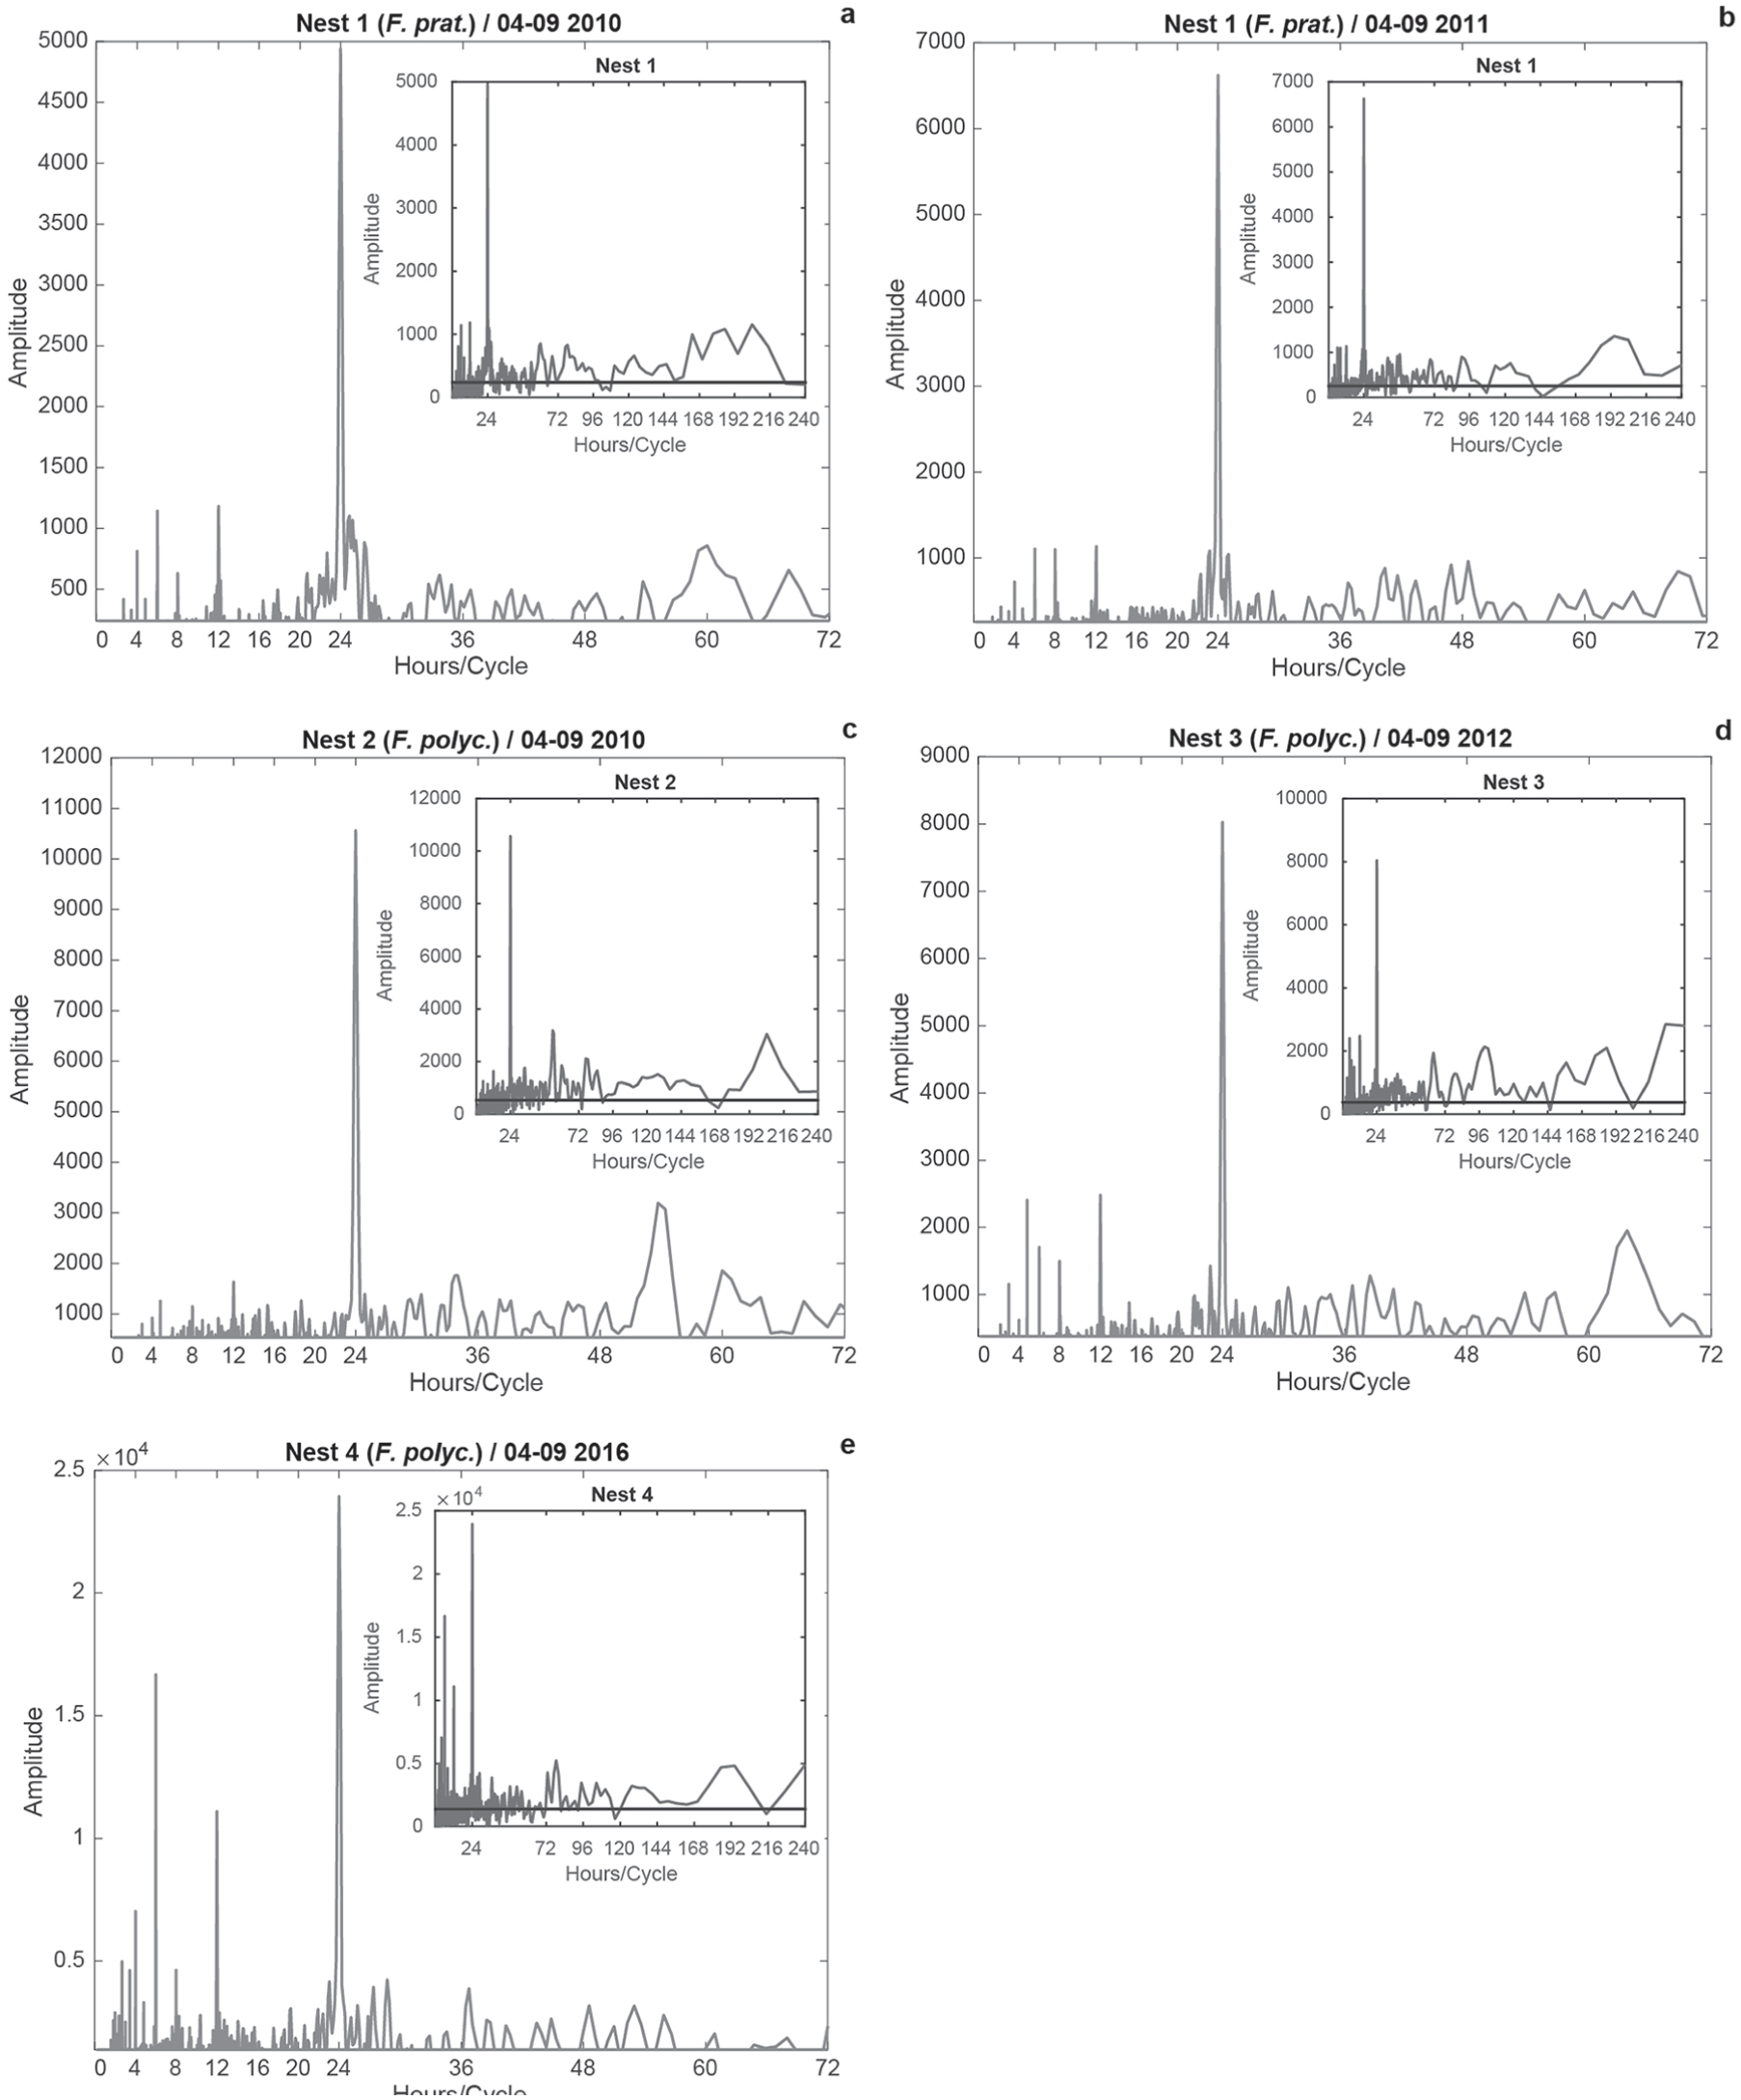
Results of the modified FFT for the 6-month monitoring periods for 2010 to 2016. Insets show FFT analyses for a maximum period of 240 h to better illustrate peaks of the infradian rhythms. The black line in the inserted periodograms indicates the 0.05 level of significance. The main figure shows all significant peaks above 0.05 significance. For all 4 nests, the main peaks were observed at 24 h (daily rhythm), 12 h (semi-daily rhythm) and ≈18/19 h, 8 h, 6 h, 4 h and 3 h (ultradian rhythm). Noticeable short infradian periodicities were observed between ≈1.2 and ≈2.9 d; longer ones at 3.2 and 21.3 d.
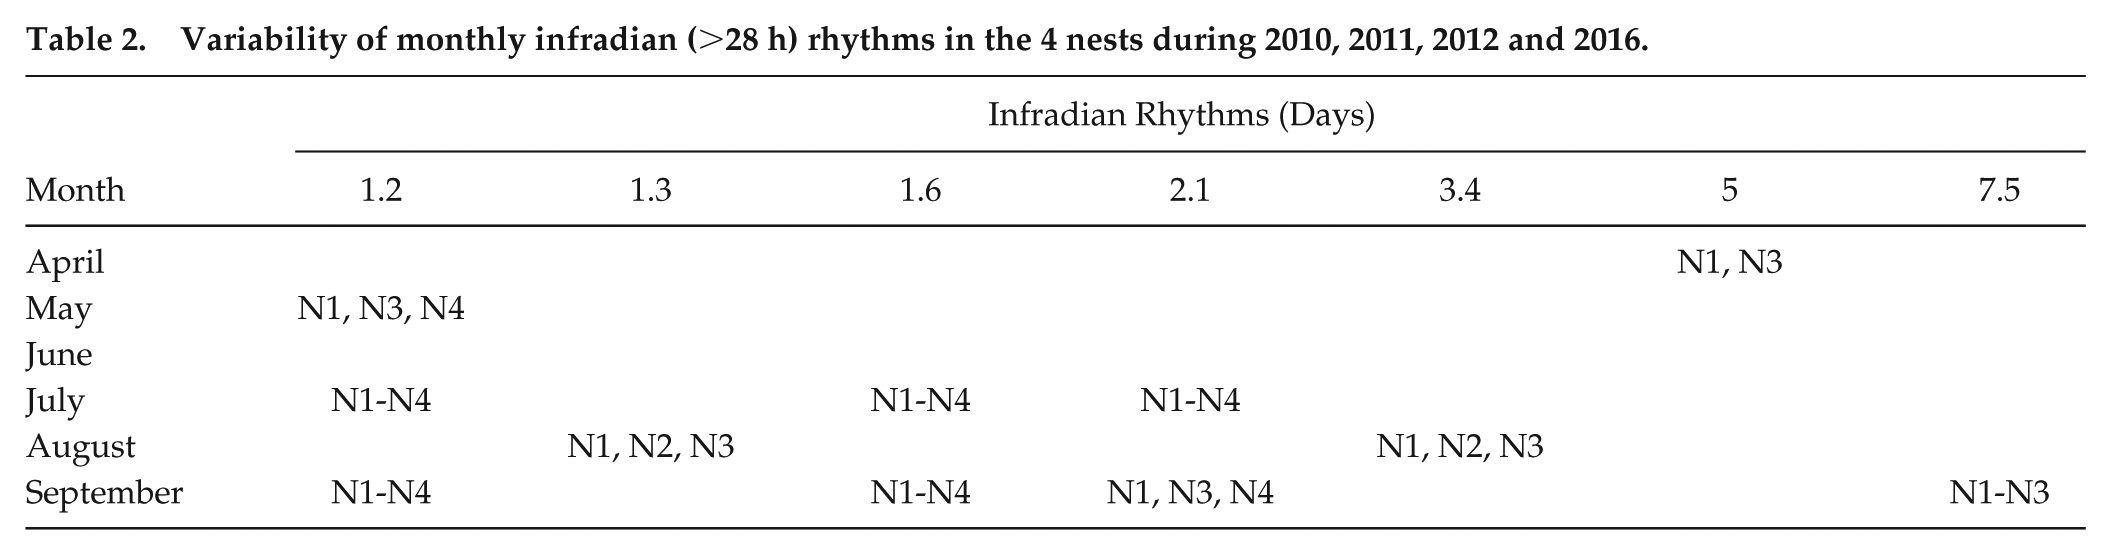
Analyses of monthly ant activity were similar to the 6-month analyses. Apart from equal ultradian, semi-daily, and daily rhythms (Fig. 2a–e), common infradian rhythms varied by month (Table 2). The maximum period observed was 372 h (15.5 d) in May 2016 (N4) and August 2012 (15 d; N3).
Variability of monthly infradian (>28 h) rhythms in the 4 nests during 2010, 2011, 2012 and 2016.
Additionally, monthly amplitudes varied in strength and between years (Fig. 2). The summer months (July, August and September) were not always the months with the highest activities. The highest amplitudes for N1 were observed in April, June, and September 2010 (Fig. 2a), and for N3 in April, May, and June 2012 (Fig. 2d). The most active months also differed within species in the different years: April and June (2010), and April and May (2011) for F. pratensis (N1; Fig. 2a, b). For F. polyctena, the most active months were July, August, and September (2010); April, May, and June (2012); and, July, August, and September (2016). A direct comparison of ant activities between N1 (F. pratensis) and N2 (F. polyctena) in 2010 showed that ant activity was similar for August and September, although the amplitude of N2 was higher than that in N1. The highest activity was observed in April (N1) and in July (N2). August amplitudes in 2011 (N1) and 2016 (N4) were only significant for the daily rhythm.
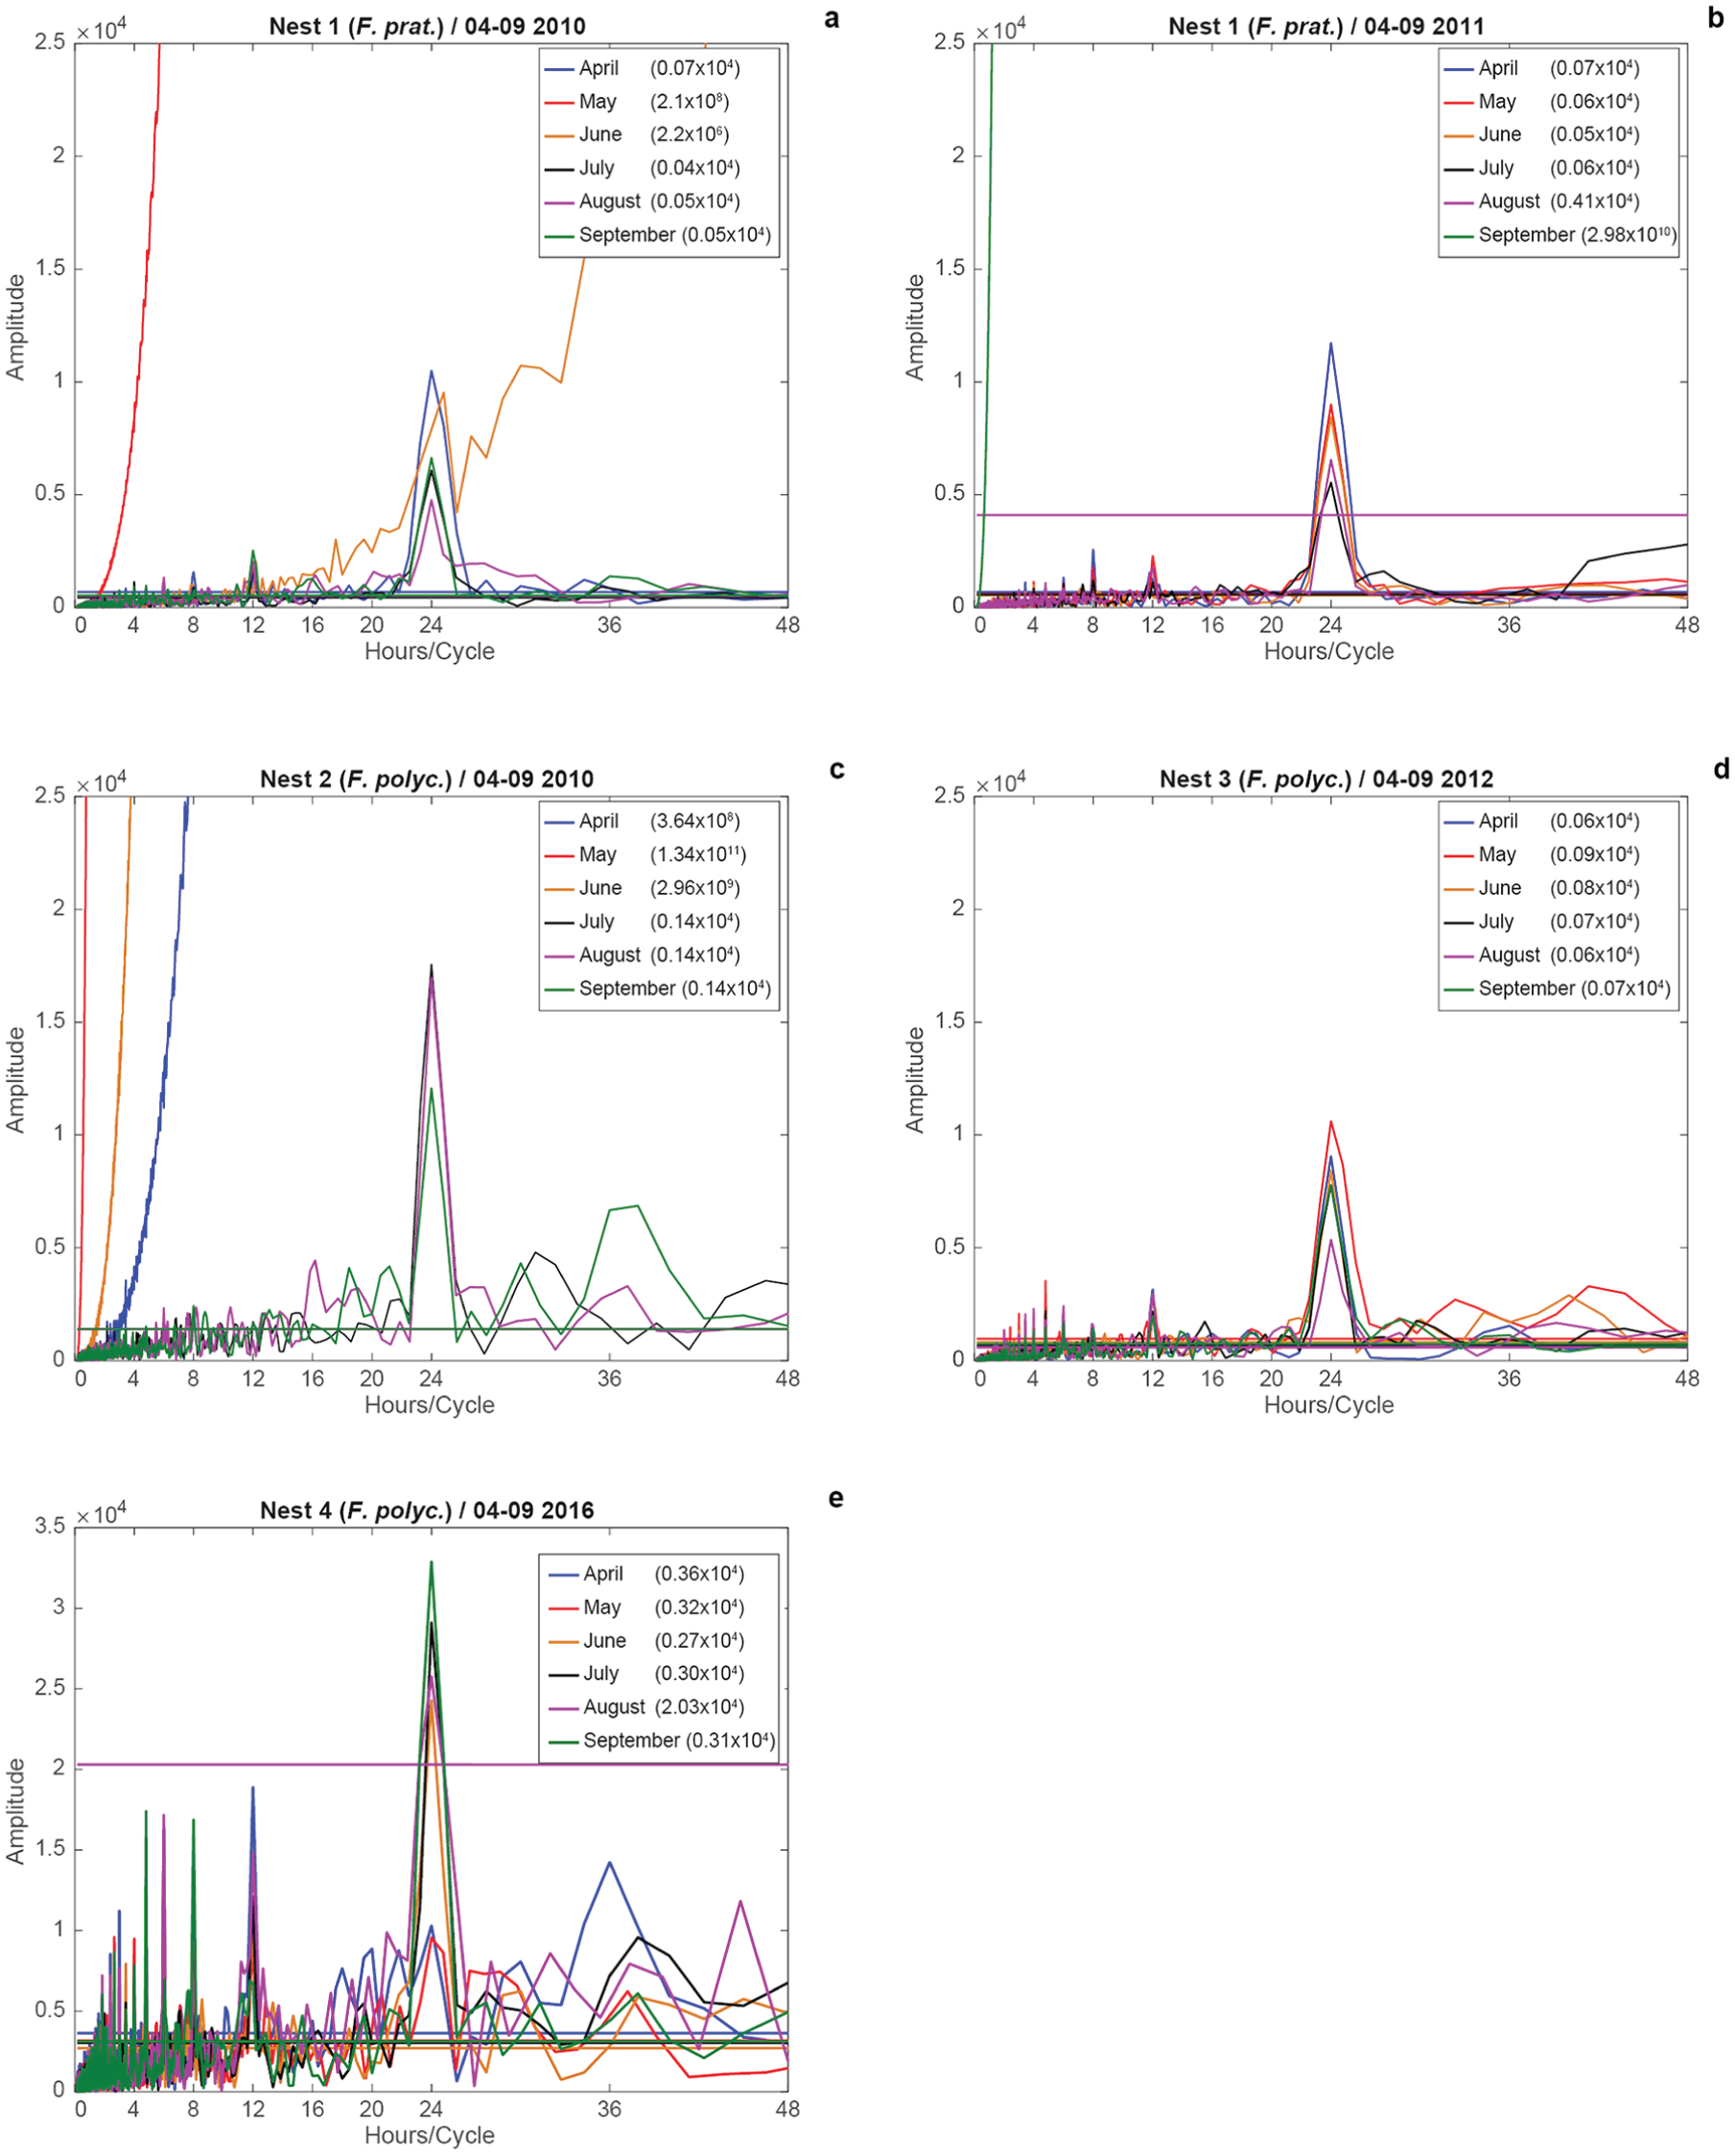
Results of the modified FFT for monthly activities in the 4 nests for April to September 2010, 2011, 2012, and 2016, and weather factors for 2016. The horizontal axis shows hours per cycle; the vertical axis describes the amplitude of the Fourier component. Some data were lost for May 2010 and September 2011 (Nest 1) and April to June 2010 (Nest 2). The colored lines in the periodograms indicates the 0.05 level of significance; their y-values are displayed in parentheses in the legend for emphasis.
Analysis of Locomotion Activity
Analysis of locomotion activity showed that the entire colonies of F. pratensis (Fig. 3a, b) and F. polyctena (Fig. 3c–e) exhibited mostly bimodal rhythms in ant activity for N1 to N4 during the monitoring periods (Table 3). Bimodality was lowest in 2012 and 2016 (Table 3); this was also shown in the locomotion plots (Fig. 3d, e). In 2012, the focus of locomotion activity in N2 was shifted to the afternoon for the entire monitoring period (Fig. 3 d); in 2016, the shift in locomotion activity in N4 started in the middle of May (Fig. 3e). Monthly values were also bimodally rhythmic for all nests and monitoring periods (Table 4). In 2010, the highest locomotion activities during the day were recorded in June and August for both species (N1, N2; Fig. 4a, c). In 2011, F. pratensis (N1) showed the highest activity in July (Fig. 4b). In 2012, F. polyctena (N3) had the highest activity from May to August, with a focus on afternoon hours (Fig. 4d), whereas the maximum ant activity in N4 was from April to May, with a strong decline for the rest of the year 2016 (Fig. 4e).
Results (%) of Hartigan’s dip statistic test for bimodality in the locomotion activity plots for N1 to N4 for the monitoring period of April to September 2010, 2011, 2012, and 2016.
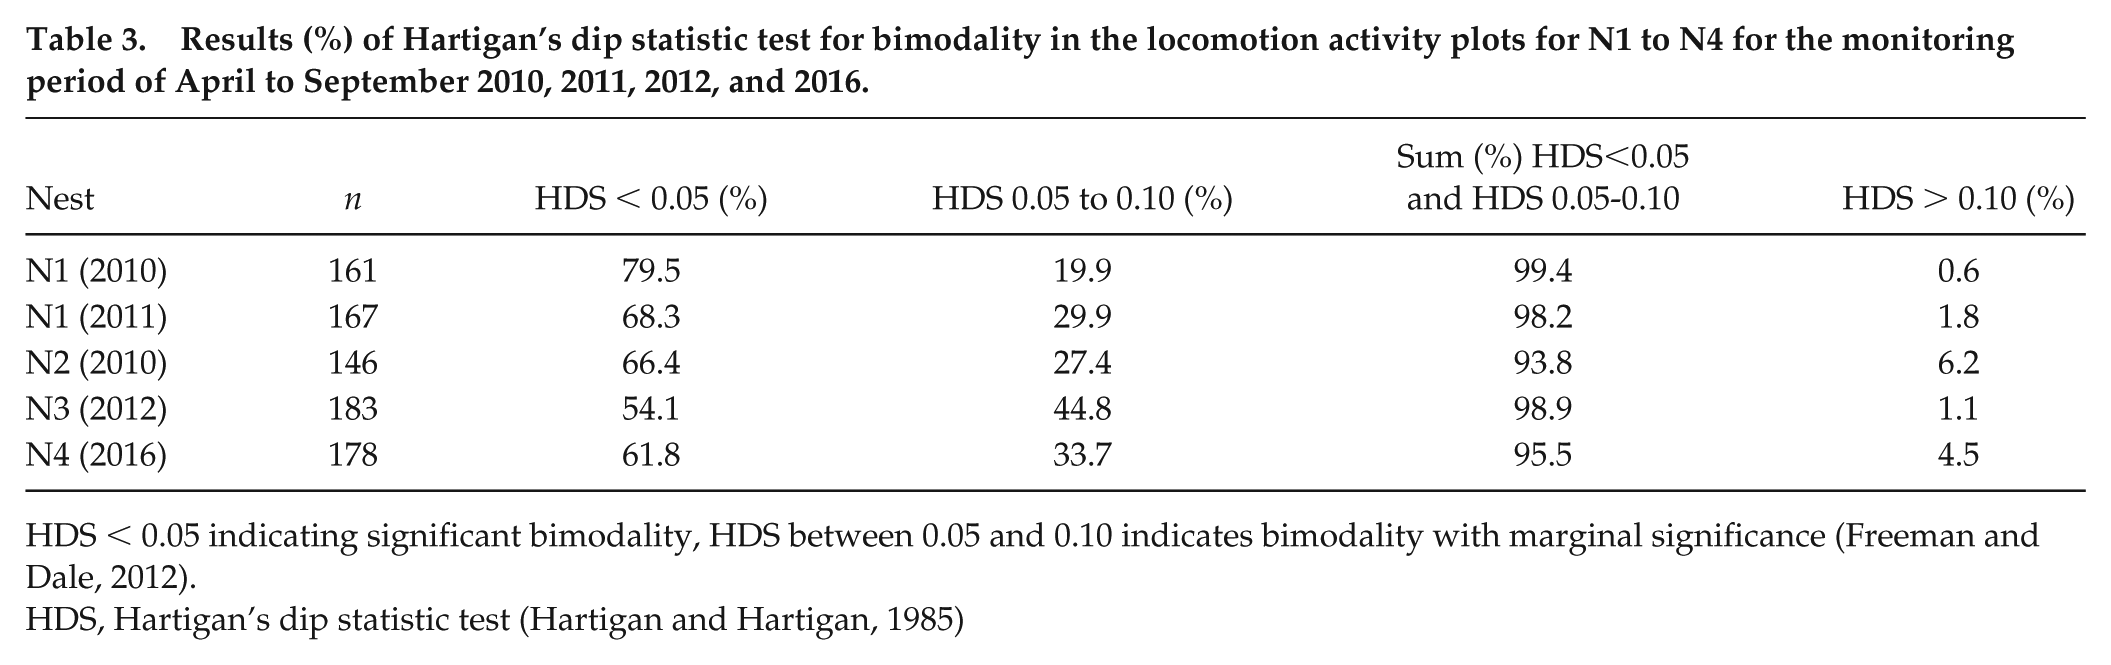
HDS < 0.05 indicating significant bimodality, HDS between 0.05 and 0.10 indicates bimodality with marginal significance (Freeman and Dale, 2012).
HDS, Hartigan’s dip statistic test (Hartigan and Hartigan, 1985)
Results (%) of Hartigan’s dip statistic test for monthly bimodality in the locomotion activity plots for N1 to N4 for the monitoring period of April to September 2010, 2011, 2012, and 2016.
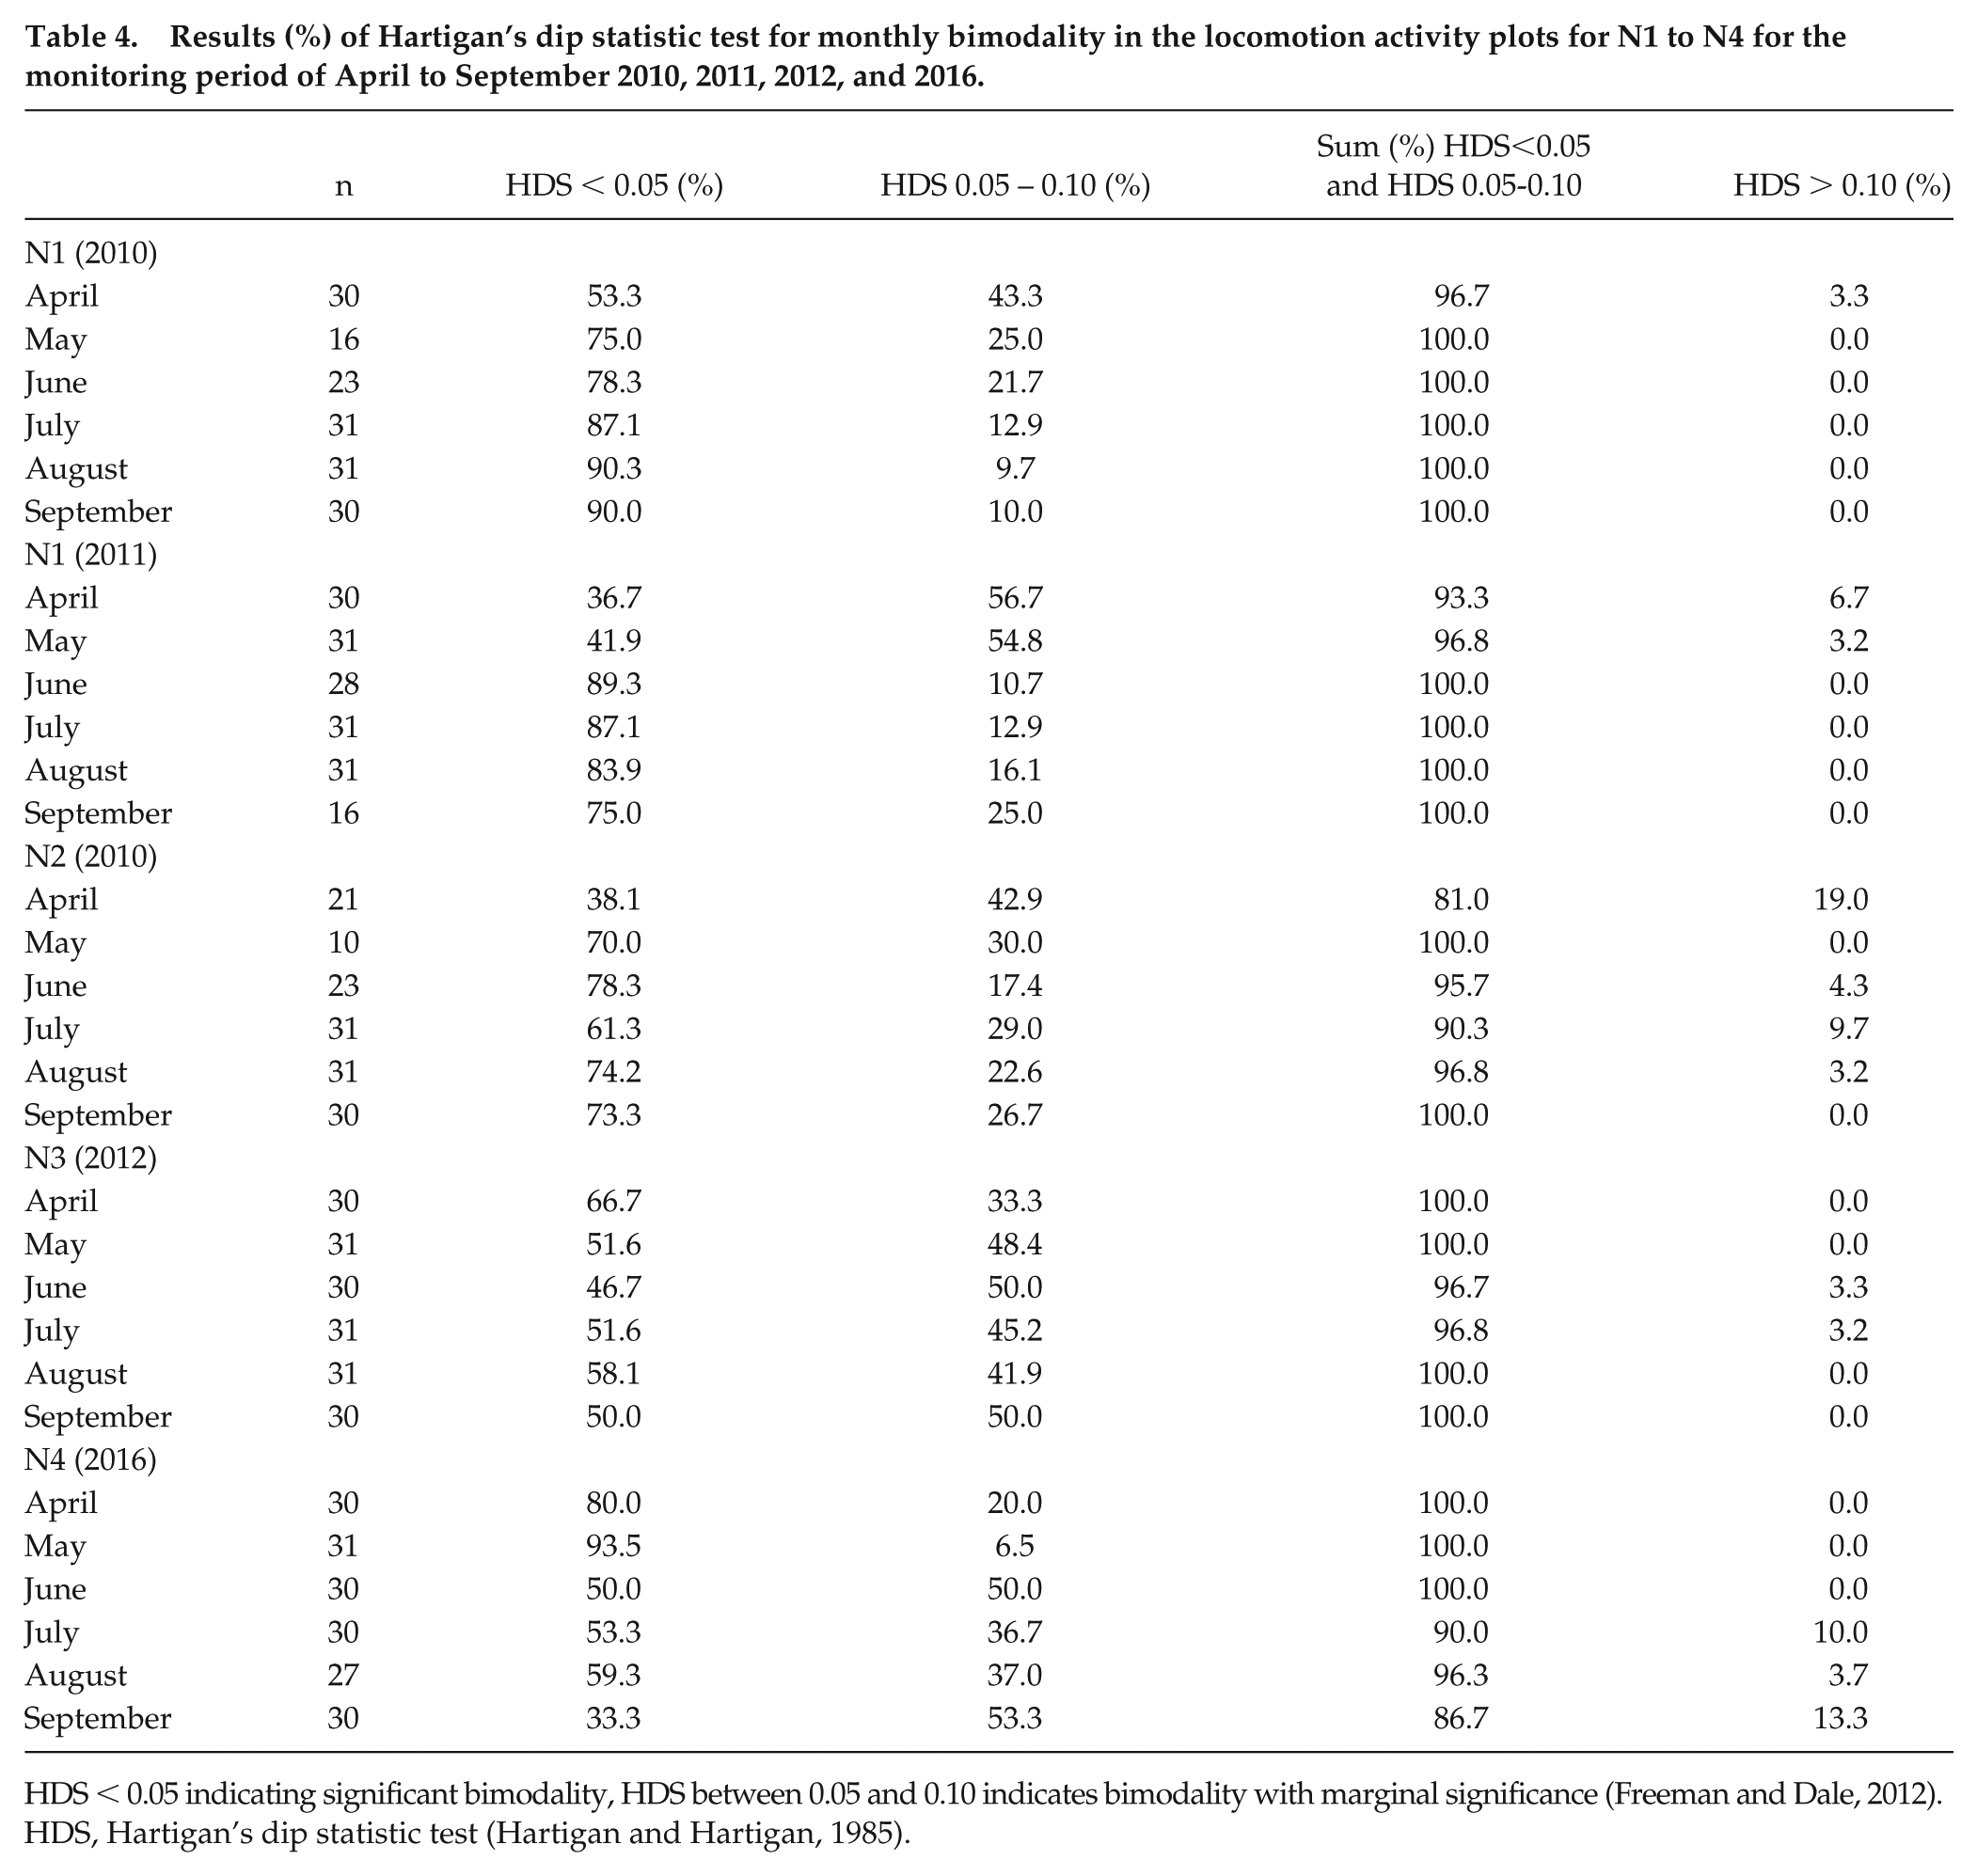
HDS < 0.05 indicating significant bimodality, HDS between 0.05 and 0.10 indicates bimodality with marginal significance (Freeman and Dale, 2012).
HDS, Hartigan’s dip statistic test (Hartigan and Hartigan, 1985).
During the twilight periods between the start and end of civil and astronomical twilight, crepuscular ant activity was observed in both species and varied between species and among years (Figs. 4 and 5). Maximum locomotion activity, up to 4-h, occurred in May and June in N1, N2, and N4 during the start and end of civil twilight (Fig. 4a-e). In 2010, the highest activities were recorded in August for both species (N1, N2; Fig. 4a, c). In 2011, F. pratensis (N1) showed the highest activity from May to July (Fig. 4b). In 2012 and 2016, F. polyctena (N3, N4) had the highest activity in May (Fig. 4d, e). Nocturnal ant activities up to 4-h were also observed in both species before the start and after the end of astronomical twilight during the darkest hours in spring and autumn (Fig. 5a-e). During civil twilight, May, August, and September were the most active months for all phases of the moon (Fig. 6a-d). From June to the middle of July (midnight twilight), high ant activities were observed at the new moon and first quarter (N1, N2; Fig. 6d). In 2010, during civil twilight, F. polyctena activities were 3.5-times as long during the new moon and its 1st Q (164 h) compared with F. pratensis (48 h) during civil twilight (Fig. 6a, d). The sum of nocturnal activities during the full moon and its last quarter were 3-times longer for F. polyctena (116 h vs. F. prat, 39 h) (Fig. 6b, c). In 2010, during astronomical twilight, August and September were the most active months for all phases of the moon (Fig. 6e-h).
Hours (h) of maximum activities (y-axis values within the range between 0.5 and 1.0 taken from the locomotion plots of Fig. 3) between the start and end of civil twilight for both ant species from April to September 2010, 2011, 2012, and 2016.
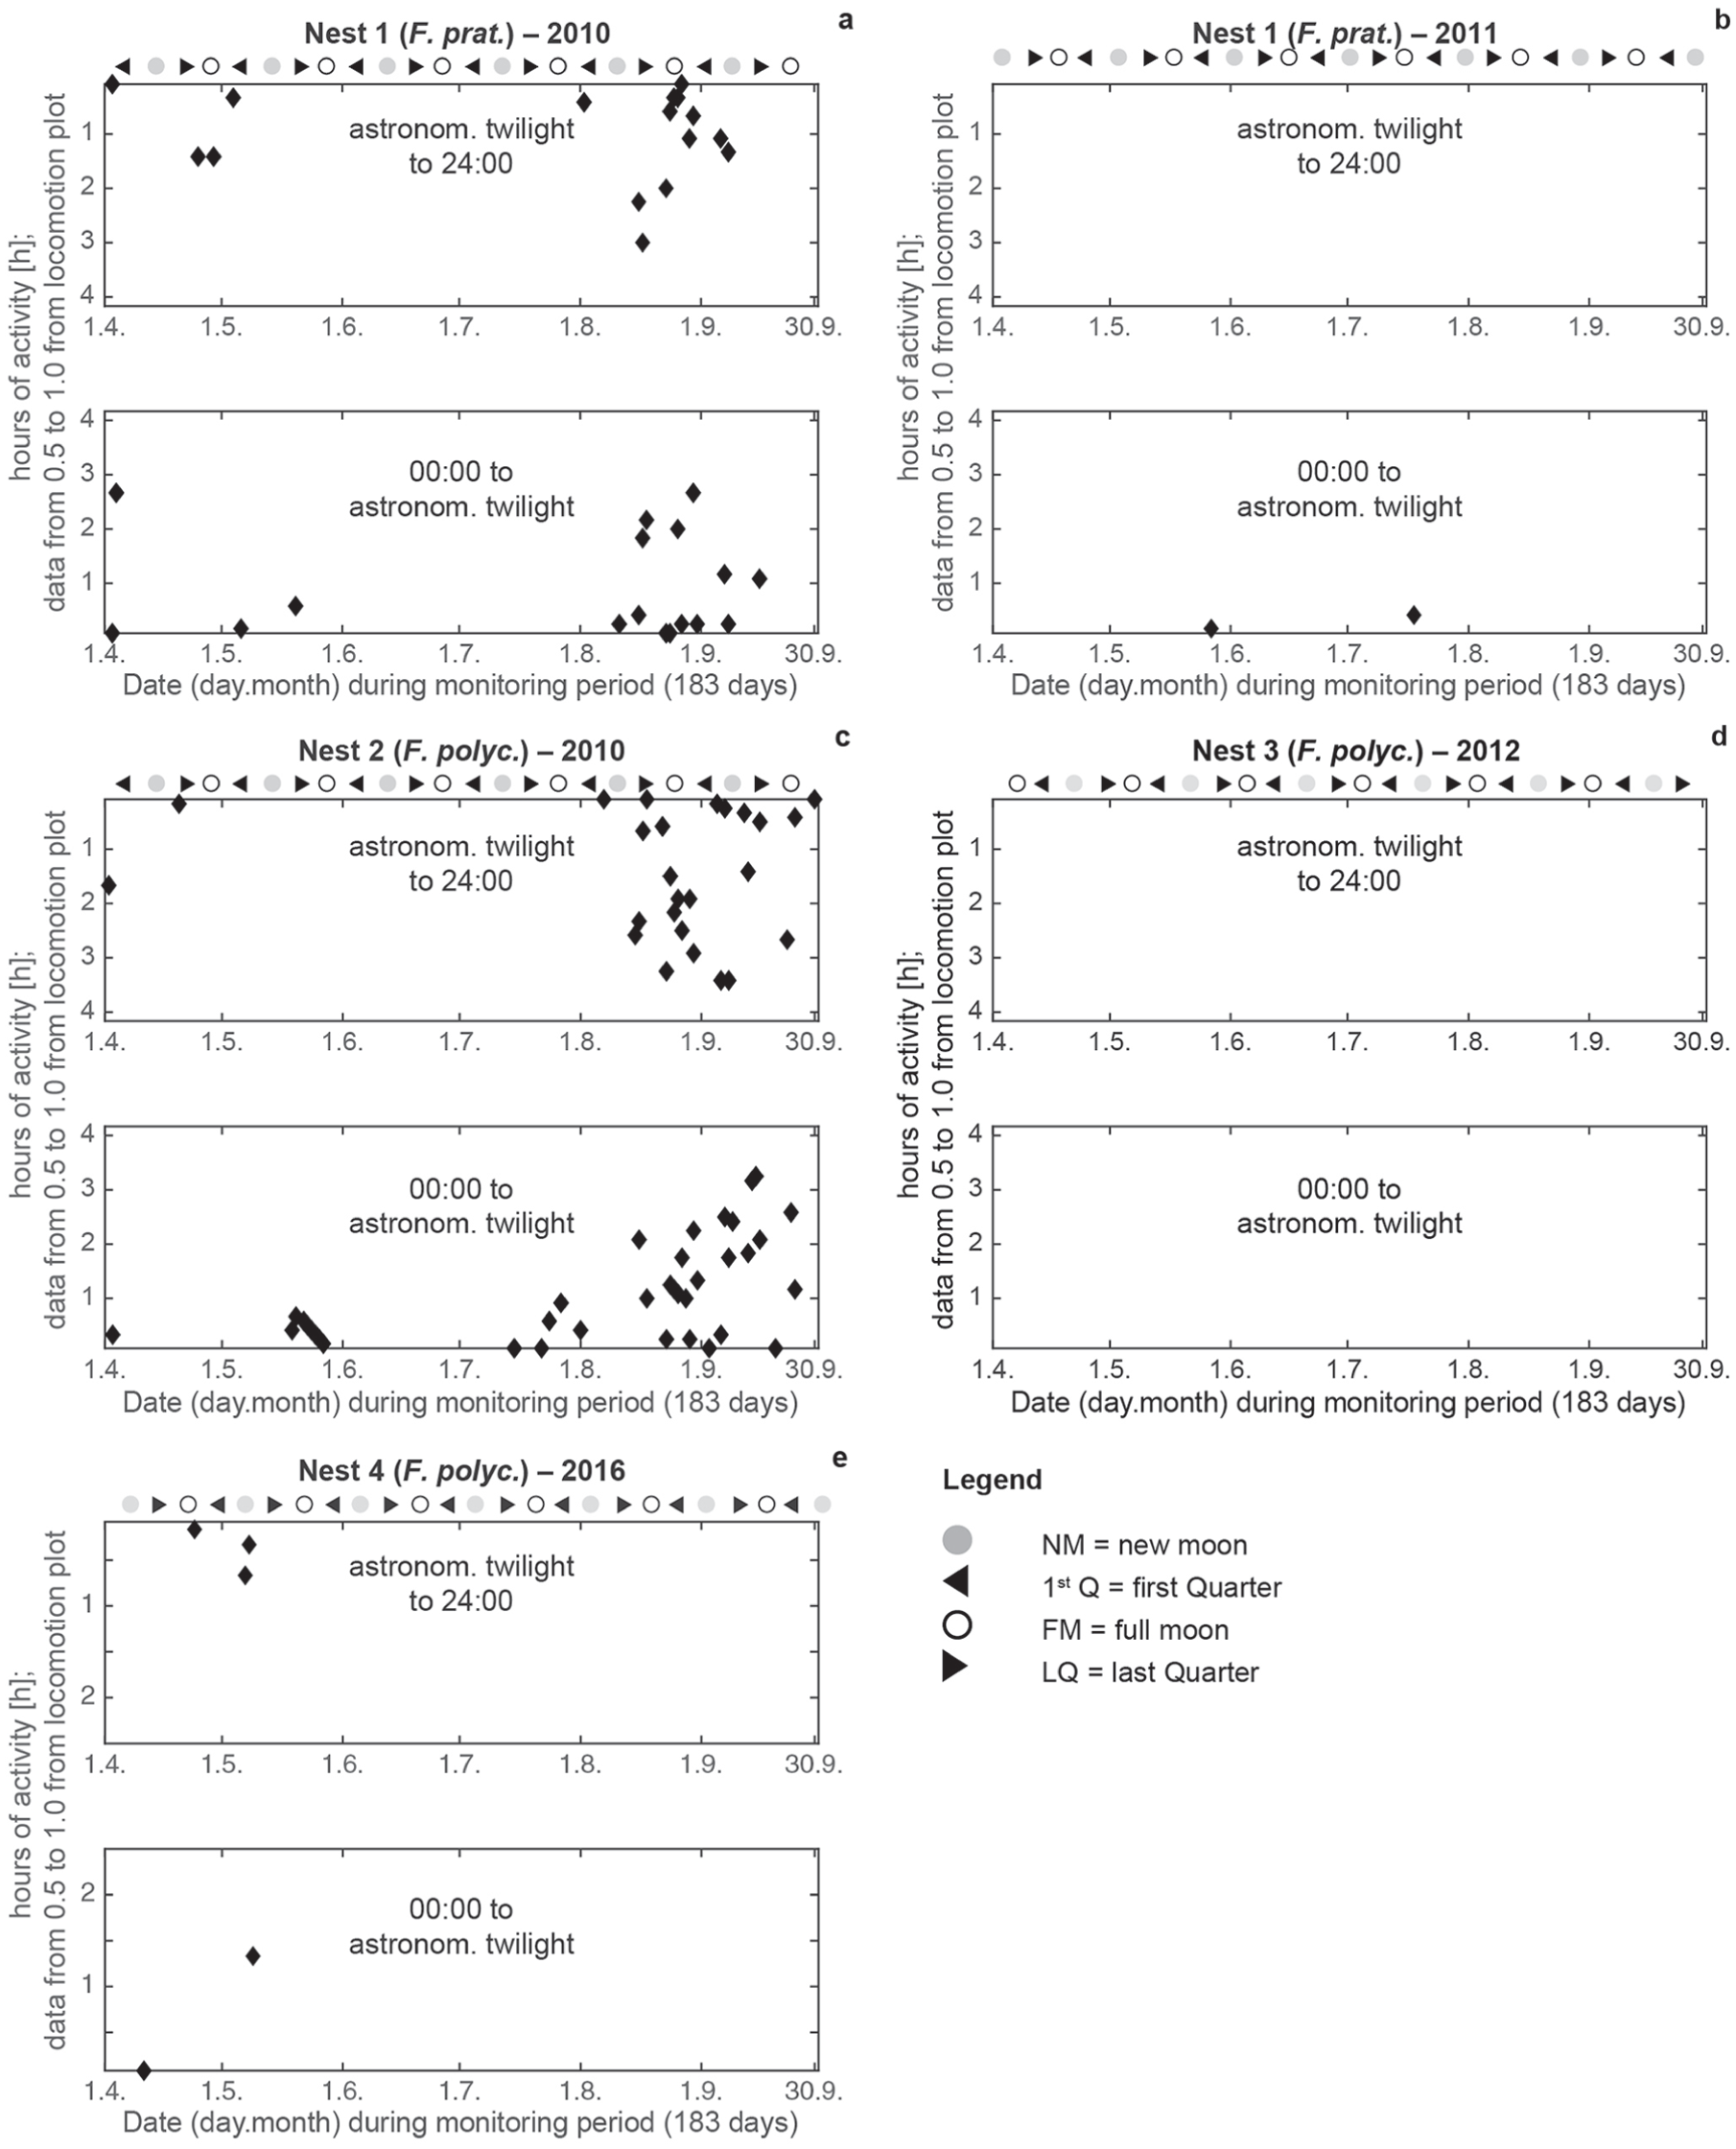
Hours (h) of maximum nocturnal ant activities (y-axis values between 0.5 and 1.0 taken from the locomotion plots of Fig. 3) for both species before and after the astronomical twilight from April to September 2010, 2011, 2012, and 2016.
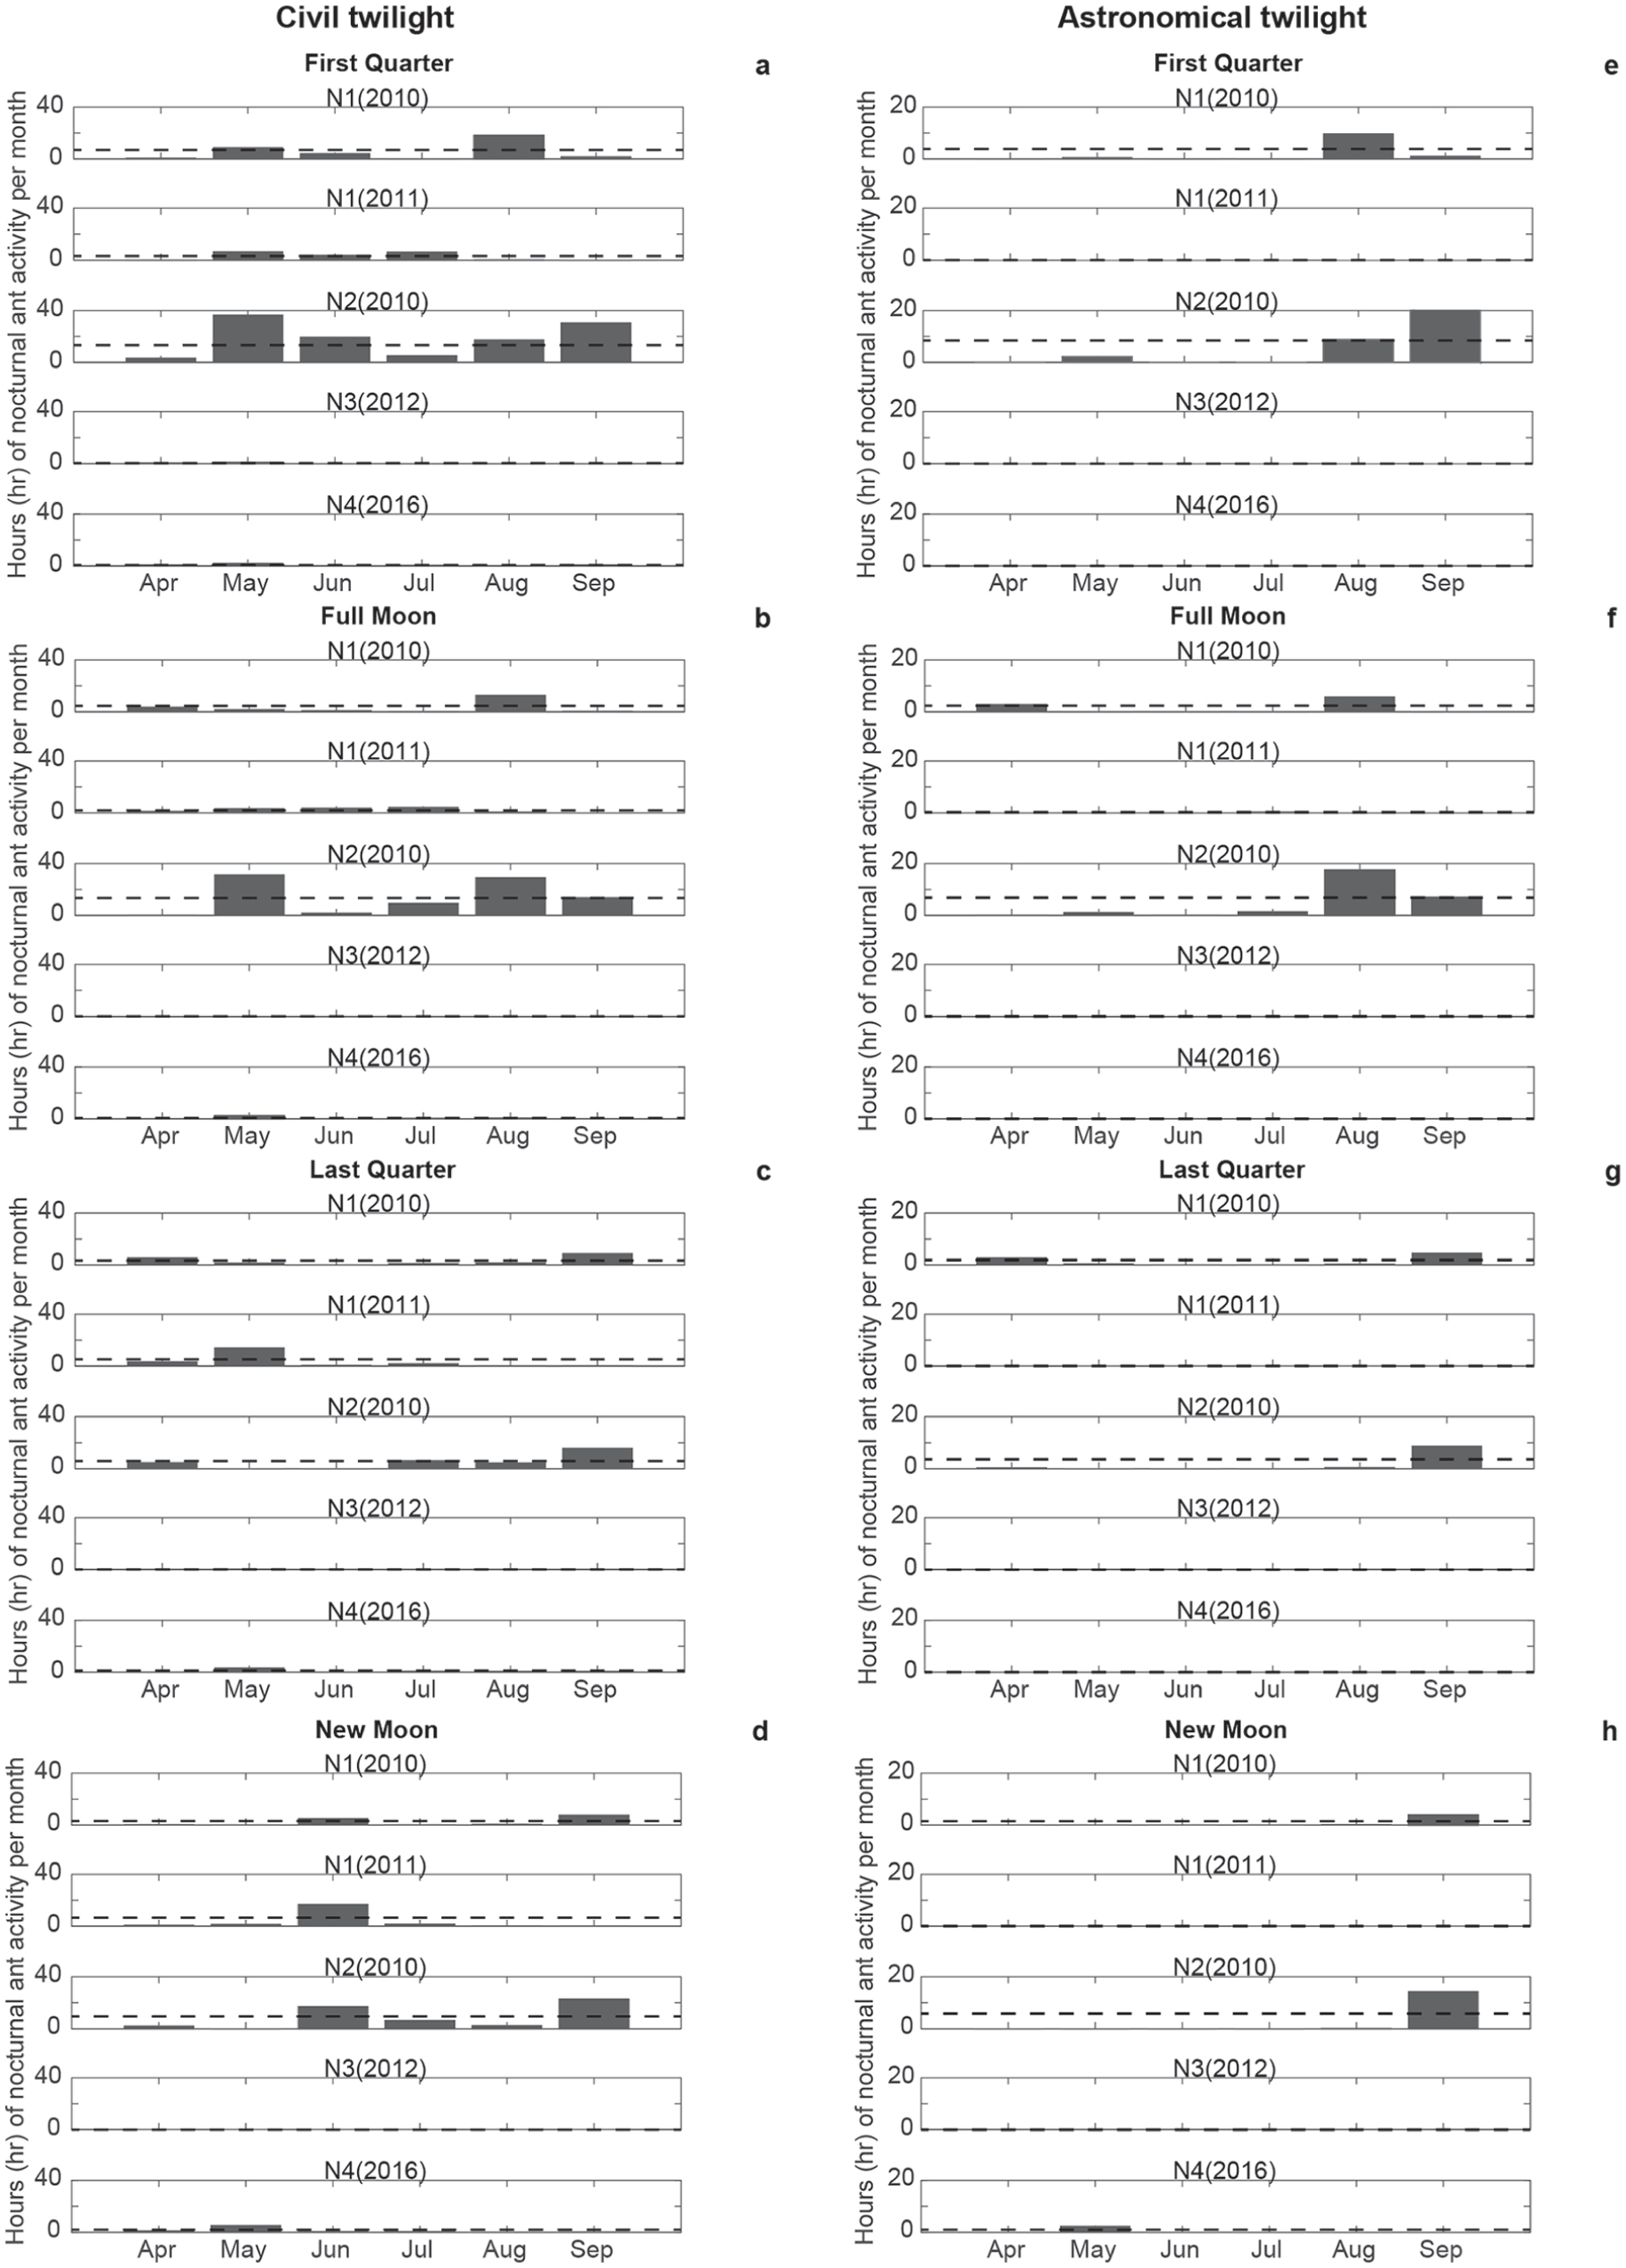
Hours (h) of maximum nocturnal ant activities of both species before and after the civil (a-d) and astronomical (e-h) twilight from April to September 2010, 2011, 2012, and 2016. The SD interval (±1σ) is delineated by a black dotted line.
Variation of the Magnetic Field
During the investigation period (April to September), there were 5 d per month with a disturbed magnetic field (GFZ, 2018). In examining correlations between ant activity (N1-N3) and magnetic field variations, we found high to very high correlations for D, H, and Z, and moderate-to-high correlations for F for 2010 to 2012 (Fig. 7 and Supplement 1). For 2016, a statistically significant, highly positive correlation was found only for total intensity (N4). For ultradian (<20 h) rhythms, ant activity (N1 to N4) and D, H, Z, and F were moderately to very highly correlated (100%). Also, monthly results (Table 5) showed very high correlations between ant activity and D (71%), H (79%), Z (40%), and F (32%). For monthly ultradian (<20 h) rhythms, at least 50% of ant activity and D, H, and Z were moderately to very highly correlated.
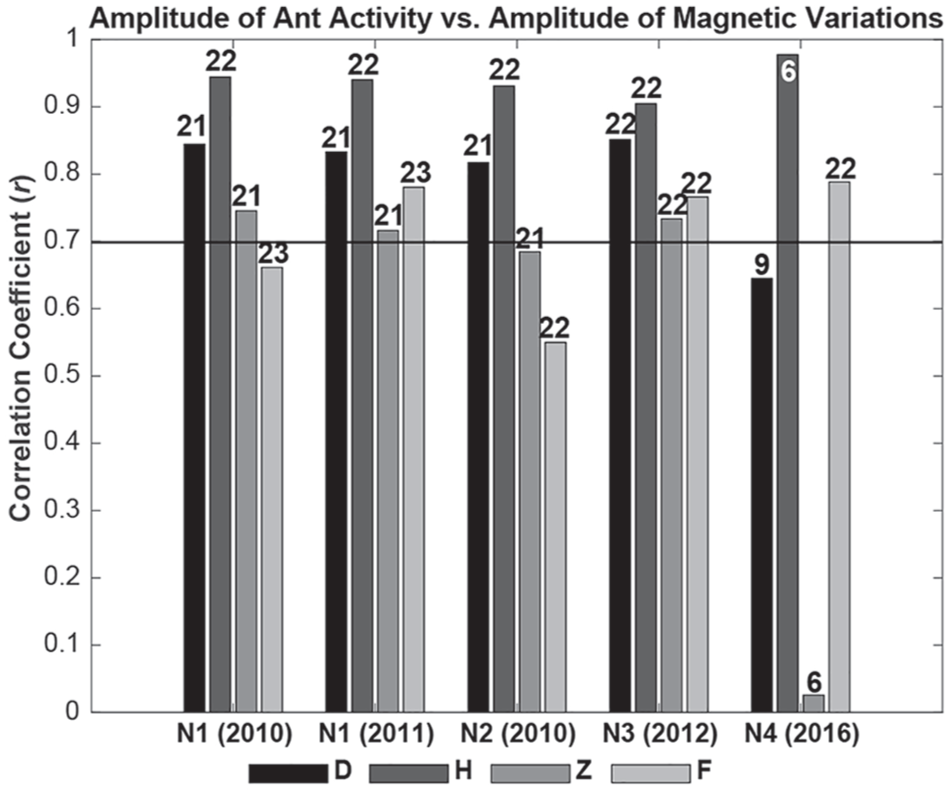
Correlation coefficients (r) for amplitude of ant activity vs. variations in the magnetic field (declination [D], horizontal intensity [H], and vertical intensity [Z], and independent scalar measurements of total intensity [F]) for April to September in 2010, 2011, 2012, and 2016. The horizontal line indicates high to very high correlations (Hinkle et al., 2009). Numbers on the bars indicate the numbers of correlation pairs.
Monthly correlation coefficients (r) for amplitude of ant activity vs. variations in the magnetic field for 2010, 2011, 2012 and 2016.
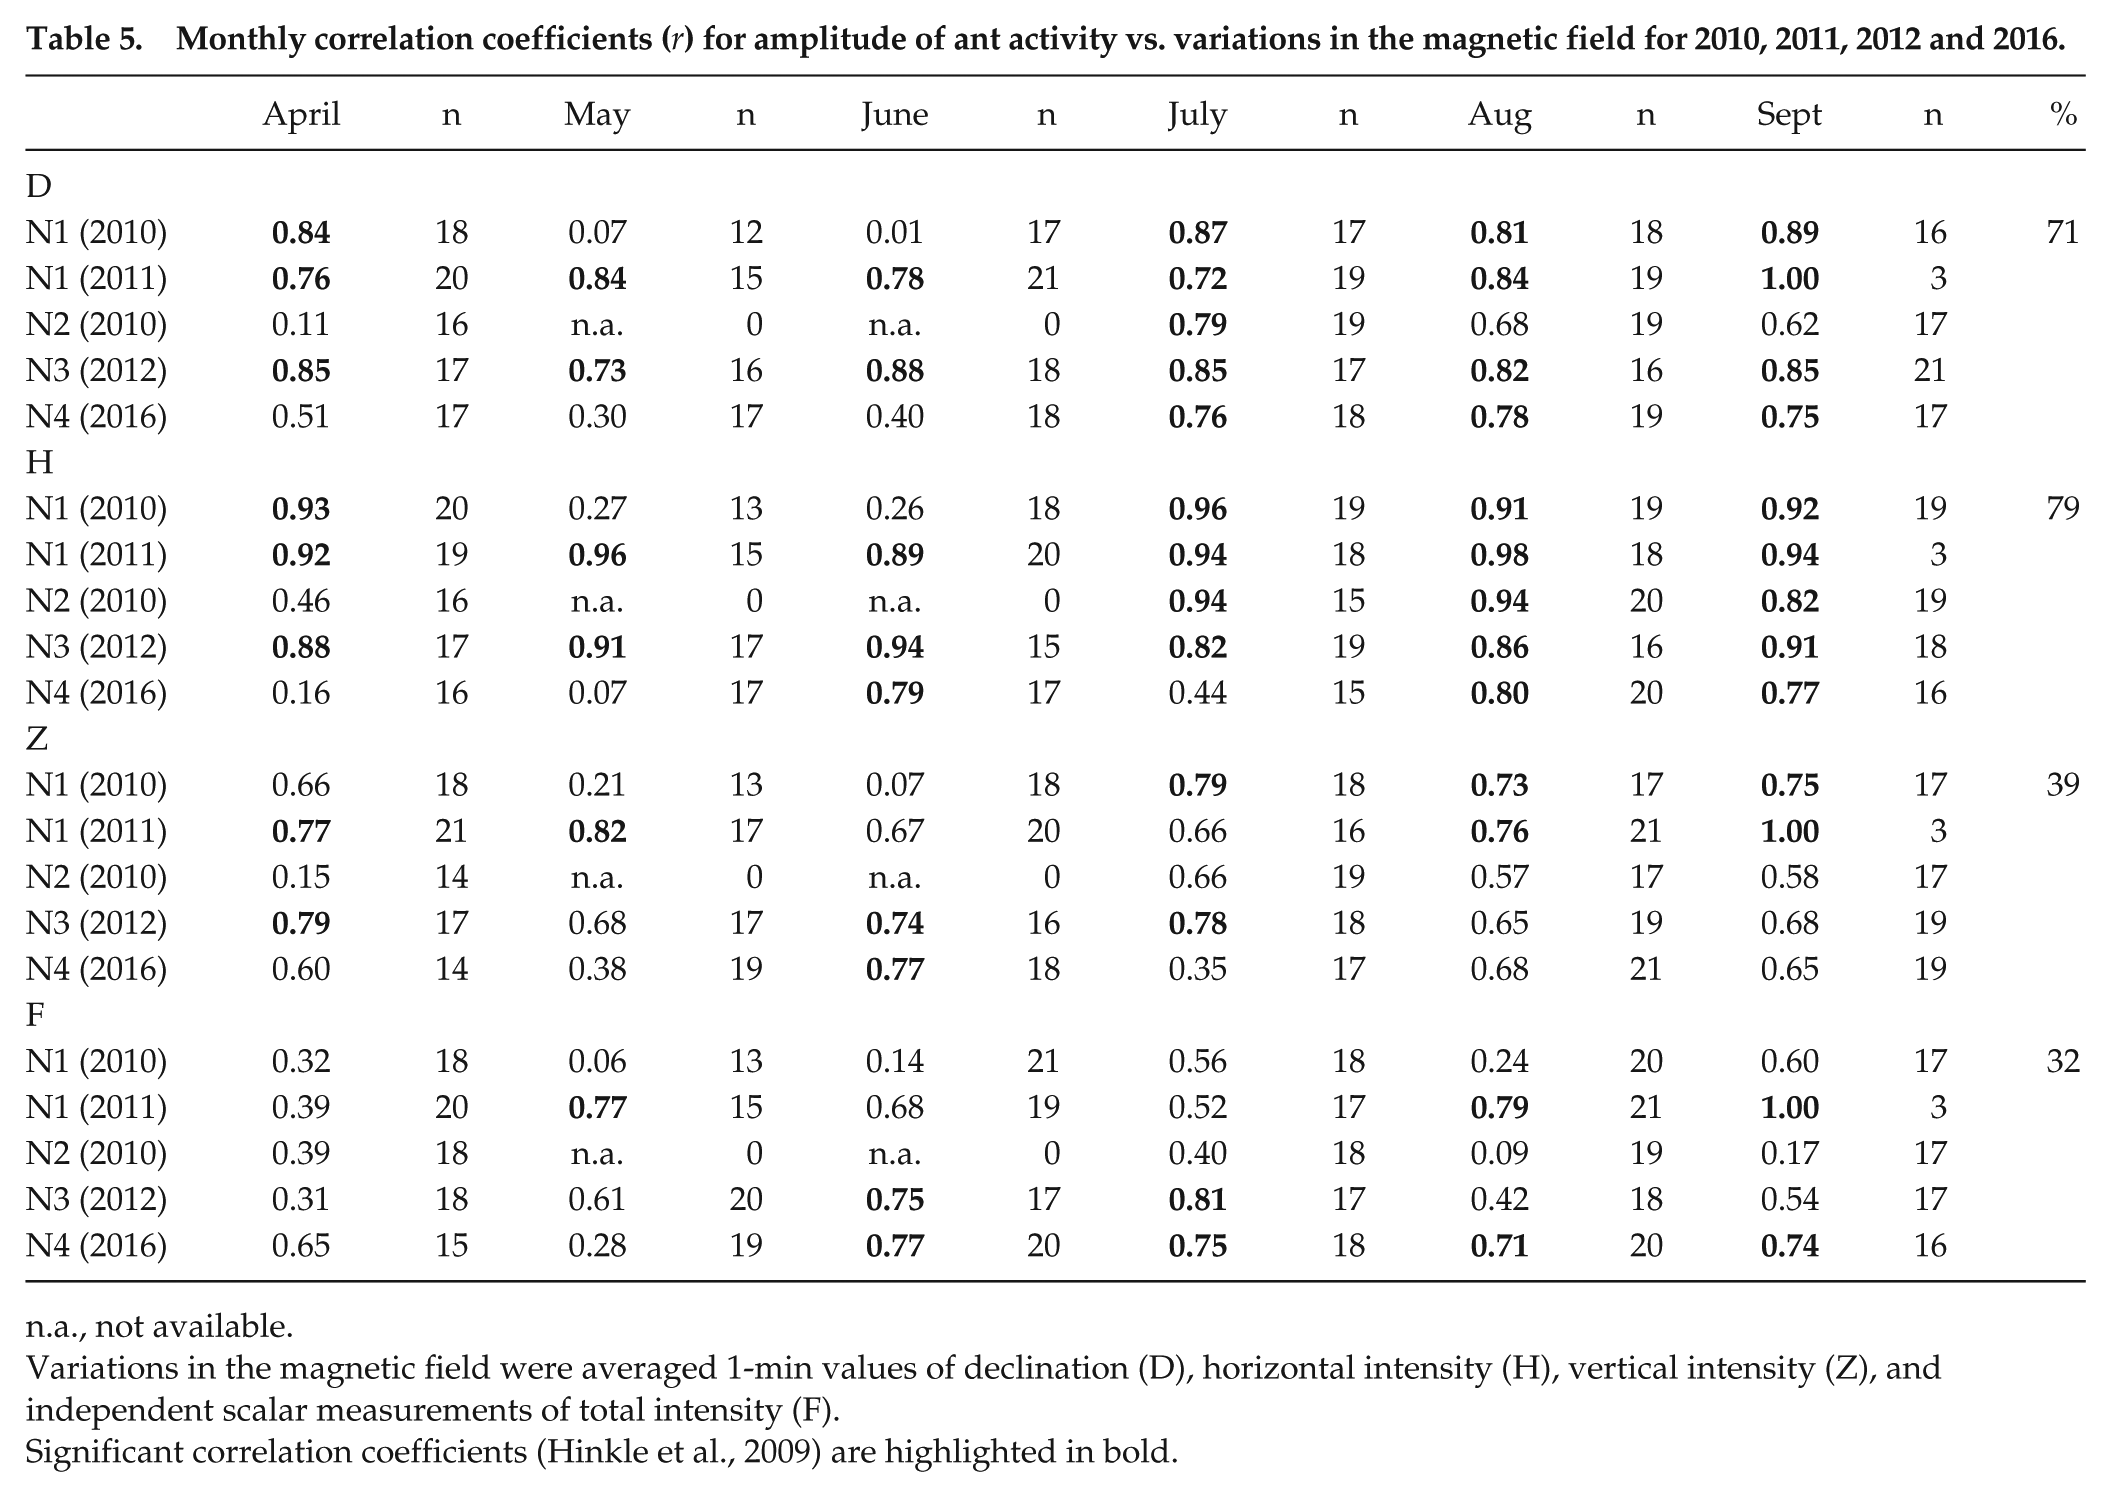
n.a., not available.
Variations in the magnetic field were averaged 1-min values of declination (D), horizontal intensity (H), vertical intensity (Z), and independent scalar measurements of total intensity (F).
Significant correlation coefficients (Hinkle et al., 2009) are highlighted in bold.
Meteorological Parameters
A comparison of ant activity and weather factors (temperature, humidity, pressure and rainfall) for the investigation period of April to September 2016 (Table 6 and Supplement 2) revealed very high associations between ant activity and humidity and temperature for daily (24-h) and ultradian (<20 h) periods.
Correlation coefficients (r) for amplitude of ant activity vs. weather parameters for the daily (24-h) and ultradian (<20 h) rhythms in April to September, 2016.
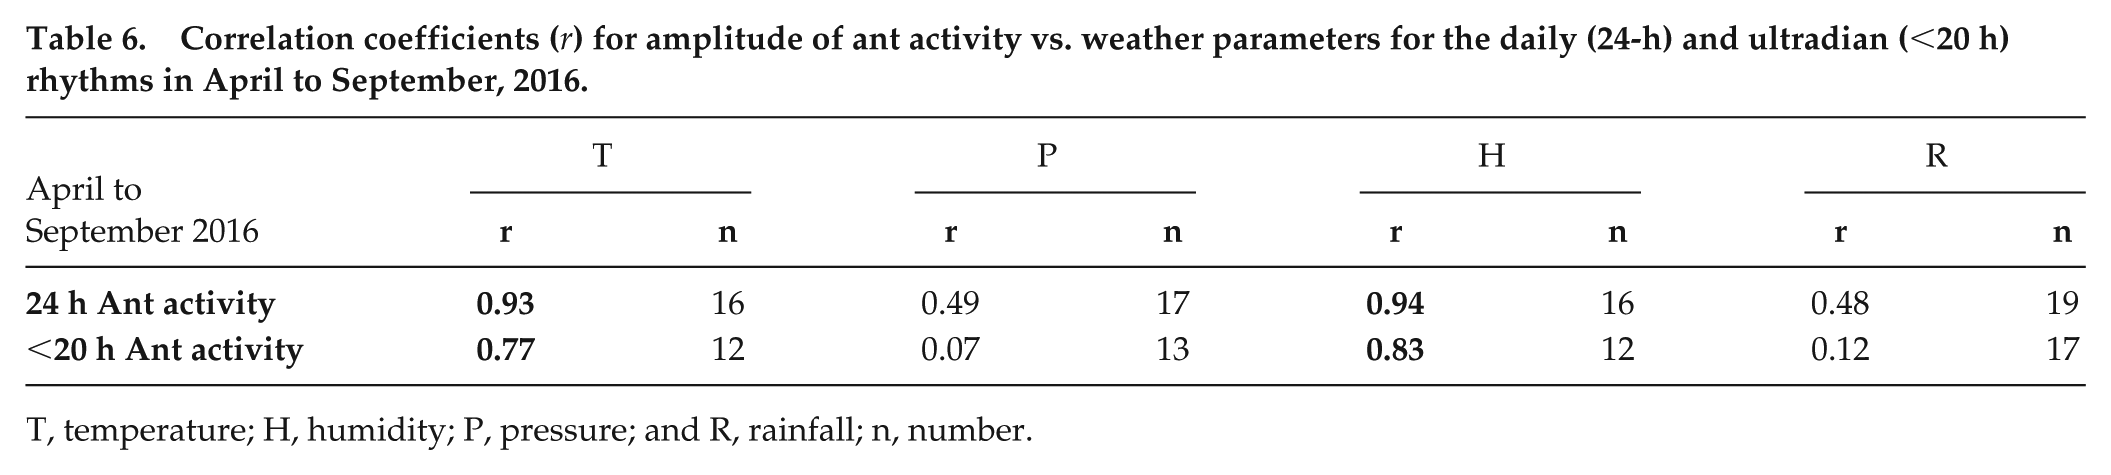
T, temperature; H, humidity; P, pressure; and R, rainfall; n, number.
The camera sensor showed severe weather, e.g., thunderstorms recorded by the DWD (https://www.dwd.de/DE/leistungen/jahresrueckblicke/) in July 2010 (N1; Fig. 3a), frost (1 May), hail (20 May), and thunderstorms (mid/end of June and end of July 2011; Fig. 3b), heavy rain (end of August 2010; Fig 3c), and severe thunderstorms at the end of May/beginning of June 2016 (Fig. 3e). The ants were much less active during these extreme events. High ant activities during camera sensor adjustment (Fig. 3) were technical artefacts, not real events.
Discussion
Here, for the first time, we observed the continuous in situ locomotor activities of the entire colonies of 2 different RWA species (F. pratensis and F. polyctena) under natural LD conditions over long periods. These data contrast with other data in litt. for which different nests were sampled at different times, and individual ants or parts of a colony were subjected to artificial LD experiments (e.g., McCluskey, 1973; North, 1987, 1991, 1993; Rosengren and Fortelius, 1986; Table 1). In situ, under natural LD conditions, both ant species revealed comparable ultradian, infradian, and daily rhythms. For the first time, we identified co-expression of ultradian (≈18/19 h, 8 h, 6 h, 4 h, and 3 h), short infradian (1.2 to 2.9 d), and long infradian (3.2 and 21.3 d), and also daily (24 h) and semi-daily (12 h) rhythms in intact colonies of F. pratensis and F. polyctena under natural LD conditions. The amplitudes of the monthly rhythms varied over the years. Locomotion was daily and semi-daily between the start and end of civil twilight. High correlations were found between ant activities and civil twilight. Our results also showed that different F. polyctena colonies have the same rhythm in different years and during different natural conditions. The monthly rhythms of both species were also similar. These results support previous findings (Berberich et al., 2013) and differ from those of others, in which various species of the Formica rufa-group were thought to differ in their rhythmic behavioral patterns because of the discrete ecological habitats in which they are normally found (F. pratensis = meadows vs. F. polyctena = forests and edges; Gößwald, 1982; Goropashnaya, 2003).
The rotation of the Earth around its own axis promotes a 24-h period in environmental parameters such as light, temperature, and humidity. The daily LD cycle is suggested to be the primary environmental synchronizer responsible for the entrainment of circadian rhythms, with a period of about 1 day (24 [4] h); it is also responsible for locomotion activity in insects (Lazzari and Insausti, 2008; Mildner and Roces, 2017). That organisms require favorable cyclic environments is ignored in many experimental studies of biological rhythms (Koukkari and Sothern, 2006). Furthermore, the pathological consequences of anomalies in environmental conditions can affect strongly the assignment of specific characteristics to free-running periods (Koukkari and Sothern, 2006). Therefore, the objective of our long-term observational study was to investigate RWA activities of 2 species (F. pratensis and F. polyctena) of the Formica rufa-group in situ under naturally changing LD conditions. Nocturnal ant activities before and after astronomical twilight at the new moon and 1st Q-moon (F. polyctena) or full moon and last quarter-moon (F. pratensis) were observed more commonly in periods of darkness in the autumn months. We hypothesize that local variability in the Earth’s magnetic field affects long-term activity patterns, whereas humidity and temperature were more strongly associated with ultradian rhythms (<20 h). Overall, these results show that, to understand how the biological clock organizes behavior and its functional significance in RWA, it is imperative to study these insects for lengthy periods in situ.
Extensive studies have been done to investigate circadian rhythms in insects, including ants, whereas less attention has been paid to ultradian rhythms (<20 h) and infradian rhythms (>28 h). Indeed, ultradian and infradian rhythms originally were not included in the concept of the biological clock. According to Koukkari and Sothern (2006), ultradian and infradian rhythms may exhibit large variations in periods and may differ in how they are generated.
Ultradian rhythms
Ultradian rhythms (<20 h) do not correspond to any known physical cycle in the environment, and their general functions have not yet been demonstrated (Seki and Tanimura, 2014). However, ultradian periods of 12.3 h, 8 h, and 6.5 h are often observed as part of the harmonics of a fundamental circadian signal in frequency-domain analyses (van der Veen and Gerkema, 2017).
Laboratory experiments have suggested that RWA exhibit robust daily rhythms; this is particularly the case for old workers contributing to foraging activities outside of the nest, as they generally show distinct circadian rhythms (Bloch, Barnes, et al., 2013; Fujioka et al., 2017; North, 1993; Rosengren and Fortelius, 1986). Our field data under natural LD conditions did not support these laboratory results, as we detected robust ultradian rhythmicity with equal periodicities of ≈18/19 h, 8 h, 6 h, 4 h, and 3 h in the entire colonies of both ant species on top of the nest. Such rhythms in ants have not been reported before for entire colonies. Recent studies of the rhythmic behavior of the ponerine ant Diacamma sp. are not comparable with ours, as only the behaviors of single workers and pairs of workers were investigated under laboratory conditions (Hayashi et al. 2011). It has been suggested that ultradian locomotor behaviors are masked by circadian behavior in insects (Seki and Tanimura, 2014). Our long-term in situ activity analysis revealed clearly detectable ultradian cycles for the entire ant colonies. We hypothesize that ultradian rhythms in ants may be fundamental rhythms that unmaskedly coexist with circadian ones. This hypothesis parallels that of Seki and Tanimura (2014). Our new findings are relevant for research about the biological clock in ants of the Formica rufa-group and deepen the knowledge of ultradian rhythms for F. pratensis and F. polyctena in natural LD conditions.
Variations in the Earth’s magnetic field
Magnetic fields and their stable variations, including the Earth’s, can serve as timers for biorhythms in animals (Martynyuk and Temur’yants, 2010). Many organisms have developed magnetoreception. Formica rufa and F. pratensis exhibit a magnetic compass response and use magnetic fields for orientation, foraging, and migration when directional light cues are unavailable (Camlitepe et al., 2005; Camlitepe and Stradling, 1995). These data suggest that the magnetic compass serves as a backup system (Klotz and Jander, 2009). Ants do not align in a preferential direction in the absence of other influencing factors when a magnetic pulse disturbs the supramagnetic particles (Wajnberg et al., 2010). We observed strong associations between ant activity and variations in all components of the magnetic field (D, H, Z, F) in some years but not others. Laboratory experiments (Camlitepe et al., 2005; Camlitepe and Stradling, 1995) that only consider one component of the magnetic field (horizontal intensity) are difficult to compare with our data. Indeed, the ultradian rhythm of <8 h in both F. pratensis and F. polyctena might be associated with the variation the rhythms of the Earth’s magnetic field (see also Martynyuk and Temur’yants, 2010).
Temperature can influence other ultradian rhythms (Koukkari and Sothern, 2006). Whereas our data support these observations, we also found that humidity is associated with ultradian rhythms in ants. Further investigations, including an extension to other RWA species, would help explain these new ultradian rhythms in RWA.
Infradian Rhythms
Infradian rhythms (>1 d) are also part of the temporal organization of organisms, but they have been discussed only recently with respect to the behavior of ants (Verza et al., 2017). Our findings of short infradian colony activity rhythms with periodicities of 2.1 to 2.5 d for F. pratensis and F. polyctena have not been reported previously. Although such rhythms could be explained by molecular feedback loops or similar interactive cycles (Saunders, 2002), further investigations are necessary. Mildner and Roces (2017) observed infradian rhythms (16.7%) in only a small number of foragers (n = 12) and nurses (n = 12) of the ant Camponotus rufipes under daytime and nighttime feeding, but without stating the exact period of the rhythm. Infradian periodicities have been attributed to the influence of the Earth’s or Moon’s rotation (Seki and Tanimura, 2014), but the infradian rhythms we observed are out of phase with lunar cycles.
A social synchronization of long infradian rhythms with respect to the queen’s egg-laying cycle is also plausible. Our findings of in situ infradian rhythms with longer periodicities—of 3.2 and 21.3 d—in colony activity of F. pratensis and F. polyctena have also not been reported previously. Such infradian rhythms might correspond to the oviposition cycle of the ant queen (Kipyatkov and Shenderova, 1990); previous laboratory experiments have indicated that the duration of oviposition and diapause rhythms are quite variable in queens of the RWA F. aquilonia (90 and 525 days; mean 212 days) and F. polyctena (60 and 345 d; mean, 178.7 d) species. The duration of periods when eggs are present or lacking in the nest also vary from 22 to 255 d and from 22 to 337 d, respectively, for these 2 species. It is hypothesized that the ceasing of oviposition by the queen might liberate ants to take on different work and that they move to the top of the nest. The queen’s behavior might trigger the entire colony’s behavior, which might be indirectly observable in situ under natural LD conditions.
Daily Locomotion Patterns
The activity patterns for both Formica species illustrated daily periodicity (24 [1] h) under natural LD conditions. These results correspond to previous findings for shorter-term in situ observation periods (September 2009, 21-23 April 2010, 4-11 August 2016; Berberich et al. 2013; 2018a). Together with their semi-daily periodicity (12-h), such behavioral rhythms can be attributed to activity and resting periods under natural LD conditions (Lazzari and Insausti, 2008). Associations among temperature, humidity, and ant activity for daily rhythms (i.e., exogenous influences) also were observed. Different activity amplitudes of the entire colony, e.g., in August and September (Fig. 4a, c), for both nests can be explained by the observation that N1 was more sunlit than N2. The daily LD cycle is suggested to be the major environmental synchronizer for locomotion activity in insects (Lazzari and Insausti, 2008; Mildner and Roces, 2017). Our results suggest that such a rhythm is probably a gated rhythm in the population and can be explained as a measure to avoid animal vulnerability to predators (Lazzari and Insausti, 2008). RWAs are continuously active in their natural environment, and activity is thought to be suppressed only by heavy rain and low temperatures (North 1987). In contrast, our observations show that, during periods of heavy rain, thunderstorms, or frost, the in-situ ant activity was not completely suppressed, only reduced.
Nocturnal Activities in Constant Darkness
It is widely discussed whether animals’ endogenous clocks are light-sensitive. Laboratory experiments with fruit flies showed that moonlight will shift the endogenous clock of D. melanogaster (Bachleitner et al., 2007). In contrast, studies of ants have shown that workers active outside the nest exhibit strongly entrained circadian rhythms and undergo consolidated periods of sleep during the night (Bloch, Barnes, et al. 2013). The in-situ locomotion activities of entire colonies of F. pratensis and F. polyctena have similar rhythms in constant darkness over a lengthy period. Our long-term in situ analysis revealed nocturnal activities up to 4-h in both species, especially at new moon (F. polyctena; Fig. 4f), before and after the astronomical twilight in a period of constant darkness in spring and fall. At new moon ±2 days, the night sky illumination reaches 0.0009 lux, whereas illumination at full moon reaches 0.25 lux (Nowinszky et al., 1979). In a night without moonlight, the illuminating light is composed of starlight, zodiacal light, and airglow, where the latter 2 depend on the time-dependent configuration of the ecliptic and the solar activity, respectively (Johnsen, 2012). Furthermore, when the center of the sun is more than 18° below the horizon, sunlight no longer influences the night sky, and the celestial polarization pattern changes in a complex way with the phase angle of the moon and its position in the sky (Dacke et al., 2014). The spectral content of moonlight is also richer towards the red part of the spectrum (Ciocca and Wang, 2013). The results of a behavioral analysis of chromatic and achromatic vision in the ant Formica cunicularia showed sensitivity to wavelengths corresponding to blue and red ranges of the spectrum (Aksoy and Camlitepe, 2012).
We hypothesize that the higher nocturnal activities of F. polyctena compared with F. pratensis (Fig. 6) might therefore be explained by a higher sensitivity to wavelengths corresponding to blue and red ranges of the spectrum. Alternatively, photoreceptors for visual image detection in F. polyctena might be able to adapt more quickly to changes in light intensity than F. pratensis (Bachleitner et al., 2007). Furthermore, our results for F. pratensis and F. polyctena suggest that RWAs may be able to make use of even a little light at night that allow orientation at new moon as a short-term compass, which is calibrated newly each time the ants start foraging. This is in contrast to other results in which 1) the sensitivity of insect eyes is assumed to be insufficient to see at night (Falcon et al., 1996); 2) ants are either light- or dark-active (Williams, 1936); and 3) the activity of F. polyctena workers only increases when approaching the end of the dark period (Berberich et al., 2018a; Fourcassié et al., 1999). The predominant factor governing ant activity is luminosity rather than the specific time; e.g. Myrmecia pyriformis starts foraging at dusk using the skylight polarization pattern for orientation (Kannowski, 1961; Narendra et al., 2010). We also observed high nocturnal in situ activities during the months of the midnight twilight (June to the middle of July) when there is no complete darkness. We hypothesize that ants of the Formica rufa-group make use of polarized light during the months of the midnight twilight.
All in all, our results suggest that understanding and exploring the relationship between biological rhythms and abiotic influences in natural ecosystems should include geophysical and weather data. Future in situ long-term monitoring of additional RWA species, e.g., F. rufa, F. aquilonia or F. lugubris, should test whether entire colonies of F. rufa-group exhibit similar 1) in situ rhythms; 2) nocturnal behavior; 3) and year-to-year variations in activity patterns also triggered by abiotic factors, e.g. magnetic variations.
Supplemental Material
JBR-0081_SuppMat_1bw – Supplemental material for First In Situ Identification of Ultradian and Infradian Rhythms, and Nocturnal Locomotion Activities of Four Colonies of Red Wood Ants (Formica rufa-Group)
Supplemental material, JBR-0081_SuppMat_1bw for First In Situ Identification of Ultradian and Infradian Rhythms, and Nocturnal Locomotion Activities of Four Colonies of Red Wood Ants (Formica rufa-Group) by Gabriele M. Berberich, Martin B. Berberich, Aaron M. Ellison, Arne Grumpe and Christian Wöhler in Journal of Biological Rhythms
Supplemental Material
JBR-0081_SuppMat_1c – Supplemental material for First In Situ Identification of Ultradian and Infradian Rhythms, and Nocturnal Locomotion Activities of Four Colonies of Red Wood Ants (Formica rufa-Group)
Supplemental material, JBR-0081_SuppMat_1c for First In Situ Identification of Ultradian and Infradian Rhythms, and Nocturnal Locomotion Activities of Four Colonies of Red Wood Ants (Formica rufa-Group) by Gabriele M. Berberich, Martin B. Berberich, Aaron M. Ellison, Arne Grumpe and Christian Wöhler in Journal of Biological Rhythms
Supplemental Material
JBR-0081_SuppMat_2bw – Supplemental material for First In Situ Identification of Ultradian and Infradian Rhythms, and Nocturnal Locomotion Activities of Four Colonies of Red Wood Ants (Formica rufa-Group)
Supplemental material, JBR-0081_SuppMat_2bw for First In Situ Identification of Ultradian and Infradian Rhythms, and Nocturnal Locomotion Activities of Four Colonies of Red Wood Ants (Formica rufa-Group) by Gabriele M. Berberich, Martin B. Berberich, Aaron M. Ellison, Arne Grumpe and Christian Wöhler in Journal of Biological Rhythms
Supplemental Material
JBR-0081_SuppMat_2c – Supplemental material for First In Situ Identification of Ultradian and Infradian Rhythms, and Nocturnal Locomotion Activities of Four Colonies of Red Wood Ants (Formica rufa-Group)
Supplemental material, JBR-0081_SuppMat_2c for First In Situ Identification of Ultradian and Infradian Rhythms, and Nocturnal Locomotion Activities of Four Colonies of Red Wood Ants (Formica rufa-Group) by Gabriele M. Berberich, Martin B. Berberich, Aaron M. Ellison, Arne Grumpe and Christian Wöhler in Journal of Biological Rhythms
Footnotes
Acknowledgements
The study is part of the research project “GeoBio-Interactions” funded by the VW-Stiftung (grant numbers Az 93 403 and Az 94 626) within the initiative “Experiment!” – Auf der Suche nach gewagten Forschungsideen. RWA activity recording was done using equipment from the Department of Geology at University of Duisburg-Essen. We also thank Dr. Peter Henrich (Leiter der Direktion Landesarchäologie – Außenstelle Koblenz) for his permission to conduct the survey on the Goloring site, and Hans-Toni Dickers, Paul Görgen and Bernd Klug from Kuratorium für Heimatforschung und -pflege, Kobern-Gondorf, and Elisabeth and Reiner Degen, Weibern for their support during the field campaign. The study is part of the research project “GeoBio-Interactions” funded by the VW-Stiftung (grant numbers Az 93 403 and Az 94 626) within the initiative “Experiment!” – Auf der Suche nach gewagten Forschungsideen. The VW-Stiftung had no role in the design of the study; in the collection, analyses, or interpretation of data; in the writing of the manuscript, and in the decision to publish the results. G.M.B, A.M.E, C.W. work has been funded by the VW-Stiftung (grant numbers Az 93 403 and Az 94 626). M.B.B. and A.G. declare no potential conflict of interest.
Author contributions
G.M.B. conceived the idea, designed the study, performed the field work, carried out the statistical analysis and wrote the manuscript. M.B.B. performed the field work, analyzed the data and contributed to the manuscript. A.G. and C.W. further developed the automated image analysis routine, analyzed the data and contributed to the manuscript. G.M.B. and A.M.E. wrote the manuscript. All authors edited the manuscript and approved the final version.
Conflict of Interest Statement
The author(s) have no potential conflicts of interest with respect to the research, authorship, and/or publication of this article.
Notes
References
Supplementary Material
Please find the following supplemental material available below.
For Open Access articles published under a Creative Commons License, all supplemental material carries the same license as the article it is associated with.
For non-Open Access articles published, all supplemental material carries a non-exclusive license, and permission requests for re-use of supplemental material or any part of supplemental material shall be sent directly to the copyright owner as specified in the copyright notice associated with the article.