
Abstract
Ultradian rhythms are a prominent but little-studied feature of mammalian sleep-wake and rest-activity patterns. They are especially evident in long-term records of behavioral state in polyphasic animals such as rodents. However, few attempts have been made to incorporate ultradian rhythmicity into models of sleep-wake dynamics, and little is known about the physiological mechanisms that give rise to ultradian rhythms in sleep-wake state. This study investigated ultradian dynamics in sleep and wakefulness in rats entrained to a 12-h:12-h light-dark cycle (LD) and in rats whose circadian rhythms were suppressed and free-running following long-term exposure to uninterrupted bright light (LL). We recorded sleep-wake state continuously for 7 to 12 consecutive days and used time-series analysis to quantify the dynamics of net cumulative time in each state (wakefulness [WAKE], rapid eye movement sleep [REM], and non-REM sleep [NREM]) in each animal individually. Form estimates and autocorrelation confirmed the presence of significant ultradian and circadian rhythms; maximum entropy spectral analysis allowed high-resolution evaluation of multiple periods within the signal, and wave-by-wave analysis enabled a statistical evaluation of the instantaneous period, peak-trough range, and phase of each ultradian wave in the time series. Significant ultradian periodicities were present in all 3 states in all animals. In LD, ultradian range was approximately 28% of circadian range. In LL, ultradian range was slightly reduced relative to LD, and circadian range was strongly attenuated. Ultradian rhythms were found to be quasiperiodic in both LD and LL. That is, ultradian period varied randomly around a mean of approximately 4 h, with no relationship between ultradian period and time of day.
Keywords
The quantity and timing of mammalian sleep and wakefulness are influenced by many factors, including endogenous (e.g., physiological and psychological) mechanisms and exogenous (e.g., social and environmental) stimuli (Saper et al., 2005). Two important physiological mechanisms are strongly time dependent: a clock-like mechanism that modulates vigilance and sleepiness in a cyclic pattern over a daily timescale (the circadian timing system) and an inverting (oscillating) interval-timing mechanism that modulates vigilance and sleepiness as a function of time in state, often referred to as a sleep-wake homeostat. The circadian clock and sleep-wake homeostat are widely assumed to be the main factors determining the duration and timing of sleep, a fundamental assumption upon which the “2-process model” of sleep regulation is based (Achermann, 2004; Borbely, 1982; Daan et al., 1984).
Various versions of the 2-process model and other dual-oscillator models have been used successfully to describe and predict long-term patterns of sleep and wakefulness, particularly in relation to the consolidated sleep-wake pattern of human subjects (Borbely and Achermann, 1992; Kronauer et al., 1982). However, these models have not been able to describe shorter-term fluctuations in vigilance state (“ultradian rhythms”) with a high degree of accuracy (Achermann and Borbely, 1990; Preud’homme et al., 2008; Yassouridis et al., 1999), especially when applied to polyphasic sleep patterns in rodents (Franken et al., 1991b, 2001; Huber et al., 2000; Vyazovskiy et al., 2007). Indeed, these models are usually used to simulate electroencephalographic “slow-wave activity” instead of sleep behavior per se, and the models contain oscillators with long time constants that function as low-pass filters and thereby suppress or eliminate ultradian “noise.” Here we define ultradian rhythms as quantitative variations in the expression of sleep or wakefulness over a “mid-range” timescale of 1 to 18 h (Dowse, 2008), as distinct from the commonly used qualitative definition in which the term ultradian rhythm refers to the relatively rapid (<1 h in rats) alternations between wakefulness and the various states and stages of sleep (Achermann and Borbely, 1990; Le Bon et al., 2007).
Mid-range ultradian rhythms in sleep and wakefulness have received relatively little attention, and their underlying mechanisms are currently unknown. The temporal characteristics of ultradian sleep-wake time series remain poorly understood, and it is unclear if and how ultradian periodicity arises from the apparently stochastic behavior of individual bouts (Lo et al., 2004) and how it interacts with the near 24-h period of the circadian system. Ultradian sleep-wake and rest-activity rhythms have been reported to exhibit average periods of approximately 3 h and 4 h in rodents (Buttner and Wollnik, 1984; Dowse et al., 2010; Honma and Hiroshige, 1978; Ibuka et al., 1977; Kimura and Tsai, 1984), which are subharmonics of the fundamental circadian rhythm, suggesting the possibility of a common underlying mechanism (Wollnik and Turek, 1989). However, suppression or elimination of circadian output by, for example, lesioning the suprachiasmatic nuclei or prolonged exposure to constant bright light often fails to suppress or abolish ultradian rhythms in rodents (Depres-Brummer et al., 1995; Eastman and Rechtschaffen, 1983; Eastman et al., 1984; Honma and Hiroshige, 1978; Ibuka et al., 1977; Mistlberger et al., 1987), indicating that ultradian rhythms in sleep and wakefulness may not be dependent on circadian output for their expression. Indeed, it is possible that dependence may work in the reverse direction if ultradian oscillations constitute the frequency standard for the circadian system (Dowse, 2008).
Integrating sleep-wake ultradian rhythmicity into an overall description of behavioral state regulation will require a detailed quantitative characterization of sleep-wake patterns over the ultradian timescale. The present study was therefore designed to examine the dynamics of ultradian fluctuations in state expression in rats entrained to a 12-h:12-h light-dark cycle and rats with severely attenuated circadian rhythms after prolonged exposure to constant bright light.
Methods
Animals and Experimental Procedures
All experimental procedures were performed in strict accordance with the guidelines established by the Canadian Council on Animal Care and were approved by the animal care committee at the University of Toronto. Data from a total of 20 adult male Sprague-Dawley rats were analyzed in this study. They were maintained individually in plastic cages provided with standard corn cob bedding that was changed every 7 to 10 days as necessary. Cages were located in a sound-attenuated room at 23 ± 1 °C. The rats were provided with chow and water ad libitum throughout the study. Ten rats (mean ± SEM; body mass 431 ± 15 g at start of recordings) were maintained under a stable 12-h:12-h light-dark cycle for at least 5 weeks before and during the study. They were recorded for 7 full consecutive days, during which they were undisturbed except for a brief interval (usually <5 min) each day immediately after lights on (zeitgeber time, ZT 0 h), at which time the rats and cages were inspected, food and water were replaced, and equipment was checked. Ten additional rats (mean ± SEM; body mass 699 ± 29 g at start of recordings) were maintained in constant bright light (LL, approximately 650 lux at cage floor) for at least 10 weeks before and during 12 (n = 9) or 9 (n = 1) days of recordings. Throughout the study, the rats held in LL were minimally disturbed for routine maintenance every 1 to 2 days at random times of the day to reduce the likelihood of inadvertent nonphotic entrainment (Richter, 1978).
Data Acquisition
At least 10 days before the start of recordings, all animals were instrumented, under isoflurane anesthesia, with fully implanted biotelemetry devices (model TL10M3-F50-EET; Data Science International, St. Paul, MN) for acquisition of electroencephalogram (EEG, frontoparietal bipolar electrodes; coordinates, expressed relative to bregma: AP +2 mm/ML 2 mm, AP −4 mm/ML 2 mm) and electromyogram (EMG, nuchal bipolar electrodes). The surgical and postoperative procedures were exactly as described previously (Caron and Stephenson, 2010).
EEG and EMG data were acquired in 5-sec epochs continuously throughout. Data were acquired (sampling frequency, 400 Hz) and conditioned using custom software (LabView version 7; National Instruments Corp., Austin, TX). Data processing and sleep scoring were performed as described previously (Stephenson et al., 2009). Briefly, offline automated sleep scoring was performed using an algorithm written in a spreadsheet format (Microsoft Excel, v. 2011; Microsoft Corp., Redmond, WA). Visual analysis of raw data (using 3-h samples of EEG and EMG traces) was used to check the accuracy of the automated scoring system in each rat, and only those animals with autoscore versus rater concordance >90% were used in the study. In both automated and visual scoring, each epoch was assigned to 1 of 4 categories: 3 behavioral states of wakefulness (WAKE), rapid eye movement sleep (REM), and non-REM sleep (NREM) plus artifact (ART). In the present study, all epochs identified as ART by the automated system (<5% of all epochs recorded) were subsequently reclassified as WAKE since the vast majority of such artifacts were caused by motion during awake activities (Stephenson et al., 2009). The validity of the latter correction was verified by direct examination of the ART epochs.
Data Analysis
All analyses were performed on the data from each rat individually. Conventional summary statistics were obtained to verify that the sleep-wake behavior of these rats was typical of adult male rats under standard laboratory conditions and to compare sleep-wake behavior between LD and LL conditions. Time spent in each state was expressed as minutes per day. Mean (± SEM) durations (at 5 sec epoch resolution) of bouts of each state were recorded.
Time series were generated from the output of the sleep-scoring system as follows. For each of WAKE, NREM, and REM, net cumulative time in state was calculated over the recording period by assigning a value of +1 for each minute spent in the state of interest and −1 for each minute spent in one of the other two states (i.e., ±0.0833 min per epoch). Except where indicated otherwise, the data were then collapsed into 10-min time bins (Dowse and Ringo, 1994). Each resulting time series was detrended by taking the residuals of a least squares linear regression through the data to remove systematic trend and reset the mean of the waveform to zero. The resulting detrended time series was then subjected to additional filtering before analysis of periodicity in the circadian and ultradian ranges, as described below.
Digital filtering, autocorrelation analysis, and maximum entropy spectral analysis (MESA) were performed using analysis programs custom-written in FORTRAN and implemented in DOS-executable form, as described in detail (and validated) elsewhere (Dowse, 2007). Owing to noise in the signal, the order of the autoregressive process in the MESA calculations was set at a minimum of N/3 and further constrained by Akaike’s final prediction error criteria (see Ulrych and Bishop, 1975, for a thorough discussion). All additional data analyses were performed using custom spreadsheets (Microsoft Excel, v. 2011; Microsoft Corp.) in association with XLSTAT (v.2011.2; Addinsoft USA, New York, NY) or Sigmastat (v. 3.5; Systat Software, Inc., Point Richmond, CA) statistical software. Statistical tests and associated probability values are indicated in the Results.
Circadian rhythms were analyzed after running the detrended time series through a band-pass Fourier filter to remove periodicities below 10 h and above 31 h. This filter performs a discrete Fourier transformation on the detrended time series and then reconstructs the waveform from the Fourier coefficients minus the coefficients corresponding to the excluded frequency ranges. Autocorrelation was used to verify the presence of statistically significant circadian rhythmicity in each of the WAKE, NREM, and REM filtered time series in each rat. Circadian period (TAU) was measured using MESA (Levine et al., 2002; Rigozo et al., 2005). In LL, circadian time 0 h (CT0, start of subjective day) was defined as the time of the peak (acrophase) of the cumulative WAKE time series. Note that this represents the time at which the animal changes from being predominantly awake (rising phase denotes net accumulation of WAKE) to predominantly asleep (falling phase denotes net accumulation of sleep). Circadian “amplitude” was estimated in 2 ways: circadian range was measured as the mean daily peak-trough difference in net cumulative time in state, and circadian amplitude was also estimated as the power in the signal by taking the ensemble average of the square of the values in the detrended, filtered time series. Since the mean of the detrended time series is zero, the latter takes the form of variance (min2).
Ultradian rhythms were analyzed after running the detrended time series through a high-pass digital Butterworth filter (cutoff period 18 h) to remove all low-frequency components, including the 24-h periodicity. To maintain correct phase, the data were run twice through the Butterworth filter, forward and in reverse. Autocorrelation was used to verify the presence of statistically significant ultradian rhythms in each of the WAKE, NREM, and REM filtered time series in each rat. The robustness of the rhythm (i.e., the rate of decay of the autocorrelation peaks) was quantified using a rhythmicity index (RI) represented by the autocorrelation coefficient of the third peak (counting the peak at zero lag) in the autocorrelogram (Levine et al., 2002). Ultradian period was measured using MESA.
A form estimate was obtained to identify average ultradian rhythmicity in each group of rats (LD and LL). The filtered data for each rat were recast in raster format (modulo 24 h in LD and modulo TAU in LL), and then corresponding time bins were averaged across days. Note that, to facilitate comparison of form estimates between LL and LD, the LL data were truncated to 7 full circadian cycles, beginning at the first circadian acrophase in the WAKE time series. In LL rats, the raw (5-sec epoch) waveforms were re-binned in circadian time (CT; 1 circadian “hour” is TAU/24); bins were 10 circadian minutes, rounded to the nearest 5 sec, yielding 144 bins per circadian cycle. Thus, bin width in LL was calculated for each rat separately as (TAU * 60 * 12)/144 epochs. The individual 24-h form estimates were then averaged across 10 animals. This process was repeated following random shuffling of the detrended and high-pass filtered waveforms.
Finally, the peak and trough values for each wave in the ultradian waveform were identified. The instantaneous (wave-by-wave) values for ultradian period and amplitude were obtained as the peak-to-peak interval (h) and peak-to-trough range (min), respectively. Rhythm amplitude was also estimated as the power (variance, min2) of the signal in the high-pass filtered time series. On each day, ultradian waves were numbered in sequence from ZT0 to ZT23.999 (CT0 to CT23.999 in LL). To provide a comparison between LL and LD of day-to-day ultradian phase variability, the phase lag between the first and fifth ultradian waves in each day (δΦ1,5) was calculated and its variability across days expressed as a standard deviation. Since the first peak in the LD time series was not always clearly defined, the above analysis of phase excluded day 1 in LD and was limited to 6 free-running circadian cycles in LL.
Results
Summary Statistics
The time spent in WAKE, NREM, and REM and the corresponding mean bout durations are shown for LD and LL groups in Figure 1. The rats in LL spent a marginally smaller proportion of total recording time (TRT) awake than rats in LD (unpaired t test, p = 0.051). Total time in NREM and REM in LL was significantly different from corresponding times in the LD group (unpaired t tests; NREM, p = 0.004; REM, p = 0.01). Time in NREM was increased at the expense of time in WAKE and REM in LL (Fig. 1A). Note that daily times in WAKE, NREM, and REM are not independent, and only the NREM LD-LL difference remains when the Holm-Sidak multiple comparisons procedure is used instead of t tests.
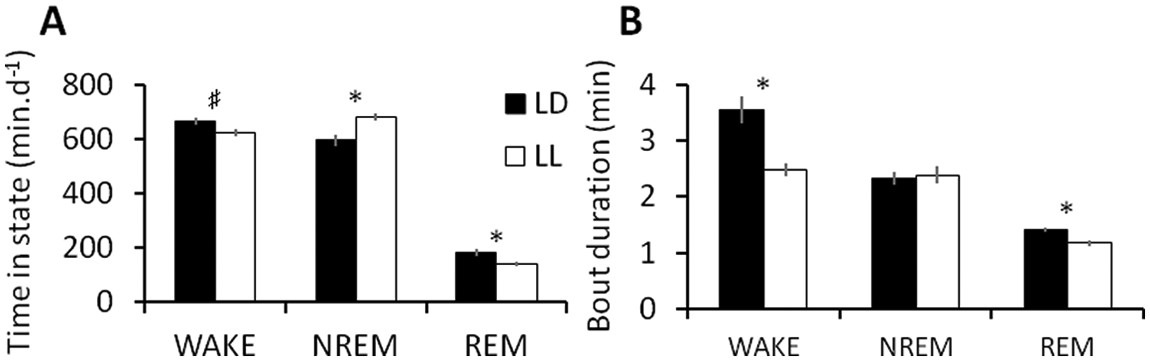
Sleep-wake behavior in rats under a 12-h:12-h light-dark cycle (LD, black) and prolonged constant light (LL, white). Bars indicate group means (means of individual animal means), and error bars indicate SEM, n = 10. (A) Time spent per day in each of wakefulness (WAKE), non–rapid eye movement sleep (NREM), and rapid eye movement sleep (REM). (B) Group mean bout durations (
Figure 1B shows that mean WAKE and REM bout durations were significantly shorter in LL than in LD (unpaired t tests; p = 0.0007 and 0.0004, respectively), whereas mean NREM bout durations were not significantly different between LD and LL groups (unpaired t test; p = 0.735).
Time-Series Analysis of Circadian Rhythms in LD and LL
Summary statistics are presented in Table 1. In LD, WAKE, NREM, and REM detrended waveforms were each shown by MESA to be dominated by circadian rhythms with period close to 24 h (strictly, under a 24-h LD cycle, these are nycthemeral rhythms, but the term circadian is used in this article for convenience). These circadian rhythms were robust, as indicated by high autocorrelation rhythmicity indices. In LD, circadian peak-trough range exhibited some cycle-to-cycle variability (within-animal coefficient of variation was 9 ± 1%, 9 ± 1%, and 15 ± 1% in WAKE, NREM, and REM, respectively), with a similar degree of variability between animals (between-animal coefficient of variation was 11%, 12%, and 14% in WAKE, NREM, and REM, respectively).
Quantitative analysis of circadian and ultradian rhythms in sleep-wake state in rats under 2 lighting regimens.
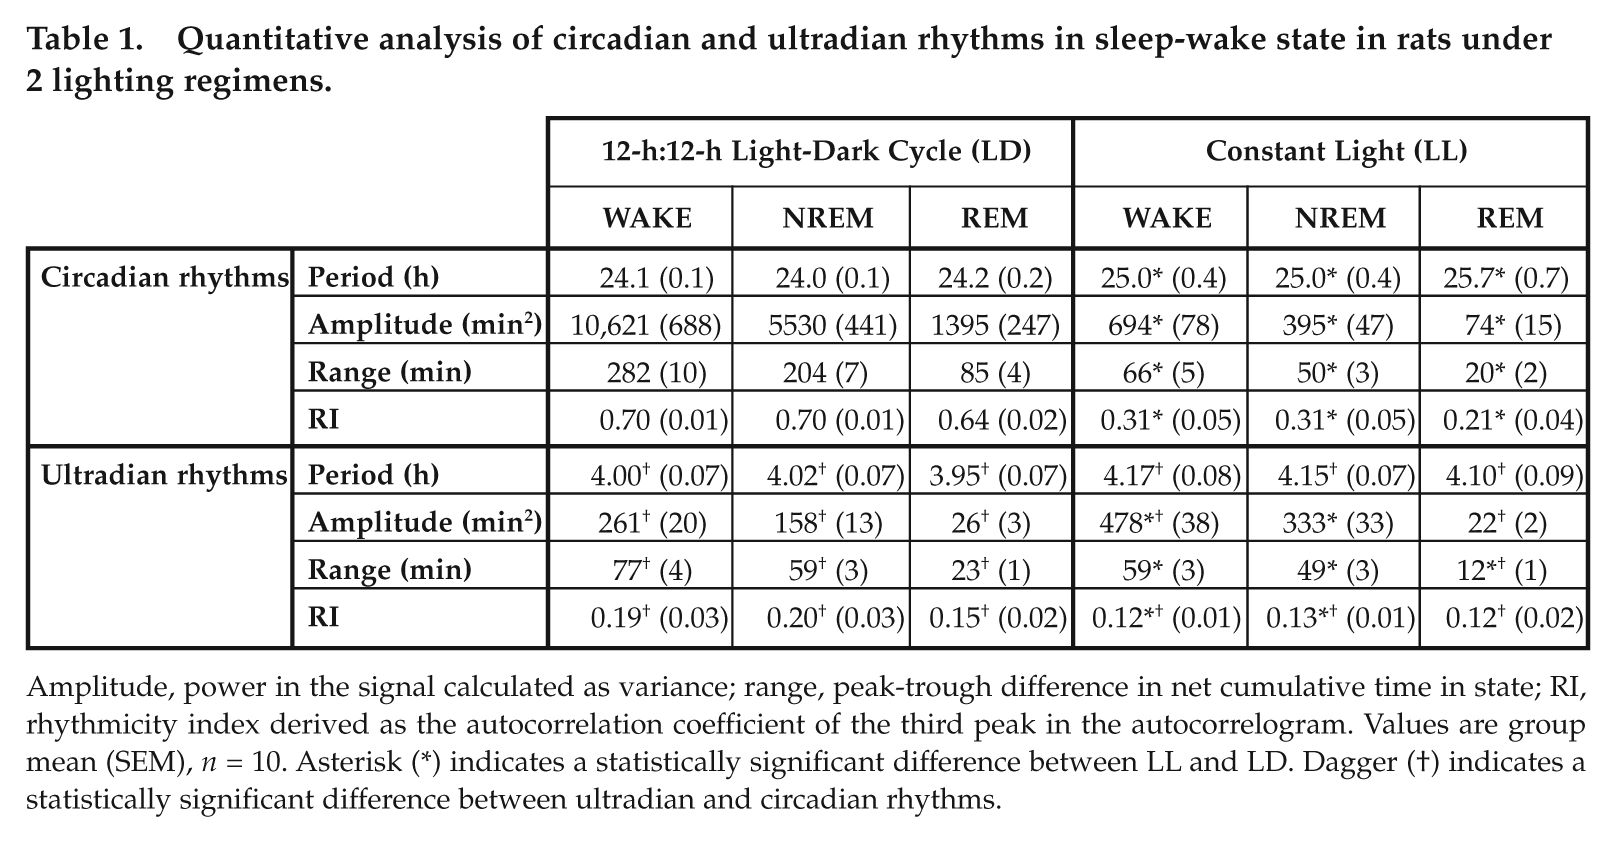
Amplitude, power in the signal calculated as variance; range, peak-trough difference in net cumulative time in state; RI, rhythmicity index derived as the autocorrelation coefficient of the third peak in the autocorrelogram. Values are group mean (SEM), n = 10. Asterisk (*) indicates a statistically significant difference between LL and LD. Dagger (†) indicates a statistically significant difference between ultradian and circadian rhythms.
In LL, WAKE, NREM, and REM detrended raw time series exhibited an irregular slow (multiday) drift in the net cumulative time in state. The presence of these infradian fluctuations, in combination with strong ultradian rhythms, tended to obscure any residual circadian rhythms in the raw signal; autocorrelation failed to identify a distinct circadian lag in any state in any of the LL rats, and MESA returned a low-amplitude broad “peak” spanning the entire circadian period range. However, further conditioning of the waveforms using a Fourier band-pass filter uncovered the presence of attenuated circadian rhythms in each of WAKE, NREM, and REM in all rats.
Autocorrelation confirmed the presence of statistically significant free-running circadian rhythms in the filtered data of the LL group. Mean peak-trough ranges of the circadian oscillations in WAKE, NREM, and REM were approximately 23% to 25% of those in LD, a difference that was highly significant (unpaired t test, p < 10–8). Circadian range was variable in LL; within-animal coefficient of variation was 45 ± 3% in each of WAKE, NREM, and REM in LL (statistically significantly greater than corresponding values in LD, all p < 10–5), and between-animal coefficient of variation was 22%, 21%, and 24% in WAKE, NREM, and REM, respectively. In each state, in LL, circadian amplitudes measured as signal variance were approximately 5% to 7% of the corresponding values in LD. In LL, the circadian autocorrelation rhythmicity indices were statistically significantly lower than the corresponding values in LD (all p < 10–6).
Time-Series Analysis of Ultradian Rhythms in LD and LL
In LD, the waveforms of net cumulative time in state were dominated by the high-amplitude circadian rhythm, which tended to distort and mask any ultradian fluctuations. However, application of a high-pass filter to the detrended waveforms to remove periodicities greater than 18 h revealed a pronounced ultradian rhythm in each of WAKE, NREM, and REM. This is illustrated for the WAKE data from a representative animal in Figure 2A (since cumulative sleep is the inverse of cumulative WAKE, the total sleep waveform can be inferred as the vertical “mirror image” of the WAKE waveform. NREM and REM data appear very similar, except that all waves are in anti-phase to WAKE). In LL, ultradian rhythms were clearly visible before and after application of the high-pass filter (see Fig. 2B for a typical example). The waveforms shown in Figure 2 provide a clear visual confirmation that the ultradian rhythms in the filtered data correspond exactly to those in the raw waveform, confirming that the phase shift introduced by the Butterworth high-pass filter is negated by a second run through the data in reverse.
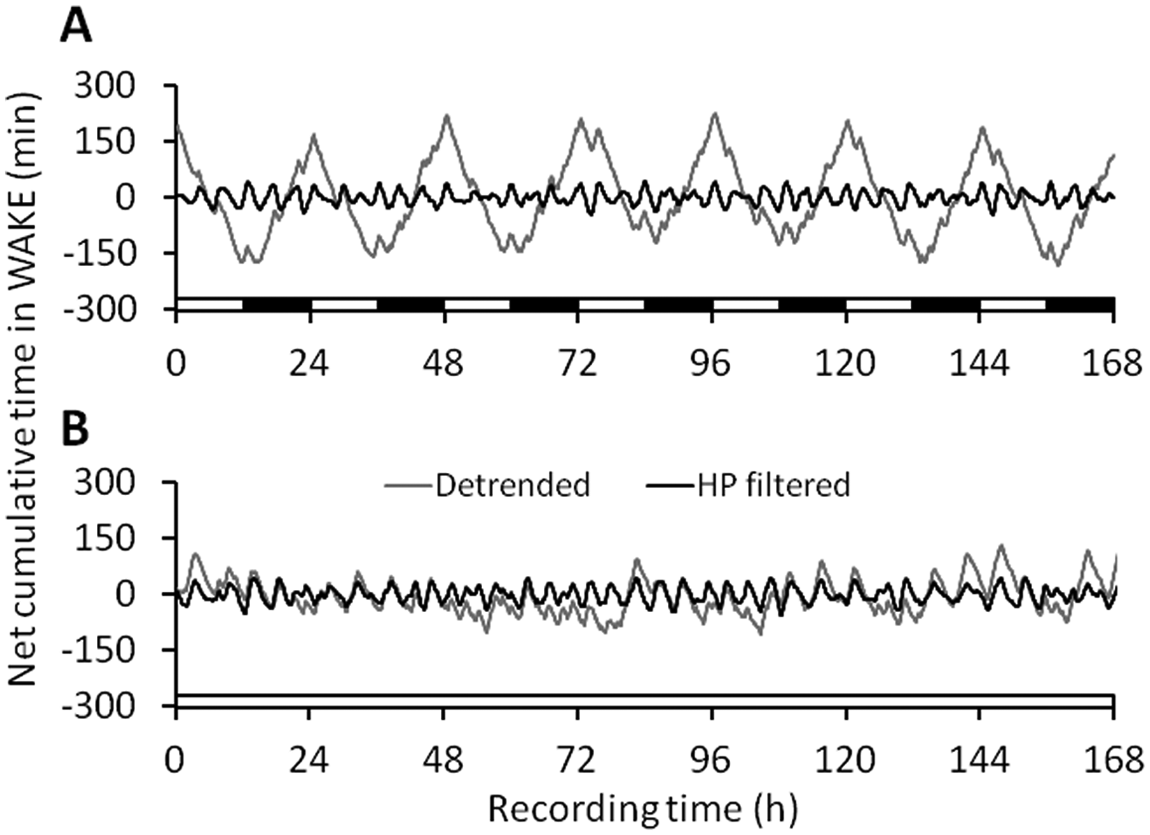
One week of data from representative animals in (A) LD and (B) LL. Net cumulative time in state is shown for WAKE. Gray lines, detrended time series; black lines, high-pass (HP) filtered (cutoff period, 18 h) time series. For continuity, the representative analyses given in Figures 4 and 5 are derived from the time series shown here. Bars on the abscissa depict light (white) and dark (black) intervals.
The group-mean form estimates of WAKE ultradian rhythms are shown for LD and LL in Figure 3, together with the corresponding data following random shuffling of the individual high-pass filtered waveforms. It is apparent that the averaged amplitudes of the ultradian cycles appear much smaller than expected from inspection of the individual filtered waveforms (cf. Fig. 2). This was also the case for the NREM and REM form estimates (data not shown) and suggests that there was substantial cancelation of the signal during the averaging procedure, implying within-animal (i.e., day-to-day) and/or between-animal variability in the period or phase of the ultradian rhythms. Form estimates in LD and LL were remarkably similar, with the exception that the first acrophase was greater in LD than in LL. In both lighting conditions, the form estimate amplitude damped out across the day.
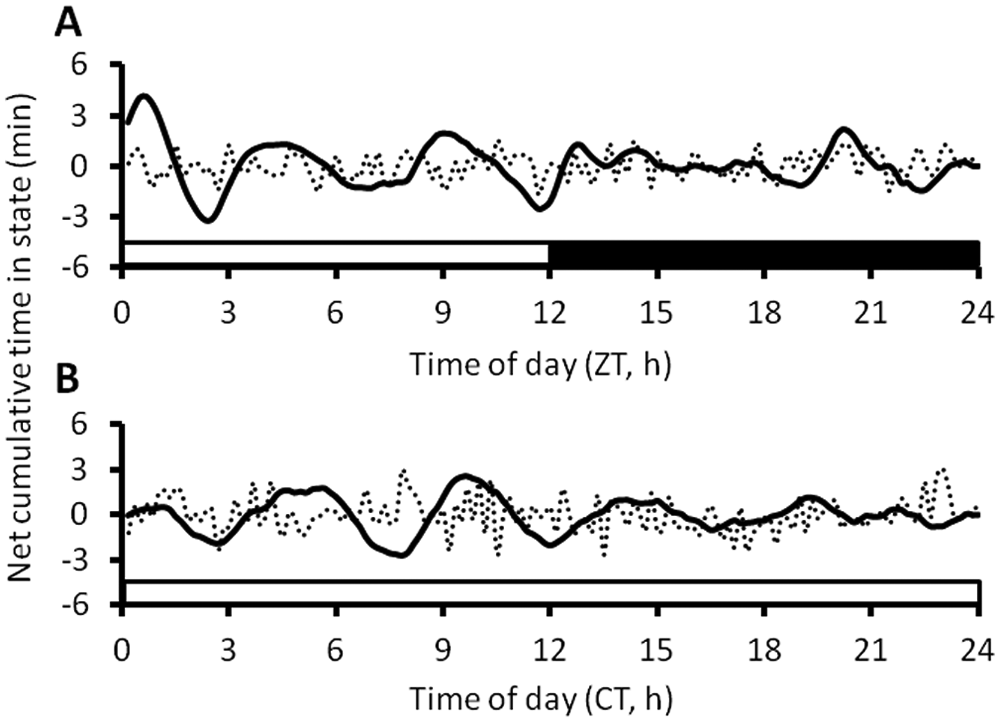
Form estimates of average cumulative time in WAKE. (A) Ten rats in a 12-h:12-h LD cycle and (B) 10 rats in constant bright light (LL). In each rat, the data were averaged across 7 days (7 circadian cycles in LL) into 144 daily time bins. The average individual waveforms were then averaged across rats to produce the final form estimates shown (solid black lines). To distinguish the form estimates from random variation, the individual detrended filtered waveforms were randomized and then recombined into a “shuffled” form estimate (dotted line). White bar, light; black bar, dark.
Autocorrelation analysis of the high-pass filtered data confirmed the presence of statistically significant ultradian rhythms in all 3 states in all 10 animals in both LD and LL. Figure 4 depicts the autocorrelograms from WAKE data in representative animals in LD (Fig. 4A) and LL (Fig. 4B). Rhythmicity index was relatively low in all cases, suggesting that the ultradian rhythms (unlike circadian rhythms) are not well synchronized over approximately 2 to 6 cycles (i.e., across a day). However, the same autocorrelograms also show that significant periodic correlations reemerge at lags greater than 24 h and persist to lags of at least 60 h or more, indicating that long-range consistency is also present. Rhythmicity index values for WAKE (p = 0.019) and NREM (p = 0.028), were lower in LL than in LD (Table 1).
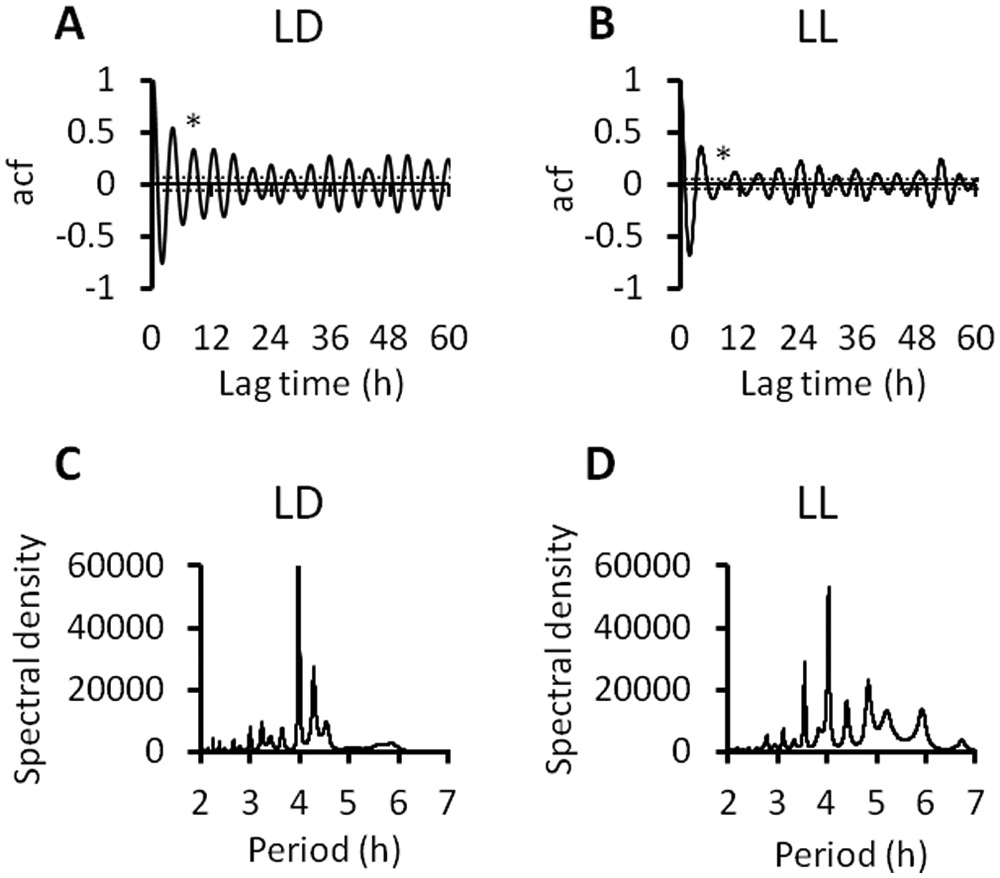
Examples of autocorrelation analysis and maximum entropy spectral analysis (MESA) of detrended filtered WAKE time series from representative animals in LD and LL. See Figure 2 for corresponding original waveforms. The autocorrelograms (A, B) illustrate the presence of sustained statistically significant rhythmicity when the autocorrelation function (acf) exceeds the 95% confidence intervals (horizontal dashed lines) calculated as 2/√n, where n is the sample size. Rhythmicity index indicates the stability of the period and is given by the acf of the third peak (asterisk). The MESA spectra (C, D) demonstrate multiple ultradian periodic components in both LD and LL.
MESA revealed, in all 3 states, in both LD and LL, that the ultradian waveforms contained multiple closely spaced periodic components over the range of periods spanning 3 to 6 h (shown for WAKE data in representative animals in Fig. 4C,D). In both LD and LL, prominent peaks occurred at approximately 4 h, 4.3 h, and 4.8 h in each of WAKE, NREM, and REM, although there was some variability between animals. We note that all rats also displayed several smaller spectral peaks in the period ranges 3-4 h and 5-6 h. These minor peaks were represented in all 3 behavioral states, although not every peak in every rat.
The multiple ultradian periods identified by MESA, together with attenuated form estimate amplitude and low autocorrelation rhythmicity index, collectively point to the possibility that the ultradian waveforms may feature variability of period over time (“quasiperiodicity”). This was substantiated by an analysis of instantaneous period (shown for WAKE data in Fig. 5), which found that the wave-by-wave period fluctuated considerably (Fig. 5A,B), without any readily discernable relation to time of day (Fig. 5C,D) or indeed any other temporal order. Autocorrelation and the Wald-Wolfowitz runs test failed to identify evidence of order within the sequence of instantaneous periods, a finding supported by first return maps, which showed an apparently random cloud structure (Fig. 5E,F).
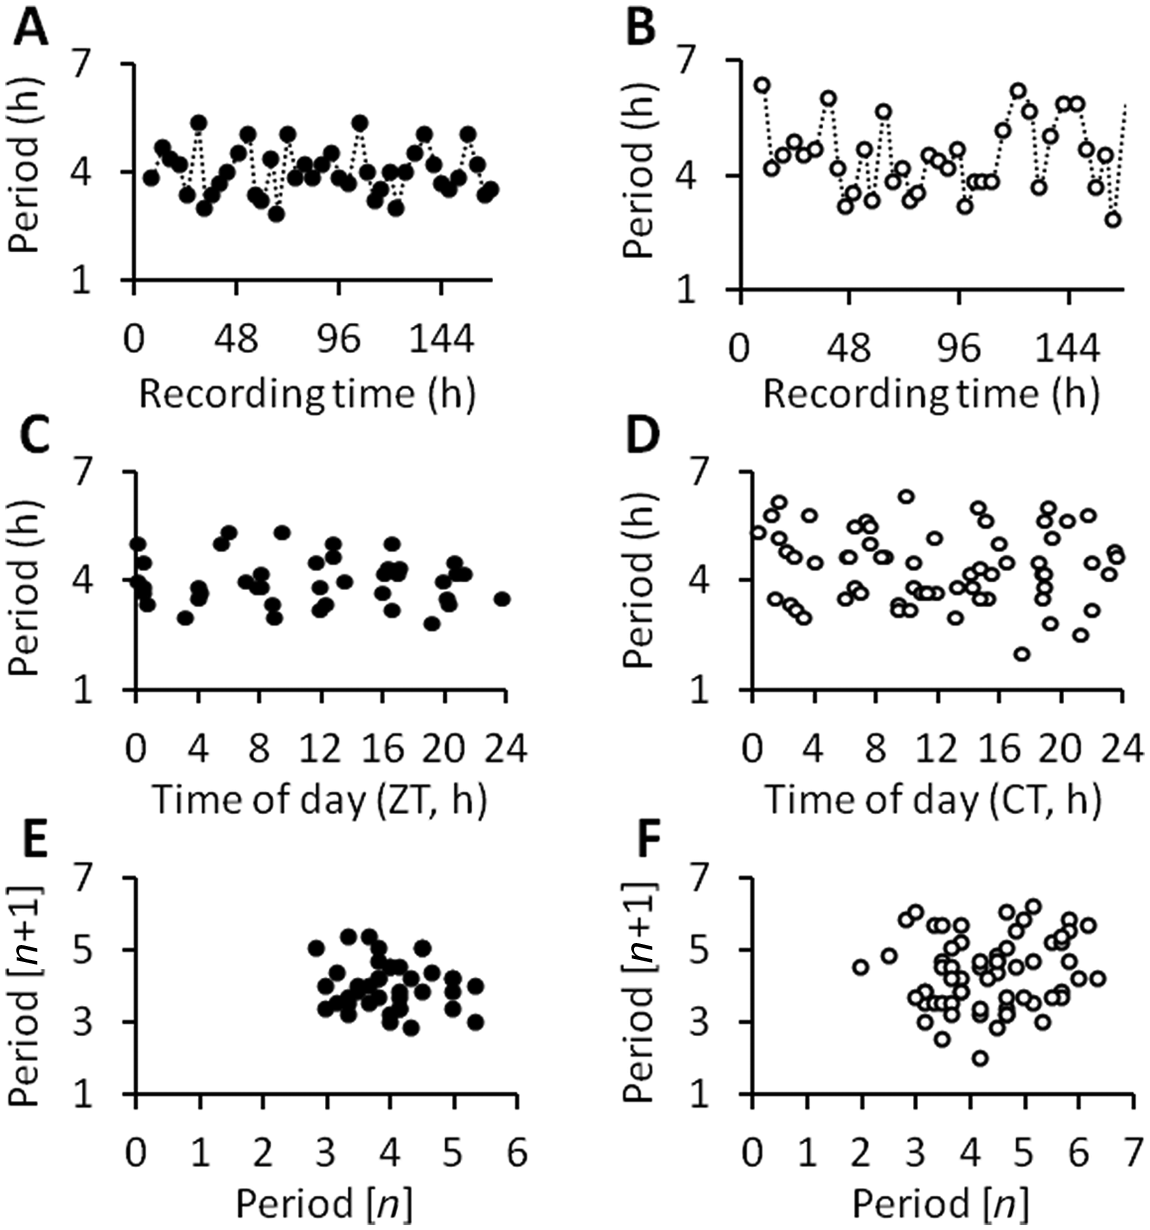
Wave-by-wave analysis of WAKE ultradian time series in representative animals in LD (panels A, C, and E, black symbols) and LL (panels B, D, and F, white symbols). See Figure 2 for the corresponding original waveforms. For each time series, peaks and troughs in the waveform were identified and “instantaneous period” was calculated as peak-to-peak interval (h). Instantaneous period is plotted as a function of time over the week of recordings in (A) LD and (B) LL. Note that LL recordings lasted 12 days, but the figure is truncated at 7 days to facilitate direct comparison with LD. (C, D) Instantaneous period is presented as a function of time of day (zeitgeber time, ZT in LD; circadian time, CT in LL). (E, F) The data are also depicted as first return maps, in which instantaneous period of wave n is plotted against the instantaneous period of the subsequent wave (n + 1). All 3 representations of the data indicate random variation of period (“quasiperiodic” behavior) around an average of approximately 4 h.
In both LD and LL, between-animal variability in mean ultradian period was relatively low, indicating consistency between animals (coefficients of variation for WAKE, NREM, and REM were 5%, 4%, and 4.7 % in LD and 6.6%, 5.9%, and 7% in LL). However, within-animal ultradian variability (i.e., variability of instantaneous period over time) was 4 to 5 times greater, with coefficients of variation (for WAKE, NREM, and REM, respectively) of 21.4 ± 0.9%, 22.6 ± 0.9%, and 24.9 ± 1.3% in LD and 23.7 ± 0.6%, 23.5 ± 0.6%, and 23.8 ± 0.4% in LL. Within-animal variability of ultradian period was statistically similar in LL and LD.
As a result of the variability in ultradian period described above, the number of ultradian waves per day varied from 4 to 8, with the majority of days containing 6 ultradian waves in both LD and LL (Fig. 6A). The Kolmogorov-Smirnov normality test found that the relative frequency distribution of number of waves per day was normally distributed (p > 0.02). Variability (expressed as standard deviation across days) of the phase lag from ultradian wave 1 to ultradian wave 5 (δΦ1.5) averaged 1.87 h across 10 rats in LD and 2.04 h across 10 rats in LL (Fig. 6B). By this measure, ultradian phase coherence was poor; the timing of waves varied substantially from day to day, a characteristic that was not significantly different between LD and LL (unpaired t test; p = 0.43).
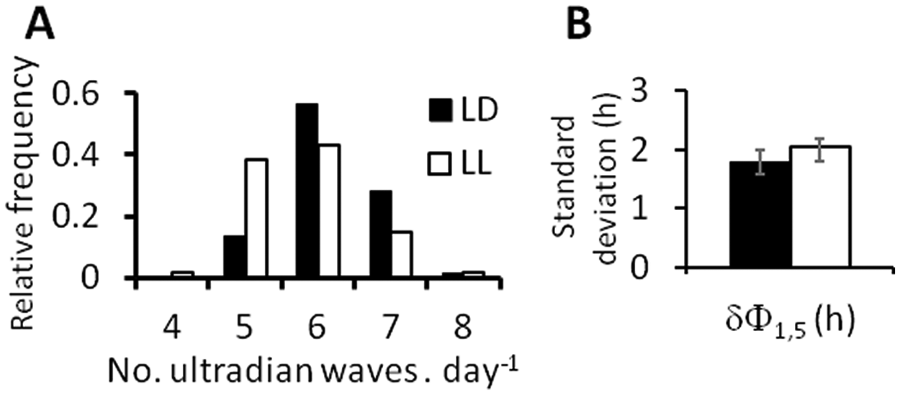
Daily variability of ultradian rhythmicity in a 12-h:12-h light:dark cycle (LD; black bars) and in continuous light (LL; white bars). (A) The proportion of days (relative frequency over 6 days in 10 rats per group) containing the number of ultradian WAKE peaks indicated on the abscissa. (B) Day-to-day coherence of ultradian phase, estimated as the (group mean
In LD, the peak-trough ranges of the ultradian waves were approximately 27% to 29% of the corresponding circadian ranges, whereas in LL, ultradian ranges were 60% to 98% of the corresponding circadian ranges (Table 1). Mean peak-trough ranges of ultradian rhythms in LL were statistically significantly lower than those in LD for all 3 behavioral states (Table 1; unpaired t tests; p = 0.0008, p = 0.0297, and p < 10–5 in WAKE, NREM, and REM, respectively). Ultradian peak-trough ranges were highly variable over time in LD (mean within-animal coefficients of variation were 41 ± 2%, 45 ± 2%, and 47 ± 1% in WAKE, NREM, and REM, respectively), and this within-animal variability was 2 to 3 times greater than the between-animal variability (coefficients of variation = 14%, 16%, and 2% in WAKE, NREM, and REM, respectively). Likewise, ultradian ranges were variable over time in LL (mean within-animal coefficients of variation = 32 ± 1%, 36 ± 1%, and 39 ± 1% in WAKE, NREM, and REM, respectively), and this within-animal variability was over 2 times greater than the between-animal variability (coefficient of variation = 14%, 18%, and 17% in WAKE, NREM, and REM, respectively). In all 3 behavioral states, within-animal variability of the ultradian range was significantly lower in LL than in LD (unpaired t test; all p < 0.01), whereas between-animal variability was similar in both lighting conditions.
There were no significant differences between L and D in ultradian amplitudes, measured as the power (variance) in the signals (paired t tests; p > 0.05). Ultradian amplitudes were significantly higher in LL than in LD for WAKE (unpaired t test; p = 0.0002) and NREM (p = 0.0003) but not different between LL and LD for REM (p = 0.298). This contradicts the corresponding conclusion reached on the basis of ultradian peak-trough range (see Table 1) and suggests a difference between LD and LL in the “shape” of the waveform. Ultradian period was not significantly correlated with ultradian amplitude (power) in LD and LL (unpaired t tests; p > 0.05).
Discussion
This study has found that the sleep-wake patterns in rats are dynamically complex and contain a mix of relatively stationary (circadian) and nonstationary (ultradian) periodic rhythms. As expected, in rats entrained to an LD cycle, the expression of WAKE, NREM, and REM was each clearly periodic on a 24-h timescale, while in those subjected to constant bright light, the circadian periodicity was free-running and strongly attenuated. All rats displayed ultradian rhythms, which we find have a quasiperiodic rhythm with period varying randomly around an average value near 4 h in both LD and LL.
The total quantities and mean bout durations of sleep and wakefulness in rats maintained in LD were within the ranges reported previously (Endo et al., 1997; Franken et al., 1991a, 1991b, 1995; Trachsel et al., 1986), confirming that the rats studied here were typical of the species under standard laboratory conditions. In comparison to LD, the rats maintained in prolonged LL spent a marginally greater proportion of TRT in sleep, amounting to an average of 42 min extra sleep per day. This additional sleep comprised 84 min of additional NREM, at the expense of 42 min less WAKE and 42 min less REM per day. These results concur with previous findings of reduced wakefulness in rats in LL (Borbely and Neuhaus, 1978). It should be acknowledged that “standard laboratory conditions” represent a highly artificial environment, and it is possible that this may give rise to abnormal sleep-wake behavior. Unfortunately, there are no data available by which to directly evaluate this possibility in rats. Factors such as food availability (Silver and Balsam, 2010), nutritional status (Saarikko and Hanski, 1990), risk of predation (Lesku et al., 2008), and variations in ambient temperature (Kumar et al., 2009) all have significant effects on activity patterns and sleep in small mammals, but it remains unknown whether these natural stimuli have any impact on ultradian behavioral rhythms. The present analysis is predicated on the assumption that exclusion of extraneous stimuli will reveal the fundamental (unmodulated) behavior of the sleep-wake regulatory system.
In rats entrained to a 12-h:12-h LD cycle, circadian rhythms in sleep and wakefulness were expected and clearly evident. This 24-h rhythm was associated with ultradian fluctuations of much smaller amplitude. In contrast, we anticipated, on the basis of previously published research (Albers et al., 1981; Buttner and Wollnik, 1984; Depres-Brummer et al., 1995; Eastman and Rechtschaffen, 1983; Honma and Hiroshige, 1978), that prolonged exposure to bright light would eliminate circadian rhythms. Preliminary examination of unfiltered data seemed to confirm this expectation, an impression that was reinforced by nonsignificant autocorrelograms and low-amplitude, broad peaks in MESA spectra of raw waveforms. However, application of an appropriate filtering procedure showed that in no case was the circadian rhythm abolished completely. The residual circadian periods varied among rats from 22.9 to 27.4 h, indicating that the animals were free-running and not entrained by an unintended nonphotic stimulus. These findings raise the possibility that past claims of circadian arrhythmicity in prolonged LL may have been erroneous, due to the lack of appropriate filtering and the use of relatively insensitive methods of analysis, such as the χ2 periodogram (Dowse and Ringo, 1989).
High-pass filtering of the data series revealed clear ultradian rhythmicity in both LD and LL. Overall, the differences between ultradian dynamics in LD and LL were trivial in comparison to the striking similarities, which is remarkable given the profound differences in the concurrent circadian modulation of the signal. This is in agreement with previous studies (Albers et al., 1981; Buttner and Wollnik, 1984; Honma and Hiroshige, 1978) and suggests that severe suppression of circadian rhythms by constant bright light has only a small effect on the expression of ultradian rhythms in WAKE, NREM, and REM. This is consistent with the hypothesis that ultradian rhythms are generated by a mechanism that is independent of (or at least only weakly influenced by) the circadian clock. However, one notable study (Wollnik and Turek, 1989) reported that complete surgical ablation of the suprachiasmatic nuclei (SCN) was followed by complete elimination of both circadian and ultradian rhythms in wheel-running activity. Furthermore, in the latter study, partial ablation of the SCN resulted in proportional attenuation of circadian and ultradian rhythms (Wollnik and Turek, 1989). In contrast, we did not find a significant correlation between circadian and ultradian amplitudes in either LD or LL. The reasons for these differences between studies are not clear, but one possibility concerns differences in experimental techniques used, which may yield differences in the efficacy of circadian rhythm suppression. Complete SCN lesions resulted in elimination of circadian rhythms (Wollnik and Turek, 1989), whereas we have found that low-amplitude circadian rhythms remained in prolonged LL. A second possibility may relate to the different analytical methods used; the χ2 periodogram and harmonic spectral analysis techniques used in the prior study (Wollnik and Turek, 1989) are not well suited to analysis of nonstationary or noisy data (Dowse and Ringo, 1989) and may have failed to identify residual ultradian rhythms. A third possibility may concern their use of wheel-running behavior as a measure of ultradian output. As discussed further below, this specific activity may not accurately reflect ultradian rhythms in wakefulness.
In the present study, the filtered data were first examined as form estimates, which showed that the averaged amplitudes and periods of the ultradian waves were greater than random fluctuations. This simple approach confirmed that a periodic ultradian rhythm is present in both LD and LL and is sufficiently robust that it survives the averaging procedure. Nevertheless, the severe attenuation of the averaged rhythm amplitude suggests that, in contrast to circadian rhythms, ultradian rhythms are not well synchronized. Overall, between-animal differences were too small to account for the profound attenuation of the form estimates, suggesting that ultradian rhythms exhibit substantial within-animal variability over time.
In LD, the form estimates suggest that ultradian rhythms in sleep-wake state are more prominent in L than in D and appear to damp out over the course of the day. One interpretation of this is that there is a difference between L and D in the expression of ultradian rhythms. Differences between light and dark have been reported for ultradian rhythms in locomotor activity in certain strains of mice (Dowse et al., 2010) and rats (Buttner and Wollnik, 1984; Wollnik et al., 1987) and for EEG variance (proportional to slow-wave activity) in rats (Sei et al., 1991). However, in this study, visual inspection of the raw time series (Fig. 2A), supported by a wave-by-wave analysis of ultradian range, and the ultradian amplitude estimated as variance of the waveforms fail to support the hypothesis that ultradian rhythms differ systematically between light and dark. Several studies have described a trimodal locomotor activity rhythm (i.e., 4-h period rhythm with high amplitude) in the dark phase that is usually not apparent in the light phase (Buttner and Wollnik, 1982, 1984; Wollnik et al., 1987; Wollnik and Turek, 1989) in rats entrained to an LD cycle. This appears to support the impression gained from form estimates and contradict our finding of WAKE ultradian rhythms throughout the circadian cycle. However, we suggest that, while specific activities such as wheel running are clearly WAKE-dependent behaviors, such measures are not necessarily a good surrogate for WAKE per se in analyses of state dynamics. WAKE-dependent behavioral activities may be adjustable within the constraints imposed by the dynamics of WAKE itself, either by changes in timing of a particular activity within wakefulness or changes in the intensity (amplitude) of the activity. Thus, the apparent elimination of ultradian rhythms in wheel-running activity following SCN ablation discussed earlier (Wollnik and Turek, 1989) may not necessarily imply elimination of ultradian rhythms in the sleep-wake state and likely reflect the profound reduction in activity levels that occurred in lesioned animals and perhaps a reorganization of the timing of the residual wheel running within episodes of wakefulness.
Close examination of the individual animal waveforms using autocorrelation, MESA, and wave-by-wave analysis found ultradian period to be unstable (nonstationary), suggesting that the underlying cause of gradual attenuation of the form estimate from ZT0 to ZT24 is progressive desynchrony of ultradian waves across the day. The relatively high amplitude of the form estimate near ZT0 suggests greater day-to-day synchrony at this time, implying that a zeitgeber at or near ZT0 may entrain ultradian rhythms. Under LD conditions, the putative zeitgeber may include an endogenous signal from the circadian timing system, a direct (“masking”) effect of the lights-on stimulus and/or the daily disturbance of the animals associated with technical activities. The form estimates of rats in LL, like those described above for animals in LD, featured larger amplitudes of the averaged waves during the early part of the subjective day (Fig. 3B). Since the additional potential zeitgebers that were present at ZT0 in the LD animals (lights on and brief disturbance) were absent at CT0 in the LL group, this strengthens the suggestion that the endogenous circadian timing system may have an entraining action on ultradian rhythms at or near CT0. Daily entrainment would explain the unexpected finding that peak autocorrelation functions (which also serve as a measure of phase coherence) tended to attenuate rapidly across lags up to approximately 24 h but then reemerge and remain statistically significant to lags of 60 h or more (Fig. 4). This pattern could conceivably arise if ultradian period was variable but phase was reset at approximately 24-h intervals.
As mentioned, the ultradian rhythms in the sleep-wake state continued unabated across the light-dark cycle, reflecting the well-known “polyphasic” sleep patterns of rats. Superimposed on this is a pronounced circadian rhythm in LD, which implies that ultradian period is relatively constant despite different fractions of total time spent in a given state at different times of day. For example, in the rising phase of the circadian rhythm of net cumulative time in WAKE (i.e., at night), the proportion of time spent awake is greater in both the rising and falling phases of the ultradian cycles than it is in the corresponding ultradian phases during daytime. This suggests that the circadian and ultradian oscillations may arise from separate additive mechanisms. It further suggests that ultradian rhythms may be robust (but not necessarily unresponsive) to the multitude of additional endogenous and exogenous stimuli that would be expected to influence sleep-wake behavior in the short term.
The preceding discussion highlights interactions between ultradian and circadian rhythms. An unresolved question concerns whether these interactions reflect an underlying causal connection between the mechanisms regulating rhythmicity in the circadian and ultradian ranges. If so, what form does this take? One viewpoint is that the circadian clock in the SCN may send a timing signal to the mechanism generating ultradian rhythms to, for example, modulate the phase of the first ultradian wave of the day. This is perhaps the conventional view of an autonomous circadian pacemaker serving to modulate other oscillators in a “top-down” fashion (Bass and Takahashi, 2010). Alternatively, it has been suggested that ultradian rhythms may constitute the “frequency standard” for the circadian oscillator, the converse causal relationship (Dowse, 2008; Power et al., 1995). Unfortunately, the present data are not well suited to discriminating these alternatives, and indeed, if causality is bidirectional, then discrimination may not be possible or meaningful.
Perspective
Circadian and ultradian rhythms are expressions of time-dependent changes in state microarchitecture and therefore must reflect time-varying regulatory mechanisms. The origin of endogenous circadian oscillations and the influence of exogenous LD cycles are well studied and partially understood (see Bass and Takahashi, 2010, for a review), but the mechanism underlying ultradian rhythms remains a mystery. The quasiperiodic characteristic of sleep-wake ultradian rhythms cannot be explained as an oscillator with added noise (Achermann and Borbely, 1990; Diniz Behn et al., 2007) or as the summed output of multiple oscillators with different periods (Wollnik and Dohler, 1986). Both of these modeling approaches produce a time series with noisy or variable amplitude, but the fundamental periodicities remain stable and appear in the waveform in a regular repeat. In the ultradian rhythms of the rat, we have shown that it is the ultradian period itself that varies randomly over time. Thus, a new or modified approach to modeling sleep regulation may be needed to account for quasiperiodic rhythms in the behavioral state. We suggest that ultradian rhythms may hold important clues to the dynamic interplay between different mechanisms regulating the sleep-wake state in mammals.
Footnotes
Acknowledgements
Supported by a Discovery Grant (R.S.), undergraduate scholarship (S.F.), and doctoral scholarship (A.M.C.) from the Natural Sciences and Engineering Research Council of Canada.
Conflict of Interest Statement
The author(s) declared no potential conflicts of interest with respect to the research, authorship, and/or publication of this article.